 Yu Su1,2
 Chi Peng
- 1Engineering Technology Research Institute, PetroChina Southwest Oil & Gas Field Company, Chengdu, Sichuan, China
- 2National Key Laboratory of Oil and Gas Reservoir Geology and Exploitation, Southwest Petroleum University, Chengdu, Sichuan, China
A gas kick is one of the most dangerous phenomena during petroleum drilling operations, which, if not detected and handled in time, can result in hazardous blowout. To better understand and describe the behavior of gas kicks, this study presents a novel transient flow model by taking wellbore–formation coupling and gas solubility into account during drilling operations. Then, the main flow parameters such as gas void fraction, mixture velocity, and mixture density are analyzed in cases that do or do not consider the coupling effects. Furthermore, the flow behaviors for both oil-based mud (OBM) and water-based mud (WBM) are investigated for comparison. Finally, the reliable indicators of monitoring gas kicks in OBM and WBM drilling are discussed. The results indicate that the gas void fraction increases after an initial decrease with the increased wellbore depth with coupling effects, while it constantly decreases with the increase in the well depth with non-coupling effects. The variation in bottom-hole pressure (BHP) with gas kick time is similar in both cases. Both the mixture velocity and mixture density change more significantly in the middle–lower part of the wellbore compared with non-coupling effects. In particular, the performances of the surface response to a gas kick are quite different compared to the WBM under similar conditions in OBM drilling, and the potentially dangerous gas kick is easily neglected. More importantly, it is confirmed that pit gain is more beneficial for detecting gas kicks compared with the annulus return flow rate (ARFR) for WBM, but neither of these indicators is suitable for gas kick detection in OBM drilling. The results identify pit gain as a reliable indicator for detecting gas kicks in WBM drilling, while real-time bottom-hole pressure (BHP) monitoring is emphasized for OBM drilling under low influx rates.
1 Introduction
In recent years, onshore oil exploration and exploitation have progressed from the shallow layer to the deep layer, and even to the ultra-deep layer (Lei et al., 2021; Zeng et al., 2022; Wang et al., 2022). Unfortunately, with the increasingly complex underground situations in the process of drilling, there are many problems associated with drilling safety, such as gas kicks. When a well is drilled into an abnormally pressured gas reservoir, a sudden influx of gas can occur, causing the two-phase flow to appear in the wellbore annulus. This condition can be very dangerous due to the gas’s rapid expansion near the wellhead. If it is not detected in a timely manner and handled properly, it will lead to a well control problem and a safety disaster, including personal injuries among rig personnel (Yin et al., 2015; Xu et al., 2018; Ju et al., 2022).
During the drilling process, drilling fluids are classified into two types, namely, water-based mud (WBM) and oil-based mud (OBM). Traditionally, OBM is widely used to drill deep, high-temperature wells because of its good rheological characteristics (Growcock et al., 2003; Amani et al., 2012; Kumar et al., 2020). However, one key issue related to use of OBM is how to detect in a timely manner the formation gas that enters the wellbore and dissolves quickly in OBM. Typically, the gas kick detection methods that determine whether the formation gas has invaded into the wellbore are based on measuring the pit gain and the delta flow rate (the difference between inlet and outlet fluids) (Anfinsen and Rommetveit, 1992; Santos et al., 2005; Ali et al., 2013; Fu et al., 2015; Tang et al., 2019; Hargreaves et al., 2021). If there is no kick, the delta flow rate should be close to 0, and the volume of the mud pit is constant. In WBM drilling, during a gas kick, the invaded gas will displace the drilling fluid, resulting in a continuous increase in pit gain. However, in OBM drilling, there are real issues related to the high gas solubility in the oil phase. The OBM can completely dissolve the invaded gas under high temperatures and pressures. In this case, there will be no obvious changes in the flow rate or pit gain, which causes huge difficulty in detecting gas kicks. Notably, the dissolved gas will be released from the OBM after the variation in the temperature and pressure is observed as it is circulated toward the wellhead. Generally, the evolution of the dissolved gas is observed near the wellhead, leading to severe well control problems.
At present, great efforts have been made to establish mathematic models for simulating the behavior of a gas kick occurring in WBM drilling. According to the limited experimental data reported in the literature, the empirical correlations for computing flow parameter variation in the annulus have been provided, but they are not able to provide reliable guidance on well control. The first steady model for predicting the change in the wellbore pressure after gas kick was proposed by Leblanc and Lewis (1968), which could not be applied to transient flow. Subsequently, some researchers also proposed studies on deciding the key parameters for calculating hydraulic pressure loss, such as liquid hold-up (Beggs and Brill, 1973; Mukherjee and Brill, 1985) and gas rise velocity (Johnson and Cooper, 1993; Yan et al., 2021). Based on the conservation of mass, momentum, and energy, the first unsteady two-phase flow model was developed by Nickens (1987). Similar unsteady models have been established after Nickens (Santos and Bourgoyne, 1989; Nunes et al., 2002; Avelar et al., 2009; Evje, 2011; Choi et al., 2013; Meng et al., 2015). Meanwhile, much attention has been paid to the effects of well geometry on gas kick development, including vertical, directional, and horizontal wells. In addition, the influences of drilling parameters and reservoir properties were investigated. However, some of the existing gas kick simulators assume that the invaded gas is insoluble in the drilling mud. As stated earlier, the solution behavior of gases needs to be considered. It is worth mentioning that well control problems caused by gas solubility in OBM were first studied by O’Brien (Meng, 1981).
According to Hoberock and Stanbery’s (1981) model, Thomas et al. (1984) analyzed the effects of kick on warning signs such as pit gain and concluded that pit gain was the most reliable indicator for detecting gas kicks in both OBM and WBM. A similar conclusion was obtained by Ekrann and Rommetveit (1985), Rommetveit and Olsen (1989), and Van Slyke and Huang (1990). White and Walton (1990) investigated gas kicks in OBM and WBM by adopting the drift-flux model (DFM), and the reliability of simulation results was validated by field and experimental data. O’Bryan et al. (1988) proposed empirical correlations for predicting the solubility of CH4 and CO2 in WBM and OBM separately by conducting numerous experiments. Similarly, Silva et al. (2004) focused on obtaining methane solubility in both n-paraffin and ester. For riserless drilling, Lima et al. (1999) developed models to simulate fluid flow and heat transfer when circulating a synthetic-based mud (SBM). Their models, however, were of steady-state type. He et al. (2015); He at al. (2017) investigated the solubility of H2S in WBM to improve managed pressure drilling (MPD) well control. The wellbore temperature profile was assumed to be linearly proportional to the well depth. Several researchers (Sun et al., 2017; Yin et al., 2017) studied the effects of gas dissolution on gas kick migration in deep water drilling. Furthermore, some previous works on gas solubility mainly focused on experiments with different OBM components (O’Bryan and Bourgoyne, 1989), gases (Matthews, 1984; O’Bryan and Bourgoyne, 1987), temperatures, and pressures (Silva et al., 2004; Monteiro et al., 2010; Flatabø et al., 2015). As a result, methods for estimating the gas solubility in a given OBM were developed (Feng et al., 2016). Wei and Chen (2021) presented a numerical scheme for simulating gas-influx behavior in wells equipped with MPD systems, which was based on the DFM and solved the control equations using the differential algebraic equation (DAE) approach. The authors validated their approach using measured data from a test well drilled with WBM. Manikonda et al. (2021) put forward a thermodynamic solubility model for simulating gas kicks by use of a mechanistic approach. Their model used pressure and temperature data to estimate the mole fraction of gas components in the liquid phase and accounted for the effects of gas solubility. Based on the machine learning approaches, gas kick detection models were proposed by Yang et al. (2019), Abbas et al. (2019), Nhat et al. (2020), Muojeke et al. (2020), Osarogiagbon et al. (2020), and Yin H. et al. (2022). The common ground in these studies is to create models according to abundant pilot-scale rig data or lab-scale experimental data, but its main difference lies in the methods used to create a model and the scenarios to which the model is applied to. Based on their findings, the long short-term memory (LSTM) recurrent neural network (RNN) shows better performance in early detection of gas kicks (Olamigoke and James, 2022). Li et al. (2022) built a novel method based on the propagation characteristics of downhole pressure waves for timely detection of gas kicks. For fractured carbonate reservoirs, Yin Q. S. et al. (2022) proposed an identification method for determining kick types based on the dynamic time warping algorithm and the two-phase flow model. They investigated flow behavior characteristics in cases of underbalanced pressure and gravity displacement. In addition, Tang et al. (2022) used CFD simulation and simplified models to study the gravity displacement gas kick in fractured carbonate reservoirs. They pointed that wellhead backpressure may effectively control its development. Khan et al. (2022) discussed the importance of determining the magnitude of a kick event in well design and execution and compared the efficiency of the single bubble model with that of the dynamic multiphase model in determining kick tolerance. They found that WBM has the capacity of allowing more kick tolerance than that of SBM.
After reviewing the previous works, it is found that the available well control models perform well for predicting and monitoring gas kicks during the WMB drilling process, but there is still an important drawback that needs to be solved with regard to OWM drilling. Most previous flow models ignored gas solubility effects when encountering gas kicks in a deep well drilled with OBM, which may delay the surface responses including pit gain and annulus return flow rate. In addition, the wellbore–formation coupling effect was ignored in previous research studies. Therefore, the key annulus flow parameters, such as gas void fraction that determines wellbore pressure, mixture density, and mixture velocity distributions, cannot be accurately determined by using previous models.
In this study, a transient mathematical flow model that accounts for one-dimensional flow while taking wellbore–formation coupling and gas solubility into consideration is established for adequately capturing dynamics flow behavior. Then, the flow parameters were examined with and without considering the effect of wellbore–formation coupling. Furthermore, OBM and WBM are compared regarding their corresponding gas void faction, pit gain, and ARFR and BHP profile. Finally, the discussions and comparisons between the reliable indicators of monitoring gas kicks in OBM and WBM drilling are illustrated.
2 Physical models
Normally, the drilling fluid is pumped from the mud pit into the drill string and moves down. At the bottom hole, it flows through nozzles on the bit and then circulates upward of the annulus. Figures 1a,b show the physical models of the gas–liquid distribution in the wellbore after encountering gas kicks during OBM and WBM drilling, respectively. The flowing system in the annulus is divided into two parts in OBM drilling (as shown in Figure 1a): the two-phase flow occurs in the annulus near the wellhead, while a single-phase flow exists in the rest of the wellbore. The reason is that the temperature and pressure vary with well depth and can lead to a wide range of changes in gas solubility in the OBM. As shown in Figure 1b, since the gas lolubility in WBM is assumed to be zero, a two-phase flow takes palce right after the invaded gas enters the wellbore. As it moves upward to the wellhead, the entire wellbore annulus is occupied by a two-phase flow. In addition, the wellbore pressure decreases continuously during the gas kick, leading to an increase in the negative pressure difference, which, in turn, resulted in greater gas kick size. This phenomenon is known as the wellbore–formation coupling effect, and it makes flow behavior more complex. To establish the model, the following assumptions are made:
(1) In the same cross-section, both free gas and drilling fluid are at the same temperature and pressure.
(2) Gas solubility in the WBM is ignorable, and influx gas contains only methane. There is no gas entering the drill string when a gas kick occurs.
(3) It is assumed that gas instantaneously dissolves into or evolves from OBM. The released gas from the drilling fluid exists as a separate gas phase.
(4) It is assumed that the fluid flow in the drill string and annular space is treated as one-dimensional axial flow, without considering the solid phase.
(5) It is assumed that gas kicks only occur at the wellbore bottom hole, and there is no lost circulation in the well during drilling operations.
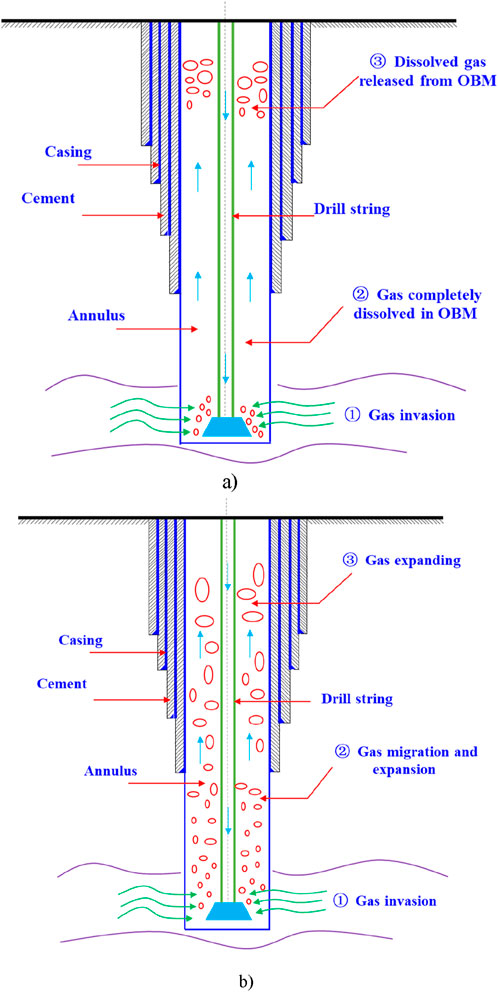
Figure 1. Physical models of the gas kick drilled with OBM and WBM: (a) OBM and (b) WBM.
3s Mathematical model
As previously mentioned, the flow in the wellbore has become very complex when gas kicks occur. The drift-flux model (DFM) has been proven to be most accurate in characterizing the two-phase flow behavior (Rommetveit, 1989). More detailed information is included in Zuber and Findlay (1965). In general, the hydrodynamic equations including the conservations of mass and momentum are established as follows.
Conservation of gas-phase mass:
Note that the term qg in Equation 1 can be obtained by using Tang and Ouyang’s (2010) model in a gas source case, although it is 0 without a source of gas invasion. The term
It should be noted that the fluid that invades the wellbore contains only methane. Hence, the conservation of liquid-phase mass is expressed as Equation 2:
Conservation of total momentum is expressed as Equation 3:
The drift–flux correlation is the common rule to determine the relative velocity between moving phases, as shown in Equation 4 (Zuber and Findlay, 1965). The previous literature suggests that two key parameters, namely, the distribution coefficient
where
where
Notably, when the formation gas dissolves into or evolves out from OBM, its density will change, which is calculated by the Equation 6 (Rommetvelt et al., 1989):
The frictional pressure loss for single-phase flow case is given by Equation 7 (Fan et al., 2014)
Normally, different kinds of rheology models correspond to different kinds of friction factor
The void fractions between moving phases satisfy the relationship shown in Equation 8:
The mixture density can be calculated using Equation 9
O’Bryan et al.’s (1988) model is used to calculate the solubility of methane in OBM, which is expressed as follows:
Note that the wellbore temperature T in Equation 10 can be obtained by using Yang et al.’s (2015) model.
4 Model validation
The proposed model is verified by comparing its results with those of Sun et al. (2019) and Yin et al.’s 2017) model. Detailed parameters are obtained from the previous literature, as shown in Table 1 (Sun et al., 2019). The pit gain increase against the time after the gas kick results predicted by these three models mentioned above is depicted, respectively, and compared in Figure 2. For the WBM, the result of the proposed model matches with that of Sun’s model and Yin’s model, with errors less than 5%, as shown in Figure 2a. Hence, it is revealed that the proposed model precisely predicts the multi-phase flow behavior in WBM after gas kicks. On the other hand, for OBM, the proposed model closely aligns with Yin’s model but differs significantly from Sun’s model. There are three reasons why the results differ between these three models in the OBM scenario. The first reason is that different calculation criteria for gas solubility in OBM are used in different models. The proposed model adopts the calculation induced by O’Bryan, while Yin’s model uses a classical equation of state, and Sun’s model applies a calibrated equation of state. Second, the wellbore temperature field calculation methods for different models vary. The transient temperature field model presented by Yang is incorporated in the proposed model, but Yin’s model utilizes their own temperature field model, and Sun’s adopts the temperature field model of Hasan and Kabir. In addition, the proposed model and the Yin’s model neglect the volume factor variation of the OBM in the wellbore due to the dissolution of the formation gas influx. As a result, the pit gain remains 0 before the dissolved gas comes out of the OBM. On the contrary, however, Sun’s model considers the volume factor variation of the OBM in the wellbore due to the dissolution of the formation gas influx. Consequently, the volume of the OBM in the annulus changes as the formation gas dissolves in the OBM, and the pit gain is positive since the start of the gas kick and increases with the gas kick time.
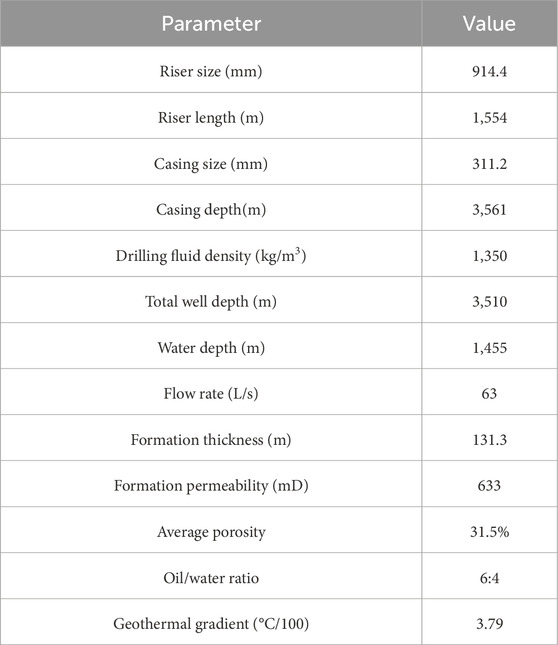
Table 1. Detailed calculation parameters.
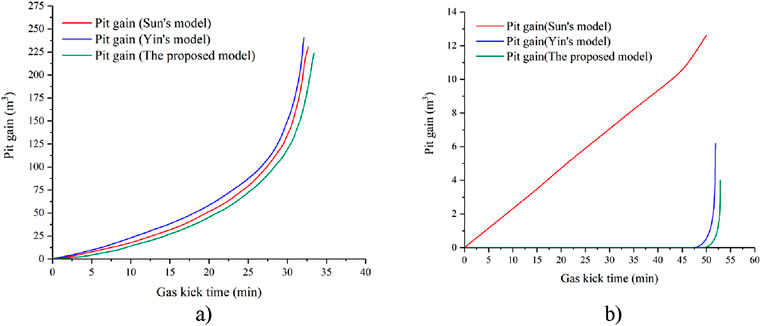
Figure 2. Pit gain comparison of Sun et al. (2019), Yin et al. (2017), and proposed models. (a) WBM. (b) OBM.
The calibration equation in Sun’s model was not adopted for OBM due to its primary focus on synthetic-based muds (SBM) under deepwater conditions, which differ significantly from the solubility behavior in OBM. Instead, the O’Bryan correlation was used as it explicitly accounts for methane solubility in the oil phase and provides stable, convergent predictions under OBM drilling conditions. Validation results demonstrate that Sun’s model predicts pit gain inconsistently for OBM, while the proposed model aligns with the expected surface responses, highlighting its suitability for OBM applications.
5 Results
To analyze flow behavior after encountering, a vertical well is taken as an example. The wellbore and formation data are shown in Tables 2 and 3, respectively. The preparation of the oil-based drilling fluid system is given as follows: white oil + 3%–5% organic clay + 5% primary emulsifier + 3% co-emulsifier + 2% wetting agent + 3% calcium oxide (CaO) + 25% calcium chloride solution + 5% filter loss reducer. The actual range of the gas phase solubility in OBM is 0 (at the wellhead) to 536.302 m3/m3 (at the bottom hole). It is assumed that gas kicks occurred in the Φ215.9-mm open hole at the well depth of 6,430 m, where the formation pressure is 81.88 MPa.
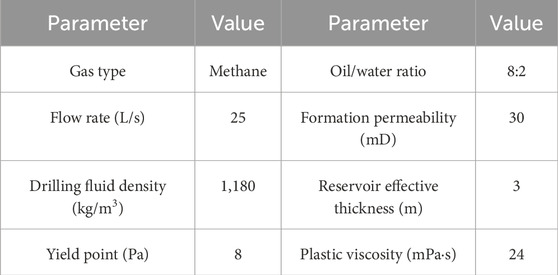
Table 2. Basic parameters for multiphase flow behavior simulation in OBM drilling.
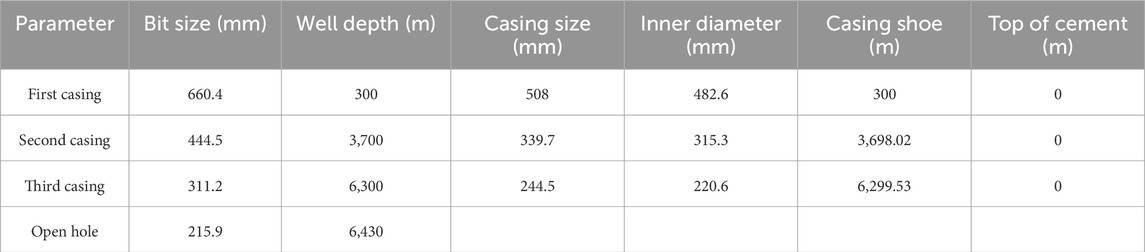
Table 3. Basic parameters of the wellbore.
5.1 Effects of wellbore–formation coupling on flow behavior
5.1.1 Effect of wellbore–formation coupling on gas void fraction
The comparison of gas void fraction distribution with and without wellbore–formation coupling is shown in Figure 3. It constantly decreases with increasing well depth without the consideration of wellbore–formation coupling (blue line). The changes in the gas void fraction near the wellhead are more obvious than those near the bottom hole. The influx gas flow rate remains constant, as shown in Figure 4. As the drilling fluid and invaded gas are circulated up the annulus, both local temperature and pressure decrease, while the gas expands and occupies more space. This leads to an increase in the gas void fraction. However, its increase is not apparent in the middle–lower part of the wellbore, for the gas expansion is suppressed by the high hydrostatic pressure. Conversely, with the wellbore–formation coupling, the gas void fraction profile takes on the C-shape. That is, the void fraction decreases first and then increases with the increase in the well depth. It can be attributed to the following reasons: 1) as the kick develops, BHP continuously decreases. The differential pressure further increases, which causes an increase in the influx gas flow rate at the bottom hole. 2) At the bottom part of the wellbore, the concentration of the kick is high, so is the gas void fraction. As the invaded gas moves upward, at the middle part, the gas is dispersed or dissolved in mud with a larger volume. Consequently, a higher gas void fraction is visible in the lower part of the wellbore compared to the middle part of the wellbore. 3) When the gas arrives at a shallow depth in the annulus where the hydrostatic pressure is low enough to allow for rapid gas expansion, the gas void fraction increases sharply near the wellhead.
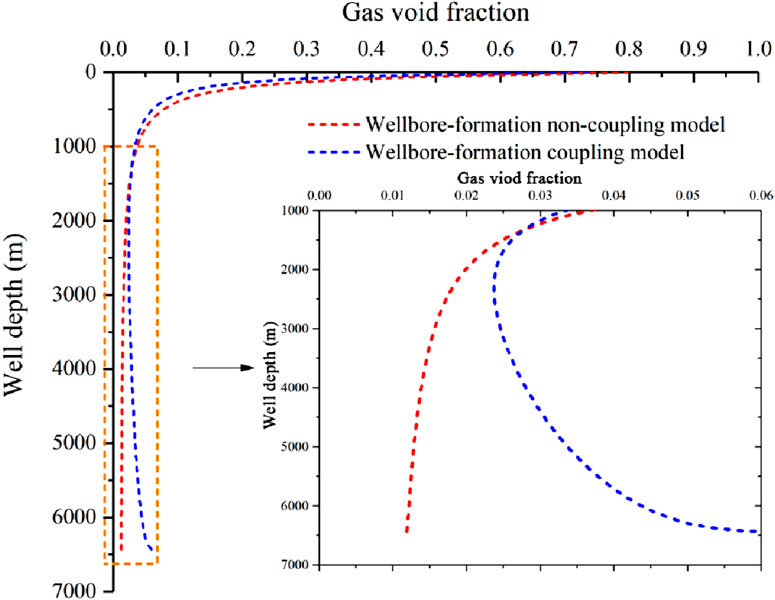
Figure 3. Comparison of the gas void fraction distribution with and without wellbore–formation coupling.
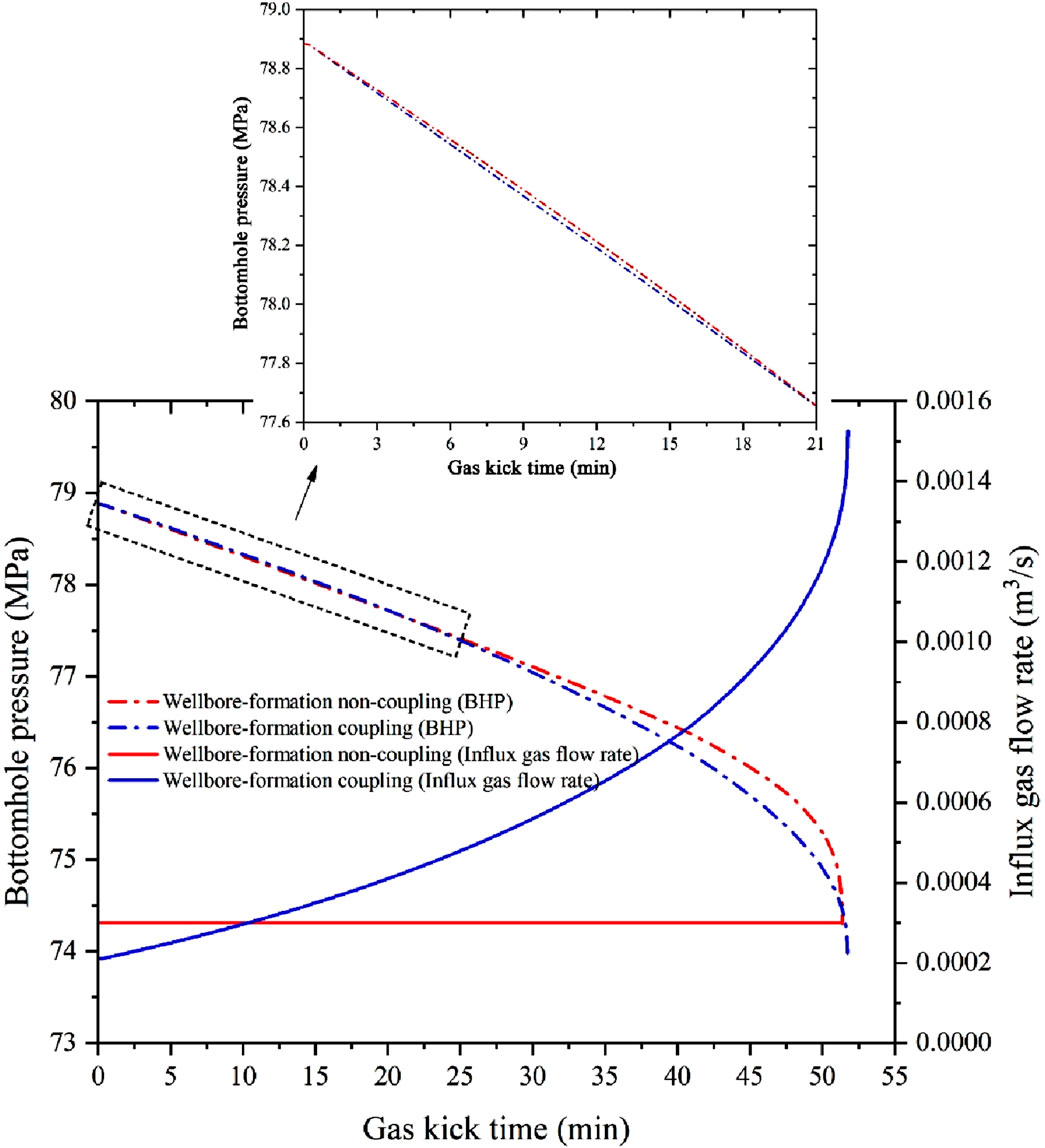
Figure 4. Comparison of BHP with and without wellbore–formation coupling.
5.1.2 Effect of wellbore–formation coupling on the BHP
The comparison of the BHP with and without wellbore–formation coupling is shown in Figure 4. During the process of gas kicks, the changes in BHP are similar in two cases. The BHP linearly decreases at a slow rate for the first 30 min, then drops faster because the gas moves upward to a location several hundred meters away from the wellhead, and then expands sharply. In the first 20.3 min after the gas kick, the BHP calculated by the wellbore–formation non-coupling model is slightly lower than that calculated by the wellbore–formation coupling model. After that, the opposite trend happens. The reasons are as follows: 1) gas is not able to expand freely because of the high external hydrostatic pressure, and there is a slight decrease in the fluid mixture density in the annulus. Hence, the BHP reduction is not obvious. Once the gas moves close to the wellhead, its volume increases dramatically and the reduction in the fluid mixture density in the annulus is significant (as shown in Figure 7), leading to a larger decrease in BHP. 2) The influx gas flow rate within 10 min in the coupling case is less than that without coupling, causing the BHP to be lower. However, the pressure difference between these two cases is not obvious, with a maximum of 0.02 MPa. However, the influx gas flow rate size in both cases exhibited an opposite trend after 10 min. In addition, the longer the gas kick time, the greater the difference between the BHP and formation pressure, and the higher the influx gas flow rate (as shown in Figure 4). It means that more formation gas enters the wellbore in unit time, and the upward movement of the invasion gas is accompanied by gas expansion. Therefore, the reduction in the former was more than that of the latter. There is a pressure difference of 0.38 MPa between these two cases. It needs to be clarified that the present results are intended to demonstrate a qualitative difference between the cases with and without formation–wellbore coupling.
5.1.3 Effect of wellbore–formation coupling on pit gain
The comparison of pit gain with and without wellbore–formation coupling is shown in Figure 5. The change laws of the pit gain under coupling and non-coupling conditions are similar. It is found that the pit gain in both cases increases exponentially with gas kick time. There is a significant change in the pit gain in the beginning, and the closer the gas to the wellhead, the faster the increase in the pit gain. In addition, its value obtained by the non-coupling model is slightly higher than that of the coupling model before 20 min. After that, its changes followed opposite trends. Because the invaded gas replaces the space of drilling mud in the annulus, there is a change in the pit gain. It means that the pit gain is associated with an influx gas flow rate. As mentioned previously, the influx gas flow rate within 10 min with the consideration of wellbore–formation coupling is less than that without coupling. Hence, the latter occupies a larger portion of drilling mud in the annulus than that of the former, resulting in a larger pit gain for the latter. Afterward, the influx gas flow rate of the former is larger than the given constant value. It means that the pit gain in the coupling model increases faster than that in the non-coupling model. Therefore, the difference between the pit gains of coupling and non-coupling models becomes larger than 0 at some point and continues to increase with gas kick time.
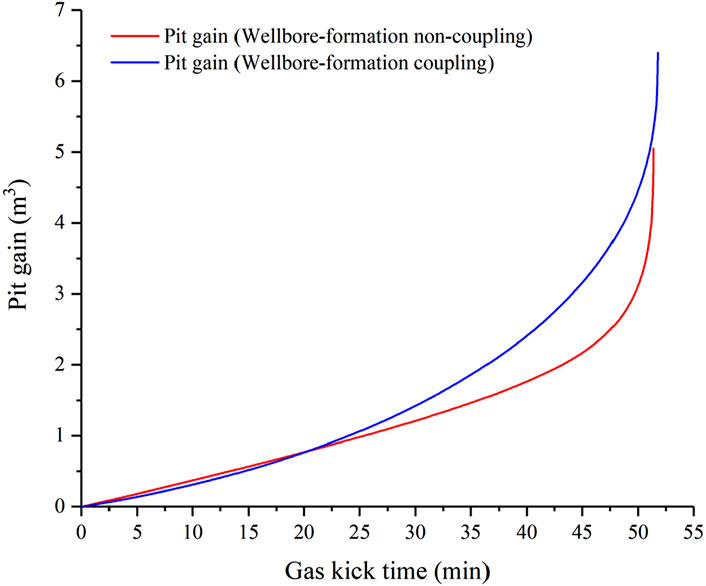
Figure 5. Comparison of pit gain with and without wellbore–formation coupling.
5.1.4 Effect of wellbore–formation coupling on mixture velocity and mixture density
The comparisons of mixture velocity and mixture density distribution with and without wellbore–formation coupling are shown in Figure 6. As shown in Figures 6a,b, it can be observed that there is a sudden change in the mixture velocity for both cases at depths of 6,300 and 1470 m in the wellbore. The mixture velocity is defined as the volume flow rate divided by the annular cross-section area. Hence, variations in the annulus space can cause the mixture velocity to change drastically. Meanwhile, the mixture velocity near the wellhead undergoes significant changes, while no obvious change appears near the bottom hole for both models. Furthermore, at the same well depth apart from the upper region, the mixture velocity varies significantly with consideration of the coupling effect, while it remains nearly unchanged without considering the coupling effect. The reason is that the mixture velocity and gas void fraction are positively correlated (as shown in Equation (5)). Moreover, the contribution of the gas superficial velocity for mixture velocity is larger than that of the liquid superficial velocity. As shown in Figures 6C,D, the mixture density distribution law is opposite to that of the mixture velocity. Because the drilling fluid density is much greater than gas density, it contributes the most to mixture density. Therefore, the mixture density is negatively correlated with the gas void fraction.
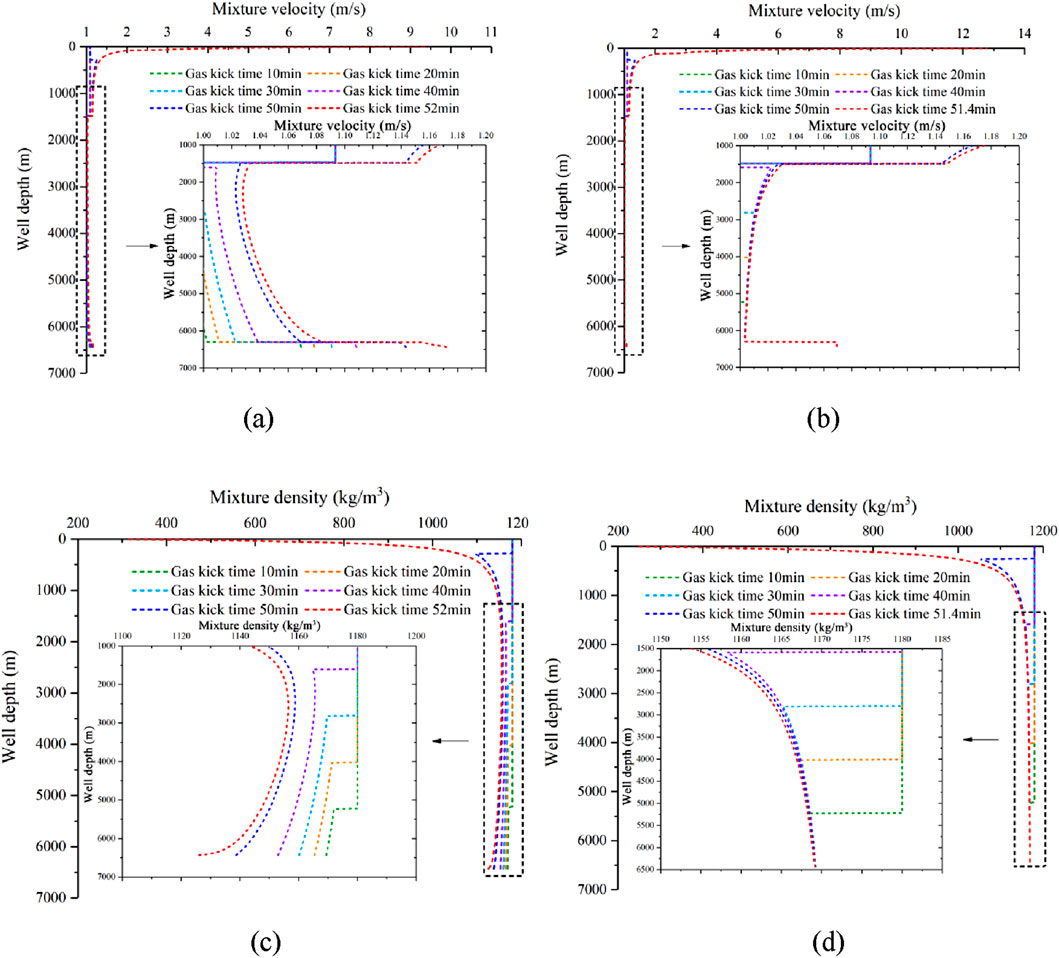
Figure 6. Comparison between cases with and without wellbore–formation coupling. (a) Mixture velocity distribution–coupling model. (b) Mixture velocity distribution–non-coupling model. (c) Mixture density distribution–coupling model. (d) Mixture density distribution–non-coupling model.
5.2 Effects of gas solubility on flow behavior
5.2.1 Effect of gas solubility on gas void fraction
The comparison of the gas void fraction distribution in OBM drilling and WBM drilling is given in Figure 7. It is found that the responses for the two drilling fluids are significantly different. In OBM drilling, before the gas kick time of 99 min, the gas void fraction is 0 on account of the influx of gas complete dissolution into OBM. However, the gas void fraction can be observed near the wellhead. Because both the local fluid pressure and temperature sharply decrease near the wellhead, gas solubility decreases remarkably. Hence, the dissolved gas will emerge approximately 180 m below the wellhead. In WBM drilling, the invaded gas will continue to migrate upward and is accompanied by expansion (as shown in Figure 7b). Hence, two-phase flow occurs in the annulus, and then its position will be gradually pushed to the wellhead, which makes the gas phase exists at any position in the wellbore annulus. As long as there is free gas at any depth in the annulus, the gas void fraction at that depth is greater than 0.
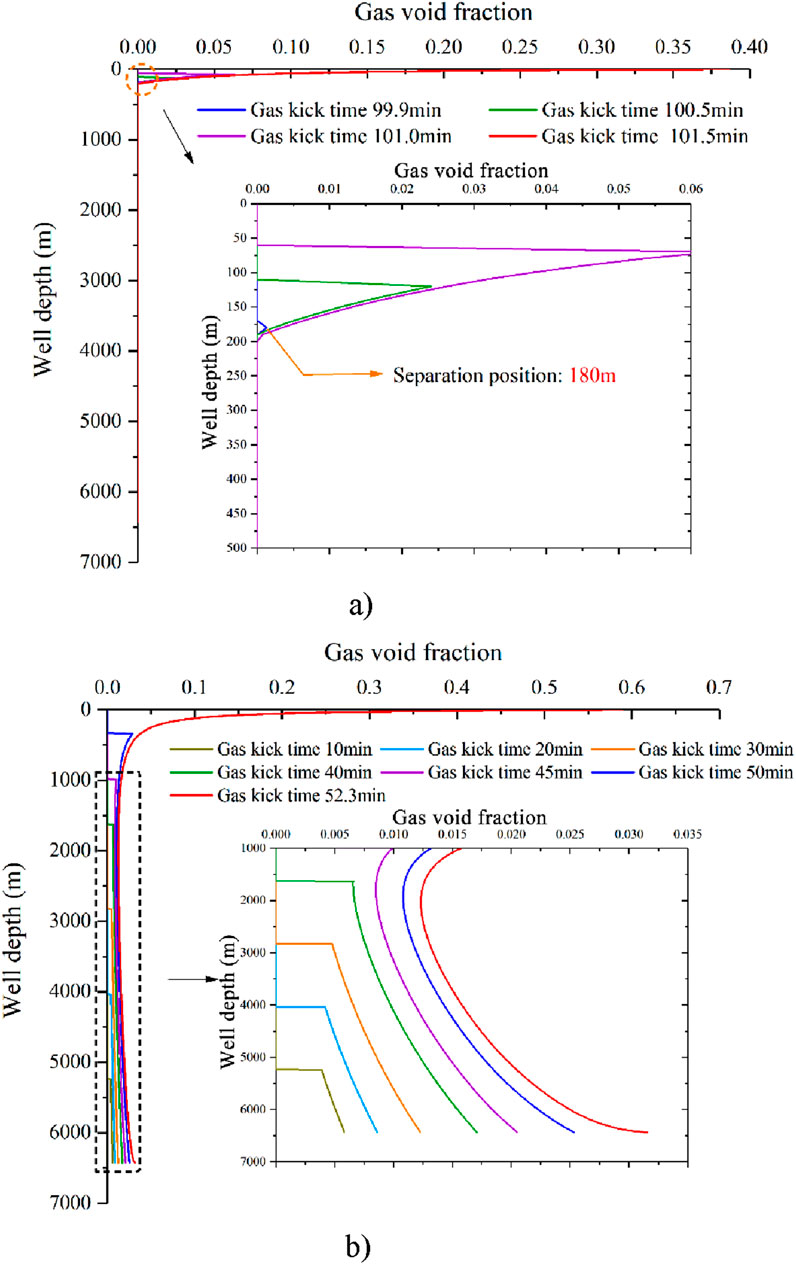
Figure 7. Comparison of gas void fraction distribution for the differential pressure of 2.0 MPa: (a) OBM and (b) WBM.
Figure 8 shows the gas distribution for the differential pressure of 3.0 MPa. The position that the dissolved gas begins to escape from OBM is deeper. The free gas occurs approximately 210 m in advance with a differential pressure of 3.0 MPa compared to the differential pressure of 2.0 MPa (Figure 7a). An increase in the differential pressure to 3.0 MPa can result in a higher gas invasion rate, and the density reduction in the fluid mixture will be worse. Therefore, as the pressure decreases, the dissolved gas easily escapes from OBM. The position of the gas separation is deeper, and the free gas occurs approximately 3.1 min earlier. It can be interpreted that the solubility of methane in OBM is limited under the given conditions; once the gas kick size exceeds the threshold level, a portion of the invaded gas dissolves into the OBM, and then the remaining gas exists in the form of free gas.
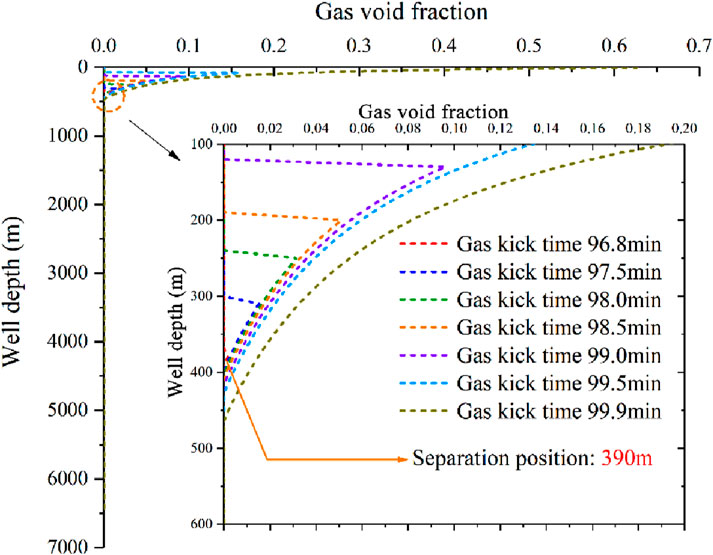
Figure 8. Gas void fraction distribution for the differential pressure of 3.0 MPa.
5.2.2 Effect of gas solubility on pit gain
Pit gain might indicate underground complexity during drilling. If a leakage occurs, pit gain will decrease. On the other hand, if a kick occurs, pit gain will increase. Because the overall space in the annulus is constant, gas (methane) replaces the space of drilling mud and pushes the drilling mud above it after entering the annulus. Therefore, additional drilling mud will flow out (the returned mud flow rate is higher than the inlet mud flow rate). The pit gain is calculated by the overall gas volume in the annulus (the conservation of the annulus volume). The variations in the pit gain for OBM and WBM drillings are compared and shown in Figure 9. In WBM drilling, the pit gain exponentially increases with time. At the beginning of the gas kick, only less pit gain is observed due to the small expansion of the free gas near the bottom hole. As the free gas is circulated toward the surface, it will rapidly expand, leading to a noticeable increase in the pit gain. In OBM drilling, the pit gain for OBM is much smaller than that for WBM. The change in the pit gain does not appear until the gas kick time of 99 min. All the gas is dissolved in OBM, and no gas expansion occurs as OBM is circulated up in the annulus. After OBM moves up near the wellhead, dissolved gas quickly escapes and expands, producing a sudden increase in gain. Especially, the free gas is quite near the wellhead (approximately 180 m as shown in Figure 6a), which means that the gas kick can be very difficult to control due to significant and unexpected gas expansion. Worse still, if circulation continues without shut-in, the free gas will push the drilling fluid out of the wellhead, which could cause a catastrophic blowout.
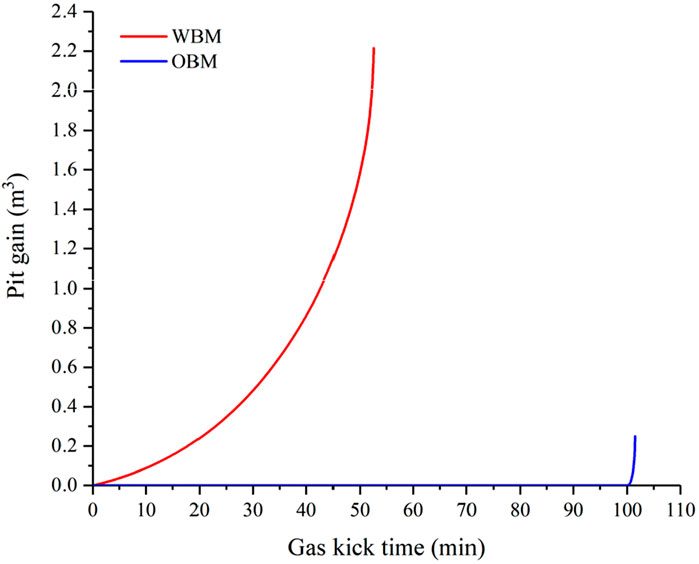
Figure 9. Variations in pit gain for OBM and WBM.
5.2.3 Effect of gas solubility on ARFR
The ARFR, defined as the outlet flow rate from the annulus, is another surface indicator of a gas kick. The variations of ARFRs for OBM and WBM are compared and shown in Figure 10. The ARFR increases from 25 L/s to 44.6 L/s for WBM, while for OBM, it increases from 25 L/s to 33.4 L/s. In OBM drilling, gas remains dissolved until it is circulated to near the wellhead, causing the ARFR to remain almost unchanged at 25 L/s. Consequently, the drillers cannot be able to recognize a gas kick according to the difference between inlet and outlet flow rates. When the dissolved gas is released at shallow depths near the wellhead, the ARFR begins to increase. In WBM drilling, the change in ARFR happens earlier and is more obvious. It can be attributed to the fact that gas migration and expansion always exist due to no dissolution of gas in the WBM case. Remarkably, the ARFR in WBM drilling increases at a lower rate in the beginning as the gas expansion is less significant. After that, the rapid expansion of free gas results in higher increases in the annular return flow rate for both OBM and WBM.
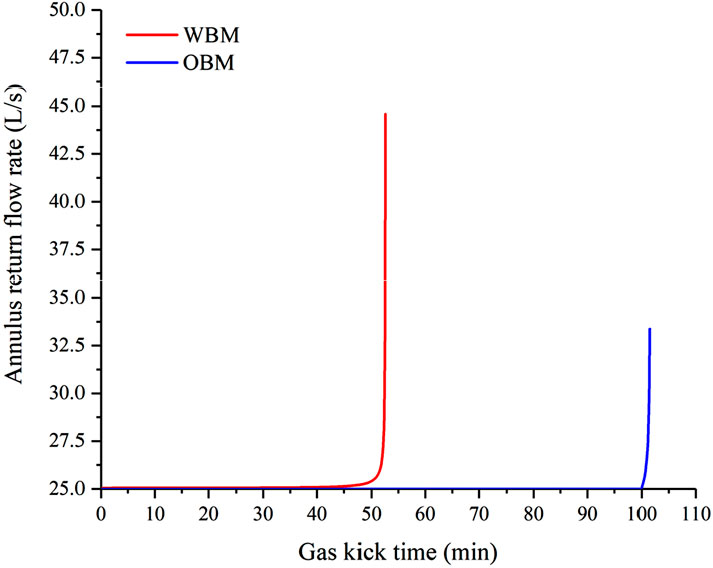
Figure 10. Variations of ARFR for OBM and WBM.
Despite their limitations in OBM scenarios, pit gain and ARFR are analyzed in this study due to their established use in field operations and their importance as benchmarks for surface detection methods. The results underscore the challenges posed by gas solubility as these indicators fail to provide timely warnings under low influx rates. However, at higher influx rates or during advanced stages of a gas kick, pit gain and ARFR can still offer late-stage insights, particularly near the wellhead. These findings pave the way for promoting real-time BHP monitoring as a more reliable alternative for early detection in OBM drilling.
5.2.4 Effect of gas solubility on BHP
The variations in BHP for OBM and WBM are compared and shown in Figure 11. In OBM drilling, there is a less noticeable reduction in BHP until OBM is circulated near the surface. In this case, the dissolved formation gas in OBM slightly reduces the density of the drilling fluid, which results in a small decrease in the BHP. Near the wellhead, the dissolved gas emerges out of OBM and rapidly expands, which causes a rapid decrease in the BHP, whereas in WBM, the drilling fluid is displaced by free gas entering the annulus from the formation, thus creating a reduction in the hydrostatic pressure and a corresponding decrease in the BHP. Note that when the gas arrives at the surface, the BHP decreases from 78.9 MPa to 75.9 MPa for WBM, while for OBM, there is very little decrease in the BHP (from 78.9 MPa to 77.58 MPa). As discussed above, the solubility of the gas in OBM is the key to understanding this phenomenon, and it is consistent with the results shown in Figure 7a.
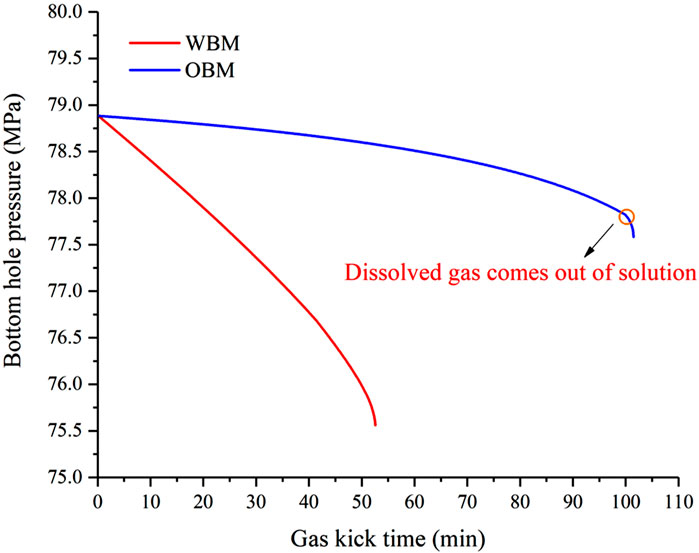
Figure 11. Variations of BHP for OBM and WBM.
The quantification reveals that at a low influx rate (2.0 MPa differential pressure), surface responses are delayed by approximately 99 min due to gas solubility effects in OBM. As the influx rate increases (4.0 MPa differential pressure), this delay reduces to 54 min, as depicted in Figure 8. These results highlight the critical role of solubility in delaying surface responses, underscoring the necessity of integrating downhole pressure monitoring for early detection of gas kicks in OBM drilling.
5.3 Comparisons of gas kick indicators
It is widely acknowledged that both pit gain and annulus return flow rate are observable ground indicators for a gas kick. The typical criterion for a gas kick is that the pit gain increase be 1.6 m3 or the change in the annulus return flow rate be higher than 10% (White and Walton, 1990). The comparison of different indicators for the differential pressure of 4.0 MPa is shown in Figure 12a. The gas kick time is 35.8 min when the pit gain reaches the warning level in WBM drilling. When the pit gain increases from 0 to 1.6 m3, the gas kick time is 99.8 min in OBM drilling. Using the criterion of the outlet flow rate for gas kick detection, it can be seen that this level is reached after 50.6 min for WBM compared to 99.3 min in the OBM case, as shown in Figure 12a. The time for gas kick detection is seriously lagging using pit gain or ARFR as the kick indicator for OBM. Both pit gain and ARFR hardly change in the early stage of kick during OBM drilling. A very small increase in the pit gain or annulus return flow rate can be indicative of a very serious kick. Furthermore, it suggests that the pit gain is a more reliable indicator of a gas kick in WBM.
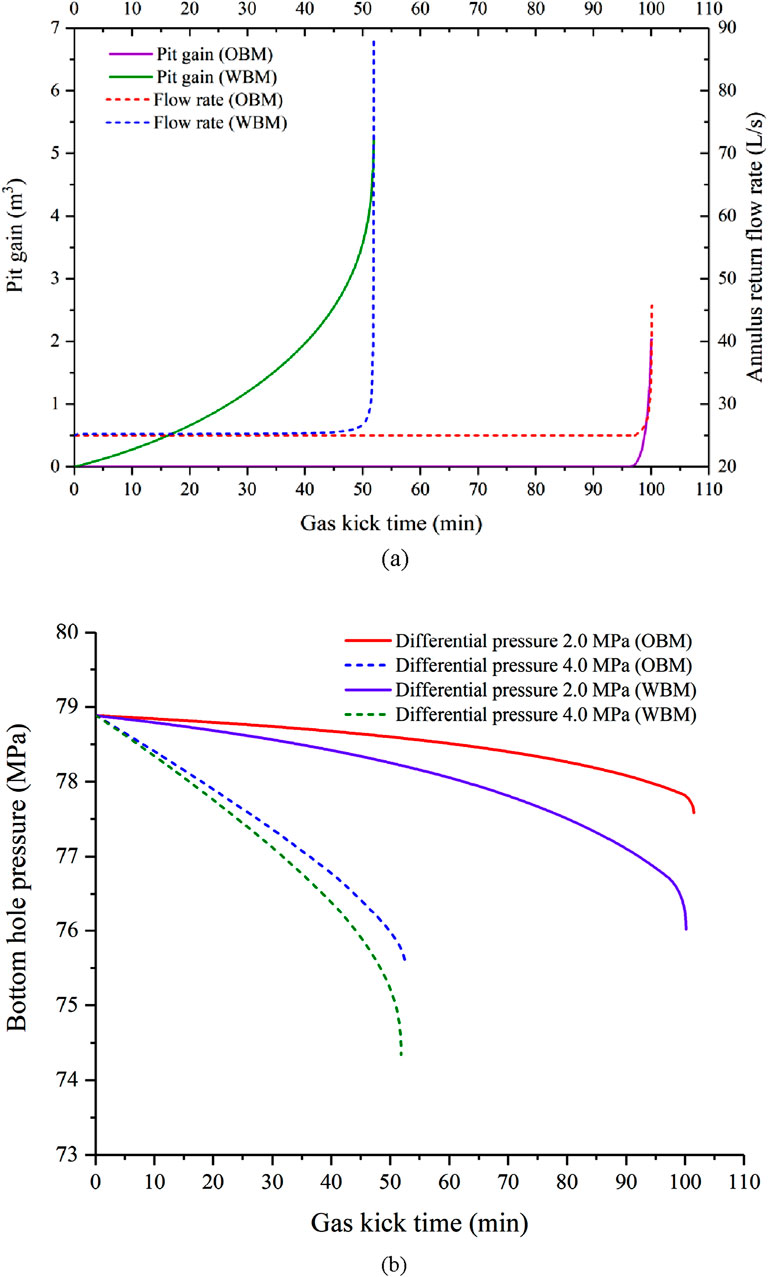
Figure 12. Comparison of wellhead and bottom hole indicators for a gas kick. (a) Ground indicators. (b) BHPs.
Moreover, downhole detection such as the measurement of BHP during the drilling process is another method for gas kick detection. For a low gas influx flow rate (differential pressure of 2.0 MPa), as illustrated in Figure 12b, a reduction of 1.1 MPa in the BHP is observed when the free gas occurs for OBM (t = 102 min), whereas for WBM, approximately 3.3 MPa reduction in the BHP is obtained (t = 100 min). Similarly, for a high gas influx flow rate (differential pressure of 4.0 MPa), the BHP is decreased by 2.09 MPa in the OBM (t = 54 min), whereas for the WBM, there is an approximately 4.54 MPa decrease in the BHP (t = 52 min). It means that the measurement accuracy of the system such as the Annular-Pressure-While-Drilling (APWD) system can monitor such a little variation in the pressure. Therefore, the real-time measurement of BHP is important for gas kick detection within the required accuracy.
6 Discussion
The present study aims to investigate the effects of gas dissolution/separation and wellbore–formation coupling on flow behaviors during the drilling process. The results of this study demonstrate that gas solubility can weaken kick warning signals, making it more difficult to detect a gas kick. Another important finding is that wellbore–formation coupling strongly affects the distribution characteristics of flow parameters in the wellbore. This study is applicable to the accurate characterization of gas–liquid two-phase flow behavior in the annulus after gas invasion during the drilling process of both oil-based and water-based drilling fluids.
Overall, our findings are consistent with those of the previous literature, but the changes in the pit gain and return flow rate at the wellhead after considering gas solubility do not align with the results of Sun et al. (2019) and White and Walton (1990) and instead matches the conclusions of Yin et al. (2017). Specifically, in our study, before gas escapes from the oil-based drilling fluid, we observe that the pit gain is 0, and the return flow rate at the wellhead remains unchanged. However, Sun et al. (2019) and White and Walton (1990) found that both the pit gain and the return flow volume at the wellhead would increase. The primary reason for this difference is that they assumed gas dissolved in the oil-based drilling fluid would cause changes in the fluid volume coefficient, thereby affecting the pit gain and the return flow rate at the wellhead. In contrast, this study and the work of Yin et al. (2017) ignore this effect and instead consider the key factor affecting the pit gain and return flow rate to be the presence of free gas in the annulus. It is undeniable that the impact of gas dissolution in oil-based drilling fluids (especially in high-temperature and high-pressure downhole conditions) on the fluid volume coefficient warrants further extensive research.
Notably, the assumptions of the proposed model lead to certain limitations. The model assumes one-dimensional axial flow and neglects lateral effects and secondary flows. This assumption simplifies computation but may reduce the accuracy in wells with significant deviations or non-uniform annular geometries. For directional or horizontal wells, additional modeling considerations are required to account for three-dimensional flow dynamics. Although the model performs well under standard deep drilling conditions, its applicability to ultra-high-temperature (>200°C) or high-pressure (>150 MPa) scenarios remains unverified. Such extreme conditions could alter gas solubility behavior and flow dynamics, requiring further validation. The influx gas is assumed to be pure methane, which simplifies calculations but limits applicability to reservoirs with mixed gases (e.g., H2S and CO2). Future models should integrate multi-gas components and their interactions with OBM and WBM. The uniform wellbore assumption may not hold in real-world cases with varying casing diameters or irregular annular spaces. Incorporating variable geometries could improve the accuracy in simulating complex wellbore conditions.
The findings provide actionable insights for field operations. In WBM drilling, pit gain can be reliably used for early kick detection, while OBM drilling necessitates real-time bottom-hole pressure monitoring to compensate for the delayed surface responses caused by gas solubility. Drilling teams can optimize fluid selection, adopt enhanced well control procedures, and integrate advanced monitoring technologies to mitigate risks. Furthermore, incorporating these findings into simulation-based training and pre-drilling risk assessments can enhance the preparedness for effective management of gas kicks.
7 Conclusion
(1) The variations in the gas void fraction, influx gas flow rate, mixture velocity, and mixture density for the wellbore–formation coupling model are different from the non-coupling model. In the wellbore–formation coupling model, the influx gas flow rate is not a constant value, and it exponentially increases with the increase in gas kick time. Both the gas void fraction distribution and mixture velocity distribution profiles show the type of “C,” while the mixture density profile exhibits an inverse trend compared to the velocity profile.
(2) For both OBM drilling and WBM drilling, the gas void fraction, pit gain, ARFR, and BHP violently fluctuate in the last phase of a gas kick. It should be treated with more caution when the significant expansion of free gas occurs near the wellhead.
(3) Gas solubility can significantly delay the surface responses of a gas kick in OBM drilling, especially at a low influx rate. However, the surface responses are similar for both OBM and WBM at a very large influx rate. There is a turning point in the BHP curve for OBM drilling, which represents the dissolved gas that comes out of OBM. This can give an early gas kick warning.
(4) The pit gain, compared to the ARFR, proves to be a much more effective indicator for early gas kick detection in WBM. However, the severe lagging makes it infeasible for gas kick detection in OBM. Accurate BHP monitoring during the drilling process can help identify gas kicks.
Data availability statement
The raw data supporting the conclusion of this article will be made available by the authors, without undue reservation.
Author contributions
YS: conceptualization, data curation, funding acquisition, investigation, methodology, project administration, software, supervision, and writing – original draft. HM: conceptualization, data curation, formal analysis, funding acquisition, investigation, resources, visualization, and writing – review and editing. LX: formal analysis, investigation, software, supervision, validation, and writing – original draft. CP: conceptualization, investigation, methodology, project administration, supervision, and writing – original draft. JG: data curation, formal analysis, funding acquisition, supervision, and Writing – review and editing. XS: methodology, project administration, software, and writing – review and editing. JF: conceptualization, funding acquisition, and writing – review and editing. YT: conceptualization, data curation, project administration, and writing – review and editing.
Funding
The author(s) declare that financial support was received for the research and/or publication of this article. The funders provide financial support for this study. This work is supported by the Postdoctoral Program of PetroChina Southwest Oil and Gas Field Company (Grant No.20220302-21), Science and Technology Cooperation Project of the CNPC-SWPU Innovation Alliance (Grant No. 2020CX040101), and Natural Science foundation of Sichuan Province (Grant No. 2025ZNSFSC0373). The authors declare that this study received funding from PetroChina Southwest Oil and Gas Field Company and CNPC. The funders were not involved in the study design, collection, analysis, interpretation of data, the writing of this article, or the decision to submit it for publication.
Conflict of interest
Authors YS, HM, LX, JG, XS, and YT were employed by PetroChina Southwest Oil & Gas Field Company.
The remaining authors declare that the research was conducted in the absence of any commercial or financial relationships that could be construed as a potential conflict of interest.
Generative AI statement
The author(s) declare that no Generative AI was used in the creation of this manuscript.
Publisher’s note
All claims expressed in this article are solely those of the authors and do not necessarily represent those of their affiliated organizations, or those of the publisher, the editors and the reviewers. Any product that may be evaluated in this article, or claim that may be made by its manufacturer, is not guaranteed or endorsed by the publisher.
Abbreviations
References
Abbas, A. K., Bashikh, A. A., Abbas, H., and Mohammed, H. Q. (2019). Intelligent decisions to stop or mitigate lost circulation based on machine learning. Energy 183, 1104–1113. doi:10.1016/j.energy.2019.07.020
Ali, T. H., Haberer, S. M., Says, I. P., Ubaru, C. C., Laing, M. L., Helgesen, O., et al. (2013). Automated alarms for smart flowback fingerprinting and early kick detection. In SPE/IADC drilling conference and exhibition (Amsterdam, Netherlands: Society of Petroleum Engineers).
Amani, M., Al-Jubouri, M., and Shadravan, A. (2012). Comparative study of using oil-based mud versus water-based mud in HPHT fields. Adv. Petroleum Explor. Dev. 4 (2), 18–27. doi:10.3968/j.aped.1925543820120402.987
Anfinsen, B. T., and Rommetveit, R. (1992). Sensitivity of early kick detection parameters in full-scale gas kick experiments with oil-and water-based drilling muds. In SPE/IADC drilling conference and exhibition (New Orleans, LA, United States: Society of Petroleum Engineers).
Avelar, C. S., Ribeiro, P. R., and Sepehrnoori, K. (2009). Deepwater gas kick simulation. J. Petroleum Sci. Eng. 67, 13–22. doi:10.1016/j.petrol.2009.03.001
Beggs, D. H., and Brill, J. P. (1973). A study of two-phase flow in inclined pipes. J. Petroleum Technol. 25, 607–617. doi:10.2118/4007-pa
Bhagwat, S. M., and Ghajar, A. J. (2014). A flow pattern independent drift flux model based void fraction correlation for a wide range of gas–liquid two phase flow. Int. J. Multiph. Flow 59, 186–205. doi:10.1016/j.ijmultiphaseflow.2013.11.001
Choi, J., Pereyra, E., Sarica, C., Lee, H., Jang, I. S., and Kang, J. M. (2013). Development of a fast transient simulator for gas–liquid two-phase flow in pipes. J. Petroleum Sci. Eng. 102, 27–35. doi:10.1016/j.petrol.2013.01.006
Ekrann, S., and Rommetveit, R., (1985). A simulator for gas kicks in oil-based drilling muds. In SPE annual technical conference and exhibition (Las Vegas, NV, United States: Society of Petroleum Engineers).
Evje, S. (2011). Weak solutions for a gas-liquid model relevant for describing gas-kick in oil wells. SIAM J. Math. Analysis 43, 1887–1922. doi:10.1137/100813932
Fan, H. H., Peng, Q., Teng, X. Q., Zhou, H. B., and Tang, H. S. (2014). A high precision method for calculating laminar pressure drop of drilling fluid in pipe flow with different rheological models. J. China Univ. Petroleum Ed. Nat. Sci. 38, 70–74. doi:10.3969/j.issn.1673-5005.2014.01.010
Feng, J., Fu, J. H., Chen, P., Du, Z., and Qin, L. L. (2016). Experimental study and molecular simulation of gas dissolution and diffusion behavior in drilling fluid. J. Nat. Gas Sci. Eng. 36, 424–433. doi:10.1016/j.jngse.2016.10.060
Flatabø, G. Ø., Torsvik, A., Oltedal, V. M., Bjørkvik, B., Grimstad, A. A., and Linga, H., (2015). Experimental gas absorption in petroleum fluids at HPHT conditions. In SPE bergen one day seminar (Bergen, Norway: Society of Petroleum Engineers)
Fu, J. H., Su, Y., Jiang, W., and Xu, L. B. (2015). Development and testing of kick detection system at mud line in deepwater drilling. J. Petroleum Sci. Eng. 135, 452–460. doi:10.1016/j.petrol.2015.10.013
Growcock, F. B., Khan, A. M., and Simon, G. A., (2003). Application of water-based and oil-based aphrons in drilling fluids. In SPE International symposium on oilfield chemistry (Houston, TX, United States: Society of Petroleum Engineers).
Hargreaves, D., Jardine, S., and Jeffryes, B. (2021). “Early kick detection for deepwater drilling: new probabilistic methods applied in the field,” in SPE annual technical conference and exhibition (New Orleans, LA, United States: Society of Petroleum Engineers).
He, M., Liu, G. H., Li, J., Li, J. W., Zhang, T., Liu, W., et al. (2015). Study of sour gas kicks taken during managed pressure drilling operations. In SPE/IATMI asia pacific oil and gas conference and exhibition (Nusa Dua, Bali, Indonesia: Society of Petroleum Engineers).
He, M., Xu, M. B., Li, J., and Liu, G. H. (2017). A new two-phase model to simulate sour gas kicks in MPD operations with Water Based Mud. J. Petroleum Sci. Eng. 159, 331–343. doi:10.1016/j.petrol.2017.09.024
Hoberock, L. L., and Stanbery, S. R. (1981). Pressure dynamics in wells during gas kicks: Part 1-component models and results. J. Petroleum Technol. 33, 1357–1366. doi:10.2118/9256-pa
Johnson, A. B., and Cooper, S. (1993). “Gas migration velocities during gas kicks in deviated wells,” In SPE annual technical conference and exhibition (Houston, TX, United States: Society of Petroleum Engineers).
Ju, G. S., Yan, T., Sun, X. F., Qu, J. Y., and Hu, Q. B. (2022). Evolution of gas kick and overflow in wellbore and formation pressure inversion method under the condition of failure in well shut-in during a blowout. Petroleum Sci. 19 (2), 678–687. doi:10.1016/j.petsci.2022.01.004
Kabir, C. S., and Hasan, A. R., (1986). A study of multiphase flow behavior in vertical oil wells: Part II-field application. In SPE California regional meeting (Oakland, CA, United States: Society of Petroleum Engineers).
Khan, J. A., Irawan, S., Dan, I. B. M., and Cai, B. P. (2022). Determining the difference of kick tolerance with single bubble and dynamic multiphase models: evaluation of well-control with water/synthetic based muds. Ain Shams Eng. J. 13 (4), 101678. doi:10.1016/j.asej.2021.101678
Kumar, S., Thakur, A., Kumar, N., and Husein, M. M. (2020). A novel oil-in-water drilling mud formulated with extracts from Indian mango seed oil. Petroleum Sci. 17 (1), 196–210. doi:10.1007/s12182-019-00371-7
Leblanc, J. L., and Lewis, R. L. (1968). A mathematical model of a gas kick. J. Petroleum Technol. 20, 888–898. doi:10.2118/1860-pa
Lei, Q., Xu, Y., Yang, Z. W., Cai, B., Wang, X., Zhou, L., et al. (2021). Progress and development directions of stimulation techniques for ultra-deep oil and gas reservoirs. Petroleum Explor. Dev. 48, 221–231. doi:10.1016/s1876-3804(21)60018-6
Li, X., Zhang, J., Tang, X., Li, C. N., Li, B., Wang, Y., et al. (2022). Propagation characteristics and application effects of measurement-while-drilling pressure wave for early gas-kick detection. J. Loss Prev. Process Industries 76, 104741. doi:10.1016/j.jlp.2022.104741
Lima, H. R., Barrufet, M. A., and Juvkam-Wold, H. C., (1999). Pressure calculations and kick detection with synthetic-based muds in a riserless drilling configuration. In Offshore Technology conference (Houston, TX, United States: Society of Petroleum Engineers).
Manikonda, K., Hasan, A. R., Rahmani, N. H., Kaldirim, O., Obi, C. E., Schubert, J. J., et al. (2021). A gas kick model that uses the thermodynamic approach to account for gas solubility in synthetic-based mud. In SPE/IADC Middle East drilling Technology conference and exhibition (Abu Dhabi, UAE: Society of Petroleum Engineers).
Meng, Y. F., Xu, C. Y., Wei, N., Li, G., Li, H. T., and Duan, M. B. (2015). Numerical simulation and experiment of the annular pressure variation caused by gas kick/injection in wells. J. Nat. Gas Sci. Eng. 22, 646–655. doi:10.1016/j.jngse.2015.01.013
Monteiro, E. N., Ribeiro, P. R., and Lomba, R. F. T. (2010). Study of the PVT properties of gas-synthetic-drilling-fluid mixtures applied to well control. SPE Drill. and Complet. 25, 45–52. doi:10.2118/116013-pa
Mukherjee, H., and Brill, J. P. (1985). Pressure drop correlations for inclined two-phase flow. J. energy Resour. Technol. 107, 549–554. doi:10.1115/1.3231233
Muojeke, S., Venkatesan, R., and Khan, F. (2020). Supervised data-driven approach to early kick detection during drilling operation. J. Petrol. Sci. Eng. 192, 107324. doi:10.1016/j.petrol.2020.107324
Nhat, D. M., Venkatesan, R., and Khan, F. (2020). Data-driven Bayesian network model for early kick detection in industrial drilling process. Process Saf. Environ. Prot. 138, 130–138. doi:10.1016/j.psep.2020.03.017
Nickens, H. V. (1987). A dynamic computer model of a kicking well. SPE Drill. Eng. 2, 159–173. doi:10.2118/14183-pa
Nunes, J. O. L., Bannwart, A. C., and Ribeiro, P. R., (2002). Mathematical modeling of gas kicks in deep water scenario. In IADC/SPE asia pacific drilling Technology (Jakarta, Indonesia: Society of Petroleum Engineers).
O’Bryan, P. L., and Bourgoyne, A. T., (1987). Swelling of oil-base drilling fluids due to dissolved gas. In SPE annual technical conference and exhibition (Dallas, TX, United States: Society of Petroleum Engineers).
O’Bryan, P. L., and Bourgoyne, A. T. (1989). Methods for handling drilled gas in oil-based drilling fluids. SPE Drill. Eng. 4, 237–246. doi:10.2118/16159-pa
O’Bryan, P. L., Bourgoyne Jr, A. T., Monger, T. G., and Kopcso, D. P. (1988). An experimental study of gas solubility in oil-based drilling fluids. SPE Drill. Eng. 3, 33–42. doi:10.2118/15414-pa
Olamigoke, O., and James, I. (2022). “Advances in well control: early kick detection and automated control systems,” in Drilling engineering and technology-recent advances new perspectives and applications (Kuala Lumpur, Malaysia: IntechOpen).
Osarogiagbon, A., Muojeke, S., Venkatesan, R., Khan, F., and Gillard, P. (2020). A new methodology for kick detection during petroleum drilling using long short-term memory recurrent neural network. Process Saf. Environ. Prot. 142, 126–137. doi:10.1016/j.psep.2020.05.046
Reed, T. D., and Pilehvari, A. A., (1993). A new model for laminar, transitional, and turbulent flow of drilling muds. In SPE production operations symposium (Oklahoma City, OK, United States: Society of Petroleum Engineers).
Rommetveit, R. (1989). A numerical simulation model for gas-kicks in oil based drilling fluids. Bergen, Norway: University of Bergen. PhD dissertation.
Rommetveit, R., and Olsen, T. L., (1989). Gas kick experiments in oil-based drilling muds in a full-scale, inclined research well. In SPE annual technical conference and exhibition (San Antonio, TX, United States: Society of Petroleum Engineers).
Rommetvelt, R., Blyberg, A., and Olsen, T., (1989). The effects of operating conditions, reservoir characteristics and control methods on gas kicks in oil based drilling muds. In SPE offshore europe (Aberdeen, United Kingdom: Society of Petroleum Engineers).
Santos, H., Reid, P., Jones, J., and McCaskill, J., (2005). Developing the micro-flux control method Part 1: system development, field test preparation and results. In SPE/IADC Middle East drilling Technology conference and exhibition (Dubai, United Arab Emirates: Society of Petroleum Engineers).
Santos, O. L., and Bourgoyne, A. T., (1989). Estimation of pressure peaks occurring when diverting shallow gas. In SPE annual technical conference and exhibition (San Antonio, TX, United States: Society of Petroleum Engineers).
Shi, H., Holmes, J. A., Durlofsky, L. J., Aziz, K., Diaz, L. R., Alkaya, B., et al. (2005). Drift-flux modeling of two-phase flow in wellbores. SPE J. 10, 24–33. doi:10.2118/84228-pa
Silva, C. T., Mariolani, J. R. L., Bonet, E. J., Lomba, R. F. T., Santos, O. L. A., and Ribeiro, P. R., (2004). Gas solubility in synthetic fluids: a well control issue. In SPE annual technical conference and exhibition (Houston, TX, United States: Society of Petroleum Engineers).
Sun, B. J., Fu, W. Q., Wang, N., Wang, Z. Y., and Gao, Y. H. (2019). Multiphase flow modeling of gas intrusion in oil-based drilling mud. J. Petroleum Sci. Eng. 174, 1142–1151. doi:10.1016/j.petrol.2018.12.018
Sun, B. J., Sun, X. H., Wang, Z. Y., and Chen, Y. H. (2017). Effects of phase transition on gas kick migration in deepwater horizontal drilling. J. Nat. Gas Sci. Eng. 46, 710–729. doi:10.1016/j.jngse.2017.09.001
Tang, H. W., Zhang, S., Zhang, F. F., and Venugopal, S. (2019). Time series data analysis for automatic flow influx detection during drilling. J. Petroleum Sci. Eng. 172, 1103–1111. doi:10.1016/j.petrol.2018.09.018
Tang, M., Yao, G., He, S. M., Li, H. J., Liu, S., and Lu, J. N. (2022). Gravity displacement gas kick law in fractured carbonate formation. J. Petroleum Explor. Prod. Technol. 12, 3165–3181. doi:10.1007/s13202-022-01514-0
Tang, Y. L., and Ouyang, L. B. (2010). A dynamic simulation study of water hammer for offshore injection wells to provide operation guidelines. SPE Prod. and Operations 25, 509–523. doi:10.2118/131594-pa
Thomas, D. C., Lea Jr, J. F., and Turek, E. A. (1984). Gas solubility in oil-based drilling fluids: effects on kick detection. J. petroleum Technol. 36, 959–968. doi:10.2118/11115-pa
Van Slyke, D. C., and Huang, E. T. S., (1990). Predicting gas kick behavior in oil-based drilling fluids using a pc-based dynamic wellbore model. In IADC/SPE drilling conference (Houston, TX, United States: Society of Petroleum Engineers).
Wang, H. G., Huang, H. C., Bi, W. X., Ji, G. D., Zhou, B., and Zhuo, L. B. (2022). Deep and ultra-deep oil and gas well drilling technologies: progress and prospect. Nat. Gas. Ind. B 9, 141–157. doi:10.1016/j.ngib.2021.08.019
Wei, C., and Chen, Y. H. (2021). On improving algorithm efficiency of gas-kick simulations toward automated influx management: a robertson differential-algebraic-equation problem approach. SPE Drill. and Complet. 36, 943–966. doi:10.2118/206747-pa
White, D. B., and Walton, I. C., (1990). A Computer Model for kicks in Water-and oil-based muds. In IADC/SPE drilling conference (Houston, TX, United States: Society of Petroleum Engineers).
Xu, Z. M., Song, X. Z., Li, G. S., Wu, K., Pang, Z. Y., and Zhu, Z. P. (2018). Development of a transient non-isothermal two-phase flow model for gas kick simulation in HTHP deep well drilling. Appl. Therm. Eng. 141, 1055–1069. doi:10.1016/j.applthermaleng.2018.06.058
Yan, T., Qu, J. Y., Sun X, F., Li, W., Chen, Y., and Hu, Q. B. (2021). A novel predictive model of drag coefficient and settling velocity of drill cuttings in non-Newtonian drilling fluids. Petroleum Sci. 18, 1729–1738. doi:10.1016/j.petsci.2021.09.003
Yang, J., Sun, T., Zhao, Y., Borujeni, A. T., Shi, H., and Yang, H. (2019). Advanced real time gas kick detection using machine learning technology (Honolulu, HI, United States: International Society of Offshore and Polar Engineers).
Yang, M., Li, X. X., Deng, J. M., Meng, Y. F., and Li, G. (2015). Prediction of wellbore and formation temperatures during circulation and shut-in stages under kick conditions. Energy 91, 1018–1029. doi:10.1016/j.energy.2015.09.001
Yin, B. T., Liu, G., and Li, X. F. (2017). Multiphase transient flow model in wellbore annuli during gas kick in deepwater drilling based on oil-based mud. Appl. Math. Model. 51, 159–198. doi:10.1016/j.apm.2017.06.029
Yin, H., Liu, P., Li, Q., Wang, Q., and Gao, D. W. (2015). A new approach to risk control of gas kick in high-pressure sour gas wells. J. Nat. Gas Sci. Eng. 26, 142–148. doi:10.1016/j.jngse.2015.06.014
Yin, H., Si, M. H., Cui, H. W., Li, Q., and Liu, W. (2022). Combining knowledge and a data driven method for identifying the gas kick type in a fractured formation. Appl. Sci. 12, 10912. doi:10.3390/app122110912
Yin, Q. S., Yang, J., Tyagi, M., Zhou, X., Wang, N., Tong, G., et al. (2022). Downhole quantitative evaluation of gas kick during deepwater drilling with deep learning using pilot-scale rig data. J. Petroleum Sci. Eng. 208, 109136. doi:10.1016/j.petrol.2021.109136
Zeng, H., Jin, Y., Qu, H., and Lu, Y. H. (2022). Experimental investigation and correlations for proppant distribution in narrow fractures of deep shale gas reservoirs. Petroleum Sci. 19, 619–628. doi:10.1016/j.petsci.2021.10.019
Keywords: gas kick, drilling operation, flow behavior, gas solubility, wellbore-formation coupling, gas kick detection
Citation: Su Y, Ma H, Xia L, Peng C, Guo J, Shen X, Fu J and Tang Y (2025) Prediction and analysis of flow behavior during gas kicks considering wellbore–formation coupling and gas solubility. Front. Earth Sci. 13:1558305. doi: 10.3389/feart.2025.1558305
Received: 10 January 2025; Accepted: 17 March 2025;
Published: 04 April 2025.
Edited by:
Xingyuan Liang, China University of Petroleum, ChinaReviewed by:
Xiaojun Wu, Changzhou University, ChinaYunjin Wang, China University of Petroleum, Beijing, China
Copyright © 2025 Su, Ma, Xia, Peng, Guo, Shen, Fu and Tang. This is an open-access article distributed under the terms of the Creative Commons Attribution License (CC BY). The use, distribution or reproduction in other forums is permitted, provided the original author(s) and the copyright owner(s) are credited and that the original publication in this journal is cited, in accordance with accepted academic practice. No use, distribution or reproduction is permitted which does not comply with these terms.
*Correspondence: Chi Peng, cGVuZ2NoaXN3cHVAc3dwdS5lZHUuY24=