Abstract
In the Shunbei area of the Tarim Basin, China, carbonate fault-controlled fracture-cavity reservoirs exhibit complex internal structures and complex heterogeneity, with primary reservoir spaces including fault plane, cave-like, and disordered body reservoirs. Traditional geological modeling methods, such as multipoint geostatistical stochastic simulations or threshold-truncated modeling based on single seismic attribute volumes, are not adequate for effectively characterizing the complex spatial distribution of fault plane, cave-like, disordered body reservoirs, and their internal grille structures. This limitation leads to insufficient accuracy in inter-well connectivity predictions and constrains efficient hydrocarbon development. This study proposes a novel trendline-constrained object-based modeling approach, taking the Shunbei No. 5 strike-slip fault zone as a case study. First, deterministic modeling methods were employed to establish fault-controlled body contour models through seismic attribute fusion (structure tensor, energy gradient, and variance attributes) calibrated with well-log data. For internal architecture characterization, a hierarchical modeling strategy was implemented. The methodology innovatively integrates principal stress orientation trendline tracking algorithms with cumulative probability sampling techniques, achieving quantitative modeling of alternating grille structures composed of crush belt (breccia belt and fracture belt) and bedrock belt. Results show that this method accurately maps the spatial distribution of fault plane and cave-like reservoirs, ensuring reserve estimation errors and numerical simulation discrepancies are both kept below 10%. The proposed trendline-constrained object-based modeling method overcomes the limitations of conventional techniques in precisely characterizing grille morphologies, enabling refined 3D characterization of fault-controlled fracture-cavity reservoirs. This research provides crucial technical support for the development of carbonate hydrocarbon reservoirs.
1 Introduction
Global ultra-deep carbonate reservoirs have huge hydrocarbon resource potential, which is of great significance in promoting technological innovation, guaranteeing energy security, and promoting sustainable economic and environmental development (Garland et al., 2012; Zhou et al., 2014; Gong et al., 2023; Neupane, 2023; Deng X. L. et al., 2024). In the Tarim Basin, China, ultra-deep oil and gas exploration and development have revealed that carbonate reservoirs are significantly influenced by tectonic movements in large-scale strike-slip fault zones, leading to the formation of fracture zones along these faults (He et al., 2021a; Wang et al., 2021; Ma et al., 2022; Ma et al., 2023). Groundwater seeps along the fault zone, corroding and transforming the fracture zone to form a special fracture-cavity carbonate reservoir, which is defined as a fault-karst reservoir. The main reservoir spaces in fault-karst reservoirs are dissolution caves, pores and fractures (Jiao, 2018; Ji et al., 2022; Jia et al., 2024). Overall, from the core of the fault zone to the crush belts on both sides, the degree of dissolution gradually weakens and the development degree of the reservoir body gradually decreases (Ning et al., 2022; Deng et al., 2023).
Many scholars have carried out research on the genetic mechanism and structural characteristics of the reservoirs in the Tahe Oilfield, Tarim Basin, China, and based on their work, a three-dimensional geological model of the fracture-cavity reservoirs in the fault-karst reservoirs has been established to aid in the development of the fault-karst reservoirs (Han et al., 2021; Zhang Y et al., 2023). With the deepening of exploration and development of the Shunbei oil and gas reservoir, which is also located in the Tarim Basin, it has been found that the Shunbei area is also controlled by the large-scale strike-slip fault zone, forming a large-scale fracture body along the fault zone (Ma et al., 2019; Qiu et al., 2019; Liu, 2020; Chen et al., 2023; Mao et al., 2023). In contrast to the Tahe area, the fracture body in the Shunbei area has been less affected by the dissolution of groundwater, but it is filled with breccia, forming a high-porosity and high-permeability crush belt, which evolved into a good reservoir space in the later period. The dissolution of this type of reservoir is weak, and the influence of the fault zone is more obvious (Yuan et al., 2021; Deng Z. Y. et al., 2024). In order to distinguish it from the fault-karst reservoir in the Tahe Oilfield, the fracture-cavity carbonate reservoir formed under the control of the large-scale strike-slip fault zone in the Shunbei Oilfield is defined as a fault-controlled body. These reservoirs exhibit distinct differences in development location, shape, scale, and internal structure compared to fault-karst reservoirs, with significantly higher heterogeneity. The complex internal structural characteristics restrict the efficient development of oil and gas fields. It is imperative to develop a fine-scale 3D geological model for these reservoirs to clarify inter-well connectivity paths, dominant hydrocarbon migration channels, and primary oil and gas distribution spaces, thereby facilitating efficient field development.
This study focuses on the No. 5 strike-slip fault zone in the Shunbei Oilfield. Previous research has revealed that this area contains fault-controlled fracture-cavity reservoirs, with primary reservoir spaces comprising fault plane, cave-like, and disordered body reservoirs. These features are characterized by the development of crush belts within fault plane and cave-like, which alternate with bedrock belt to form a grille reservoir structure (Zhang W. B. et al., 2022; Zhang Y. D. et al., 2023; Chen et al., 2024). Currently, no existing three-dimensional (3D) geological modeling algorithm specifically designed for such fault-controlled structures, leading to a lack of detailed 3D geological models to support oil and gas field production and development. This paper aims to address this gap by designing a suite of geological modeling algorithms tailored for the grille structure of fault-controlled bodies. Utilizing seismic attribute data and drilling information, this study describes the contour model of the fault-controlled body that accurately reflects its actual shape. Additionally, resistivity logging curve data analysis was conducted to investigate the development patterns and scales of the internal grille structure under varying stress conditions. By integrating these insights, the proposed grille structure modeling algorithm aims to construct a high-resolution 3D geological model within the fault-controlled body, guided by the established development patterns. This approach not only enhances our understanding of the complex subsurface architecture but also provides critical support for optimizing exploration and production strategies in similar challenging environments.
The data used in this paper include seismic data and well data. The seismic data are the seismic data of the whole area of the No.5 strike-slip fault zone in Shunbei Oilfield. The seismic accuracy is 25 m * 25 m. It also includes the seismic attribute body based on the original seismic data. Structural tensor seismic attribute body, coherent energy gradient seismic attribute body and variance seismic attribute body. The well data are the well coordinate information, well trajectory information and logging curve data of all deployed wells in the study area. The logging curve is mainly the resistivity curve, as well as the depth information and reservoir type information of the well drilling reservoir.
Based on the above understanding and data, in this paper seismic and logging data are combined to carry out fine three-dimensional geological modeling research in the study area. Based on the logging interpretation results, it is determined that the No. 5 fault zone is characterized by the development of a grille structure overall, and the development scales of the local extrusion section, the pullout section, and the translation section are determined. Guided by this, a fine three-dimensional geological model of the study area is established utilizing a combination of several modeling methods. First, a contour model of the fault-controlled body is established using the integrating seismic attributes and a deterministic modeling method. For the internal structure of the fault plane and cave-like reservoirs, a three-dimensional model of the internal grille filling structure is established using the object-based modeling method.
2 Geologic setting
The Shunbei Oilfield is situated in the Tarim Basin, China, bordering the Shuntuoguole low uplift to the southeast, the Shaya uplift to the northeast, the eastern slope of the Awati Depression to the west, and the Manjiaer Depression to the east. The Shunbei Oilfield is characterized by a gentle structure, with higher elevation in the north and east and lower in the south and west (Figure 1; Chen et al., 2024). The study area, situated within the Shunbei No.1 area’s No.5 strike-slip fault zone, spans approximately 84 km in length. The main research layers are the Ordovician Yingshan and Yijianfang Formations, with burial depths of 7,400–8,000 m and hosting ultra-deep oil and gas reservoirs. Fault-controlled carbonate fracture-cavity reservoirs have formed in the study area due to tectonic movements within the fault zone. The reservoirs have a complex heterogeneity and are faced with the problems of dominant oil and gas channels and an unclear oil and gas distribution, which affect the distribution of the well locations. Seismic acquisition data and abundant drilling data for the study area are available. Currently, 28 wells have been deployed, which are evenly distributed in the No. 5 fault zone. Most of these wells cross the fault zone or are drill sideways along the fault zone. Abundant core data and logging data have been collected, providing a foundation for determination of the fine scale characteristics of the internal structure of the fault-controlled body.
FIGURE 1

Geographic location of the study area and stratigraphic framework (a) Location of the Shunbei No. 5 fault zone, and (b) Lithologic stratigraphic histogram (after Chen et al., 2024).
3 Structural characterization of fault-controlled body
3.1 Contour characterization of fault-controlled body
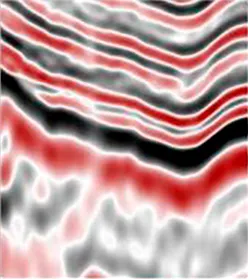
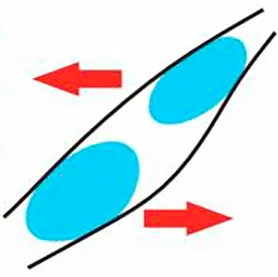
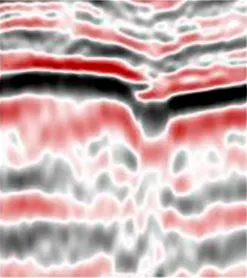
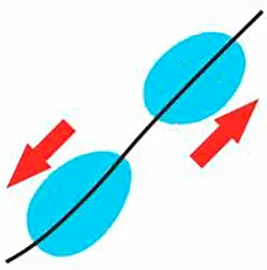
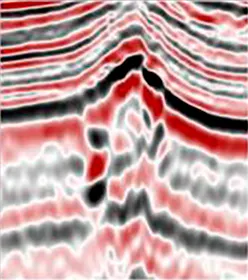
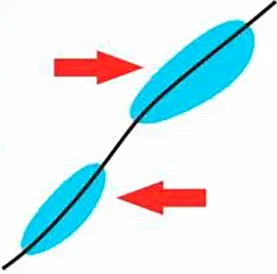
Existing exploration and development results have shown that the strike-slip fault zone controls the reservoir formation (Liu et al., 2022). Under the dual effects of in-situ compression and tension stresses and the strike-slip movement in the fault zone itself, the main stress area of the fault zone has been broken. From the core area to the edge areas on both sides, the stress gradually weakens, the degree of fragmentation gradually decreases, and the reservoir effect also diminishes. Under stress, the crush belt, acting as the primary reservoir space, develops numerous horizontal and vertical fractures within the fault zone, which serve as effective migration pathways for oil and gas. According to the different modes of action of the ground stress, the region where the entire fault zone is subjected to compression is defined as the extrusion section, the region subjected to tension is defined as the pullout section, and the region only subjected to strike-slip stress is defined as the translation section (Table 1). In the extrusion section, the fault zone experiences compressive stress from both lateral margins in addition to its own strike-slip motion. The strata in the stress concentration area are uplifted. The core area of the fault zone has the highest degree of fragmentation, and the core area is the dominant reservoir space in the fault zone. In the pullout section, the fault zone is subjected to tensile stress on both sides and strike-slip stress in the fault zone. The stress concentration area is located on both sides of the fault zone. The strata in the core area of the fault zone are concave. The areas on both sides of the fault zone have the highest degree of fragmentation, and the dominant reservoir space in the fault zone is located on both sides. In the translation section, the fault zone undergoes only strike-slip motion, resulting in minimal stratigraphic deformation beyond minor undulations. The reservoir performances in the core and both sides are equivalent, and the overall fragmentation degree is lower than that in the extrusion section and the pullout section.
TABLE 1
| Stress background | Seismic section | Plane mode |
|---|---|---|
| Pullout section |
|
|
| Translation section |
|
|
| Extrusion section |
|
|
Characteristics of stress structure of the fault-controlled body.
 cave-like
  Stress direction
  fault zone
  amplitude
According to the stress division, the study area can be divided into several sets of fault-controlled reservoirs (fault-controlled bodies), with the main types including fault plane, cave-like, and disordered body reservoirs (Zhang W. B. et al., 2022; He et al., 2023). The fault plane reservoir is a direct product of the strike-slip fault zone, and it is an immediate manifestation of the fault zone. Its shape is narrow bands, which are distributed along the principal stress direction, and it has good continuity. On the seismic section of the fault plane reservoir, the amplitude exhibits weak linear reflection, and the seismic events show small and medium-scale folding. The structural tensor seismic attribute body, which characterizes the geological continuum, can be used to describe it. The area with high structural tensor values is the high probability development area of the fault plane reservoir. The formation of the cave-like reservoir is related to the interaction between fault zones and the magnitude of the force. During the tectonic movement in the strike-slip fault zone, a series of broken bodies were separated from the fault zone and gradually evolved into independent bodies. They are mostly ellipsoidal in shape, and the overall crushing degree is high. Its scale can reach hundreds of meters. It is characterized by beaded reflection features on the seismic profiles, and large-scale folds occur in seismic events. It can be characterized by coherent energy gradient seismic attributes that characterize the independent bodies. The high-value attributes are the high probability development areas of the cave-like reservoir. The formation mechanism of the disordered body reservoir is similar to that of the cave-like reservoir, but the main difference lies in that the overall fragmentation degree of the disordered body reservoir is weak and its shape is mostly irregular. It manifests as disordered reflections on the seismic section, and the seismic event reveals large-scale folds or dislocation. The variance seismic attribute bodies that characterize the disordered reflection can be used to characterize it, and the high-value attribute is the high probability development area of the disordered body reservoir (Figure 2). Overall, the internal fracture in the fault plane and cave-like reservoirs are the most serious and are the main reservoir spaces. The development modes of the different stress sections are also slightly different. In the extrusion section, a single fault zone is developed, and a cave-like reservoir has been formed on both sides via extrusion stress and strike-slip motion. In the pullout section, multiple fault zones have been developed. Due to the tectonic movement on the fault zones, the cave-like reservoirs are more developed. In the translation section, a single fault zone is developed, and a cave-like reservoir has formed on both sides of the fault zone due to the strike-slip movement.
FIGURE 2

Seismic attribute characteristics of different fault-controlled bodies: (a) Seismic section, (b) Structural tensor attribute section, (c) Energy gradient attribute section, and (d) Variance attribute section.
3.2 Characterization of internal structure of fault-controlled body
Based on the structural characteristics of the strike-slip fault zone, the internal development model of the reservoir has been explored (Shekhar et al., 2014; Duan et al., 2020; Liu et al., 2020; He et al., 2021b; Zhang et al., 2021). It has been preliminarily shown that due to the multi-stage strike-slip movement inside the fault plane and cave-like reservoirs, multiple sets of crush belts have formed inside the fault-controlled body. These crush belts are blocked by the bedrock belt, forming a grille reservoir structure. The area with the highest degree of fragmentation, which is mostly filled with breccia and has the best reservoir effect, is defined as a breccia belt. On both sides of the breccia belt in the bedrock belt area, the degree of fragmentation is between that of the breccia belt and the bedrock belt. Due to the influence of the stress, parallel and vertical cracks are formed, the reservoir performance is poor, and the seepage capacity is good. It is defined as a fracture belt. Due to the small scales of the crush belt and the bedrock belt, i.e., most of them are several meters in size, it is difficult to display them on the seismic section. The wells in the study area mostly cross the fault zone and penetrate multiple crush belts. Therefore, the internal development structure of the fault-controlled body can be further dissected utilizing logging curves. Based on the corresponding relationship between the coring data and logging curves, the resistivity curve can be used to distinguish between the different types of reservoirs. The resistivity value corresponding to the breccia belt is the lowest, with the curve being spike-shaped, while that corresponding to the fracture belt begins to rise, and the curve is serrated. The resistivity value corresponding to the bedrock belt continues to rise, reaching the highest global value, and the shape of the curve does not change significantly.
Based on the response characteristics of the resistivity curves of the different reservoir types, the detailed development scale of crush belts in different regions can be analyzed (Li et al., 2023; Liu et al., 2023). The width of the crush belt is larger in logging interpretation for sidetracking drilling along the fault zone, which proves that the crush belt develops along the fault zone. In order to determine the relative development thickness of the crush belt, drilling across the fault zone should be conducted. The total thickness of the fault plane and cave-like reservoirs and the thickness of the crush belt interpreted using logging data are calculated, and the relative development scale ratio is calculated. Establish a development pattern diagram to guide the construction of the fault plane and the internal filling model of cave-like structures. The formation of the crush belt is related to the size of the force, and the force modes and force sizes of the different stress zones are different. Therefore, in order to ensure the pertinence and accuracy of the statistical results, the extrusion section, the pullout section, and the translation section are determined and the relative development thickness of the internal crush belt in the fault plane reservoir and the cave-like reservoir is calculated. Then, the development numbers of the breccia belt and the fracture belt with hundred meters and on the single development scale are obtained, and a diagram of the development pattern on the scale of hundred meters is established (Figure 3) to constrain the establishment of the geological model of the grille filling structure in the fault plane and cave-like reservoirs.
FIGURE 3

Diagram showing the development pattern of the different reservoirs and different stress sections on the scale of hundreds of meters (a) Fault plane extrusion section, (b) Fault plane pullout section, (c) Fault plane translation section, (d) Cave-like extrusion section, (e) Cave-like pullout section, and (f) Cave-like translation section.
4 Modeling of fault-controlled body
4.1 Object-based modeling method for fault-controlled body
It is difficult for conventional modeling methods (
Zhang et al., 2021;
Zhang Y. et al., 2022;
Duan et al., 2023;
He et al., 2023;
Xie et al., 2023) to establish a grille filling structure in which the interior of the fault-controlled body is consistent with the trend of the fault zone and the grid counts often exceed 1*10
8. In this paper, an object-based modeling method is designed to simulate the target reservoir using a grid of 1,187*1,041*400, approximately 5*10
8grids. The key is to identify the trend line of fault plane reservoir development prior to simulation (
Xu et al., 2009). This trend line, located in the core area of the fault plane, is generally along the principal stress direction, with its local part shifting left and right with the fault plane. Based on the maximum thickness of the fault plane in the vertical principal stress direction and the fault plane development pattern map of the current stress section, the number of crush belts and breccia belts in the reservoir, as well as the development scale of a single strip are randomly selected via cumulative probability sampling. The geological model of the fault plane is established at different levels, with the bedrock belt having the lowest degree of fragmentation defined as the first level. Within the range of the initial contour model, the global attribute value is modified and is defined as the bedrock belt. The crush belt with a crushing effect is defined according to the attribute values as the second level, and then the model of the crush and fracture belt is established. During the establishment of the crush belt, it is necessary to ensure that the distance between the crush belt and the trend line remains unchanged so that the trend of the crush belt conforms to the overall trend of the fault zone. The area with the highest degree of fragmentation in the crush belt is defined as the breccia belt, and the rest is defined as the fracture belt. For the third level, completing the establishment of the breccia belt inside the crush belt suffices to complete the division of the crush belt. In the process of establishing the breccia belt, it is also necessary to maintain the same distance from the trend line to establish a grille filling structure model of the whole fault zone along the principal stress direction. The specific steps for establishing a geological model are described below.
(1) First, by adopting the deterministic modeling method, the contour model of the reservoir (fault plane and cave-like reservoirs) is used as the constraint. The entire area within the scope of the contour body is defined as the bedrock belt, and a model of the bedrock belt is established.
(2) Before simulating the second-level crush belt, it is necessary to determine the trend line of the reservoir along the principal stress direction. The main method is to establish a three-dimensional grid and resample the extracted contour model onto the grid. Taking the center point as the starting point, a grid is advanced along the principal stress direction. At the same time, the numbers of grids on the left and right sides of the current point are determined. If the number of grids on the left side is greater than the number of grids on the right side, the trend line moves to the left; if less, it moves to the right; if equal, the trend line remains in the current direction, and the position of the moved grid serves as a new starting point. The grid is advanced along the direction of the principal stress, and the numbers of grids on the left and right sides are continuously judged and repeated until the end of the fault zone is reached (Figure 4).
(3) First, the thickness of the reservoir is determined by calculating the number of grids. Then, based on the maximum thickness (Moses, 2009) and combined with the diagram of the current stress section of the reservoir’s development pattern on the hundreds of meters scale, the number and scale of the crush belt development are calculated. In the calculation process, either the width of a single crush belt can be kept unchanged to calculate the number of developed crush belts, or the total number of developed crush belts can be kept unchanged while changing the development scale of a single crush belt under the premise of the same total development scale (Equation 1). The number of different crush belts developed is determined using the above two methods. In this interval, the development scale of a single crush belt under each possible number of development belts is calculated, and the number of this development scale in the statistical information about the logging reservoir thickness is counted. A cumulative probability sampling curve is established, and the number and the scale of the crush belts are determined via random sampling.
FIGURE 4

Diagram of the trend line direction: (a) Trend line offset to the right, (b) Trend line direction unchanged, and (c) Trend line offset to the left.
The actual development scale is meters when the number of development belts is constant, and the actual number of development belts is when the development scale is constant. The calculation formula is as follows:where is the total number of strips within a hundred meters, is a single scale within a hundred meters, and is the maximum thickness of the reservoir contour model. All parameters in the above equation have international units of meters.
The actual development number interval and the actual development scale interval can be seen expressed as follows, and international units are all meters (Equation 2):
Based on the actual data, the minimum number of development belts is 2 and the maximum number is 5, and the total development thickness of hundred meters is 20 m, the minimum development scale of a single strip is 4 m, and the maximum scale is 10 m. According to the possible development scale, the number of development scales corresponding to the development scale is selected from the logging data statistics table according to the principle of the nearest value, and a frequency histogram of the possible development scale and statistics is established. According to the histogram, a cumulative probability curve (
Figure 5) is established to determine the number of the reservoir development
and the development scale
.
(4) Considering that leakage and emptying often occur when drilling into a reservoir, it is determined that the edge of the reservoir is a dominant reservoir development area compared to the surrounding tight bedrock. Therefore, the crush belt is mainly developed at the boundary position of the bedrock belt model, and the overall uniform distribution constitutes the grille structure arrangement mode. For example, when there are only two crush belts, they are usually developed on either side of the bedrock belt (Figure 6a). When there are three crush belts, it is usually ensured that the edge of the bedrock belt is developed, and the entirety is evenly distributed inside the bedrock belt (Figure 6b).
(5) Crush belts are nearly uniformly distributed within the reservoir, with their relative distances from the trend line at the starting position systematically calculated. Based on this distance, the simulation of the crushed body is carried out along the principal stress direction. In the simulation process, it is necessary to update the width of the crush belt according to the ratio of the total thickness to the maximum thickness at the real-time position so as to achieve the purpose of maintaining a uniform change between the width of the established crush belt and the width of the fault plane, to complete the characterization of the crush belt, and to establish the second-level bedrock-crush belt model.
FIGURE 5

(a) Probable development scale and statistical frequency histogram, and (b) Cumulative probability curve of the probable development scale.
FIGURE 6

Diagram showing the crush belt development location: (a) Two crush belts developed on either sides, and (b) Three evenly distributed crush belts.
FIGURE 7

Boundary disturbance of the crush belt: (a) The boundary strike is constant, (b, g, h) The boundary closes, (c, d, f) The boundary expands, (e) The boundary moves to the left, and (i) The boundary moves to the right.
The scale of the crush belt at any position inside the reservoir body
and the distance between the vertical principal stress direction and the trend line at any position inside the reservoir
is calculated as follows (
Equation 3):
where
is the width of the vertical principal stress direction at any position inside the bedrock model, and
is the distance between the crush belt and the trend line in the direction of the vertical principal stress. All parameters in the above equation have international units of meters.
(6) In the process of the simulation of the second level crush belt, the disturbance function is added to change the local thickness of the crush belt, simulating the non-uniformity of the force of the strike-slip fault zone (Kargupta et al., 2003). The number of extended grids on the left and right boundaries of the crush belt is changed randomly. When the left and right boundaries move several grids to the left at the same time, the width of the crush belt does not obviously change compared with that before the disturbance; however, in the local area, it deviates to the left relative to the trend line, and it simulates the left area of the partial principal stress direction of the local stress position of the fault zone. When the values on the left and right sides move to the right at the same time, the width of the crush belt does no obviously change compared with that before the disturbance, but it moves forward toward the right deviation trend line in the local area and simulates the local stress position of the fault zone on the right side of the principal stress direction. When the values on the left and right sides shift in the same direction, the width of the crush belt becomes wider than before the disturbance, the trend is consistent with the trend line in the local area, and the local strong stress area of the fault zone is simulated. When the values on the left and right sides move in opposite directions relative to each other, the width of the crush belt becomes narrower than before the disturbance, and it even vanishes. The trend is consistent with the trend line in the local area, and the local weak stress area in the fault zone is simulated (Figure 7).
(7) For the simulation of the third level breccia belt and fracture belt, only the simulation of the breccia belt is needed to complete the establishment of the third level. The simulation of the breccia belt inside each crush belt is carried out one by one, and the number and scale of the breccia belt inside the single crush belt are determined via random sampling. The fragmentation gradually changes, and the stress gradually disappears. Therefore, at the edge of the crush belt, the contact area with the bedrock belt will not develop into a breccia belt, and there is a fracture belt with a medium degree of fragmentation between the breccia belt (largest fragmentation degree) and the bedrock belt (smallest fragmentation degree). The fault zone has undergone multiple tectonic movements, forming multiple crushing effects inside the bedrock belt. Therefore, multiple breccia belts have formed inside a single crush belt. Referring to the means of establishing a crush belt inside the bedrock belt, the breccia belt is established inside the crush belt. Each crush belt is traversed, and a random algorithm is used to select the number and scale of the developed breccia belt according to their scale. In the crush belt, along the principal stress direction, the relative distance from the trend line is kept constant to establish the breccia belt. For the unsimulated area in the crush belt, the attribute value is modified, and this area is defined as the fracture belt. The crush belt is divided into the breccia belt and the fracture belt, and the establishment of the grille structure model in which the bedrock belt, the fracture belt, and the breccia belt are alternately arranged inside the reservoir is completed.
4.2 Contour modeling of fault-controlled body
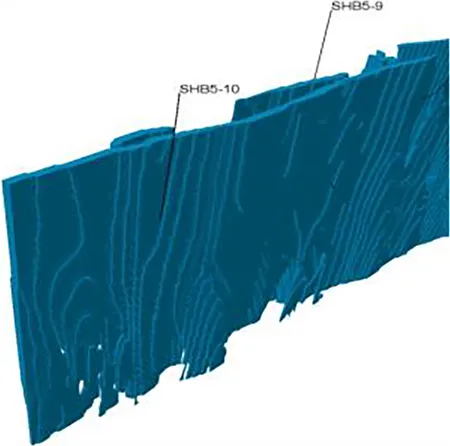
Different reservoirs in the fault-controlled body manifest differently on the seismic profile, corresponding to the different seismic attribute bodies. Using the deterministic modeling method, the seismic attribute body is truncated, and the external contour model of the fault-controlled body is established (Choquette and Pray, 1970; Kadlec et al., 2008; Lu et al., 2018; Li et al., 2019; Duan et al., 2023; Xie et al., 2023). The fault plane, cave-like, and disordered body reservoirs are described, and the obtained contour models of the different reservoirs are fused, yielding the contour model of the fault-controlled body. The detailed method is to normalize the structural tensor seismic attribute volume, the coherent energy gradient seismic attribute volume, and the variance seismic attribute volume to obtain the corresponding probability body model and then convert the attribute value into the probability value. The highest value in the initial attribute body is converted into a probability value of 1, indicating that the reservoir development probability in the highest attribute value area is 100%; while the lowest value in the initial attribute body is converted into a probability value of 0, indicating that the reservoir development probability in the lowest attribute value area is 0%. The most critical problem in the reservoir contour characterization is the determination of the critical probability value, that is, whether it is divided into the threshold value of the reservoir. The drilling enters the boundary area of the reservoir. Due to the changes in the physical properties, the phenomena of leakage and emptying occur. The leakage and emptying points of the drilling are calibrated, and the probability body threshold values at all of the drilling calibration points in the study area are counted to ensure that the fault-controlled reservoir covers all of the drilling wells. The minimum threshold value is selected as the critical probability value of the corresponding reservoir in the entire study area. The critical probability value information about the reservoir is obtained. That is, for the probability body obtained from the structure tensor, the probability critical value corresponding to the fault plane reservoir is 0.8, which indicates that the area with probability values of 0.8–1 is the fault plane reservoir. For the probability volume obtained from the coherent energy gradient, the critical probability value corresponding to the cave-like reservoir is 0.76, indicating that the area with probability values of 0.76–1 is a cave-like reservoir. For the probability volume obtained from the variance, the critical probability value corresponding to the disordered body reservoir is 0.67, indicating that the region with probability values of 0.67–1 is a disordered body reservoir. By using the corresponding critical probability value for truncation processing, the probability volume in the interval is retained, and a contour model of the fault plane, cave-like, and disordered body reservoirs can be obtained respectively (Equation 4). The three types of reservoirs are fused to obtain a fault-controlled body contour model for the study area (Figure 8).where is a three-dimensional grid model, is the probability volume obtained by normalizing the structure tensor seismic attribute volume and truncating it using critical value, is the initial contour of the fault plane reservoir, is the probability volume after the normalization processing of the coherent energy seismic attribute volume is truncated using the critical value, is the initial contour model of the cave-like reservoir, is the probability volume after the normalized variance seismic attribute volume is truncated using the critical value, is the initial contour model of the disordered body reservoir, and is the initial contour model of the fault-controlled body reservoir. Since all the parameters in the above equations represent a particular model, there are no corresponding international units.
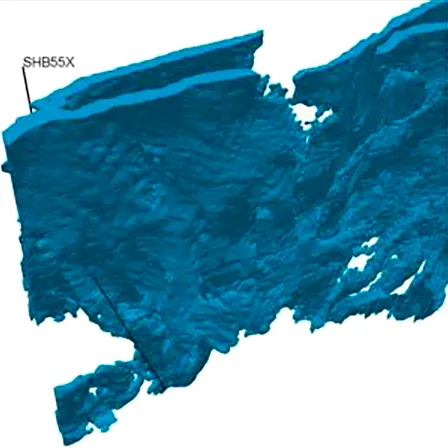
FIGURE 8

Contour model of the fault-controlled body.
4.3 Modeling of grille structure of fault-controlled body
4.3.1 Fault plane reservoir grille structure modeling
The key to establishing a three-dimensional model of the grille filling structure inside the fault plane is to see that the fault plane is an irregular long strip based on the direction of the principal stress. Overall, due to the change in the stress, the shape of the fault plane also changes. This mainly includes a single fault plane appearing in the translation section and the extrusion section, a multi-fault plane appearing in the pullout section, a branch fault plane appearing in the transition area from the extrusion section to the pullout section, and a convergence fault plane appearing in the transition area from the pullout section to the extrusion section (Table 2).
TABLE 2
| Type | Three-dimensional model | Two-dimensional model | Analyze |
|---|---|---|---|
| Single fault plane |
|
|
Commonly found in translation or extrusion section, subjected to slip stress in the direction of the principal stress or extrusion stress perpendicular to the direction of the principal stress, resulting in the formation of a single fault plane. |
| Multi-fault plane |
|
|
Commonly found in pullout or extruded sections, where both sides are subjected to tensile or extruded stresses, forming multiple fault planes with a few localized contacts between adjacent fault planes. |
| Convergent fault plane |
|
|
Commonly found in the transition area from pullout section to extrusion section, the stress of pullout on both sides is gradually changed to extrusion stress, and multiple fault planes gradually converge into a single fault plane. |
| Branch fault plane |
|
|
Commonly found in the transition region from the extruded section to the pullout section, the stress of extrusion on both sides is gradually changed to pullout stress, and the single fault plane is gradually separated and split into ultiple fault planes. |
Classification of types of fault plane structures.
 well track
  fault plane
  bedrock belt
  fracture belt
  breccia belt
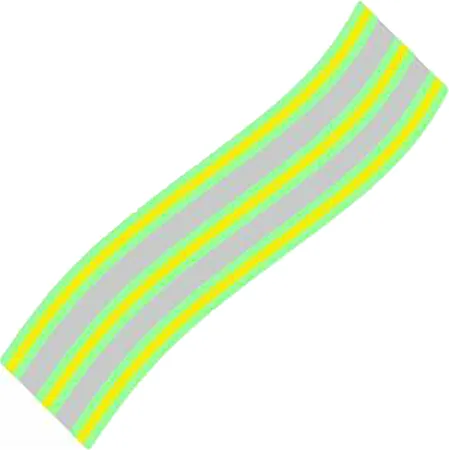
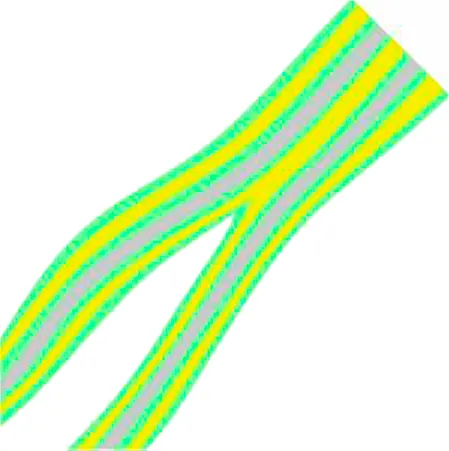
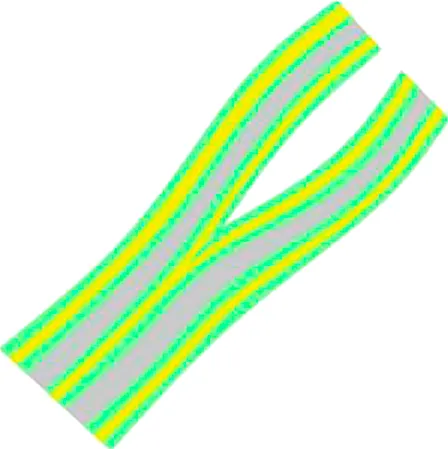
The three-dimensional model of the grille filling structure inside the fault plane is applied. Regardless of how the shape of the fault plane changes, the main step is to find the trend line of the fault plane along the principal stress direction. The trend line is consistent with the shape of the fault plane, and a hierarchical simulation is carried out. First, the first-level bedrock belt needs to be established in the range of the initial contour of the fault plane. The bedrock belt model is established in the entire region. Second, for the second-level crush belt, the trend line tracking algorithm needs to be applied to determine the trend line that is completely consistent with the shape of the fault plane. According to the previous statistical results, the cumulative sampling probability curve is established, and the number and scale of the internal crush belt in the current bedrock belt model are randomly selected. In the vertical principal stress direction, the relative distance from the trend line remains unchanged, and the model is established along the principal stress direction. On the basis of the bedrock belt model, the characterization of the second-level crush belt is completed, and the internal filling model of the fault plane in which the bedrock belt and the crush belt are alternately arranged is established. Regarding how to establish a breccia belt inside the fault plane, refer to the establishment of a crush belt inside the bedrock belt. Here, the random acquisition method is selected to extract the number and scale of the breccia belt inside each crush belt one by one and to ensure that the relative distance from the trend line remains unchanged. A breccia belt is gradually established in the direction of the principal stress, the attribute value of the undefined area of the crush belt is modified, and it is defined as a fracture belt. Then, the descriptions of the breccia belt and the fracture belt are realized, and the third-level simulation is completed. The three-dimensional model of the grille-shaped filling structure in which the bedrock belt, the fracture belt, and the breccia belt are alternately arranged inside the fault plane is established (Figure 9).
FIGURE 9

(a) Three-dimensional model of fault plane, and (b) Visualization of the grille fault plane.
4.3.2 Modeling of cave-like reservoir grille structure
The key to establishing a three-dimensional geological model of the grille filling structure inside a cave-like reservoir is that, compared with the fault plane, the cave-like reservoir is an independent body, and the size of each individual body is different. The number and size of its internal grille structure also vary. It is necessary to identify the independent bodies for each cave-like reservoir and to set the parameters according to its size to characterize the internal grille structure. The main steps of the implementation are described below.
(1) There is no mutual border between adjacent cave-like reservoirs. All of the cave-like reservoirs are assigned initial attribute values, the cave-like reservoirs are scanned grid by grid along the principal stress direction, the initial value of the scanned cave-like reservoirs is modified, the outer boundary neighborhood search algorithm is used to identify adjacent grids (Figure 10; Kirkpatrick et al., 1983), the initial value of the identified effective grid is modified, and starting from the current grid, the algorithm steps are repeated to search for adjacent grids until all of the adjacent grids are changed into a unified value to complete the search for a cave-like reservoir.
(2) The initial contour model is scanned, the cave-like reservoirs are classified by changing the initial value, the effective grids in a single cave-like reservoir are uniformly numbered (Figure 11), a single cave-like reservoir is selected according to the number, and the simulations are carried out one by one.
(3) For a specific single cave-like reservoir, the simulation principle is the same as that for the fault plane reservoir. The core goal of the simulation is to use the trend line tracking algorithm to find the trend line along the principal stress direction. First, the bedrock belt is simulated to complete the first level of characterization. Using the initial contour range defined by the cave-like reservoir, the bedrock belt is depicted, and the bedrock belt model is established. Then, the second-level crush belt is simulated. According to the cumulative sampling probability curve, the number and scale of the crush belts in the current cave-like are determined. The crush belts are expanded along both sides of the trend line along the direction of the principal stress to describe the crush belts and the establishment of the bedrock-fracture belt model is completed. Finally, the third level of the hierarchical simulation divides the crush belt into a breccia belt and fracture belt. Only the division of the breccia belt needs to be completed, and the third level of the simulation can be completed. The characterization of the breccia belt is carried out inside the crush belt. Referring to the characterization of the crush belt inside the bedrock belt, in the interior of each crush belt, according to the scale of the current crush belt, the random algorithm is used to select the number and scale of the internal breccia belt. The relative distance from the trend line remains unchanged, and the breccia belt is characterized along the direction of the principal stress. The undefined area of the crush belt is re-modified to its attribute value, which is defined as the fracture belt, and a grille filling model with alternating arrangement of the bedrock belt, the fracture belt, and the breccia belt inside a single cave-like reservoir is established (Figure 12).
FIGURE 10

(a) Left neighborhood query of the target grid, (b) Layer neighborhood query of the target grid, and (c) Right neighborhood query of the target grid.
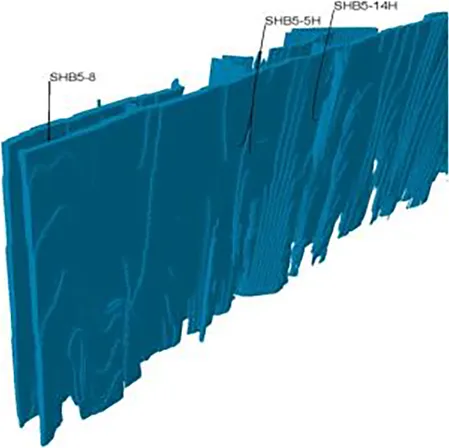
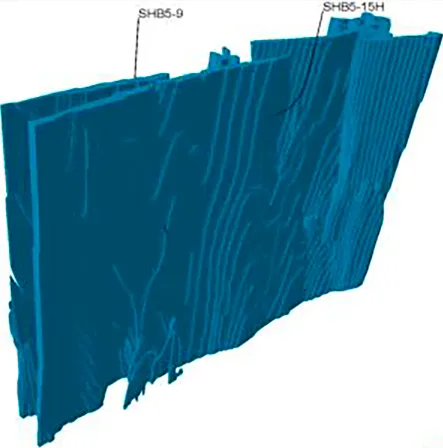
FIGURE 11

Cave-like reservoir numbers: (a) Front view of cave-like reservoir model, and (b) Vertical view of cave-like reservoir model.
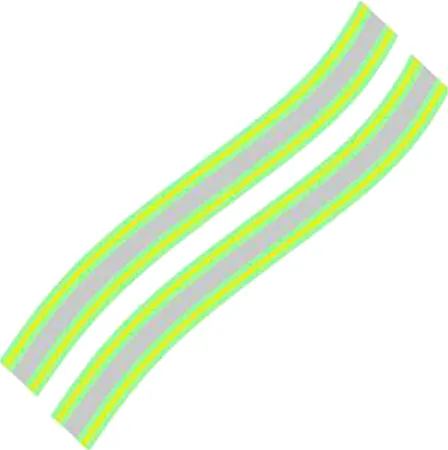
FIGURE 12

Three-dimensional model of a cave-like reservoir: (a) Front view of three-dimensional model, and (b) Vertical view of three-dimensional model.
5 Model calibration
Based on the established grille structural sedimentary facies model of the fault-controlled fracture-cavity reservoir, facies-controlled modeling is carried out via sequential indicator simulation using logging data as the conditional data. The breccia belt has the highest degree of fragmentation and the best porosity and permeability effect. The fracture belt has a medium degree of fragmentation and medium porosity and permeability effect, while the bedrock belt has the worst degree of fragmentation and the worst porosity and permeability effect. In the simulation process, the principle that the different strips have different porosities and permeabilities is adopted. The area with the highest porosity and highest permeability is defined as the breccia belt, the area with medium porosity and medium permeability is defined as the fracture belt, and the area with the lowest porosity and lowest permeability is defined as the bedrock belt. Based on the distribution range of the variation function constraint data, the porosity model, permeability model, and oil saturation model of the study area are established.
Based on the porosity and oil saturation model, the geological reserves are estimated using the volumetric method. The calculation results show that the geological reserves of the study area are 6.5704 million tons, and the dynamic reserves speculated by the developers are 6.3 million tons. The difference between the two is 270,400 tons, and the accuracy rate is 95.71%, indicating that the established geological model effectively reflects the geological analysis results and has a high accuracy. Based on the results of the geological model, the reservoir numerical simulation of the different well groups is performed. The daily pressure and daily production data are fitted. The fitting error is less than 10% (Figure 13), which indicates that the model has a high accuracy and effectively reflects the inter-well connectivity. For example, in Figure 13a, there are still some errors in the fitting process, indicating that the fault-controlled body reservoir has complex heterogeneity, and there are errors in some attribute parameters in the local area of the geological model. It is necessary to further optimize the geological model, improve the matching rate between the model and the actual geological results, and better support the development of oil and gas fields.
FIGURE 13

Numerical simulation history matching: (a) SHB51X bottom hole pressure fitting results, (b) SHB51X daily oil production fitting results, (c) SHB5-17H pressure fitting results, (d) SHB5-17H daily oil production fitting results, (e) SHB5-7H pressure fitting results, and (f) SHB5-7H daily oil production fitting results.
6 Discussion and conclusion
6.1 Discussion
The object-based trend line constraint modeling method proposed in this study shows significant advantages in Shunbei Oilfield, Tarim Basin, China. Compared with the traditional stochastic simulation based on multi-point geostatistics, this method combines the trend line tracking algorithm of principal stress direction with the hierarchical simulation idea, and realizes the accurate characterization of the grille reservoir structure by quantitative analysis of the internal structure of the reservoir. This study’s findings provide a basis for geological modeling of carbonate reservoirs in similar tectonic settings globally. For example, the multi-seismic attribute fusion strategy can be extended to the contouring of reservoirs in other strike-slip fault zones; the trend line tracking algorithm can not only be extended to the special structural geological modeling of other carbonate reservoirs, but also be applied to the directional structural modeling of clastic reservoirs, which provides a universal framework for the fine characterization of complex reservoirs. In the future, this method can also be improved from the following aspects: for the contour carving of the reservoir, multi-attribute collaborative inversion (Wang et al., 2023; Zhdanov et al., 2023; Liu L. et al., 2024) or deep learning technology (Navrátil et al., 2019; Jordao et al., 2022; Liu Z. B. et al., 2024) can be considered to further improve the accuracy of reservoir boundary recognition; for the characterization of the internal structure of the reservoir, it can be considered to combine the production dynamic data (Li et al., 2021; Zhumabekov et al., 2022; Li and Mohammad, 2023), such as pressure monitoring, tracer testing, etc., to further constrain the establishment of the internal structure of the reservoir, realize the geological-dynamic dual control modeling, improve the accuracy of the model, and provide more reliable technical support for the efficient development of oil and gas fields.
6.2 Conclusion
Fault-controlled carbonate fracture-cavity reservoirs have developed within the Shunbei No.5 strike-slip fault zone. The main types of reservoirs include fault plane, cave-like, and disordered body reservoirs. These different types of reservoirs have different manifestations on seismic profiles. Their different seismic attributes can be used to characterize them. The structure tensor attribute body is used to characterize the fault plane reservoir, the coherent energy gradient attribute body is used to characterize the cave-like reservoir, and the variance attribute body is used to characterize the disordered body reservoir. Based on the data of drilling leakage and emptying events, the deterministic modeling method can be used to establish a contour model of the fault plane and cave-like reservoirs. Inside, the grille filling structure characterized by alternating arrangement of the crush belt and the bedrock belt is developed. Based on the resistivity logging curve, the identification of the reservoir belt can be completed, and the hundred-meter filling development model diagram of the fault plane and the cave-like interior can be established to guide the establishment of a fine three-dimensional geological model of the fault-controlled body. The object-based modeling method is adopted to determine the trend line of the reservoir development by judging the number of grids. With this trend line as the constraint, using the hierarchical modeling method, the bedrock belt without fractures is taken as the first level, the crush belt containing fractures is taken as the second level, and the breccia belt with the highest degree of fracturing inside the crush belts is taken as the third level. According to the hierarchical level, the three-dimensional model of the grille filling structure inside the fault plane and cave-like reservoirs is established. The modeling framework presented herein offers a valuable guide for constructing 3D geological models of fracture-cavity reservoirs in other fault zones across the Shunbei Oilfield, Tarim Basin, China, thereby supporting enhanced oil and gas production and development strategies.
Statements
Data availability statement
The original contributions presented in the study are included in the article/supplementary material, further inquiries can be directed to the corresponding author.
Author contributions
BL: Conceptualization, Formal Analysis, Methodology, Resources, Visualization, Writing – original draft, Writing – review and editing. YH: Data curation, Investigation, Project administration, Writing – original draft. WC: Conceptualization, Supervision, Validation, Writing – original draft, Writing – review and editing. HS: Software, Writing – original draft. LW: Funding acquisition, Methodology, Writing – original draft.
Funding
The author(s) declare that financial support was received for the research and/or publication of this article. This research was funded by Open Fund of Key Laboratory of Exploration Technologies for Oil and Gas Resources (Yangtze University), Ministry of Education (NO K2023-06).
Conflict of interest
Authors BL and YH were employed by Sinopec Northwest Oil Field Company. Author WC was employed by Jiangsu Oilfield Company, No. 2 Oil production Plant.
The remaining authors declare that the research was conducted in the absence of any commercial or financial relationships that could be construed as a potential conflict of interest.
Generative AI statement
The author(s) declare that no Generative AI was used in the creation of this manuscript.
Publisher’s note
All claims expressed in this article are solely those of the authors and do not necessarily represent those of their affiliated organizations, or those of the publisher, the editors and the reviewers. Any product that may be evaluated in this article, or claim that may be made by its manufacturer, is not guaranteed or endorsed by the publisher.
References
1
Chen P. Neng Y. Wu X. Huang C. Wang L. Y. Guo M. (2023). Stratification and segmentation characteristics and tectonic evolution of Shunbei No.5 strike⁃slip fault zone in Tarim Basin. Xinjiang Pet. Geol.44, 33–42. 10.7657/XJPG20230105
2
Chen S. Y. He Y. F. Wang L. X. Shang H. J. Yang X. R. Yin Y. S. (2024). Architecture characterization and 3D geological modeling of Ordovician carbonate reservoirs in Shunbei No. 1 fault zone, Tarim Basin. Lithol. Reserv.36, 124–135. 10.12108/yxyqc.20240212
3
Choquette P. W. Pray L. C. (1970). Geologic nomenclature and classification of porosity in sedimentary carbonates. AAPG Bull.54, 207–250. 10.1306/5D25C98B-16C1-11D7-8645000102C1865D
4
Deng X. L. Chang S. Y. Liu Z. L. Wang M. X. Chen J. J. Du Y. F. (2024). Concept, geological model and seismic characterization of ultra-deep fault-fracture bodies. Oil Geophys. Prospect.59, 1099–1110. 10.13810/j.cnki.issn.1000-7210.2024.05.022
5
Deng X. L. Chen J. J. Cao P. Zhang Y. T. Luo X. Chang S. Y. et al (2023). Segmentation and lateral growth of intracratonic strike-slip faults in the northern Tarim Basin, NW China: influences on Ordovician fault-controlled carbonate reservoirs. Front. Earth Sci.11, 1255162. 10.3389/feart.2023.1255162
6
Deng Z. Y. Zhou D. S. Kang Z. J. Dong H. Z. (2024). Deep learning-based dynamic forecasting method and application for ultra-deep fractured reservoir production. Front. Energy Res.12, 1369606. 10.3389/fenrg.2024.1369606
7
Duan T. Z. Zhang W. B. He Z. L. Liu Y. F. Ma Q. Q. Li M. et al (2023). Deep learning-based geological modeling of ultra-deep fault-karst reservoirs in Shunbei oilfield, Tarim Basin. Oil and Gas Geol.44, 203–212. 10.11743/ogg20230117
8
Duan T. Z. Zhang W. B. Lu X. B. Li M. Zhao H. W. Shang X. F. (2020). Architectural characterization of Ordovician fault-controlled paleokarst carbonate reservoirs, Tahe Oilfield, China. Interpretation8, T953–T965. 10.1190/INT-2019-0012.1
9
Garland J. Neilson J. Laubach S. E. Whidden K. J. (2012). Advances in carbonate exploration and reservoir analysis. Adv. Carbonate Explor. And Reserv. Analysis370, 1–15. 10.1144/SP370.15
10
Gong L. Liu K. Q. Ju W. (2023). Editorial: advances in the study of natural fractures in deep and unconventional reservoirs. Front. Earth Sci.10, 1096643. 10.3389/feart.2022.1096643
11
Han J. Kuang A. P. Neng Y. Huang C. Li Q. Q. Chen P. et al (2021). Vertical layered structure of Shunbei No.5 strike⁃slip fault zone and its significance on hydrocarbon accumulation. Xinjiang Pet. Geol.42, 152–160. 10.7657/XJPG20210204
12
He Z. L. Ma Y. S. Zhu D. Y. Duan T. Z. Geng J. H. Zhang J. T. et al (2021a). Theoretical and technological progress and research direction of deep and ultra-deep carbonate reservoirs. Oil and Gas Geol.42, 533–546. 10.11743/ogg20210301
13
He Z. L. Sun J. F. Guo P. H. Wei H. H. Lv X. R. Han K. L. (2021b). Construction method of carbonate reservoir knowledge base and its application in fracture-cavity reservoir geological modeling. Petroleum Explor. Dev.48, 710–718. 10.11698/PED.2021.04.04
14
He Z. L. Zhao X. Y. Zhang W. B. Lv X. R. Zhu D. Y. Zhao L. X. et al (2023). Progress and direction of geological modeling for deep and ultra-deep carbonate reservoirs. Oil and Gas Geol.44, 16–33. 10.11743/ogg20230102
15
Ji B. Y. Zheng S. Q. Gu H. (2022). On the development technology of fractured-vuggy carbonate reservoirs: a case study on Tahe oilfield and Shunbei oil and gas field. Oil and Gas Geol.43, 1459–1465. 10.11743/ogg20220614
16
Jia A. L. Yan H. J. Tang H. F. Wang Z. N. Liu Q. M. (2024). Key technologies and countermeasures for deep and ultra-deep gas reservoir development in China. Nat. Gas. Ind.44, 119–127. 10.3787/j.issn.1000-0976.2024.01.011
17
Jiao F. Z. (2018). Significance and prospect of ultra-deep carbonate fault-karst reservoirs in Shunbei area, Tarim Basin. Oil and Gas Geol.39, 207–216. 10.11743/ogg20180201
18
Jordao H. Azevedo L. Sousa A. J. Soares A. (2022). Generative adversarial network applied to ore type modeling in complex geological environments. Math. Geosci.54, 1165–1182. 10.1007/s11004-022-10008-y
19
Kadlec B. J. Dorn G. A. Tufo H. M. Yuen D. A. (2008). Interactive 3-D computation of fault surfaces using level sets. Vis. Geosci.13, 133–138. 10.1007/s10069-008-0016-9
20
Kargupta H. Datta S. Wang Q. Sivakumar K. (2003). On the privacy preserving properties of random data perturbation techniques. IEEE, 99–106. 10.1109/ICDM.2003.1250908
21
Kirkpatrick S. Gelatt C. D. J. Vecchi M. P. (1983). Optimization by simulated annealing. Science220, 671–680. 10.1126/science.220.4598.671
22
Li D. J. Zhao Z. F. Wang B. Yang H. T. Cui W. H. Ruan J. Y. et al (2021). Study on production optimization method of fractured reservoir based on connectivity model. Front. Earth Sci.9, 767738. 10.3389/feart.2021.767738
23
Li J. Chen G. P. Zhang B. Hong L. Han Q. F. (2019). Structure and fracture-cavity identification of epimetamorphic volcanic-sedimentary rock basement reservoir: a case study from central Hailar Basin, China. Arabian J. Geosciences12, 64. 10.1007/s12517-018-4221-z
24
Li Y. P. Mohammad R. S. (2023). Integrate inter-well connectivity data with static reservoir models based on Bayesian formalism. Petroleum Res.8, 433–438. 10.1016/j.ptlrs.2023.01.003
25
Li Y. T. Deng S. Zhang J. B. Lin H. X. Liu Y. Q. Qiu H. B. et al (2023). Fault zone architecture of strike-slip faults in deep, tight carbonates and development of reservoir clusters under fault control: a case study in Shunbei, Tarim Basin. Earth Sci. Front.30, 80–94. 10.13745/j.esf.sf.2023.2.32
26
Liu B. Z. (2020). Analysis of main controlling factors of oil and gas differential accumulation in Shunbei area, Tarim Basin - taking Shunbei No.1 and No.5 strike slip fault zones as examples. China Pet. Explor.25, 83–95. 10.3969/j.issn.1672-7730.2020.03.008
27
Liu B. Z. Qi L. X. Li Z. J. Liu J. Huang C. Yang L. et al (2020). Spatial characterization and quantitative description technology of ultra-deep fault-karst reservoirs in the Shunbei area. Acta Pet. Sin.41, 412–420. 10.7623/syxb202004004
28
Liu J. Gong W. Huang C. Li W. Li H. Y. Dong X. B. et al (2022). Seismic attribute characteristics of an ultradeep fractured-reservoir in the northern section of Shunbei No.5 strike-slip fault zone in Tarim Basin. Bull. Geol. Sci. Technol.41, 1–11. 10.19509/j.cnki.dzkq.2022.0112
29
Liu J. Liao M. H. Wang L. Y. Gong W. Huang C. Zha M. (2023). Static connectivity evaluation on Fault⁃Controlled reservoir system in the middle section of Shunbei No.4 fault zone, Shunbei oilfield. Xinjiang Pet. Geol.44, 456–464. 10.7657/XJPG20230410
30
Liu L. Li T. B. Ma C. C. (2024). Research on 3D geological modeling method based on deep neural networks for drilling data. Appl. Sciences-Basel14, 423. 10.3390/app14010423
31
Liu Z. B. Zhu J. M. Tian B. Zhang R. Fu Y. H. Liu Y. et al (2024). A novel seismic inversion method based on multiple attributes and machine learning for hydrocarbon reservoir prediction in Bohai Bay Basin, Eastern China. Front. Earth Sci.12, 1498164. 10.3389/feart.2024.1498164
32
Lu X. B. Yang M. Wang Y. Bao D. Cao F. Yang D. B. (2018). Geological characteristics of 'strata-bound' and 'fault-controlled' reservoirs in the northern Tarim Basin: taking the Ordovician reservoirs in the Tahe Oil Field as an example. Petroleum Geol. and Exp.40, 461–469. 10.11781/sysydz201804461
33
Ma Y. S. Cai X. Y. Li H. L. Zhu D. Y. Zhang J. T. Yang M. et al (2023). New insights into the formation mechanism of deep-ultra-deep carbonate reservoirs and the direction of oil and gas exploration in extra-deep strata. Earth Sci. Front.30, 001–013. 10.13745/j.esf.sf.2023.2.35
34
Ma Y. S. Cai X. Y. Yun L. Li Z. J. Li H. L. Deng S. et al (2022). Practice and theoretical and technical progress in exploration and development of Shunbei ultra-deep carbonate oil and gas fields, Tarim Basin, NW China. Petroleum Explor. Dev.49, 1–17. 10.11698/PED.2022.01.01
35
Ma Y. S. He Z. L. Zhao P. R. Zhu H. Q. Han J. You D. H. et al (2019). A new progress in formation mechanism of deep and ultra-deep carbonate reservoirs. Acta Pet. Sin.40, 1415–1425. 10.7623/syxb201912001
36
Mao D. F. He D. F. Chen J. J. Tian F. L. (2023). Geometry characteristics and genesis of No.18 strike-slip faults in shunnan area, Tarim Basin, SW China. Earth Sci.48, 2151–2167. 10.3799/dqkx.2023.065
37
Moses O. O. (2009). Improving the performance of bubble sort using a modified diminishing increment sorting. Acad. Journals4, 740–744. 10.5897/SRE.9000575
38
Navrátil J. King A. Rios J. Kollias G. Torrado R. Codas A. (2019). Accelerating physics-based simulations using end-to-end neural network proxies: an application in oil reservoir modeling. Front. Big Data2, 33. 10.3389/fdata.2019.00033
39
Neupane B. (2023). Editorial: advances in exploration and exploitation of deep and ultra-deep shale oil and gas. Front. Earth Sci.11, 1205217. 10.3389/feart.2023.1205217
40
Ning F. Lin H. X. Zhou C. J. Yun J. B. Li P. Song H. M. (2022). Characteristics of strike-slip fault-related reservoirs and the significance for hydrocarbon accumulation in the central Tarim Basin: insights from the modern karst model. Front. Earth Sci.10, 987020. 10.3389/feart.2022.987020
41
Qiu H. B. Deng S. Cao Z. C. Yin T. Zhang Z. P. (2019). The evolution of the complex anticlinal belt with crosscutting strike-slip faults in the central Tarim Basin, NW China. Tectonics38, 2087–2113. 10.1029/2018TC005229
42
Shekhar R. Sahni I. Benson G. Agar S. Amour F. Tomás S. et al (2014). Modelling and simulation of a jurassic carbonate ramp outcrop, amellago, high atlas mountains, Morocco. Pet. Geosci.20, 109–123. 10.1144/petgeo2013-010
43
Wang Q. H. Yang H. J. Wang R. J. Li S. Y. Deng X. L. Li Y. et al (2021). Discovery and exploration technology of fault-controlled large oil and gas fields of ultra-deep formation in strike slip fault zone in Tarim Basin. China Pet. Explor.26, 58–71. 10.3969/j.issn.1672-7703.2021.04.005
44
Wang Y. D. Xu Y. G. Du L. B. Gai S. S. Yu W. Z. Huang X. R. (2023). DFN modelling constrained by multiple seismic attributes using the steering pyramid technology. Front. Earth Sci.11, 1257481. 10.3389/feart.2023.1257481
45
Xie P. F. Hou J. G. Wang Y. Zhang H. T. Lv X. R. Li H. K. et al (2023). Application of multi-information fusion modeling of fracture-vuggy reservoir in Ordovician reservoir of 12th block in Tahe Oilfield. J. China Univ. Petroleum Ed. Nat. Sci.47, 1–14. 10.3969/j.issn.1673-5005.2023.03.001
46
Xu J. Feng D. M. Wu J. Cui Z. M. (2009). Robust centerline extraction for tree-like blood vessels based on the region growing algorithm and level-set method. IEEE, 586–591. 10.1109/FSKD.2009.916
47
Yuan H. W. Chen S. P. Neng Y. Zhao H. B. Xu S. D. Wang X. P. et al (2021). Composite strike-slip deformation belts and their control on oil and gas reservoirs: a case study of the northern part of the Shunbei 5 strike-slip deformation belt in Tarim Basin, northwestern China. Front. Earth Sci.9, 755050. 10.3389/feart.2021.755050
48
Zhang W. B. Duan T. Z. Li M. Zhao H. W. Shang X. F. Wang Y. (2021). Architecture characterization of Ordovician fault-controlled paleokarst carbonate reservoirs in Tuoputai, Tahe oilfield, Tarim Basin, NW China. Petroleum Explor. Dev.48, 367–380. 10.1016/s1876-3804(21)60029-0
49
Zhang W. B. Zhang Y. X. Duan T. Z. Li M. Zhao H. W. Wang Y. (2022). Hierarchy modeling of the Ordovician fault-karst carbonate reservoir in Tuoputai area, Tahe oilfield, Tarim Basin, NW China. Oil and Gas Geol.43, 207–218. 10.11743/ogg20220117
50
Zhang Y. Li H. Y. Chen X. P. Bu X. Q. Han J. (2022). Practice and effect of geology-engineering integration in the development of ultra-deep fault-controlled fractured-vuggy oil/gas reservoirs, Shunbei area, Tarim Basin. Oil and Gas Geol.43, 1466–1480. 10.11743/ogg20220615
51
Zhang Y. Mao Q. Y. Li H. Y. Li Z. J. Han J. Lin B. (2023). Characteristics and practical application of ultra-deep fault-controlled fractured cavity type reservoir in central Shunbei area. China Pet. Explor.28, 1–13. 10.3969/j.issn.1672-7703.2023.01.001
52
Zhang Y. D. Fang H. Liu S. Q. Zhang J. M. Li X. G. Sun N. D. et al (2023). Process and development direction of deep oil and gas exploration and development. World Pet. Ind.30, 12–20. 10.20114/j.issn.1006-0030.20230922001
53
Zhdanov M. S. Jorgensen M. Tao M. (2023). Probabilistic approach to Gramian inversion of Multiphysics data. Front. Earth Sci.11, 1127597. 10.3389/feart.2023.1127597
54
Zhou C. N. Hou L. H. Hu S. Y. Zhu R. K. Liu S. B. Yang Z. et al (2014). Prospect of ultra-deep petroleum onshore China. Energy Explor. and Exploitation32, 19–40. 10.1260/0144-5987.32.1.19
55
Zhumabekov A. K. Liu Z. Portnov V. S. Wei X. Chen X. (2022). Integrating the geology, seismic attributes, and production of reservoirs to adjust interwell areas. Russ. Geol. And Geophys.63, 856–868. 10.2113/RGG20214343
Summary
Keywords
Tarim Basin, Ordovician system, strike-slip fault zone, fault-controlled fracture-cavity reservoir, geological modeling algorithm
Citation
Li B, He Y, Chen W, Shang H and Wang L (2025) Geological modeling of carbonate fracture-cavity reservoir: case study of Shunbei fault zone No. 5. Front. Earth Sci. 13:1559030. doi: 10.3389/feart.2025.1559030
Received
11 January 2025
Accepted
31 March 2025
Published
16 April 2025
Volume
13 - 2025
Edited by
Yuming Liu, China University of Petroleum, China
Reviewed by
Siti Nur Fathiyah Jamaludin, University of Technology Petronas, Malaysia
Jiagen Hou, China University of Petroleum, China
Updates
Copyright
© 2025 Li, He, Chen, Shang and Wang.
This is an open-access article distributed under the terms of the Creative Commons Attribution License (CC BY). The use, distribution or reproduction in other forums is permitted, provided the original author(s) and the copyright owner(s) are credited and that the original publication in this journal is cited, in accordance with accepted academic practice. No use, distribution or reproduction is permitted which does not comply with these terms.
*Correspondence: Lixin Wang, wlx@yangtzeu.edu.cn
Disclaimer
All claims expressed in this article are solely those of the authors and do not necessarily represent those of their affiliated organizations, or those of the publisher, the editors and the reviewers. Any product that may be evaluated in this article or claim that may be made by its manufacturer is not guaranteed or endorsed by the publisher.