 Lijun Guan
 Ting Xiong
- Shenzhen Branch of CNOOC (China) Co., Ltd., Shenzhen, Guangdong, China
Aiming at the characteristics of random lithology distribution, complex joint structures, low porosity and low permeability of key oil and gas blocks such as Kaiping, Baiyun, Xijiang and Huizhou in the South China Sea, a series of complete digital core collection schemes are implemented in this study to thoroughly analyze the densification mechanism of low permeability reservoirs. Advanced technologies are widely used in this scheme, including full-diameter dual-energy core CT imaging, micron-scale multi-scale CT imaging, focused ion beam scanning electron microscope (FIB-SEM) and quantitative analysis of mineral components. The integrated application of these technologies comprehensively analyzes rock samples from macro to micro scales, reveals their sedimentology, diagenesis and reservoir properties, and provides quantitative identification and characterization of rock lithology, mineral composition, pore structure and fracture system. The results show that the density of the reservoir gradually increases and tends to stabilize with increasing burial depth, while the tectonic joints within the reservoir become more developed, the porosity of the core decreases, and the pore size of the natural fractures also tends to decrease. This study quantitatively analyzed the petrophysical parameters such as lithology, porosity, fractures and minerals of the reservoirs, revealed the micro-development laws of the dominant reservoirs in the depressions in the eastern part of the South China Sea, and provided the scientific basis for the practice of oil and gas exploration and development, which is of important scientific ṣand practical application value for promoting the progress of oil and gas exploration technology.
1 Introduction
In oil and gas exploration and geological research, in-depth analysis of the internal structure and properties of rock samples is critical to improving exploration efficiency and the success rate of resource development (Tan et al., 2024a; Tan et al., 2024b; Huang et al., 2023a; Fu et al., 2024). However, the limitation of traditional rock analysis methods lies in their qualitative observation at the macro level, which is difficult to meet the high demands of modern geology for accurate and quantitative data as well as data collection in large quantities (Huang et al., 2023b; Zhang F. S. et al., 2022; Zheng et al., 2022). Accompanied by advances in computed tomography (CT) technology, CT scanning has become a key tool for the observation and analysis of the internal structure of rocks, capable of providing high-resolution, three-dimensional images of rock interiors, thus offering new perspectives for the study of rock lithology, mineral composition, pore structure and fracture systems (Lang et al., 2024; Huang et al., 2020).
In recent years, scholars have begun to utilize CT scanning technology to explore the distribution pattern of cracks inside rock specimens, and achieving significant progress in the field (Ishola and Vilcáez, 2024; Liu S. et al., 2023; Song et al., 2021; Huang et al., 2018; Youjun et al., 2015). For instance, Zhao et al. executed multistage cyclic loading of rock salt with constant stress intervals under uniaxial compression conditions, followed by acoustic emission monitoring and tomographic CT scanning to assess damage evolution during loading (Zhao K. et al., 2022; Huang et al., 2025). Kazem et al. conducted quantitative and qualitative studies of lithology and rock type of more than 250 samples of carbonates and sandstones, and based on the combination of CT with porosity and particle density values, Reservoir rock lithologies were determined (Saadat and Rahimpour-Bonab, 2023). Xing et al. proposed a new high-efficiency attention super-resolution transformer model to achieve two objectives: a wide imaging field of view and high-resolution CT scan images of rocks (Xing et al., 2024). Liu et al. used computed micro-tomography (micro-CT) to reconstruct a 3D pore model of the samples at depths ranging from 2,283 to 3757 m (Liu C. et al., 2023). Azadeh et al. conducted a comprehensive investigation of core permeability anisotropy, drawing upon high-resolution 3D structural information derived from whole-core CT images (Aghanjanpour and Berg, 2024). A multifaceted approach that integrated computed tomography CT scanning imaging with experimental measurements from petrography and core submergence is employed. This integration enabled direct visualization of geometry, description of pore structure, and calculation of concentration distribution (Iraji et al., 2023). At present, there is a plethora of studies based on computed tomography (CT) scanning. However, the majority are confined to the exploration of the structure and pore distribution of the specimens. Furthermore, there is a paucity of research that combines full-diameter and micron CT scanning techniques and considers the microfracture and mineral distribution of the specimens to investigate the lithological distribution, joint distribution, and densification mechanism of the target reservoirs in the deep earth. Full-diameter CT scanning, micron CT scanning, electron microscope scanning, and mineral composition analysis of deep unconventional oil and gas reservoirs are critical for achieving “precision development.” These techniques facilitate comprehension of reservoir characteristics from macro to micro, enable quantification of key parameters, and provide a scientific foundation for optimizing the reservoir modification plan. This is of great significance for improving the exploration and development efficiency of deep unconventional oil and gas resources, reducing costs, and achieving sustainable development.
Accordingly, a series of advanced CT scanning techniques were utilized in this study to comprehensively analyze rock specimens from different geological blocks. These techniques included dual-energy CT scanning of full-diameter cores, multi-scale micron-scale CT scanning, focused ion beam-scanning electron microscopy (FIB-SEM), and quantitative mineral composition analysis. The integration of these technologies enables the quantification and visualization of mineral development characteristics, pore throat development characteristics, and the relationship between different lithological configurations of the rock specimens from macro to micro scales. This facilitates the exploration of the micro-development law of the target reservoirs and their complex genesis and control factors. The findings of this study are expected to provide precise and efficient data support for geology, leading to substantial improvements in exploration success rates and resource extraction efficiency. Additionally, the scientific and practical applications of this study are significant in promoting advancements in oil and gas exploration technology.
2 Test equipment and specimen preparation
The key reservoirs in Kaiping, Baiyun, Xijiang, Huizhou, and other blocks in Guangzhou Province present obvious physical differences among the Paleocene strata, large spans of pore seepage distribution, large physical differences between the sweet 单击或点击此处输入文字。spot section and the dense section, as well as uneven distributions of lithological thickness and complex contact relationships (Fu et al., 2021; Luo et al., 2022; Huang et al., 2022; Huang et al., 2024). To elucidate the petrographic deposition, diagenesis, and reservoir characteristics of these reservoirs, the present study utilizes target reservoir specimens to assess petrophysical parameters of petrographic properties, pore space, cracks, and minerals. This approach involves conducting qualitative and quantitative analyses to reveal the micro development law of the dominant reservoirs in each depression within the eastern part of Nanhai. The qualitative and quantitative analyses were carried out to clarify the micro-development patterns of the dominant reservoirs in the depressions in the eastern part of the South China Sea.
When an X-ray traverses a given substance, it interacts with its constituent atoms, leading to energy attenuation. By measuring the X-rays that traverse the cross-section of the material, the position of the material fault space can be calculated using a specific reconstruction method (Li et al., 2022; Gou et al., 2021). Consequently, the spatial structure information of the object can be obtained. Therefore, whole core CT scanning can intuitively observe the spatial distribution of physical features such as laminations and cracks within the core and analyze the non-homogeneity of the core. The scanning voltage of the whole core CT scanner instrument utilized in this study was 100 kV for low energy and 140 kV for high energy. The scanning resolution was 0.2734 × 0.2734 × 0.6000 mm, the image size was 280 × 280 mm, the number of image bits was 16 bits unsigned, and the image display range was 1,024∼5100 HU. The calibration function was y = a+bx (where a = −1,024, b = 1). The full core CT scanner is shown in Figure 1a.
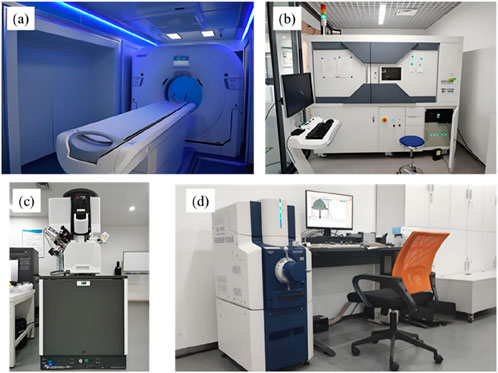
Figure 1. Test equipment. (a) Full diameter core dual-energy CT scanner; (b) Micron CT scanner; (c) Focused ion beam - scanning electron microscope; (d) Mineral composition quantitative analyzer.
The dual-energy CT inversion is calculated by decoupling the photoelectric effect and the Compton scattering effect through high- and low-energy X-ray scanning. The relationship between the known core electron density, effective atomic number, and CT number is shown in Equations 1, 2:
In this study, the statistical model coefficients A, B, C, D, and E, along with the effective atomic number exponent n, which is set at 3.6, are considered. CT images at 100 kV and 140 kV were obtained by scanning the scalar model, which is a core with known bulk density and effective atomic number. The five coefficients of the statistical model were fitted, and the CT number of the unknown core was substituted to obtain the density and effective atomic number.
A comprehensive evaluation of the lithology of the specimen was conducted through the implementation of whole-core CT scanning. Subsequently, a three-dimensional stereo model of the specimen was meticulously reconstructed through the employment of micrometer-level CT scanning. This approach enabled the unveiling of the intricate pore structure and the relative density size of the specimen. The scanning voltage of the micron-level CT scanning instrument is 20∼190 kV, and the pixel size is 0.5∼20 μm. The instrument is shown in Figure 1b. The X-ray attenuation equation is:
The X-ray attenuation equation is shown in Equation 3:
where I is the intensity of the X-rays after they pass through the substance, I0 is the initial intensity of the X-rays, µ is the linear attenuation coefficient of the substance, and d is the thickness of the substance. This equation delineates the attenuation of X-rays as they traverse the substance.
The continuous X-ray attenuation equation is shown in Equation 4:
This is an attenuation formula in continuous form, where L denotes the path of the X-rays. The porosity formula is shown in Equation 5:
In this formula, Vp denotes the pore volume and Vb represents the total volume of the rock. The ratio of all pore volumes within the rock to the total rock volume is indicated by this calculation. The pixel porosity is calculated as Equation 6:
where Np denotes the total number of pore pixels in the CT map and Nb signifies the total number of rock skeleton pixels in the map.
To thoroughly analyze the distribution of pores and cracks in the specimens, focused ion beam scanning electron microscopy (FIB-SEM) was employed in this study. This technique integrates the precise processing capability of the focused ion beam with the high-resolution imaging function of the scanning electron microscope, enabling the acquisition of three-dimensional stereoscopic imaging of the specimen’s interior. The FIB-SEM instrument is depicted in Figure 1c.
The focal point of the FIB-SEM system is the utilization of liquid metal gallium (Ga) as an ion source, in conjunction with the precise focusing of the ion beam to the nanometer level through electrostatic lenses (Liu et al., 2024; Sethi et al., 2023). This enables the precise processing of material surfaces. The FIB technology facilitates a range of operations, including stripping, deposition, injection, cutting, and modification of materials (Subbotina et al., 2023; Zhang B. et al., 2022). Concurrently, the secondary electron microscope (SEM) utilizes an electron beam to scan the specimen’s surface and collects the scattered electrons to produce a high-resolution image of the surface of specimens. The FIB-SEM dual-beam system is typically composed of two components: a focused ion beam and a scanning electron microscope. The ion beam is utilized for nanoscale cutting, etching, or deposition of the specimen surface, while the electron beam is employed to acquire high-resolution images of the surface topography. This integrated operation enables the user to perform micromachining while monitoring the process in real time, facilitating precise specimen preparation and topographic observation (Cao et al., 2023; Medina et al., 2022).
Focused ion beam (FIB) technology utilizes a deflection system to focus an ion beam spot to sub-micron or even nanometer size, thereby achieving micro-fine beam processing. Scanning electron microscope (SEM) technology involves the use of high-energy electrons and material interactions in the specimen to produce a variety of information, such as secondary electrons, back-scattered electrons, Rochelle electrons, X-rays, cathodoluminescence, absorbed electrons, and transmitted electrons, among others. The signals are subsequently processed by the detector, and the signals from the probe machine are arranged in order according to the video signal. Following amplification, these signals are used to adjust the brightness of the light point. The formation of the scanning electron microscope image is achieved through focused ion beam scanning electron microscope imaging of the ion beam on the surface of the specimen. This process enables the creation of slices of a fixed thickness, with hundreds or even thousands of images of the 3D superposition of the formation of three-dimensional electron microscope images.
It has been demonstrated that backscattered two-dimensional large-area scanning electron microscope (SEM) imaging is capable of exhibiting the condition of the core image of a large area at pore-level resolution (Kimayim Gaduwang et al., 2024; Tuzingila et al., 2024; Ravazzoli et al., 2024). This technique facilitates the recognition of rocks at multiple scales, thereby enabling a comprehensive understanding of rock properties. Furthermore, it enables the study of the correlation relationship between rock particles and pores, as well as the distribution characteristics of organic matter and organic pores at various scales. The theoretical calculation formula for the diameter of the electron beam spot is shown in Equation 7:
where d is the beam spot size of the convergence point of the electron source under ideal conditions after imaging by the electromagnetic lens, λ is the electron wavelength, α is the tensor angle of the convergence of the electron beam, CS is the spherical aberration coefficient of the electron microscope, and CC is the chromatic aberration coefficient. This formula describes the relationship between the electron beam spot size and parameters such as electron wavelength, spherical aberration coefficient, and chromatic aberration coefficient.
The formula for SEM magnification is shown in Equation 8:
In this formula, M signifies the magnification, Ac denotes the side length of the image on the phosphor screen, and As represents the scanning amplitude of the electron beam on the specimen. This formula illustrates how the SEM can adjust the magnification by changing the scanning amplitude and the phosphor screen size.
The formula for calculating depth of field under SEM is shown in Equation 9:
In this equation, Ff denotes the depth of field, d0 represents the scanning image resolution, α signifies the aperture angle of the electron beam, and β designates the scanning electron beam divergence. This equation delineates the relationship between the depth of field of the SEM and the resolution and electron beam divergence.
Gallium (Ga) is a prevalent component in liquid metal ion sources (LMIS) utilized in field-emission microscopes (FIBs). This material’s properties, including its low melting point (30°C), liquid phase at ambient temperature, and low vapor pressure in high vacuum environments, render it particularly well-suited for these applications. When subjected to an electric field, gallium forms a Taylor-Gilbert cone at the tip of a tungsten needle. This conical structure is a manifestation of a liquid’s behavior under a strong electric field. The geometry of this cone can be expressed by the Equation 10:
where R is the radius of curvature of the cone, ρ is the density of the liquid, η is the viscosity coefficient of the liquid, ϵ0 is the vacuum capacitance, and ϵ is the relative capacitance of the liquid.
A quantitative analysis of mineral composition is imperative to reveal the rock deposition, diagenesis, and reservoir characteristics of the target reservoir. On the basis of the above physical experiments, this study also supplemented the mineral composition analysis to deeply explore the densification mechanism of deep unconventional reservoirs (Yuejiao et al., 2021; Bian et al., 2023). The quantitative analysis of mineral composition is performed by scanning the surface of a specimen with a high-energy electron beam accelerated along a predefined raster scanning pattern. This process produces a color map of the embedded characteristics of the mineral assemblage. The instrument emits an X-ray spectrum, thereby providing information on the elemental content at each measurement point. By integrating the gray scale of the backscattered electron image with the intensity of the X-rays, the elemental content can be derived and converted into a mineral phase (Lei et al., 2022; Yang et al., 2024).
By employing face scanning technology on the specimen surface, the calculation and acquisition of all parameters related to mineral structural features can be facilitated. These parameters encompass mineral particle morphology, mineral embedding characteristics, mineral dissociation, elemental fugacity, porosity, and matrix density. The subsequent processing of the data entails the integration of multiple mineral phases into mineral aggregates, the decomposition of the mixed spectrum (boundary phase processing), image filtration, and the classification of particles. The quantitative analysis results can be generated for any specimen selected for study, as well as for individual particles or particles that are similar in chemical composition or structural characteristics (grain size, rock type, etc.) (He et al., 2019; Zhao Z. et al., 2022).
In this study, a simultaneous scanning technique was employed, whereby standard specimens were scanned alongside the core specimens to facilitate the scanning process and provide a calibration reference for subsequent data processing. The standard specimens employed in this study encompassed pure water, glass, plexiglass, 6061 aluminum alloy, and organic plastics. These specimens were selected to encompass a broad spectrum of physical and chemical properties, ensuring the general applicability and accuracy of the data processing parameters. By accurately scanning these standard specimens, we were able to calibrate and optimize data processing algorithms, thereby enhancing the overall quality and reliability of the data.
In summary, for the well wall cores and drilling cores of the Paleoproterozoic target layers in Kaiping, Huizhou and Baiyun blocks, this study systematically carries out three-dimensional multiscale CT scanning, including CT scanning of drilling cores, micro- and nanoscale CT core scanning of representative specimens, focused ion beam scanning electron microscopy (FIBES), as well as quantitative analysis and testing of the mineral compositions. A total of 226 specimens were collected and analyzed in four batches of specimens, each batch of specimens coming from different geological blocks to ensure the representativeness and comprehensiveness of the research results. The sources of specimen batches are shown in Table 1.
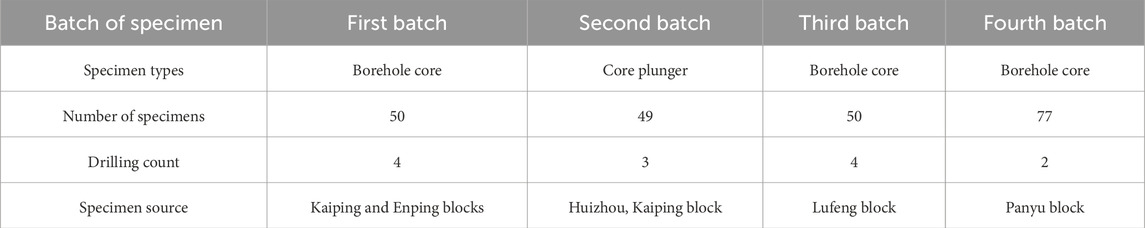
Table 1. Test specimen batch and corresponding source.
3 Analysis of test results
3.1 CT scan results of full-diameter core
A total of 115.22 m of core was scanned in the full-diameter core CT scanning test, and the core sampling depth was mostly 3,500–4,500 m. The scanned specimen data are shown in Table 2.

Table 2. Information table of CT scan specimens of full-diameter core.
This study utilizes high-resolution circumferential orientation maps, X-direction slices, and Y-direction slices of the internal structure of the rock, obtained through double CT scanning tests of the full-diameter cores. This approach enables the comparison of the scanned images with the natural state of the cores and facilitates the evaluation of the external features of the cores. The scanning results along with the physical diagrams of the cores, are presented in Figure 2. The green curve in the graph represents density, while the purple curve signifies effective original sequence number.
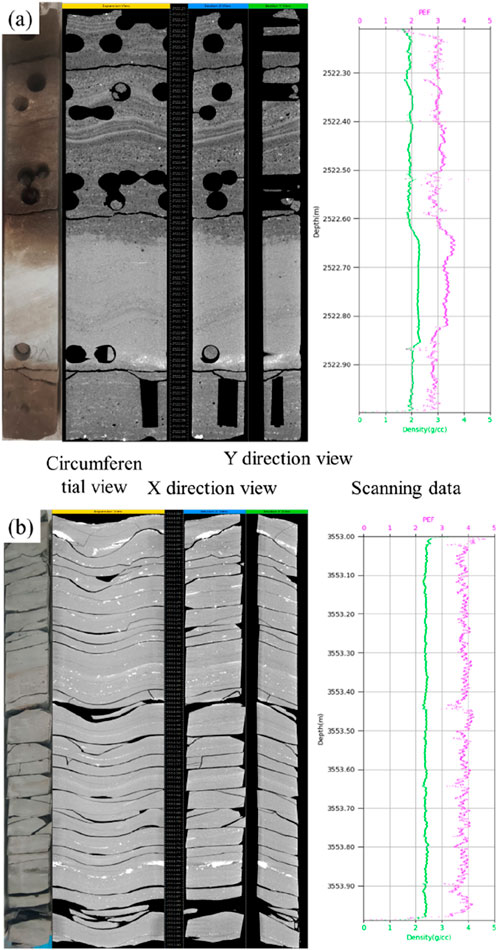
Figure 2. Physical core map and corresponding CT scan data. (a) 3553 ∼ 35554 m; (b) 2531 ∼ 2532 m.
A comparison of the experimental results reveals that the internal structure of the core exhibits different characteristics at different depths. At a depth of approximately 2,500 m, the thickness of the lithological layers in the core exhibits a tendency to be greater, while the distribution of laminae within the core is found to be uneven. As the core sampling depth reaches 3500 m, the thickness of the lithological layers decreases, and the laminae become more developed. Furthermore, as the core is buried at greater depths, the curves depicting its density and effective original sequence number exhibit minimal change, suggesting that the density and structure of the material within the core tend to be more uniformly distributed. In summary, the lithology and physical properties of the reservoir undergo changes with the burial depth, and as the burial depth increases, the density of the reservoir gradually increases and tends to be stabilized, and the tectonic joints inside the reservoir are also more developed (Huang et al., 2019).
3.2 Micron CT scan results
The specimen was scanned with a voltage of 90 kV, a scanning power of 3.6 W, and a slice number of 2,100 per frame. Figure 3 presents a series of two-dimensional cross-sectional images obtained by micron-scale computed tomography, which represent the internal structure of the core specimen at varying depths (100 µm between XY0 and XY500). Each image is 1 mm in diameter and clearly displays the microscopic pore and fracture network inside the core specimen. The microscopic CT scans further reveal the internal microstructure of the rock, including the distribution of pores and cracks. The observation of the internal structure of the cores at varying depths reveals that the mineral content and its location vary between sections.
Figure 3. Two-dimensional cross-sectional images at different depths. (a) 1 μm; (b) 300 μm; (c) 600 μm; (d) 900 μm; (e) 1200 μm; (f) 1500 μm.
As illustrated in Figure 4, two orthogonal cross-sectional images of the core specimen are presented. The images are designated as XZ and YZ planes, respectively. These planes demonstrate the microstructures present within the core, including the distribution of pores, cracks, and rock matrix. The resolution of these images is 1 μm. It is evident from the XZ and YZ planes that the distribution of the pore structure inside the core exhibits anisotropy, i.e., the pore structure is not uniform along the X and Z axes.
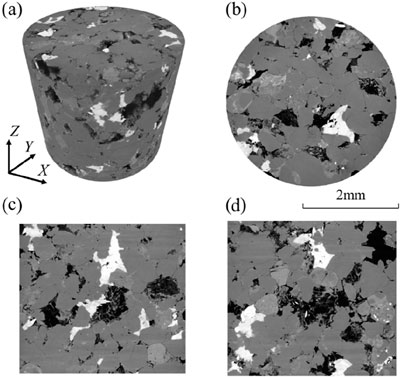
Figure 4. Image of orthogonal cross section. (a)3D; (b) XY direction; (c) XZ direction; (d) YZ direction.
The pore network models of the cores were obtained from the high-precision core cross-section images at varying depths in the XY, XZ, and YZ directions of the specimens. This was accomplished through a combination of numerical simulations and calculations. The pore network models of the specimens KP18-1-1dSa-27 and KP11-4-8dSa-38 are shown in Figure 5. A comparison of the pore network models reveals that the porosity of the cores decreases continuously with the increase of core sampling depth, and the pore size of the natural cracks also shows a decreasing trend. As illustrated in Figure 5, pores are represented by blue, high-density components by yellow, and natural fractures by green.
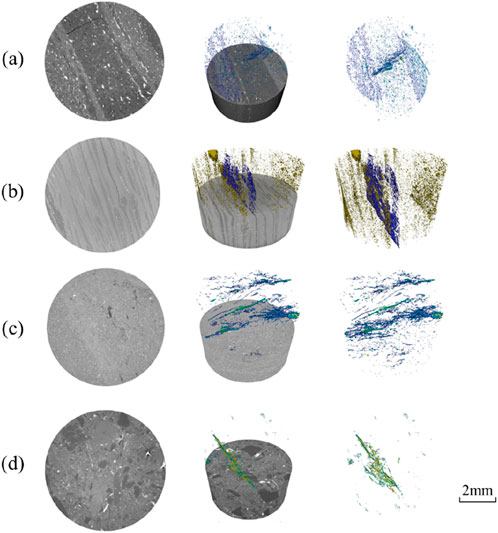
Figure 5. Micron CT scan results. (a) 2497.5 m; (b) 2497.5 m; (c) 4114.83 m; (d) 4632 m.
3.3 Scanning electron microscope results
The electron microscope test specimen was extracted from depth of 3,567.60 m. The total pore-fracture facies porosity was determined to be 2.82%, which occupies 100% of the proportion of all pore types. In the analyzed specimen, the sum of pores and fractures constitutes the entire face porosity. The face porosity of inorganic pores was 1.52%, accounting for 53.90% of the total pore cracks, while the face porosity of inorganic cracks was 1.30%, accounting for 46.10% of the total pore cracks. The electron microscope scans provided a detailed characterization of the distribution of inorganic cracks across various width ranges.
The diameters of the inorganic pores in the electron microscope-scanned rocks are concentrated between 0.1 and 10 μm, with the highest percentage of pores around 1 µm in diameter at ∼10%. Two distinct peaks are observed near 0.1 µm and 1 μm, respectively, with a general decreasing trend in the area share with increasing pore diameter. This suggests that smaller pores are more prevalent in the specimens. Above 10 μm, the area share remains low, yet a number of large pores are present in the specimens. Between 0.01 µm and 0.1 µm, the area share is comparatively minimal, signifying that very small pores are less prevalent in the specimens. As the diameter of the pores increases, the percentage of pores in the specimen decreases, a trend that is particularly evident in the range above 10 μm, where a significant decrease in the percentage of pores is observed. This observation suggests that inorganic pores are predominantly characterized by small-diameter pores within the specimens, with a limited presence of large-diameter pores. The inorganic pore diameter distribution is illustrated in Figure 6.

Figure 6. Inorganic pore diameter distribution.
As illustrated in Figure 7, the distribution of inorganic crack widths reveals a predominant concentration of widths between 0.5 and 4.5 µm, exhibiting multiple peaks. Among them, cracks with widths around 0.5 µm and 4 µm accounted for the highest percentage, reaching about 15% and 10%, respectively. This observation signifies that the inorganic cracks present in the specimens predominantly exhibit medium widths, accompanied by a multi-peak distribution, thereby reflecting the intricacy and heterogeneity of crack formation processes. The image results for pore, crack, and organic matter extraction were processed by selecting the area of interest and then zooming in locally. The figure manifests multiple peaks, which suggests the presence of multiple types of cracks in the specimen or the influence of multiple factors on crack formation. The relatively high percentage of small cracks (0∼0.5 μm) indicates the prevalence of fine cracks in the specimen. Additionally, the proportion of cracks near 4 μm is notably high, suggesting the existence of a subset of larger cracks within the specimens.
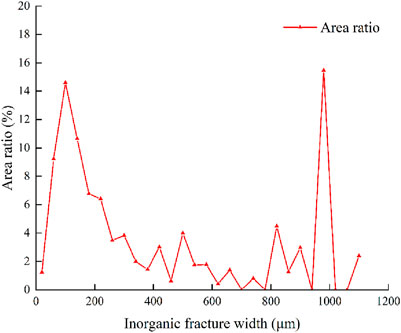
Figure 7. Distribution of inorganic crack width.
The results of the Focused Ion Beam-Scanning Electron Microscopy (FIB-SEM) analysis provide an accurate three-dimensional structural analysis of the rock specimens. The particle size distribution exhibits two prominent peaks at approximately 55 nm and 699 nm, respectively. The results of the assay in Figure 8 indicate the presence of two main particle size groups in the specimen. The smaller sizes exhibit the highest percentage of particles at approximately 0.35, while the larger sizes demonstrate the second highest percentage of particles at approximately 0.15.
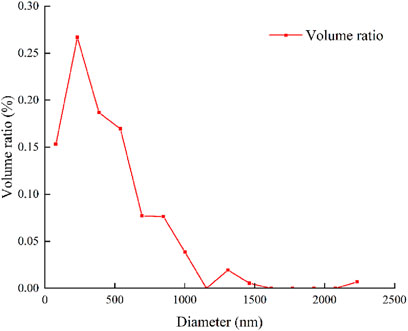
Figure 8. Distribution of pore radius.
As illustrated in Figure 9, the distribution of the throat radius is characterized by a singular peak with a mean radius of approximately 161 nm. A predominant concentration of the throat radius in the smaller size range is observed among the analyzed specimens. With the throat radius increases, its volume share gradually decreases, indicating that larger throats are less prevalent in the specimens. The fitted curve, represented by the green dashed line, further elucidates the trend of the throat radius distribution.
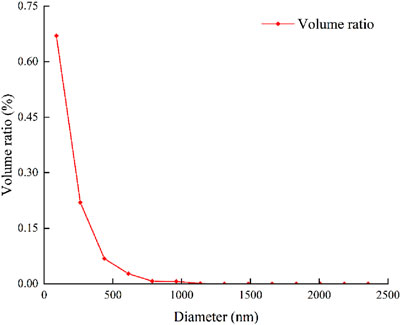
Figure 9. Radius distribution of throat.
The distribution of the pore coordination number exhibits a single peak that is clearly defined, with a peak value that is situated approximately at 0.26. As the coordination number rises, the quantity of pores declines gradually. This finding suggests that high coordination number pores are less common in the specimens, as evidenced in Figure 10. The fitted curve, represented by the orange dashed line, further elucidates the trend of the pore coordination number distribution.
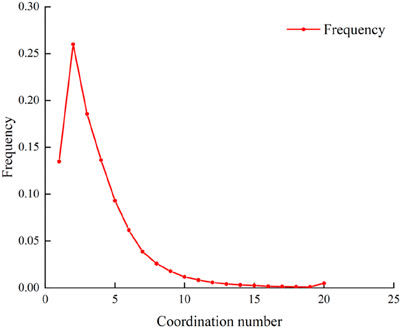
Figure 10. Pore coordination number distribution.
Porosity, while indicative of a reservoir’s storage capacity, fails to provide specific information about pore morphology. By analyzing the pore shape factor, it is possible to gain insight into geometric characteristics such as pore size, shape, and connectivity, facilitating a more comprehensive assessment of reservoir performance. As illustrated in Figure 11, the distribution of the pore shape factor exhibits a pronounced single peak, centered at approximately 0.05. This observation indicates that a significant proportion of the pores in the analyzed specimens exhibit a shape factor that is concentrated within this range. This finding suggests that the shapes of these pores deviate from a spherical shape, but do not exhibit extreme deviations. As the shape factor increases or decreases, the number of pores gradually decreases, indicating that extreme shaped pores are rarer in the specimens.
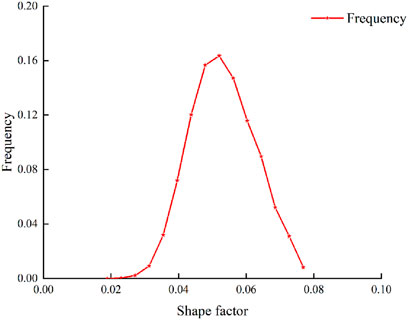
Figure 11. Distribution of pore shape factors.
3.4 Mineral quantitative analysis data processing
The processing of mineral quantitative analysis data allows for precise identification and quantification of the mineral composition of the rock. Figures 12, 13 illustrate the mineral quantitative analysis of the specimens. These figures include the overall scanning image, mineral type, mineral area percentage, mineral mass percentage, and the planar distribution image of the main minerals in the top three content, along with the corresponding mineral particle size distribution data. The test results indicate that quartz occupies a substantial area and has a high content in the specimen, while the distribution of sodium feldspar and illite is more dispersed, suggesting that these minerals are not uniformly distributed in the sample. The quartz particles are predominantly concentrated within a specific range of particle sizes, a phenomenon that is likely influenced by the quartz formation process or subsequent physicochemical actions. Conversely, the grain size distributions of sodium feldspar and illite exhibit divergent patterns, reflecting their distinct roles or subsequent alterations during the rock formation process. The table in the figure provides specific percentages of each mineral to assess the relative abundance of the mineral in the sample. Quartz within the specimen is significantly more abundant than the other minerals.
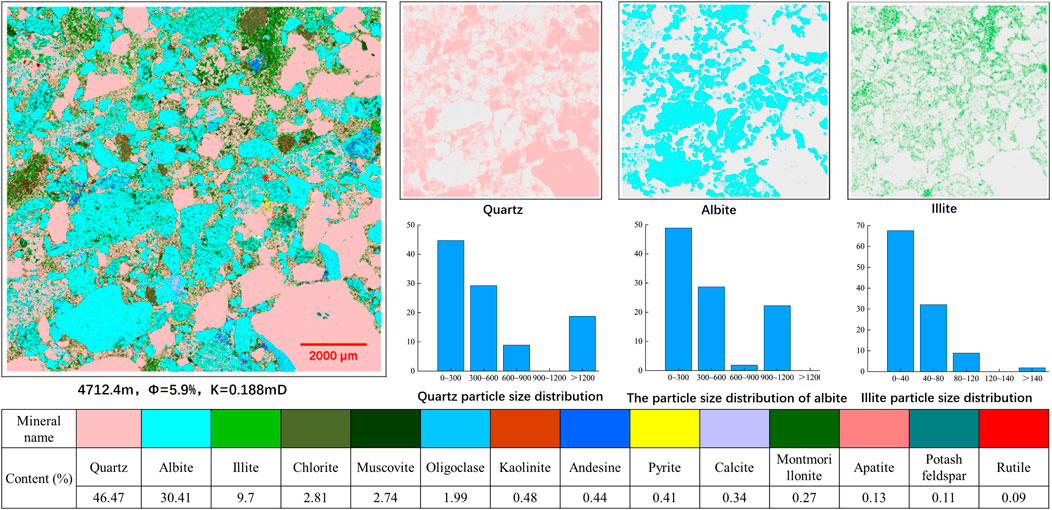
Figure 12. Local image of mineral quantitative analysis (4,712.4 m).
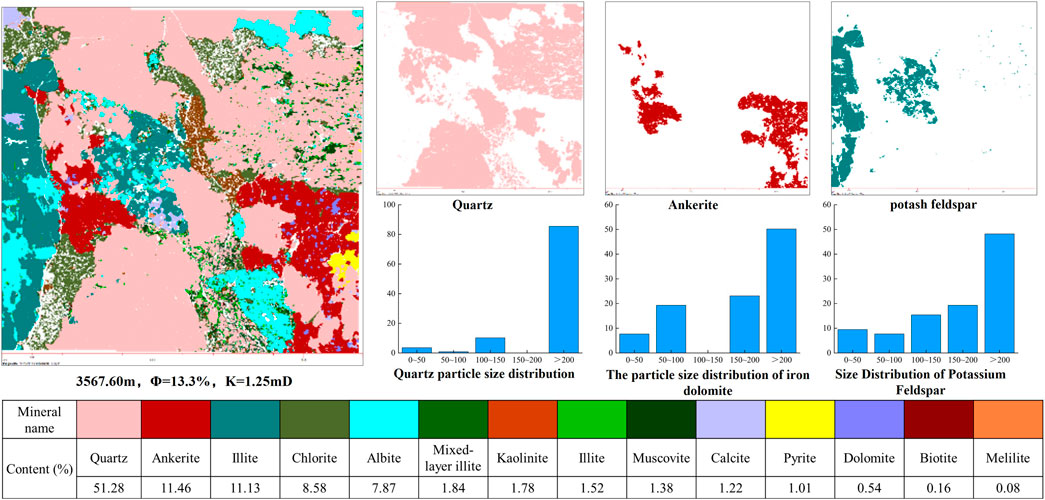
Figure 13. Local image of mineral quantitative analysis (3,567.60 m).
4 Discussion
In this study, a multi-faceted approach is employed, encompassing CT scanning, SEM, and quantitative mineral analysis, to achieve a comprehensive qualitative and quantitative identification and characterization of petrophysical parameters. These parameters include lithology, minerals, porosity, and fractures. However, the findings of the research indicate that the target reservoirs frequently exhibit remarkably low porosity and permeability. To further investigate the sedimentology, diagenetic processes, and reservoir characteristics of these reservoirs, this paper will analyze and discuss the densification mechanism of low-permeability reservoirs. This analysis will be based on the changing law of mineral content in the specimen and the diagenetic effect that occurs.
The present study examined the pore penetration of three wells in the Kaiping area. The results demonstrated a positive correlation in the wall core of the three wells, indicating a rhythmic pattern in the logging curves combined with the depositional background. This pattern was indicative of planar deposition on the depositional microphase of the preliminary judgment of the inter-channel fine-grained sand body. The braided waterway sand body, in conjunction with the segments of the Wenchang Formation, was subjected to drilling in order to encounter the subphase of a braided river delta/fan delta leading edge. This subphase is characterized by rapid bottom-up grain size change, rapid change of mineral type (mainly feldspar) type and content, and indirect control of the low permeability genesis and development law of the subsequent reservoir, as illustrated in Figure 14.

Figure 14. Particle size change diagram (depth gradually decreasing).
As illustrated in Figure 15, the specimen underwent a series of diagenetic processes, resulting in the observation of five distinct stages. These stages are particularly evident and significantly impact the characteristics of the target reservoir. The following are the notable stages: (1). This stage is characterized by early diagenesis in an alkaline environment, with ilmenite cementation that partially fills the primary intergranular pores. There is an absence of siliceous cementation and quartz secondary increase. (2). Early diagenetic stage in alkaline environment, ilmenite accounted for quartz grains and formed a strong alkaline environment locally. (3). Stage, temperature, and pressure increase, potassium and sodium ions began to exchange, potassium feldspar began to convert to sodium feldspar, and formed lots of dissolution holes in the immediate vicinity of the strong alkaline environment. (4). The following rock-forming stage is characterized by the following: potassium feldspar sodium feldsparization and the formation of potassium feldspar dissolution, resulting in the release of a large number of potassium and sodium ions into the pore fluid. (5). The following rock-forming stage is characterized by the following: potassium and sodium ions promote the transformation of a large number of ilmenite into albite, with secondary pore-less influence.
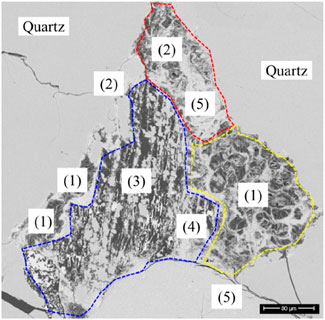
Figure 15. Diagenetic processes observed in the specimen.
A comprehensive analysis of the digitized data from the cores of the Kaiping block, in conjunction with extensive field-of-view scanning electron microscope (SEM) images and quantitative mineral analysis, has revealed that the primary and secondary minerals present within the Wenchang Formation exert a significant influence on the porosity of the system. The Wenchang Formation exhibits four distinct diagenetic types of reservoir spaces: residual intergranular pores, dissolution pores, grain-edge seams, and clay-mineral pores. The correlation between these pore types and the types and distribution of detrital particles and clay minerals is noteworthy. The mineral composition of these pores primarily consists of quartz, potassium feldspar, sodium feldspar, and illite and muscovite.
The development of micrometer-scale pores is the primary factor contributing to the reservoir’s low permeability, particularly the clay mineral cemented semi-filled intergranular pores. The dissolution of potassium feldspar in a strong alkaline environment, the transformation of illite-accounted quartz into nanometer-sized clay mineral intergranular pores, and the transformation between potassium feldspar and sodium feldspar to form many dissolution pores are all key geologic processes affecting the permeability of the reservoir. Secondary constructive diagenesis has been shown to have a negligible effect on enhancing connectivity, particularly through grain-edge joints. However, the primary factor contributing to the reservoir’s low permeability is the poor connectivity resulting from clay mineral cementation. In the early diagenetic stage, the presence of alkaline ion-rich pore water in diagenetic fluids exerts a detrimental influence on reservoir properties, particularly with regard to illite cementation. Conversely, during the middle diagenetic stage, feldspathic interconversion leads to the development of dissolution, marking the period of strongest reservoir improvement.
The diagenesis of the feldspathic medium-coarse sandstone is a complex geo-evolutionary process, which is mainly composed of potassium feldspar-rich medium-coarse sandstone and sodium feldspathic medium-coarse sandstone. In the nascent diagenetic stage, the sedimentary phase exerts a substantial influence on the early diagenesis of the sandstone, accompanied by compaction, clay mineral cementation, accountable action, siliceous cementation, and dissolution and erosion, thereby establishing the fundamental framework of the sandstone. The potassium feldspar-rich medium-coarse sandstone is distinguished by the close contact between quartz and feldspar, the strong pore-filling cementation of illite, and the potassium-accountable lithification of potassium feldspar. Collectively, these processes promote the weakening of siliceous cementation and the intense dissolution of potassium feldspar, thereby enhancing porosity. Concurrent with this transformation is the significant alteration of illite to muscovite. Conversely, sodic feldspathic medium-coarse sandstones demonstrate relative weakening of illite cementation and transformation between sodium feldspar and feldspar. These alterations are concomitant with intense dissolution of sodium feldspar, thereby enhancing porosity. In contrast, the feldspathic quartz-bearing conglomerate sandstones demonstrate features such as poorly sorted grinding rounding, the presence of quartz and sodium feldspar exhibiting point-line contacts, and basal cementation characterized by high clay content. These sandstones have undergone significant compaction, resulting in reduced porosity and permeability. The absence of clay mineral cementation in these sandstones is indicative of a paucity of potassium feldspar in the parent source minerals and the process of sodic feldsparization, resulting in a comparatively weak account of clay minerals. The process of diagenetic evolution, characterized by the absence of primary porosity and significant compaction, has led to the densification of sandstone. This compaction, in turn, leads to a decrease in reservoir permeability, with no concomitant enhancement of porosity, even during subsequent reservoir reformation. Consequently, the compaction characteristics of the primary reservoir manifest as low porosity and permeability in the subsequent evolution, providing a significant geological foundation for oil and gas exploration and development.
5 Conclusion
In this study, a comprehensive core digitization acquisition program was implemented to analyze the densification mechanism of low-permeability reservoirs. The program integrated cutting-edge CT scanning techniques, including dual-energy CT imaging of full-diameter cores, multi-scale micrometer CT imaging, high-resolution scanning electron microscope (SEM) imaging, and focused ion beam-scanning electron microscope (FIB-SEM) techniques. The integrated application of these techniques enabled a comprehensive analysis of the rock specimens from macro to micro scales. The ensuing main conclusions are as follows:
(1) The digitization of core samples offers several advantages, including rapid testing, consistent continuity, a substantial volume of data, and high precision. The integration of diverse CT scanning methodologies and electron microscope scanning techniques has yielded an innovative analytical framework for reservoir characterization and assessment of oil and gas deposits in pivotal oil and gas blocks within the South China Sea region, including Kaiping, Baiyun, Xijiang, Huizhou, and others.
(2) As the burial depth increases, the reservoir’s density undergoes a gradual increase and tends to stabilize. Concurrently, the tectonic joints within the reservoir undergo further development, leading to a decrease in porosity of the core and a concomitant decrease in the size of natural cracks.
(3) The development of micrometer-scale pores is the primary cause of low reservoir permeability. During the early diagenetic stage, sediment phase control exerts a substantial influence on the early diagenesis of sandstones. This process is accompanied by the combined effects of compaction, clay mineral cementation, accountant effect, siliceous cementation, and solvation, resulting in reduced porosity and permeability. This study offers a novel perspective on the mechanism of densification in low-permeability reservoirs, which is of significant importance for the optimization of oil and gas extraction strategies and the enhancement of reservoir development efficiency.
Data availability statement
The original contributions presented in the study are included in the article/supplementary material, further inquiries can be directed to the corresponding author.
Author contributions
LG: Conceptualization, Investigation, Methodology, Software, Writing–original draft, Writing–review and editing. TX: Data curation, Funding acquisition, Investigation, Supervision, Visualization, Writing–review and editing. QJ: Conceptualization, Formal Analysis, Methodology, Validation, Writing–review and editing.
Funding
The author(s) declare that no financial support was received for the research and/or publication of this article.
Conflict of interest
Authors LG, TX and QJ were employed by Shenzhen Branch of CNOOC (China) Co., Ltd.
Generative AI statement
The author(s) declare that no Generative AI was used in the creation of this manuscript.
Publisher’s note
All claims expressed in this article are solely those of the authors and do not necessarily represent those of their affiliated organizations, or those of the publisher, the editors and the reviewers. Any product that may be evaluated in this article, or claim that may be made by its manufacturer, is not guaranteed or endorsed by the publisher.
References
Aghanjanpour, A., and Berg, C. F. (2024). Directional- and scale-dependent permeability estimations from CT images. Geoenergy Sci. Eng., 213593. doi:10.1016/j.geoen.2024.213593
Bian, H., Qin, X., Sun, J., Luo, W., Lu, C., Zhu, J., et al. (2023). The impact of mineral compositions on hydrate morphology evolution and phase transition hysteresis in natural clayey silts. Energy 274, 127303. doi:10.1016/j.energy.2023.127303
Cao, Y., Jin, Z., Zhu, R., and Liu, K. (2023). Microstructures of continental organic-rich shale and its adjacent siltstone and carbonate rocks—an example from the Lucaogou Formation, Jimusar Sag, Junggar Basin, NW China. Geoenergy Sci. Eng. 225, 211705. doi:10.1016/j.geoen.2023.211705
Fu, H., Huang, L., Hou, B., Weng, D., guan, B., Zhong, T., et al. (2024). Experimental and numerical investigation on interaction mechanism between hydraulic fracture and natural fracture. Rock Mech. Rock Eng. 57, 10571–10582. doi:10.1007/s00603-024-04101-3
Fu, H., Huang, L., Zhang, F., Xu, Y., Cai, B., Liang, T., et al. (2021). Effect of perforation technologies on the initiation and propagation of hydraulic fracture. Chin. J. Rock Mech. Eng. 40, 3163–3173. doi:10.13722/j.cnki.jrme.2021.0573
Gou, B., Zhan, L., Guo, J., Zhang, R., Zhou, C., Wu, L., et al. (2021). Effect of different types of stimulation fluids on fracture propagation behavior in naturally fractured carbonate rock through CT scan. J. Petroleum Sci. Eng. 201, 108529. doi:10.1016/j.petrol.2021.108529
He, W., Chen, K., Hayatdavoudi, A., Sawant, K., and Lomas, M. (2019). Effects of clay content, cement and mineral composition characteristics on sandstone rock strength and deformability behaviors. J. Petroleum Sci. Eng. 176, 962–969. doi:10.1016/j.petrol.2019.02.016
Huang, L., Dontsov, E., Fu, H., Lei, Y., Weng, D., and Zhang, F. (2022). Hydraulic fracture height growth in layered rocks: perspective from DEM simulation of different propagation regimes. Int. J. Solids Struct. 238, 111395. doi:10.1016/j.ijsolstr.2021.111395
Huang, L., He, R., Yang, Z., Tan, P., Chen, W., Li, X., et al. (2023a). Exploring hydraulic fracture behavior in glutenite formation with strong heterogeneity and variable lithology based on DEM simulation. Eng. Fract. Mech. 278 (December 2022), 109020. doi:10.1016/j.engfracmech.2022.109020
Huang, L., Liao, X., Fan, M., Wu, S., Tan, P., and Yang, L. (2024). Experimental and numerical simulation technique for hydraulic fracturing of shale formations. Adv. Geo-Energy Res. 13 (2), 83–88. doi:10.46690/ager.2024.08.02
Huang, L., Liao, X., Fu, H., Wang, X., Weng, D., Feng, G., et al. (2025). Interaction behaviors between finite-scale natural and hydraulic fractures in hot dry rock geothermal systems. Phys. Fluids 37, 026614. doi:10.1063/5.0252814
Huang, L., Liu, J., Ji, Y., Gong, X., and Qin, L. (2018). A review of multiscale expansion of low permeability reservoir cracks. Petroleum 4 (2), 115–125. doi:10.1016/j.petlm.2017.09.002
Huang, L., Liu, J., Zhang, F., Dontsov, E., and Damjanac, B. (2019). Exploring the influence of rock inherent heterogeneity and grain size on hydraulic fracturing using discrete element modeling. Int. J. Solids Struct. 176–177, 207–220. doi:10.1016/j.ijsolstr.2019.06.018
Huang, L., Liu, J., Zhang, F., Fu, H., Zhu, H., and Damjanac, B. (2020). 3D lattice modeling of hydraulic fracture initiation and near-wellbore propagation for different perforation models. J. Petroleum Sci. Eng. 191, 107169. doi:10.1016/j.petrol.2020.107169
Huang, L., Tan, J., Fu, H., Liu, J., Chen, X., Liao, X., et al. (2023b). The non-plane initiation and propagation mechanism of multiple hydraulic fractures in tight reservoirs considering stress shadow effects. Eng. Fract. Mech. 292 (March), 109570. doi:10.1016/j.engfracmech.2023.109570
Iraji, S., Soltanmohammadi, R., Munoz, E. R., Basso, M., and Vidal, A. C. (2023). Core scale investigation of fluid flow in the heterogeneous porous media based on X-ray computed tomography images: upscaling and history matching approaches. Geoenergy Sci. Eng. 225, 211716. doi:10.1016/j.geoen.2023.211716
Ishola, O., and Vilcáez, J. (2024). Augmenting X-ray micro-CT data with MICP data for high resolution pore-scale simulations of flow properties of carbonate rocks. Geoenergy Sci. Eng. 239, 212982. doi:10.1016/j.geoen.2024.212982
Kimayim Gaduwang, A., Tawabini, B., Abu-Mahfouz, I. S., and Al-Yaseri, A. (2024). Assessing hydrogen production potential from carbonate and shale source rocks: a geochemical investigation. Fuel 378, 132923. doi:10.1016/j.fuel.2024.132923
Lang, Y., Liang, Z., and Dong, Z. (2024). Three-dimensional finite element simulation and reconstruction of jointed rock models using CT scanning and photogrammetry. J. Rock Mech. Geotechnical Eng. 16 (4), 1348–1361. doi:10.1016/j.jrmge.2023.08.008
Lei, H., Huang, W., Jiang, Q., and Luo, P. (2022). Genesis of clay minerals and its insight for the formation of limestone marl alterations in Middle Permian of the Sichuan Basin. J. Petroleum Sci. Eng. 218, 111014. doi:10.1016/j.petrol.2022.111014
Li, B., Nie, X., Cai, J., Zhou, X., Wang, C., and Han, D. (2022). U-Net model for multi-component digital rock modeling of shales based on CT and QEMSCAN images. J. Petroleum Sci. Eng. 216, 110734. doi:10.1016/j.petrol.2022.110734
Liu, B., Yasin, Q., Sun, M., Ismail, A., Wood, D. A., Tian, X., et al. (2024). An improved convolutional architecture for quantitative characterization of pore networks in fine-grained rocks using FIB-SEM. Int. J. Coal Geol. 295, 104625. doi:10.1016/j.coal.2024.104625
Liu, C., Buono, G., Pappalardo, L., Shan, X., Yi, J., Shi, Y., et al. (2023a). X-ray computed microtomography revealing the effects of volcanic, alteration, and burial processes on the pore structure of rocks from unconventional reservoirs (Songliao Basin, NE China). Geoenergy Sci. Eng. 226, 211781. doi:10.1016/j.geoen.2023.211781
Liu, S., Fan, M., and Lu, D. (2023b). Uncertainty quantification of the convolutional neural networks on permeability estimation from micro-CT scanned sandstone and carbonate rock images. Geoenergy Sci. Eng. 230, 212160. doi:10.1016/j.geoen.2023.212160
Luo, H., Xie, J., Huang, L., Wu, J., Shi, X., Bai, Y., et al. (2022). Multiscale sensitivity analysis of hydraulic fracturing parameters based on dimensionless analysis method. Lithosphere 2022 (SpecialIssue12). doi:10.2113/2022/9708300
Medina, F. J., Jausoro, I., Floridia Addato, M. A., Rodriguez, M. J., Tomassini, F. G., and Caneiro, A. (2022). On the evaluation of representative elementary area for porosity in shale rocks by field emission scanning electron microscopy. Energy 253, 124141. doi:10.1016/j.energy.2022.124141
Ravazzoli, C. L., Panizza, G., and Camilión, E. (2024). Evaluation of in situ elastic and mechanical anisotropic properties based on rock physics, well logs and drill cuttings: a case study from Palermo Aike shale in Austral Basin, Argentina. Geoenergy Sci. Eng. 241, 213118. doi:10.1016/j.geoen.2024.213118
Saadat, K., and Rahimpour-Bonab, H. (2023). Lithology determination and petrophysical rock typing of sedimentary rocks using X-ray tomography. Geoenergy Sci. Eng. 231, 212397. doi:10.1016/j.geoen.2023.212397
Sethi, C., Mastalerz, M., Hower, J. C., Hazra, B., Singh, A. K., and Vishal, V. (2023). Using optical-electron correlative microscopy for shales of contrasting thermal maturity. Int. J. Coal Geol. 274, 104273. doi:10.1016/j.coal.2023.104273
Song, R., Wang, Y., Sun, S., and Liu, J. (2021). Characterization and microfabrication of natural porous rocks: from micro-CT imaging and digital rock modelling to micro-3D-printed rock analogs. J. Petroleum Sci. Eng. 205, 108827. doi:10.1016/j.petrol.2021.108827
Subbotina, M., Mukhina, E., Karamov, T., Popov, E., Kozlova, E., Morkovkin, A., et al. (2023). Evolution of reservoir properties of oil shale rocks under hydro-thermal treatment: investigations from micro-to macro-scale. Geoenergy Sci. Eng. 228, 211972. doi:10.1016/j.geoen.2023.211972
Tan, P., Chen, Z.-W., Huang, L.-K., Zhao, Q., and Shao, S.-R. (2024a). Evaluation of the combined influence of geological layer property and in-situ stresses on fracture height growth for layered formations. Petroleum Sci. 21, 3222–3236. doi:10.1016/j.petsci.2024.07.014
Tan, P., Fu, S., Huang, L., Chen, Z., and Cao, J. (2024b). Effects of orthogonal cleat structures on hydraulic fracture evolution behavior. Geoenergy Sci. Eng. 241, 213119. doi:10.1016/j.geoen.2024.213119
Tuzingila, R. M., Kong, L., and Koy Kasongo, R. (2024). A review on experimental techniques and their applications in the effects of mineral content on geomechanical properties of reservoir shale rock. Rock Mech. Bull. 3 (Issue 2), 100110. doi:10.1016/j.rockmb.2024.100110
Xing, Z., Yao, J., Liu, L., and Sun, H. (2024). Efficiently reconstructing high-quality details of 3D digital rocks with super-resolution Transformer. Energy 300, 131499. doi:10.1016/j.energy.2024.131499
Yang, L., Yang, D., Li, Y., Cai, J., and Jiang, X. (2024). Nanoindentation study on microscopic mineral mechanics and bedding characteristics of continental shales. Energy 312, 133614. doi:10.1016/j.energy.2024.133614
Youjun, J., Jie, W., and Huang, L. (2015). Analysis on inflowing of the injecting water in faulted formation. Adv. Mech. Eng. 7 (6), 1687814015590294. doi:10.1177/1687814015590294
Yuejiao, L., Fuqiang, L., Haijie, Z., ZhouJie, T., Yifei, W., Xiaotian, Z., et al. (2021). A novel mineral composition inversion method of deep shale gas reservoir in Western Chongqing. J. Petroleum Sci. Eng. 202, 108528. doi:10.1016/j.petrol.2021.108528
Zhang, B., Wen, H., Qing, H., Yang, K., Luo, Y., Yang, H., et al. (2022a). The influence of depositional and diagenetic processes on rock electrical properties: a case study of the Longmaxi shale in the Sichuan Basin. J. Petroleum Sci. Eng. 211, 110119. doi:10.1016/j.petrol.2022.110119
Zhang, F. S., Huang, L. K., Yang, L., Dontsov, E., Weng, D. W., Liang, H. B., et al. (2022b). Numerical investigation on the effect of depletion-induced stress reorientation on infill well hydraulic fracture propagation. Petroleum Sci. 19 (1), 296–308. doi:10.1016/j.petsci.2021.09.014
Zhao, K., Ma, H., Liang, X., Li, X., Liu, Y., Cai, R., et al. (2022a). Damage evaluation of rock salt under multilevel cyclic loading with constant stress intervals using AE monitoring and CT scanning. J. Petroleum Sci. Eng. 208, 109517. doi:10.1016/j.petrol.2021.109517
Zhao, Z., Tao, L., Guo, J., Zhao, Y., and Chen, C. (2022b). A novel wettability index and mineral content curve based shut-in time optimization approach for multi-fractured horizontal wells in shale gas reservoirs. J. Petroleum Sci. Eng. 211, 110192. doi:10.1016/j.petrol.2022.110192
Keywords: CT scan, SEM scan, hydrocarbon exploration, reservoir characterization, densification mechanism
Citation: Guan L, Xiong T and Jiang Q (2025) Three-dimensional reconstruction and characterization of microscopic pore structure in tight reservoirs. Front. Earth Sci. 13:1563846. doi: 10.3389/feart.2025.1563846
Received: 20 January 2025; Accepted: 10 March 2025;
Published: 17 April 2025.
Edited by:
Hongjian Zhu, Yanshan University, ChinaReviewed by:
Peng Tan, CNPC Engineering Technology R&D Company Limited, ChinaMengke An, Hong Kong Polytechnic University, Hong Kong SAR, China
Copyright © 2025 Guan, Xiong and Jiang. This is an open-access article distributed under the terms of the Creative Commons Attribution License (CC BY). The use, distribution or reproduction in other forums is permitted, provided the original author(s) and the copyright owner(s) are credited and that the original publication in this journal is cited, in accordance with accepted academic practice. No use, distribution or reproduction is permitted which does not comply with these terms.
*Correspondence: Lijun Guan, Z3VhbmxqMTk3NUAxNjMuY29t