 Jiayun Gao1,2
 Jie Jiang
- 1School of Ocean and Civil Engineering, Shanghai Jiaotong University, Shanghai, China
- 2Shanghai Research Centre of Ocean & Shipbuilding Maritime Engineering, China Shipbuilding NDRI Engineering Co., Ltd., Shanghai, China
- 3School of Civil Engineering and Architecture, Guangxi University, Nanning, China
Enlarged head anchors are commonly used in the anti-floating of underground structures and foundation pit support, where the anchoring force is increased by full contact between the enlarged head section and the soil. However, there is still a significant lack of research on the pullout tests of enlarged head anchors at various section inclinations, which potentially hinders the engineering application of this promising geotechnical anchoring method. This study employs the Discrete Element Method (DEM) to conduct pullout tests of the enlarged head anchors at four enlarged head section inclinations and three confining pressures. The results indicate that the load-displacement curves of the enlarged head anchors initially increase sharply and then slightly decrease before eventually entering a stable stage. The enlarged head anchor with a section inclination of 120° exhibited superior bearing capacity during pullout tests. An increase in confining stress was found to enhance the mobilization of the bearing capacity of the enlarged head anchor. At the smaller section inclination of the enlarged head, the bearing capacity primarily originates from the end resistance generated ahead of the enlarged head. As the section inclination increased, the frictional resistance along the anchor-soil shear interface progressively became the dominant contributor to the bearing capacity. The observed contact force chain structure ahead of the enlarged head was considered evidence of arching effect formation. The critical role of the soil arching effect in mobilizing the pullout force of enlarged head anchors is emphasized.
1 Introduction
In recent years, geotechnical anchorage technology, due to its high efficiency, economic benefits, and other characteristics, has been widely utilized in the process of underground space development (Maitra et al., 2024; Zhao et al., 2024; He et al., 2025). With the further development and utilization of underground spaces (Wu et al., 2024; Wu et al., 2025) and the increasing demand for anti-floating measures in foundation engineering (Kou et al., 2015; Liu G et al., 2024), ensuring the stability of underground structures has posed a significant challenge. Anchor support systems have emerged as an effective solution to enhance the stability of these underground structures. However, conventional anchor types often fail to meet the required support capacity due to their limited pullout resistance. To overcome these limitations, enlarged head anchors have been developed as an innovative approach to address the insufficient bearing capacity associated with traditional anchor systems.
By increasing the diameter of the anchor bolt at the end of the anchorage section, the end of the anchor bolt achieves fuller contact with the surrounding rock and soil, effectively enhancing the interface bonding and lateral friction around the anchorage bolt (Zhang et al., 2023), meanwhile, the end resistance at the enlarged head is also effectively mobilized, the bearing capability of the anchors is thereby more fully engaged. To explore the load-bearing characteristics of enlarged head anchors more thoroughly, a series of model tests (Niroumand and Kassim, 2014), field tests (Shahin and Jaksa, 2006), and numerical simulations (Du et al., 2022) were conducted. It was found that the loading bearing capacity of the enlarged head anchors primarily results from the end resistance of the enlarged head and the shear strength along the interface between the soil and the enlarged head. Jeong et al. (2007) further found that the loading bearing capacity of the enlarged head anchors equals the sum of the end bearing capacity and the lateral friction resistance. Giampa et al. (2018) reported that the bearing capacity of the anchors was significantly higher than that of ordinary anchors by increasing the head anchor size. Liao and Hsu, (2003) found that when the lateral inclination of cylindrical enlarged head anchors was appropriately increased, the load-bearing capability of these anchors also increased accordingly. Wu et al. (2022) studied the mechanical mechanisms of enlarged head bolts based on practical engineering and categorized the soil stress in enlarged head anchors into three stages: the static earth pressure stage, the transition stage, and the plastic development stage. Zhang et al. (2023) found that the bearing capacity of anchors with different enlarged head cross-sectional shapes varied, with circular footing bolts exhibiting the highest tensile strength, followed by stepped footing bolts, and semi-ellipsoidal anchor bolts having the lowest. While previous studies (Wu et al., 2022; Zhang et al., 2023; Wang et al., 2024) have advanced our understanding of the macro-mechanics and deformation mechanisms of soil in enlarged head anchor tests, research focusing on the micro-mechanics of the soil remains limited. The Discrete Element Method (DEM) serves as a powerful platform for analyzing these micro-mechanical aspects, effectively overcoming the inherent limitations of Finite Element Method (FEM) analyses: 1) FEM faces challenges in accurately simulating large deformations within geotechnical applications, thereby failing to simulate the damage patterns during the failure phase of the soil; 2) as a continuum mechanics approach, FEM struggles to replicate the contact behaviors of real granular materials, particularly the mobilization of contact force chains (Chen et al., 2020; Liu et al., 2022), which restricts the understanding of the micromechanical properties of soils. Consequently, Employing DEM to analyze the micromechanical mechanisms of soil during the pullout test of enlarged head anchors is essential.
Furthermore, there is a lack of research on the pullout test under different enlarged head section inclinations in the aforementioned literature on enlarged head anchors. It is still unknown how to mobilize the pullout force and its induced soil micromechanics mechanism under different enlarged head section inclinations, an in-depth exploration of this promising anchoring method through DEM is likely to facilitate the application of such enlarged head anchors in geotechnical engineering. To this end, a numerical setup for a pullout test of enlarged head anchors was designed. The pullout test of anchors with different enlarged head inclinations was simulated. This device eliminates boundary effects and soil particle size effects. The servo principle can be utilized to simulate the confining stress on the anchor. The evolution of anchor bearing capacity in the pullout test with different inclinations of the enlarged head was successfully captured. A repeatable numerical model reference is provided for subsequent studies of enlarged head anchor tests.
In this study, the effects of four types of enlarged head section shapes and three types of servo stress on the pullout force of enlarged head anchors are investigated. The load-displacement curves of the enlarged head anchors during the pullout process are clarified, and the motion modes of the soil during the pullout process are analyzed. The failure modes in the different evolution stages were discussed, the sources of soil resistance were identified, and the contribution of the mobilization degree of the contact force chain in front of the enlarged head to the soil resistance was examined. This study will significantly advance the understanding of the soil failure mechanism during the pullout process of enlarged head anchors.
2 DEM modelling
2.1 Design of the enlarged head section of the anchor
Enlarged head anchors are commonly employed in geotechnical applications, such as anti-floating anchors (Kou et al., 2015), and enlarged head pressure anchors for foundation support (Wu et al., 2022). Their three-dimensional formation is illustrated in Figure 1A, consisting of an enlarged head section and ordinary anchorage section. To facilitate the analysis, the three-dimensional formation of enlarged head anchors can be simplified into a two-dimensional representation; the transverse section of the enlarged head anchors is shown in Figure 1B. To study the interaction between the 2D anchor rod’s enlarged head cross-sectional shape and the geotechnical granular materials, four cross-sectional forms are utilized, as depicted in Figure 1C. The section inclination of the enlarged head and the width of the enlarged head step are used to characterize the various designs of the enlarged head cross-sections, with section inclination (β) of 90°, 120°, 150°, and 170° being established. Additionally, H = 0.5 m, W = 0.5 m, a = 0.2 m, and b = 0.1 m denote the constant height and width of the enlarged head, the constant width of the enlarged head step, and the constant width of the anchor bar, respectively.
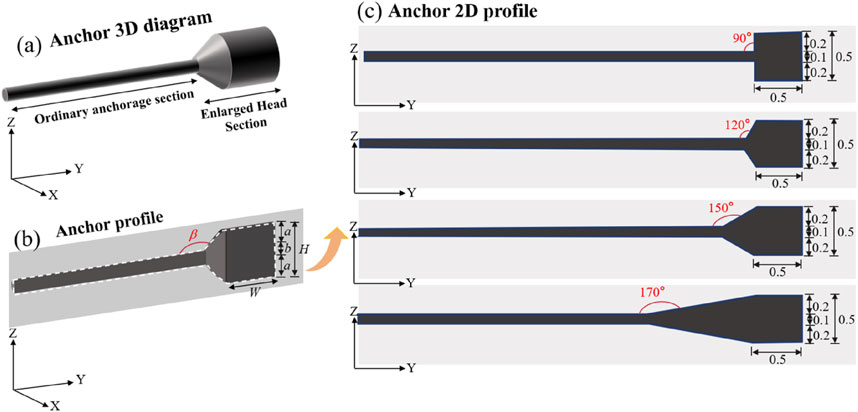
Figure 1. Formation of the enlarged head anchor: (A) three-dimensional view of the enlarged head anchor; (B) profile view of the enlarged head anchor; (C) design of the cross-section of the enlarged head anchor.
2.2 DEM modelling parameters
This study utilized the 2D Particle Flow Code (PFC2D, version 7.0), developed by Itasca Consulting Group (2021), as the DEM simulation software to study the enlarged head anchors pullout tests. This software operates on the fundamental principle of modeling particle interactions through the application of Newton’s second law. It has been demonstrated to be a reliable tool for studying geotechnical applications (Athani and Rognon, 2021; Chen et al., 2023; Cheng et al., 2023). Therefore, in this study, the 2D DEM model was employed to simulate the pullout test of the enlarged head anchor. The disc unit is taken as the geotechnical particle material within the PFC2D. Consequently, 3D geotechnical particles are no longer applicable for validating the parameters of the 2D DEM geotechnical model. The development of elongated soil bodies with a 2D disc cross-section has contributed to the inverse validation of the 2D DEM soil model parameters. For instance, Xu et al. (2019) utilized a Taylor-Schneebeli soil analog with a disc cross-section as the filling material, This analog had a density of 2,700 kg/m3 and particle diameters of 3, 4, and 5 mm, which were mixed in equal volumes to form a soil material with a porosity of 0.17. This study investigated the development of the 2D soil arch effect. Subsequently, a series of 2D DEM soil model parameters were validated for the simulation of geotechnical applications (Bao et al., 2022; Zhou et al., 2023; Liu M et al., 2024). In this study, the 2D soil particles developed by Xu et al. (2019) were also employed to validate the parameters of the 2D DEM soil model. The 2D DEM contact model between particles-particles and walls is established as the linear contact model. The contact force is calculated based on the normal and tangential components, which are determined by the numerical overlap between particles, the normal stiffness coefficient (kn), and the tangential stiffness coefficient (ks). Additionally, the tangential contact force is constrained by the friction coefficient (μ). Since the three contact parameters (kn, ks, and μ) in the linear contact model are constant values, high computational efficiency is ensured.
Since the particle size in DEM simulations affects both the number of particles generated and the analysis time step, utilizing the actual particle size can result in intolerable computational costs. To address the particle size issue, a strategy of particle scaling was employed in this study. This strategy is recognized as an effective approach for enhancing computational efficiency (Hu et al., 2020; Hu et al., 2022). The soil particle size was scaled up by a factor of 5.0. To verify the validity of the scaled-up soil model parameters, biaxial numerical tests were conducted on the DEM soil model with enlarged particle sizes, which were then compared to Xu et al. (2019). In the biaxial numerical tests, the Improved Multi-layer compaction method (IMCM) proposed by Lai et al. (2014) was utilized to prepare a sample with a porosity of 0.17 in a chamber of 1.0 m in width and 1.1 m in height. The sample consisted of granular materials with diameters of 0.015, 0.02, and 0.025 m, mixed uniformly at a volume ratio of 1:1:1. The soil micromechanical parameters are presented in Table 1. Different confining stresses (50 kPa, 100 kPa, and 150 kPa) were applied to the samples using the numerical servo-mechanism. The biaxial test results were compared with the experimental results, as illustrated in Figures 2A, B, with the corresponding mechanical parameters detailed in Table 1. The variations in deviator stress and volume strain with axial strain demonstrate a strong agreement with the experimental results, thus validating the DEM model parameters presented in this study. Consequently, the 2D DEM soil model parameters are deemed suitable for simulating the pullout tests of enlarged head anchors conducted in this study.
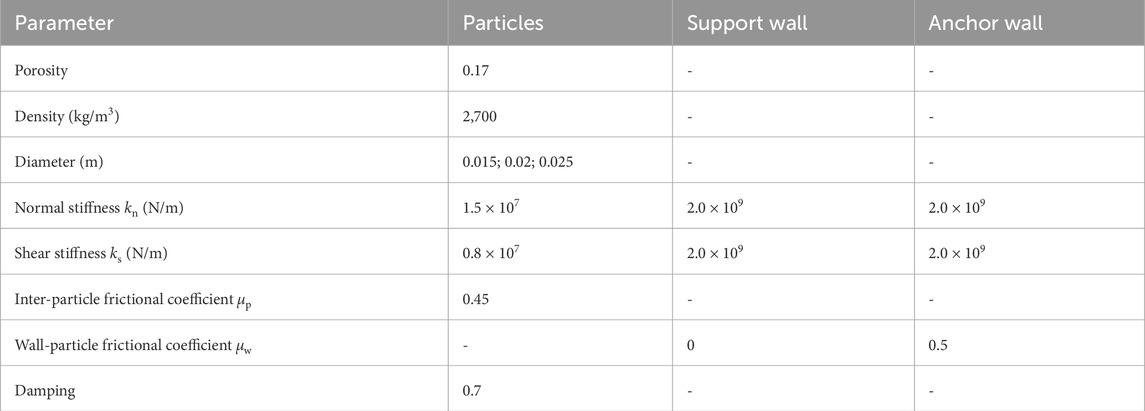
Table 1. Micro-parameters for DEM model.
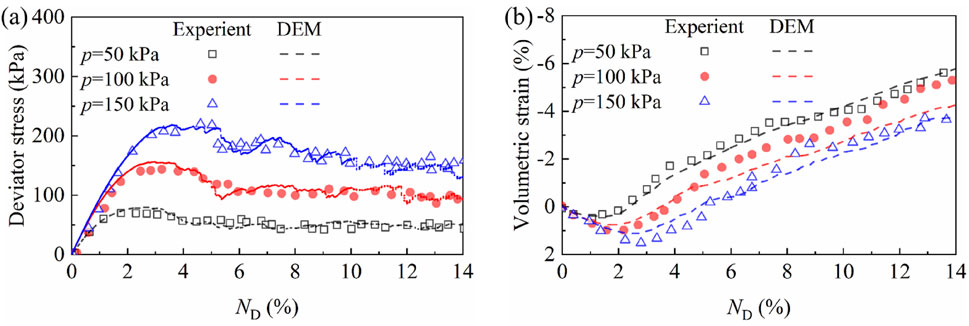
Figure 2. Comparison of biaxial test results with the laboratory tests by (Xu et al., 2019). (A) Deviator stress; (B) volumetric strain.
2.3 Testing procedure
Ovesen (1979) found through centrifuge model testing that the boundary effect becomes less significant when the ratio of the distance from the edge of the anchor plate to the model boundary and the width of the anchor plate exceeds 2.82. Therefore, in this study, the distances from the top and bottom of the model box to the edge of the enlarged head of the anchor were set to 3.0 times the width of the enlarged head. Additionally, the distance from the left wall of the model box to the section of the enlarged head of the anchor was set to 8.0 times the width of the enlarged head. Consequently, the dimensions of the adopted DEM model ensure that the boundary effects are negligible during the pullout test. The height of the model box was 3.5 m, and its width was 5.0 m (as shown in Figure 3). Servo stresses were applied to the loading plates at the top and bottom of the model box to provide the confining stress of the sample. The gradual pullout process of the enlarged head anchors was simulated by applying the velocity of the enlarged head anchors. The specific test steps could be described as follows (as shown in Figure 4):
(1) A soil sample with a porosity of 0.17 was generated in a chamber with 5.0 m in width and 3.5 m in height using the IMCM proposed by Lai et al. (2014), mixing with different diameters (0.015, 0.02, and 0.025 m) at a volume ratio of 1:1:1. The particle size and micromechanical parameters are detailed in Table 1. Servo stresses were applied to the top and bottom loading plates of the model box for preloading, and initial soil samples were obtained after the DEM model reached an equilibrium state where unbalanced forces became negligible.
(2) Target servo stresses were subsequently applied to the top and bottom loading plates of the model box through the numerical servo-mechanism, and soil particles in the enlarged head anchor area were deleted when the DEM model reached the equilibrium state.
(3) The left wall was removed and subsequently regenerated to accommodate the end of the enlarged head anchor, thereby facilitating its gradual pullout. Meanwhile, the enlarged head anchors are allowed to move freely in the lateral direction. Additionally, the wall model of the enlarged head anchor was created. The position of the enlarged head anchors is shown in Figure 3, with the right edge of the enlarged head situated 0.25 m away from the right wall. The micromechanical parameters of the enlarged head anchor wall are outlined in Table 1, with the friction coefficient set at 0.5 relative to the granular particles. The DEM model achieved equilibrium under the influence of the specified confining stress.
(4) A pullout velocity of Vs. = 0.01 m/s was applied to the enlarged head anchors. During the test, the pullout force and displacement were recorded, and the pullout force can be obtained from the horizontal contact force on the anchor wall in PFC2D (Itasca Consulting Group, 2021). The load-displacement curve of the enlarged head anchors was obtained, and the DEM test was terminated when the anchors had moved 0.3 m. At this point, the curve had reached the residual pullout resistance stage, with no further significant changes in pullout force observed
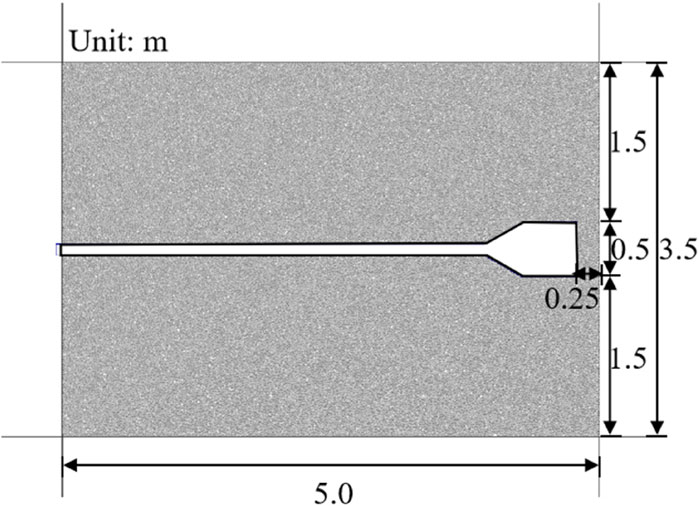
Figure 3. DEM modelling scheme.

Figure 4. The enlarged head anchor pullout test procedures.
A pullout velocity of Vs = 0.01 m/s was applied to the enlarged head anchors. During the test, the pullout force and displacement were recorded, where the pullout force can be obtained from the horizontal contact force on the anchor wall in PFC2D. The load-displacement curve of the enlarged head anchors was obtained, and the DEM test was terminated when the anchors had moved 0.3 m, indicating that the curve had reached the residual pullout resistance stage, with no further significant changes in pullout force observed thereafter. Pullout tests for four types of enlarged head anchors were simulated under confining stresses of 100 kPa, 150 kPa, and 200 kPa, and the corresponding results were recorded. The DEM test scheme used in this study is summarized in Table 2.
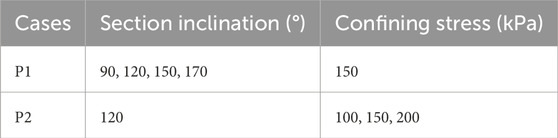
Table 2. Program for DEM simulation.
3 DEM simulation results
3.1 Loading-displacement curve
Figure 5 shows the load-displacement curves of enlarged head anchors at different section inclinations of the enlarged head and confining stresses. The pullout displacement refers to the distance the anchor moves in the horizontal direction, and the direction of displacement is specified to be positive along the direction of anchor movement. The pullout force of the enlarged head anchors is obtained from the contact force in the horizontal direction. It is specified that the contact force is positive if it impedes the anchor’s movement and negative if it facilitates movement. As shown in Figure 5A, the variation of the pullout force curve with displacement is divided into three typical evolution stages: Stage I: Initial stage, where the pullout force of the enlarged head anchors increases rapidly to a peak value after a small pullout displacement; this peak pullout force corresponds to a displacement of the enlarged head anchors of approximately 20 mm. Stage II: Strain softening stage, in which the pullout force decreases gradually after the peak pullout force. Stage III: Residual pullout force stage, wherein the displacement of the enlarged head anchors reaches about 100 mm, the anchor’s bearing capacity transitions into the residual pullout force stage and gradually stabilizes. This indicates that, during this stage, the soil goes through damage, and the soil resistance provided will no longer change significantly.
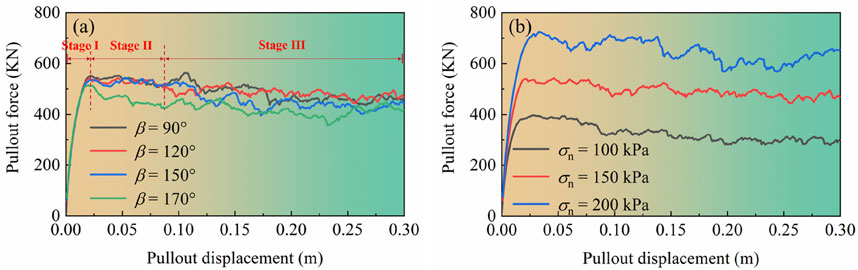
Figure 5. The loading-displacement curve of (A) different section inclination of the enlarged head, and (B) different confining stresses.
For the load-displacement curves at different section inclination of the enlarged head, the peak pullout force increases with the section inclination of the enlarged head increasing. The peak pullout forces are relatively similar for section inclination of the enlarged head ranging from 90° to 150°. However, for the residual pullout force, the section inclination of the enlarged head of 120° is significantly larger compared to the other section inclination. Therefore, this study suggests that an appropriate increase in the section inclination of the enlarged head will benefit the mobilization of the pullout force (e.g., β = 120°). It should be noted that the pullout force for a larger section inclination (e.g., β = 170°) is consistently significantly smaller throughout the evolution process compared to the other conditions. Figure 5B illustrates the variation of pullout force with pullout displacement for different confining stresses (σn = 100, 150, 200 kPa), and the evolution characteristics of pullout force for all three confining stress conditions demonstrate the typical three-stage evolution pattern. The pullout force for the case with a larger confining stress is significantly greater than the smaller confining stress throughout the evolution process. This suggests that the soil resistance mobilized by the enlarged head anchors increases significantly under high confining stresses.
3.2 Particle motion mode
Figure 6 shows the variation of the displacement vector field at different section inclination of the enlarged head. As the displacement value increases, the color transitions closer to red; conversely, smaller displacement values are represented by colors closer to blue. The displacement values range from 0 to 300 mm. Four typical anchor displacements (δ = 20, 100, 200, 300 mm) are selected as representative stages of the soil displacement field, where δ = 20 mm denote the peak pullout force stage, and when δ = 100 mm, the residual pullout force stage begins. The displacements of δ = 200 mm, and 300 mm correspond to the residual pullout force stage and final stage, respectively. As shown in Figure 6, when δ = 20 mm, the soil displacement is minimal, primarily concentrated in the area directly in front of the enlarged head. The displacement vector begins in front of the enlarged head and gradually extends to a larger area ahead, but due to the constraints of the left wall, the displacement values decrease as the particles approach the left side. The displacement region is predominantly focused in the middle region of the model box. Notably, the smaller the section inclination of the enlarged head, the larger the area of displacement that is mobilized, mobilizing the enhanced soil resistance.
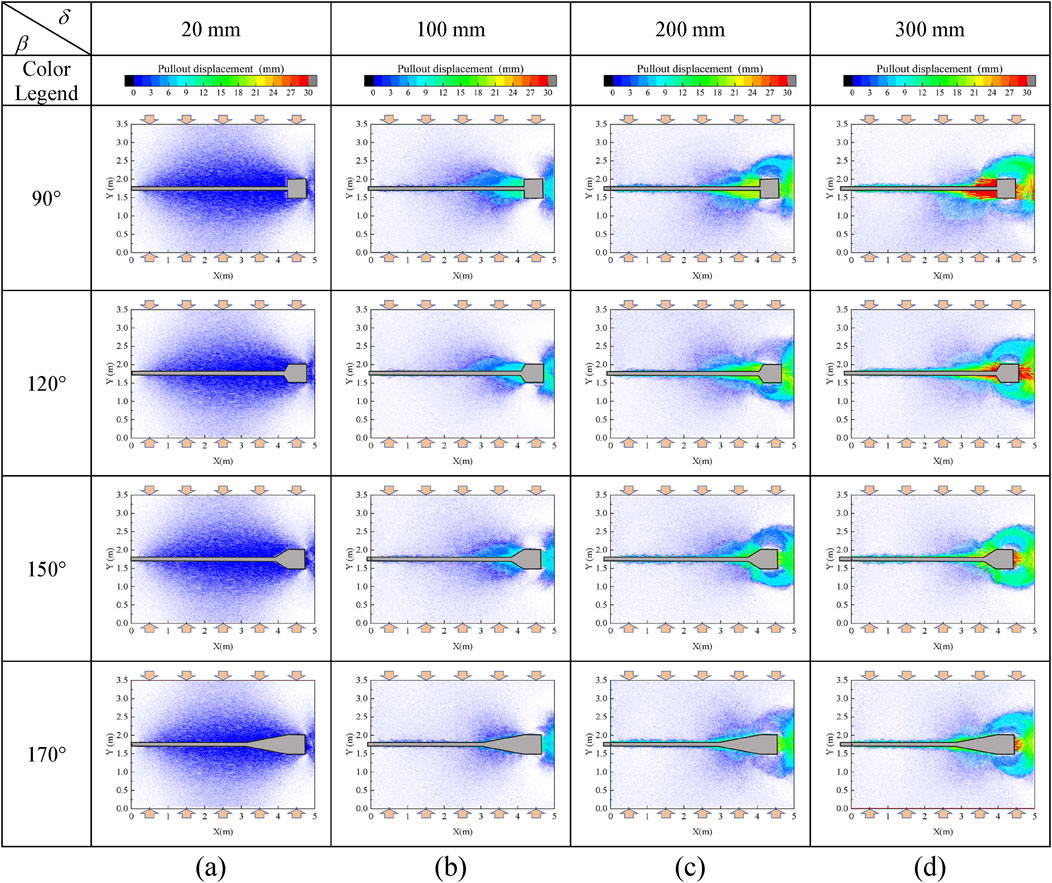
Figure 6. The displacement vector filed with different section inclination of the enlarged head at (A) δ = 20 mm, (B) δ = 100 mm, (C) δ = 200 mm and (D) δ = 300 mm.
When δ = 100 mm, the soil displacement vector is mainly concentrated in front of the enlarged head section. The movement of the enlarged head anchor noticeably shifts the soil to the left side, forming a “cavity” behind the enlarged head due to its motion. At this point, the resulting soil loss is primarily compensated by soil from above and below. Overall, the smaller the enlarged head section inclination, the more pronounced the displacement of the soil in front of the enlarged head. However, when the enlarged head section inclination β = 170°, the displaced region in front of the enlarged head becomes less distinct, with the displacement mainly occurring around the enlarged head anchor-soil contact interface region. When δ = 200 mm, under large displacement conditions, the soil compresses against the enlarged head anchors, causing it to bypass the head and flow into the area behind it, thus replenishing the “cavity” formed during the movement of the enlarged head anchors. Consequently, the soil movement pattern establishes a “bypassing mechanism.”
In summary, soil movement encompasses two primary modes. Firstly, the soil in front of the enlarged head moves horizontally to the left (in the same direction as the enlarged head anchor movement) due to the pushing force exerted by the enlarged head, compressing the soil further and creating a passive soil pressure state. Secondly, due to soil damage, a strain softening phase occurs, whereby the soil extruded by the enlarged head establishes a connection with the soil behind it, creating a “ring connected area” above the enlarged head, thereby forming the “bypassing mechanism” motion mode. Notably, the “bypassing mechanism” manifests during the residual force phase, while prior to this, particle movement is predominantly influenced by the enlarged head’s push. Furthermore, when the section inclination of the enlarged head is small, both the forward movement of the soil induced by the enlarged head’s compression and the movement of particles involved in the “bypassing mechanism” is more significant. As the section inclination of the enlarged head increases, the displacement of the soil in front of the enlarged head decreases, resulting in a weakened “bypassing mechanism”. When the displacement of the enlarged head anchors reaches δ = 200 mm, despite an increase in compression ahead of enlarged head and enhancement of the “bypassing mechanism”, the overall soil movement pattern would no longer change.
Figure 7 shows the pattern of the soil displacement vector field in the final stage (δ = 300 mm) at different confining stresses (σn = 100, 150, 200 kPa). In the final stage, the displacement patterns at different confining pressures exhibit a clear “bypassing mechanism.” Notably, at lower confining stress (as shown in Figure 7A), the soil in front of the enlarged head anchors propagates vertically to the enlarged head cross-section, while the soil particles extruded by the enlarged head flow into the region behind the enlarged head due to the “bypassing mechanism.” It is observed that as the soil displacement extends towards the middle of the model, the particles no longer move solely forward but also shift upwards and downwards within the model box, thereby alleviating the significant increase in the modulus of elasticity resulting from the compression of the soil in front of the enlarged head. With the increase in confining stress, this displacement pattern becomes increasingly pronounced (as illustrated in Figures 7B, C). Additionally, when the confining stress rises, the primary direction of soil displacement at the enlarged head section no longer propagates perpendicularly to the cross-section in front of the enlarged head, shifting to horizontal (as depicted in Figure 7C), with greater soil displacement. The range of soil involved in the horizontal displacement widens. It is noteworthy that both the mobilization of the ordinary anchorage section-soil friction resistance and the mobilization of the soil resistance in front of the enlarged head were significantly enhanced under higher confining stress.
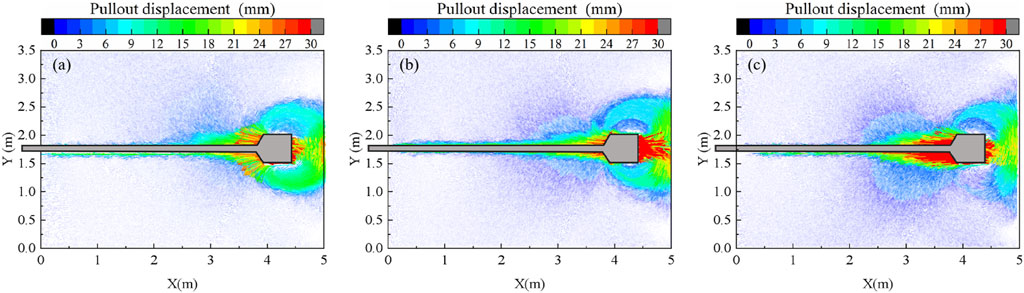
Figure 7. The displacement vector filed at the final state with different confining stresses: (A) σn = 100 kPa; (B) σn = 150 kPa; (C) σn = 200 kPa.
3.3 Soil failure modes
Interparticle rolling is another type of particle motion that controls the strength of granular materials (Jiang et al., 2005). The high gradient of granular rotation corresponds to the boundary of the shear band (Oda and Kazama, 1998). Figure 8 shows the variation of the particle rotation field with anchor displacement for different section inclination of the enlarged head The red dashed line marks the variation of the shear band. As shown in Figure 8A, at the pullout displacement (e.g., δ = 20 mm), a clear shear band is formed at the ordinary anchorage section-soil interface due to the relative movement of the enlarged head anchors and the soil. However, since the soil deformation is still within the small strain level compared to the model dimensions, the compressed soil in front of the enlarged head would not form a significant shear band, which means that the soil in front of the enlarged head has not failure but rather provides a greater pullout force by mobilizing the soil resistance of the elastic soil. However, at higher section inclination of the enlarged head (e.g., β = 170°) of the enlarged head section, significant relative sliding between the surface of the enlarged head and the soil occurs, resulting in the formation of a shear band at the enlarged head-soil surface. However, since the front of the enlarged head section does not form a significant triangular rigid region, it cannot provide end resistance to the front of the enlarged head. This means that the soil resistance for the larger section inclination of the enlarged head is mainly provided by the friction resistance formed at the enlarged head-soil interface. For the small section inclination of the enlarged head, the primary sources of soil resistance arise from damage modes associated with increased head-end resistance and interfacial shear failure occurring at the soil surface. Therefore, the reason why the peak pullout force for a smaller section inclination is greater than that for a larger section inclination is due to the mobilization of the resistance at the end of the enlarged head. When δ = 100 mm, the pullout force undergoes a strain-softening phase and begins to enter the residual pullout force phase. It is observed that in addition to the shear band formed at the location of the ordinary anchorage section -soil surface, a rigid triangular region (as the blue zone shown in Figure 8B) due to compression is formed in front of the enlarged head, and this rigid triangular region provides end resistance to the enlarged head section. This rigid triangular region was observed to move forward with the enlarged head anchors of the small inclination of the enlarged head section (e.g., β = 90°, 120°).
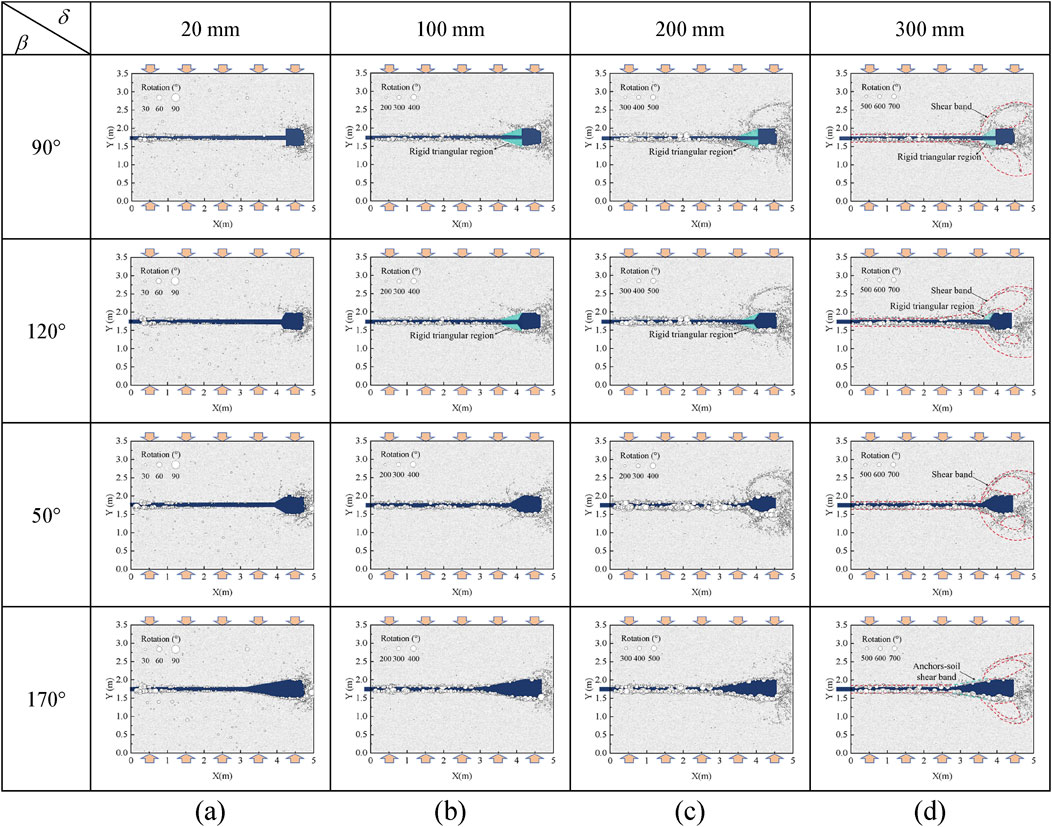
Figure 8. Rotation filed with different section inclinations of the enlarged head at (A) δ = 20 mm, (B) δ = 100 mm, (C) δ = 200 mm and (D) δ = 300 mm.
However, for the higher section inclination of the enlarged head (e.g., β = 150°, 170°), a rigid triangular region does not form; instead, a shear band would be formed at the enlarged head-soil interface. In addition, at the position behind the enlarged head, a localized shear band is formed due to soil loss. However, this shear band is not connected with the shear band formed by the soil in front of the enlarged head. When δ = 200 mm is reached, the residual pullout resistance stage has been entered. With small section inclination of the enlarged head (e.g., β = 90°, 120°), the soil in front of the enlarged head still forms a typical rigid triangular region. The particles at the enlarged head anchor-soil surface rotate more and continue to mobilize the residual friction resistance. However, the shear band in the region behind the enlarged head progressively develops to the left and connects with the shear band formed in front of the enlarged head, thereby forming a ring shear band above the enlarged head. This indicates that the soil has been damaged by the soil motion modes of the “bypassing mechanism.” At δ = 300 mm, this pattern of soil failure becomes even more pronounced. However, the failure pattern does not change further, and the mobilized soil strength remains constant. The red dashed line marks the location of the shear band, and the green area indicates the rigid triangular area in front of the enlarged head, which is used to provide soil resistance and corresponds to the rigid triangular area in the earlier evolution stage. Notably, a rigid triangular region is never formed in front of the enlarged head, failing to provide resistance at the end of the enlarged head. This explains why the pullout resistance of anchors with larger section inclination of the enlarged head (e.g., β = 170°) is consistently smaller than that of anchors with smaller section inclination.
Figure 9 shows the variation of the particle rotational field in the final state (e.g., δ = 300 mm) with the confining stress (σn = 100, 150, 200 kPa). As shown in Figure 9, the soil damage mode in the final state under different confining stress is still characterized by the “bypassing mechanism.” It is noteworthy that the rigid triangular region formed by the soil in front of the enlarged head anchors is not prominent under lower confining stress (e.g., σn = 100 kPa). Furthermore, the shear band formed at the enlarged head anchor-soil interface is more pronounced. This means that the primary source mode of soil resistance mobilized by the enlarged head anchors at lower confining pressures is not from the soil in front of the enlarged head, but rather from the friction resistance generated at the enlarged head anchor-soil surface. When the confining stress is further increased (e.g., σn = 150 kPa), as shown in Figure 9B, the soil in front of the enlarged head section forms a distinct rigid triangular region (illustrated in the blue area of Figure 9B). This means that the end resistance of the rigid triangle becomes the main attribution to the pullout force under large confining stress. This trend, more pronounced at high confining stress (e.g., σn = 200 kPa), is evidenced by the formation of significant rigid triangular regions both above and below the enlarged head anchors. The ring shear band above the enlarged head generated by the “bypassing mechanism” is comparatively smaller, which means the dilation effect is further weaker, and the soil resistance is further enhanced.
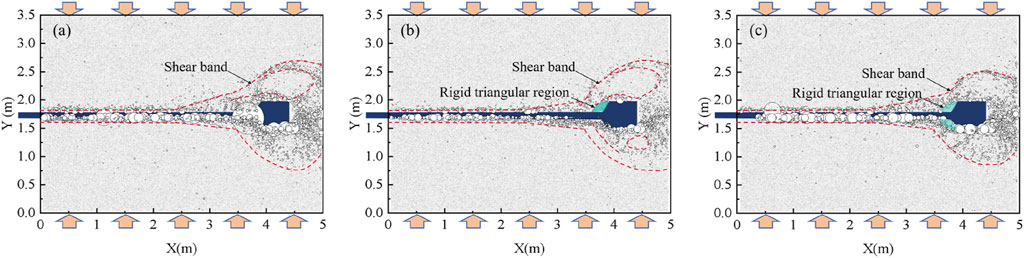
Figure 9. Rotation filed at final state at final state with different confining stresses: (A) σn = 100 kPa; (B) σn = 150 kPa; (C) σn = 200 kPa.
3.4 Local porosity distribution
The local porosity of the samples was determined by measurement circles. The measurement circle is mainly distributed horizontally in front of and above the enlarged head anchors. Specific measurement locations will be indicated in the attachment Figure. Figure 10 illustrates the horizontal distribution of local porosity at different section inclination of the enlarged head. As shown in Figure 10, the local porosity is larger when close to the enlarged head anchors and decreases as the measurement position is higher. This is because when the measurement circle is situated near the anchor position, the local porosity is influenced by the shear band at the ordinary anchorage anchors-soil surface. A significant dilation effect occurs in this region, resulting in increased porosity. However, as the measurement position is higher, the soil is affected by the top servo stress, causing further compaction and resulting in reduced porosity. Furthermore, for the small section inclination of the enlarged head (e.g., β = 90°, 120°), it is observed that a significant compaction effect occurs in the soil close to the front of the enlarged head, as illustrated in the orange area in Figures 10A, B, which manifests as a noticeable reduction in porosity at locations adjacent to the enlarged head. The compacted soil in front of the enlarged head mobilizes greater end resistance, thereby facilitating a higher pullout force for the enlarged head anchors. However, for the large section inclination of the enlarged head (e.g., β = 150°, 170°), the soil in front of the enlarged head does not exhibit compaction, as shown in Figures 10C, D, the local porosity in front of the enlarged head is even slightly increased. This can be attributed to shear damage at the enlarged head’s surface, which facilitates the shear dilation effect. Simultaneously, the void inside the enlarged head was inevitably statisticized. Therefore, for cases with the larger section inclination of the enlarged head, the local porosity of the soil in front of the enlarged head is recorded as higher. Additionally, above the enlarged head, the local porosity increases due to the formation of a cavity behind the enlarged head, which results from the movement of the anchor. This cavity prompts the soil to engage in a “bypassing mechanism” to replenish the soil behind it, thus creating an area of incompact soil. Additionally, under the “bypassing mechanism”, the distinct shear band region is formed above the enlarged head, further contributing to the dilation effect.
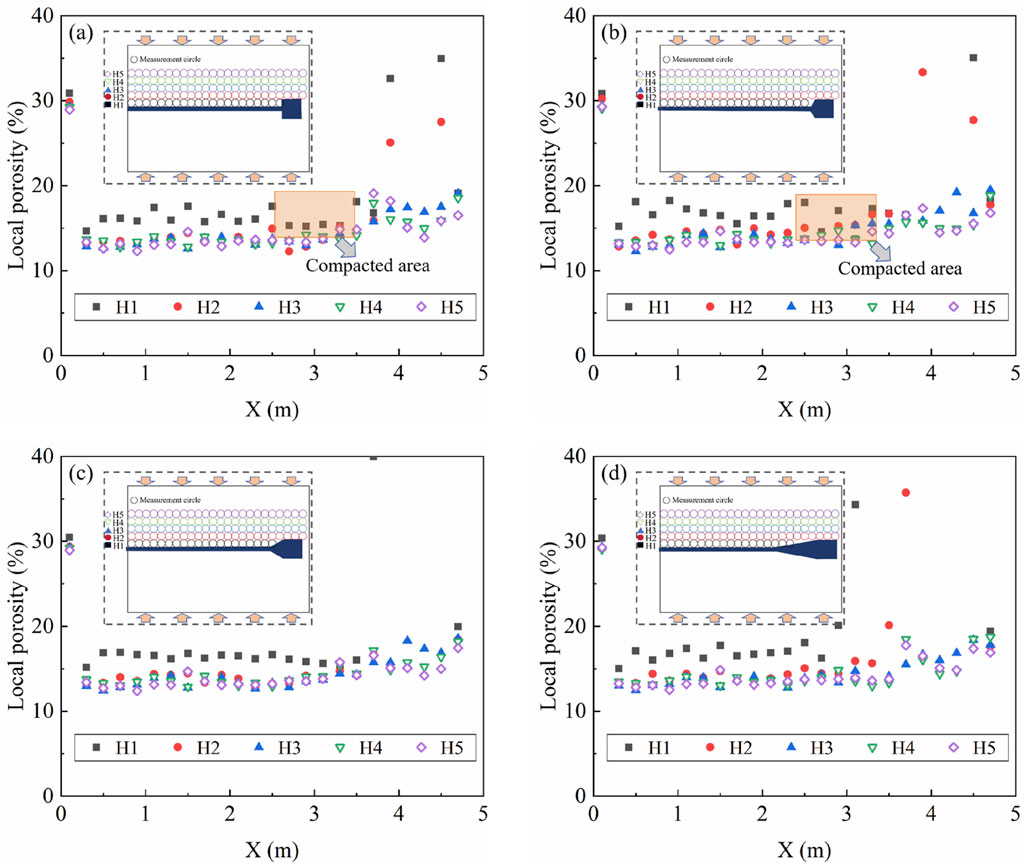
Figure 10. Distribution of local porosity at final state with different section inclination of the enlarged head: (A) β = 90°; (B) β = 120°; (C) β = 150°; (D) β = 170°.
Figure 11 shows the horizontal distribution of local porosity with different confining stresses. Overall, under higher confining stress, the local porosity values distributed horizontally are smaller than those observed under low confining stress. Additionally, two forms of local porosity variations should be noted: (1) for the soil in front of the enlarged head of anchors, with increased confining stress, the reduction in porosity in front of the enlarged head anchors was observed, this soil zone is further compacted. This indicates that the end resistance mobilized by the enlarged head anchors is greater. (2) For the soil above the enlarged head anchors, under higher confining stress, the local porosity is smaller compared to the conditions with lower confining stress, suggesting that the shear dilation effect due to the “bypassing mechanism” is further weakened.
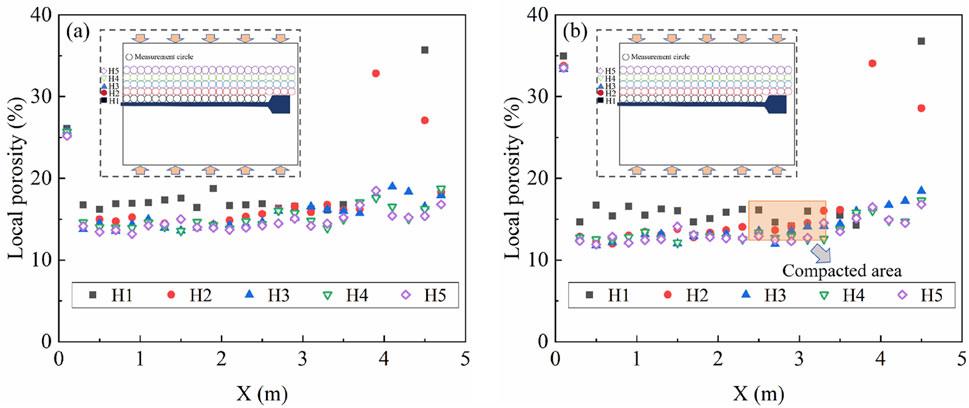
Figure 11. Distribution of local porosity at final state with different confining stresses: (A) σn = 100 kPa; (B) σn = 200 kPa.
3.5 Normal contact force chains and normal force fabric
The evolution of the contact force between soil particles reflects the microstructural changes of the particles and the load transfer paths. Rothenburg and Bathurst, (1989) reported that the loads imposed on a particle system are preferentially transferred in the direction of the high normal contact forces. They suggested that the Fourier series approximation (FSA) can be utilized to analyze the relationship between contact force and fabric, as demonstrated by Equations 1, 2:
where
Figures 12, 13 illustrate the contact states of soil particles at different section inclination of the enlarged head and confining stress. Since the contact forces are almost symmetrically distributed above and below the enlarged head anchors, the statistical region for the contact forces is selected in the area only above the enlarged head (as indicated by the red dashed area in Figure 12). It should be noted that the normalized polar histograms presented in this study are not spatially invariant and are highly dependent on the selected study area. This is because the soil in front of the enlarged head is considered a significant source of soil resistance. Consequently, the soil located in front of the enlarged head was selected as the statistical region for this study. Figures 12, 13 also demonstrate the FSA of the normalized contact force distribution, from which microstructural parameters such as principal directions of contact and force can be obtained.
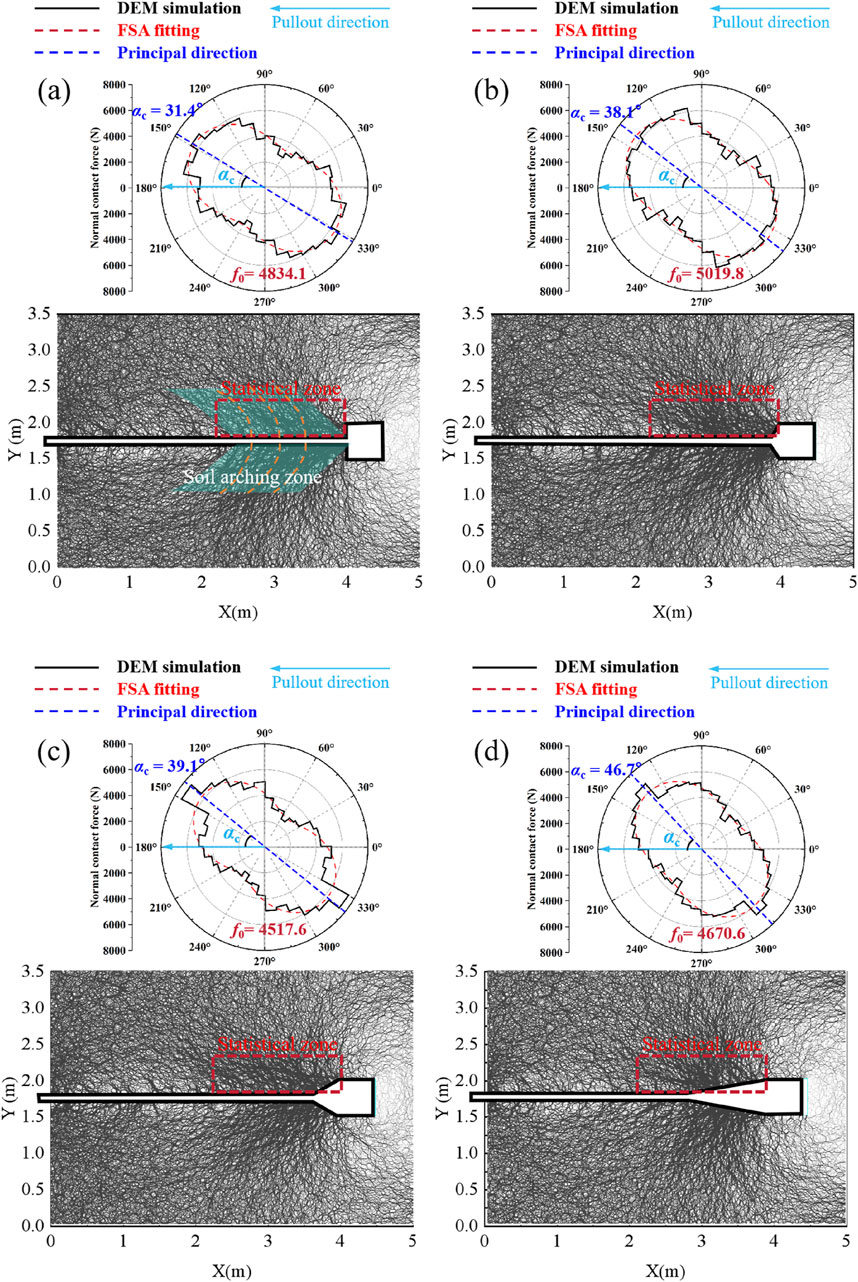
Figure 12. Distribution of normal contact force chains and normal force fabrics at final state with different section inclination of the enlarged head: (A) β = 90°; (B) β = 120°; (C) β = 150°; (D) β = 170°.
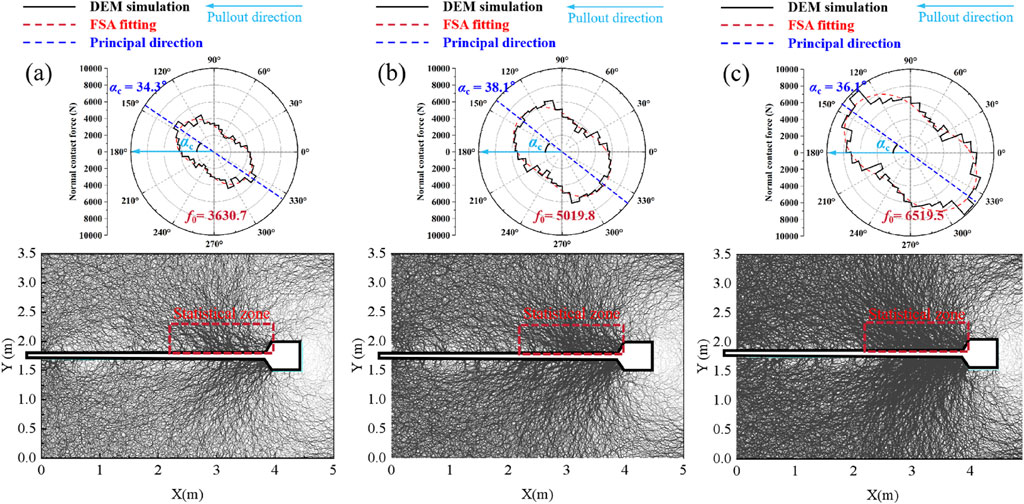
Figure 13. Distribution of normal contact force chains and normal force fabrics at final state with different confining stresses: (A) σn = 100 kPa; (B) σn = 150 kPa; (C) σn = 200 kPa.
As shown in Figure 12, the contact force chain within the soil in front of the enlarged head originates at the cross-section of the enlarged head and propagates toward the soil beyond it. This contact force chain structure shows the trapezoidal region above and below the enlarged head anchors (as illustrated in the blue area of Figure 12A), transporting the loading of the enlarged head to the left stable zone. Actually, the loading transfer resulting from this stress rotation also confirms the formation of the “soil arching effect” in front of the enlarged head. The soil arching effect is fundamentally defined as the mechanism of load transfer phenomena resulting from relative movement within the soil. Although the trapdoor phenomenon does not occur in this study, the load transfer observed through the contact force structure (as indicated in the green area of Figure 13A) could still be classified as a manifestation of the soil arching effect, which contributes to the enhancement of the pullout force of the enlarged head anchors. In addition, an extended contact chain branch induced by the shear between the ordinary anchorage section and the soil is also observed around the ordinary anchorage section; however, it appears weaker compared to the contact chain structure in front of the enlarged head. The concentration of the contact force in front of the enlarged head indicates that the soil is in a passive soil pressure state. In contrast, the contact force chain behind the enlarged head is more loosely arranged, forming a “cavity” area, suggesting that the soil there is in an active soil pressure state. This phenomenon means that the mobilization of the pullout force of the enlarged head anchors is primarily derived from the soil resistance mobilized in front of the enlarged head. The pattern of soil damage behind the enlarged head has a negligible influence on the pullout force of the enlarged head anchors.
To further quantify the extent to which the structure of the normal contact force with different section inclination of the enlarged head, The normalized contact force fabrics inside the statistics region were obtained, revealing that the principal directions of these fabrics are consistently rotated towards the upper left, forming the support legs of the trapezoidal contact force chain structure. This indicates that the primary direction of the contact force chain in the soil in front of the enlarged head propagates towards the upper left. Here, the inclination angle αc of the normal contact force fabric is defined as the angle formed between the principal direction of the normal contact force fabric and the direction of movement of the anchor. The inclination angles αc of the normal contact force fabric for section inclination angles of 90°, 120°, 150°, and 170° are 31.4°, 38.1°, 39.1°, and 46.7°, respectively. This suggests that the contact force chain is increasingly biased towards horizontal forward propagation at a section inclination of the enlarged head of 90°, representing the soil resistance direction. Conversely, as the section inclination of the enlarged head increases to 170°, the principal direction of the contact force chain is biased towards the vertical. Additionally, the average contact forces
4 Discussion
Previous studies (Wu et al., 2022; Zhang et al., 2023; Wang et al., 2024) have suggested that the extrusion of the enlarged head end with the soil effectively mobilizes the end resistance and passive soil pressure. Wu et al. (2022) suggested that the excessive extrusion in front of the enlarged head forms a plastic zone and generates the loading transfer, and its plastic zone provides the end resistance more effectively. However, all the aforementioned studies have described the behavioral mechanism of the soil during the anchor pullout process macroscopically with the framework of FEM. It is still insufficient to meet the requirement for a deeper understanding of soil behavior (e.g., from a micromechanical perspective). The soil’s micromechanical mechanism of how the anchor pullout force is mobilized under different enlarged head section inclinations is still unknown. Similar to the above studies, this study also found a “compression zone” in front of the enlarged head. This is described as a triangular rigid region (shown in Figure 8). The end resistance mobilized in this compression zone is considered to be the main source of the anchor pullout force, and this study would explain this soil behavior in an insight into the micromechanical behavior. The local porosity was found to be significantly reduced in this triangular region in front of the enlarged head, which experienced significant compression. However, the extent of this compression weakened with increasing inclination of the enlarged head. The loading transfer phenomenon due to compression in front of the enlarged head was further analyzed using a contact force chain. The contact force chain structure forms an “arching” shape (shown in Figure 12A) that transfers the squeezing force from the enlarged head to the stabilized soil on the far side. Its arching footing acts firmly on the stabilized soil on the left side (meaning that the soil arching effect is produced). This is a mechanical mechanism neglected in previous studies. The degree of mobilization of the soil arching effect mechanism at different trapdoor inclinations is 120°>90°>150°>170°, which is consistent with the magnitude of the residual pullout force at this moment. It indicates that the mobilization degree of the soil arching mechanism in front of the enlarged head determines the pullout force of the enlarged head anchor. Therefore, this paper emphasizes that the degree of mobilization of the soil arching effect mechanism formed in front of the enlarged head (which can be represented by the structure of the contact force chain) is the cause of the variation of the anchor pullout force under different enlarged head inclinations. In order to draw the attention of engineers to this imperceptible micromechanical mechanism.
Although the results in this study are only obtained from numerical simulations and have not been confirmed by model tests due to limited experimental conditions. In addition, there are not enough subgroups for the enlarged head inclinations, therefore, the optimal enlarged head inclination for mobilizing the maximum pullout force of the anchors has not yet been accurately identified. However, this paper still provides a unique micromechanical insight that promotes the understanding of the mobilization mechanism of this enlarged head anchor pullout force, in order to gain the research interest of engineers in such anchoring methods when considering anchoring methods for underground structures application.
5 Conclusion
In this study, the DEM was employed to simulate the pullout test of enlarged head anchors, studying the influence of different enlarged head shapes, and confining stress on the mechanical properties of enlarged head anchors during pullout. The load-displacement curves of the enlarged head anchors were analyzed. The failure modes of the soil during the pullout test of the enlarged head anchor were determined. A comprehensive comparison of the soil mechanism in the pullout tests of the enlarged head anchor was conducted from both micro and macro perspectives. The following conclusions can be drawn:
(1) The load-displacement curves of the enlarged head anchors were recorded. During the pullout tests, anchors with an enlarged head inclination β of 120° demonstrated a superior capability to mobilize soil resistance. Additionally, both the peak and residual pullout forces are significantly greater under higher confining stress conditions compared to the lower confining stress.
(2) For a smaller section inclination of the enlarged head, the formation of a distinct rigid triangular area ahead of the enlarged head is formed to provide end resistance. When the section inclination of the enlarged head is excessively large (e.g., β = 170°), the soil in front of the enlarged head does not form the rigid triangular region during the pullout tests, thereby failing to provide greater soil resistance and a weaker pullout force is mobilized compared to anchors with smaller section inclination.
(3) For the enlarged head anchor with a section inclination of 120°, the mobilization degree of the contact force chain structure of the soil in front of the enlarged head is greatest. The degree of mobilization of the contact force chain under different section inclinations follows the order: 120° > 90° > 150° > 170°, which corresponds to the pullout force of the enlarged head anchors at this stage. Furthermore, an increase in confining stress improves the mobilization degree of the contact force chain structure, which enhances the pullout force of the enlarged head anchors.
Data availability statement
The raw data supporting the conclusions of this article will be made available by the authors, without undue reservation.
Author contributions
JG: Conceptualization, Methodology, Resources, Software, Writing – original draft. YZ: Conceptualization, Investigation, Methodology, Supervision, Writing – review and editing. JJ: Methodology, Resources, Software, Supervision, Writing – review and editing, Investigation. SY: Data curation, Investigation, Methodology, Software, Writing – review and editing. JB: Conceptualization, Investigation, Supervision, Writing – review and editing. SS: Resources, Supervision, Writing – review and editing, Software.
Funding
The author(s) declare that financial support was received for the research and/or publication of this article. This work was supported by the National Natural Science Foundation of China (No. 52368045), the Guangxi Science and Technology Base and Talent Project (No. 2021AC19244) and the Innovation Project of Guangxi Graduate Education (YCSW2023088). The authors express their appreciation for the financial assistance.
Conflict of interest
Authors JG, YZ, and JB were employed by China Shipbuilding NDRI Engineering Co., Ltd.
The remaining authors declare that the research was conducted in the absence of any commercial or financial relationships that could be construed as a potential conflict of interest.
Generative AI statement
The author(s) declare that no Generative AI was used in the creation of this manuscript.
Publisher’s note
All claims expressed in this article are solely those of the authors and do not necessarily represent those of their affiliated organizations, or those of the publisher, the editors and the reviewers. Any product that may be evaluated in this article, or claim that may be made by its manufacturer, is not guaranteed or endorsed by the publisher.
References
Athani, S., and Rognon, P. (2021). Pulling objects out of cohesive granular materials. Granul. Matter 23, 67. doi:10.1007/s10035-021-01126-1
Bao, N., Wei, J., Chen, J., and Sun, R. (2022). Interaction of soil arching under trapdoor condition: insights from 2d discrete-element analysis. Int. J. Geomech. 22, 4022066. doi:10.1061/(asce)gm.1943-5622.0002346
Chen, R., Liu, Q., Wu, H., Wang, H., and Meng, F. (2020). Effect of particle shape on the development of 2d soil arching. Comput. Geotech. 125, 103662. doi:10.1016/j.compgeo.2020.103662
Chen, Y., Deng, A., Zhao, H., Gong, C., Sun, H., and Cai, J. (2023). Model and numerical analyses of screw pile uplift in dry sand. Can. Geotech. J. 61, 1144–1158. doi:10.1139/cgj-2022-0368
Cheng, S., Ye, Y., Zeng, Y., Gao, R., and Qin, X. (2023). Numerical investigation on the debonding of cement anchorage in clay rocks based on a hybrid fem/dem model. Comput. Geotech. 156, 105276. doi:10.1016/j.compgeo.2023.105276
Du, Y., Liu, F., Zhou, M., and He, J. (2022). Multi-scale pullout behaviour of strip anchor plates embedded in marine hydrate bearing sediments. Comput. Geotech. 141, 104472. doi:10.1016/j.compgeo.2021.104472
Giampa, J. R., Bradshaw, A. S., Gerkus, H., Gilbert, R. B., Gavin, K. G., and Sivakumar, V. (2018). The effect of shape on the pull-out capacity of shallow plate anchors in sand. Géotechnique 69, 355–363. doi:10.1680/jgeot.17.P.269
He, P., Fenton, G. A., and Griffiths, D. V. (2025). Probabilistic design analysis of plate anchors in spatially variable clay. Comput. Geotech. 177, 106828. doi:10.1016/j.compgeo.2024.106828
Hu, X., He, C., Fang, Y., Wu, S., and Li, K. (2022). Laboratory experiments and discrete element modeling on the surface failure induced by epb tunneling: the effects of cutterhead open ratio and relative tunneling depth. Eng. Fail. Anal. 142, 106731. doi:10.1016/j.engfailanal.2022.106731
Hu, X., He, C., Lai, X., Walton, G., Fu, W., and Fang, Y. (2020). A dem-based study of the disturbance in dry sandy ground caused by epb shield tunneling. Tunn. Undergr. Space Technol. 101, 103410. doi:10.1016/j.tust.2020.103410
Jeong, S. Y., Choi, H. Y., and Lee, S. R. (2007). Uplift behavior of under-reamed anchors in sandbed. Int. J. Offshore Polar Eng. 17.
Jiang, M. J., Yu, H. S., and Harris, D. (2005). A novel discrete model for granular material incorporating rolling resistance. Comput. Geotech. 32, 340–357. doi:10.1016/j.compgeo.2005.05.001
Kou, H., Guo, W., and Zhang, M. (2015). Pullout performance of gfrp anti-floating anchor in weathered soil. Tunn. Undergr. Space Technol. 49, 408–416. doi:10.1016/j.tust.2015.06.001
Lai, H., Zheng, J., Zhang, J., Zhang, R., and Cui, L. (2014). Dem analysis of “soil”-arching within geogrid-reinforced and unreinforced pile-supported embankments. Comput. Geotech. 61, 13–23. doi:10.1016/j.compgeo.2014.04.007
Liao, H. J., and Hsu, S. T. (2003). Uplift behavior of blade-underreamed anchors in silty sand. J. Geotech. Geoenviron. Eng. 129, 560–568. doi:10.1061/(ASCE)1090-0241(2003)129:6(560)
Liu G, G., Jia, P., Sun, J., Jiang, Z., Yang, F., Yang, G., et al. (2024). Research and application of new anti-floating anchor in anti-floating reinforcement of existing underground structures. Front. Earth Sci. 12. doi:10.3389/feart.2024.1364752
Liu, M., Meng, F., Liu, Z., and Chen, R. (2024). Observed soil arching-induced ground deformation and stress redistribution behind braced excavation. Can. Geotech. J. 61, 2735–2754. doi:10.1139/cgj-2023-0227
Liu, Q., Wang, H., Chen, R., Yin, Z., Lin, X., and Wu, H. (2022). Effect of relative density of 2d granular materials on the arching effect through numerical trapdoor tests. Comput. Geotech. 141, 104553. doi:10.1016/j.compgeo.2021.104553
Maitra, S., Tian, Y., and Cassidy, M. J. (2024). The ultimate state of anchoring systems from integrated analysis of a plate anchor and mooring line. J. Geotech. Geoenviron. Eng. 150, 4024097. doi:10.1061/JGGEFK.GTENG-12517
Niroumand, H., and Kassim, K. A. (2014). Uplift response of irregular-shaped anchor in cohesionless soil. Arab. J. Sci. Eng. 39, 3511–3524. doi:10.1007/s13369-014-0952-7
Oda, M., and Kazama, H. (1998). Microstructure of shear bands and its relation to the mechanisms of dilatancy and failure of dense granular soils. Géotechnique 48, 465–481. doi:10.1680/geot.1998.48.4.465
Ovesen, N. K. (1979). “The use of physical models in design: the scaling law relationship,” in Proceedings of the 7th European conference on soil mechanics and foundation engineering. 323, 318.
Rothenburg, L., and Bathurst, R. J. (1989). Analytical study of induced anisotropy in idealized granular materials. Géotechnique 39, 601–614. doi:10.1680/geot.1989.39.4.601
Shahin, M. A., and Jaksa, M. B. (2006). Pullout capacity of small ground anchors by direct cone penetration test methods and neural networks. Can. Geotech. J. 43, 626–637. doi:10.1139/t06-029
Wang, J., Xia, H., Cai, H., and Hua, J. (2024). Study on the influence of anchor plate parameters on the bearing characteristics of the new large-diameter multi-plate soil anchor and creep property of anchor. Sci. Rep. 14, 28158. doi:10.1038/s41598-024-79783-4
Wu, C., Kong, L., Guo, Q., and Cao, H. (2022). Enlarged head pressure-dispersed anchor cable for foundation pit engineering purposes. Appl. Sci. 12 (23). doi:10.3390/app122312400
Wu, J., Wong, H. S., Zhang, H., Yin, Q., Jing, H., and Ma, D. (2024). Improvement of cemented rockfill by premixing low-alkalinity activator and fly ash for recycling gangue and partially replacing cement. Cem. Concr. Compos. 145, 105345. doi:10.1016/j.cemconcomp.2023.105345
Wu, J., Yang, S., Williamson, M., Wong, H. S., Bhudia, T., Pu, H., et al. (2025). Microscopic mechanism of cellulose nanofibers modified cemented gangue backfill materials. Adv. Compos. Hybrid. Mater. 8, 177. doi:10.1007/s42114-025-01270-9
Xu, C., Zhang, X., Han, J., and Yang, Y. (2019). Two-dimensional soil-arching behavior under static and cyclic loading. Int. J. Geomech. 19, 4019091. doi:10.1061/(asce)gm.1943-5622.0001482
Zhang, S., Wang, Y., Li, C., Wang, C., Zhang, G., and Sun, S. (2023). Study on the style design and anchoring mechanism of enlarged head anchors. Sustainability 15, 8645. doi:10.3390/su15118645
Zhao, H., Duan, K., Zheng, Y., Zhang, Q., Zhang, L., Jiang, R., et al. (2024). Failure mechanism of fully grouted rock bolts subjected to pullout test: insights from coupled fdm-dem simulation. Int. J. Numer. Anal. Methods Geomech. 48, 3979–3996. doi:10.1002/nag.3824
Keywords: enlarged head anchors, discrete element method (DEM), pullout tests, soil resistance, soil failure mode
Citation: Gao J, Zhu Y, Jiang J, Yin S, Bi J and Shen S (2025) Analysis of pullout bearing capacity of enlarged head anchors and soil failure modes using discrete element method. Front. Earth Sci. 13:1564712. doi: 10.3389/feart.2025.1564712
Received: 22 January 2025; Accepted: 20 March 2025;
Published: 01 April 2025.
Edited by:
Jiangyu Wu, China University of Mining and Technology, ChinaReviewed by:
Xilin Lu, Tongji University, ChinaRui Rui, Wuhan University of Technology, China
Yonghui Li, Zhengzhou University, China
Copyright © 2025 Gao, Zhu, Jiang, Yin, Bi and Shen. This is an open-access article distributed under the terms of the Creative Commons Attribution License (CC BY). The use, distribution or reproduction in other forums is permitted, provided the original author(s) and the copyright owner(s) are credited and that the original publication in this journal is cited, in accordance with accepted academic practice. No use, distribution or reproduction is permitted which does not comply with these terms.
*Correspondence: Jie Jiang, amllamlhbmdAZ3h1LmVkdS5jbg==