 Katsuichiro Goda
 Patricio A. Catalan
- 1Department of Earth Sciences, Western University, London, ON, Canada
- 2Departamento de Obras Civiles, Universidad Técnica Federico Santa María, Valparaiso, Chile
A multi-hazard spatial mapping for shaking and tsunami risks is necessary for coastal communities that face imminent dangers from megathrust subduction earthquakes. Conventional single-hazard (seismic or tsunami) mapping methods are not effective in addressing this research gap because the individual hazard effects cannot be combined directly. This study presents a new risk-based multi-hazard microzonation method, which displays relative risks of a representative building asset due to earthquakes and tsunamis within a local community and applies it to the District of Tofino in British Columbia, Canada, which is located in the Cascadia subduction zone. A recently developed catastrophe model is used to generate a comprehensive set of multi-hazard loss data for Tofino by reflecting two local factors, i.e., site amplification proxy for shaking and high-resolution topography for tsunami. The risk-based multi-hazard microzonation maps capture spatially varying loss contributions from shaking and tsunami hazards at different annual probability of exceedance levels. Different visualization approaches can be considered to facilitate the disaster risk management and risk communications with residents and stakeholders.
1 Introduction
Coastal communities located in subduction zones are threatened by crustal, inslab, and interface earthquakes (Hyndman and Rogers, 2010). The latter, especially caused by megathrust subduction events, such as the 2004 Indian Ocean earthquake (Ghobarah et al., 2006), the 2010 Maule Chile earthquake (Fritz et al., 2011), and the 2011 Great East Japan earthquake (Fraser et al., 2013), can generate intense, long-duration ground shaking and massive tsunamis and devastate many coastal cities and towns across a large geographical area. Seismic and tsunami hazard mapping is a primary tool to quantify the potential impacts due to tsunamigenic earthquakes (Baker et al., 2021; Goda et al., 2025). Moreover, natural catastrophe models can be used to calculate the economic loss due to earthquakes and tsunamis (Mitchell-Wallace et al., 2017; Goda and De Risi, 2023) and to promote effective disaster risk management for the insurance-reinsurance industry and governmental organizations (OECD, 2018). Recent studies have extended conventional risk assessments for individual hazards to multi-hazard risk assessments by accounting for cascading trigger sources and compounding consequences to exposed assets (Selva, 2013; Park et al., 2019). Such multi-hazard risk assessments facilitate the cost-benefit analysis of available risk mitigation options and improve the resilience of coastal communities and infrastructures (Ayyub, 2014; Akiyama et al., 2020).
Hazard microzonation provides the basis for site-specific analysis of natural hazard impact and is primarily focused on relative spatial variation of the hazard parameter by reflecting local characteristics. Typically, hazard microzonation subdivides an area into zones based on influential site-specific factors and provides more detailed hazard mapping at local scale, compared to nationwide hazard mapping (e.g., several ten to hundred meters versus several kilometers). Seismic microzonation is often targeted for a hazard type, such as shaking, liquefaction, and landslide (Yamazaki and Maruyama, 2011). It can be carried out based on geological/geomorphological classification maps (Matsuoka et al., 2015) and a combination of geophysical data, such as dense borehole databases and microtremor measurements (Molnar et al., 2020). A popular local parameter is the average shear-wave velocity in the top 30 m (Vs30), which serves as a proxy for site amplification and is compatible with national seismic hazard assessment. Similarly, the concept of microzonation has been applied to tsunami hazard mapping by displaying the predicted tsunami inundation depths and extents in coastal cities and towns for selected worst-case scenarios (Salamon et al., 2007). The influential factors for tsunami inundation are elevation and surface roughness (Kaiser et al., 2011). More recently, Zamora et al. (2021) proposed to consider tsunami wave arrival time as target parameter by emphasizing its relevance to tsunami evacuation. In conducting microzonation for both hazard types, availability of local influential factors in high spatial resolutions and their implementations in ground motion and tsunami simulations are crucial.
It is common to conduct seismic and tsunami hazard mapping separately, which is in accordance with the categorization by Zschau (2017) as ‘Single Hazard, Single Risk’. Currently, there is no established approach to consider multi-hazard impacts in a unified way (Kappes et al., 2012; Marzocchi et al., 2012; Zschau, 2017; Hochrainer-Stigler et al., 2023). This situation partly stems from differences in conventional seismic and tsunami hazard mapping methods and their qualitative and quantitative indices and/or metrics. In seismic hazard mapping, independent site-specific hazard assessments are the most common by taking into account a comprehensive set of probabilistic (stochastic) scenarios and the results are summarized as site-specific uniform hazard spectra (Baker et al., 2021). On the other hand, in tsunami hazard mapping, scenario-based hazard assessments (without explicitly considering the occurrence process or likelihood of scenarios) are widely used to visualize detailed inundation characteristics for a limited number of earthquake rupture cases (Goda et al., 2025). A full probabilistic tsunami hazard analysis (which considers the probability of tsunamigenic events using a comprehensive stochastic event set) is becoming more popular but is often focused upon offshore locations with relatively crude spatial resolutions. For the multi-hazard mapping, both scenario-based and stochastic event approaches are viable. In characterizing the hazard and risk processes probabilistically, scenario-based assessments can also be fully probabilistic (apart from the occurrence process or likelihood of scenarios) (Goda et al., 2021). Another important limitation of the above-mentioned hazard-based microzonation is the lack of rational methods to combine the ‘hazard’ effects of ground shaking and tsunami inundation at local levels directly, for instance, as cascading phenomena (e.g., Kappes et al., 2012). To overcome these limitations, risk-based multi-hazard microzonation should be implemented, noting that the exposed population or asset is subjected to both hazards (in cascade) and the risk quantification for these people and assets are the ultimate goal of seismic and tsunami microzonation. According to the classification schemes suggested by Zschau (2017), there are three multi-hazard categories: (i) ‘Multilayer Single Hazard, Single Risk’ approach does not consider hazard interaction nor compounding effects in vulnerability, (ii) ‘Multihazard, Multihazard Risk’ considers hazard interaction but no compounding effects in vulnerability, and (iii) ‘Multihazard, Multirisk’ accounts for both hazard interaction and vulnerability compounding. Ideally, the risk-based multi-hazard microzonation mapping should be conducted by adopting quantitative risk models that account for hazard interaction and compounding vulnerability (i.e., (ii) or (iii)).
This study proposes a risk-based microzonation approach for earthquakes and tsunamis by jointly evaluating the effects of shaking and tsunami risks at individual sites within a coastal city/town. An advantage of the risk-based multi-hazard microzonation mapping is that local risk profiles from multiple hazards are integrated from at-risk asset’s perspective and visualized on a single map. The proposed approach focuses upon the District of Tofino, British Columbia, Canada, which is exposed to the Cascadia subduction earthquakes as well as other seismic sources. The most recent Cascadia earthquake occurred in 1700 with moment magnitude (Mw) of 9.0 and ruptured the whole margin of the subduction zone (Goldfinger et al., 2012; Walton et al., 2021). It is the most dominant earthquake-tsunami threat in the Pacific Northwest of North America. To demonstrate the new multi-hazard microzonation approach, a quantitative multi-hazard risk assessment is carried out by using a catastrophe model developed by Goda (2024). This model involves earthquake occurrence modeling, stochastic source modeling, ground motion simulation, tsunami inundation simulation, seismic damage assessment, and tsunami damage assessment, and produces exceedance probability loss curves of buildings. For the risk-based microzonation mapping, the most prevalent building is adopted as a representative at-risk asset in Tofino. The results are displayed as loss maps for single-hazard and multi-hazard cases by considering different return periods. Multiple methods for visualizing microzonation maps are demonstrated. This study is distinct from Goda (2024) in that site-specific risk assessments are performed, instead of a building portfolio within the community, and relative risk profiles due to earthquakes and tsunamis are primarily evaluated to promote the community’s disaster risk management based on multi-hazard microzonation.
2 Multi-hazard risk model for earthquakes and tsunamis
This section presents an earthquake-tsunami risk model for a typical building in Tofino by considering megathrust sources and other (crustal/inslab) sources in the Cascadia subduction zone. In Section 2.1, the physical and built environments of Tofino are summarized. In Tofino, detailed building information and local site information that can be used for seismic and tsunami microzonation are available from the West Coast Probabilistic Earthquake and Tsunami Risk Assessment project (Novakovic et al., 2023). By examining the building portfolio data, a representative at-risk asset in Tofino is chosen. Subsequently, in Section 2.2, a multi-hazard risk model for earthquakes and tsunamis (Goda, 2024) is introduced, which is used to generate numerical results for deriving site-specific single-hazard and multi-hazard exceedance probability loss curves and for producing risk-based single-hazard and multi-hazard microzonation maps (Section 3).
2.1 Physical and built environments of the District of Tofino
2.1.1 Cascadia subduction zone and regional seismicity
The Cascadia subduction zone extends 1,100 km from British Columbia, Canada, to Northern California, United States of America, and is influenced by movements of four tectonic plates in the Pacific Northwest. Figure 1a shows the relative plate motions of the three oceanic plates (i.e., the Juan de Fuca, Gorda, and Explorer) with respect to the continental North American Plate (DeMets et al., 2010). Various studies investigated the history of megathrust subduction events using paleo-seismic/tsunami onshore and offshore deposits (Walton et al., 2021). One of the most comprehensive histories was compiled by Goldfinger et al. (2012) using radiocarbon dating and stratigraphic correlation techniques, applied to marine turbidite core samples. Figure 1b shows the rupture history of the Cascadia subduction zone in the Holocene (Goldfinger et al., 2012). Among identified 40 ruptures, 19 were estimated to be full-margin rupture (typically, Mw 8.7 to Mw 9.1), while the remaining 21 were estimated to be partial rupture (typically, Mw 8.0 to Mw 8.7), concentrating in the central to southern margins of the Cascadia subduction zone. From the seismic-tsunami risk perspectives, the full margin ruptures are of relevance to coastal cities and towns in British Columbia because of their proximity. The mean recurrence period of megathrust earthquakes is 530 years and 325 years have passed since the last full-margin event in 1,700 (Goldfinger et al., 2012). The recurrence interval of two successive events can vary widely between 120 years and 1,380 years and their recurrence patterns exhibit clusters and long gaps, which do not follow a Poisson process (Goda, 2023).
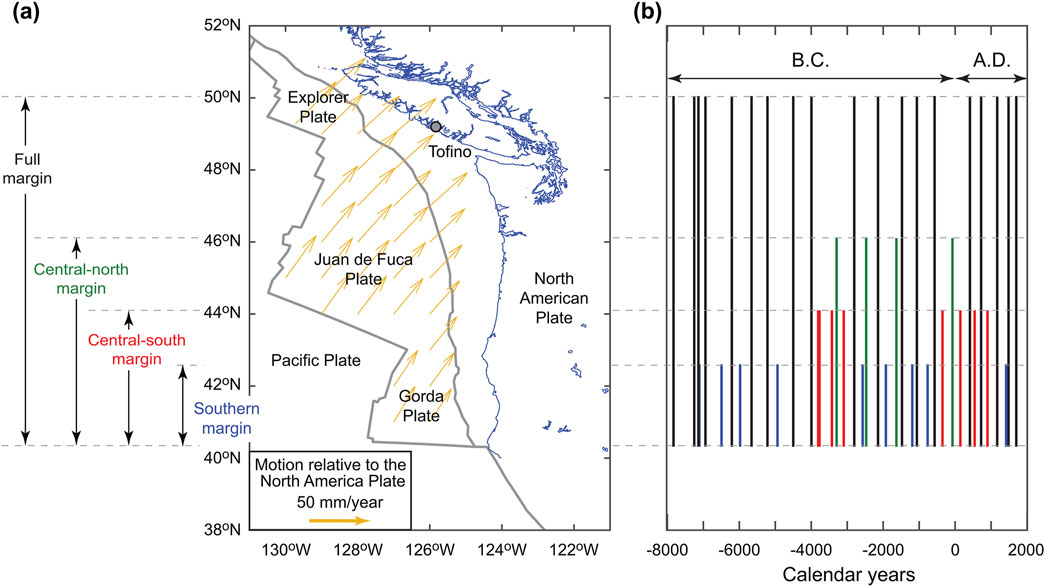
Figure 1. (a) Map of the Cascadia subduction zone in the Pacific Northwest. The relative plate motion between the Pacific Plate and the North American Plate is based on DeMets et al. (2010). (b) Rupture history of the past Cascadia subduction earthquakes based on Goldfinger et al. (2012).
In addition to the megathrust interface events from the Cascadia subduction zone, regional seismicity in southwestern British Columbia is affected by deep seismicity and shallow crustal seismicity. Historically, the deeper portion of the subducting oceanic plate generated damaging inslab events beneath Puget Sound in 1949, 1965, and 2001, whereas the continental plate hosted damaging earthquakes in the Strait of Georgia in 1918 and 1946 (Cassidy et al., 2010). In the national seismic hazard model of Canada (Halchuk et al., 2014), two areal source zones are defined to capture seismic events occurring in the subducting slab (i.e., GTP source with earthquake magnitudes up to 7.5, placed at focal depths of 50 km or deeper) and in the upper crust (i.e., PGT source with earthquake magnitudes up to 7.7, placed at depths of 20 km or shallower). On the other hand, the seismicity from the Cascadia subduction zone is captured by a fault source (i.e., CIS source with earthquake magnitudes between 8.5 and 9.2). Other active sources of earthquake hazards for communities on Vancouver Island are offshore earthquakes.
2.1.2 District of Tofino
Tofino is a coastal town on Vancouver Island and is a popular destination for tourists because of its wild natural scenery, sandy beaches, lakes, inlets, and ancient rainforests. The current population in Tofino is about 2,500, while in summer seasons, its daily population exceeds 10,000. A map of Tofino is shown in Figure 2a. The main commercial area of Tofino Town is at relatively high elevation (∼20 m above mean sea level) and does not face the Pacific Ocean directly (i.e., low tsunami exposure), while beach areas are at low elevation, occupied by houses, resort hotels, and campsites, and face the Pacific Ocean directly (i.e., potential high tsunami exposure).
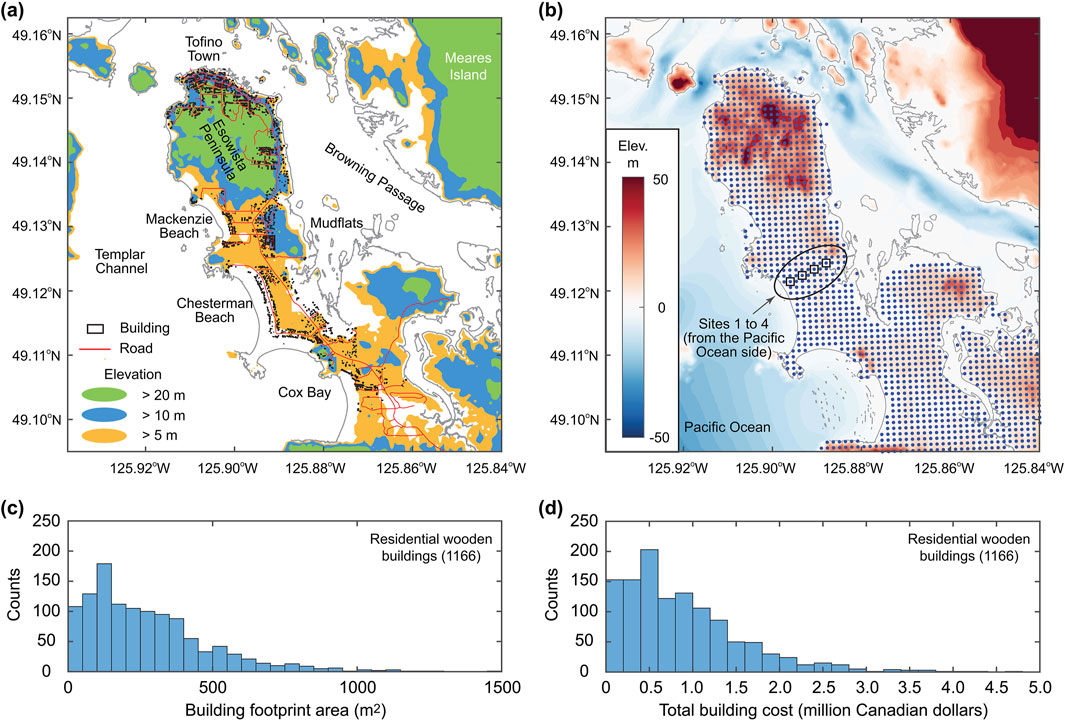
Figure 2. (a) Map of Tofino with buildings and roads. (b) Locations of 1,426 grid points for microzonation mapping. (c) Histogram of the building footprint area of residential wooden buildings in Tofino. (d) Histogram of the total building cost of residential wooden buildings in Tofino. Square markers that are enclosed by an oval, shown in (b), indicates the locations of four specific sites that are considered in Section 3.1.
For risk-based microzonation mapping, a representative building is placed over the land area of the District of Tofino (not just where buildings and infrastructures are constructed). For this purpose, 1,426 grid points are defined with 100 m spacing over the areas with elevations above 0.5 m. This is shown in Figure 2b.
The representative building can be determined by examining the characteristics of existing buildings in Tofino. For this purpose, a complete building inventory database, created by the District of Tofino in 2022, can be used (Novakovic et al., 2023; Goda, 2024 for details). Each entry is confirmed by building-by-building surveys and is assigned with a seismic design category (high-code, moderate-code, low-code, and pre-code). In the database, buildings are classified into six structural material categories (concrete, steel, reinforced masonry, unreinforced masonry, wood, and manufactured) and four occupancy/use categories (civic, commercial, industrial, and residential). The database also includes building specific information on construction year, story number, building value, and building footprint (see Goda (2024) for details). Each entry is confirmed by building-by-building surveys and is assigned with a seismic design category (high-code, moderate-code, low-code, and pre-code; Hobbs et al., 2021). Among 1,789 buildings in Tofino, the most dominant typology is a residential wooden building with pre-code seismic design level (1,166 buildings have ‘RES1-W1-PC’ classification label). Figures 2c,d show histograms of the footprint area and the total cost of the 1,166 residential wooden buildings. By taking the mean of the building cost data, the representative building has the total cost of 880,000 Canadian dollars (C$), consisting of structural elements (C$ 175,000), non-structural elements (C$ 635,000), and contents (C$ 70,000).
2.1.3 Local influential factors for seismic and tsunami microzonation
The local geology of the District of Tofino consists of an organic layer of forest litter overlying native soils comprising soft to stiff clay-silt and/or loose to compact sand at relatively shallow depth (British Columbia Ministry of the Environment, 1985). These surficial deposits are underlain by Triassic to Lower Cretaceous volcanic and volcaniclastic rock. Such subsurface conditions are confirmed by available geotechnical drilling log data acquired by the District of Tofino.
A geotechnical assessment team of the West Coast Probabilistic Earthquake and Tsunami Risk Assessment project (Novakovic et al., 2023) carried out a non-invasive seismic field campaign (57 microtremor recordings and 9 seismic array testing) to achieve seismic site assessment throughout the District of Tofino. The sites for microtremor measurements covered the District of Tofino comprehensively (except for the hilltop of the Esowista Penunsula Figure 2a), while the sites for seismic array measurements, which require a sufficiently wide-open space, were placed along the Esowista Penunsula. Using the microtremor data, the fundamental site resonance frequencies can be estimated (note: when the representative shear wave velocity of the top layer is available, its thickness can be inferred through the quarter wavelength method). On the other hand, seismic array data allow the estimation of the surface wave dispersion curve. When both fundamental site resonance frequency and surface wave dispersion curve are available, these data can be jointly inverted to obtain a constrained shear wave velocity (Vs) profile. Then, the estimated Vs profile can be used to compute the Vs30 value. In the West Coast Probabilistic Earthquake and Tsunami Risk Assessment project, the estimation of Vs30 values at untested locations was conducted using a Voronoi tessellation method by taking into account available surficial geology map (British Columbia Ministry of the Environment, 1985) and the estimated fundamental site resonance frequencies. Subsequently, the obtained Vs30 values were employed to determine the National Building Code of Canada seismic site class (Humar, 2015). The results of the estimated Vs30 values in terms of the grids shown in Figure 2b, are displayed in Figure 3a. The tip of the Esowista Peninsula, where Tofino Town is located, is with high Vs30 values (i.e., rock with thin soil cover), whereas the beach areas along the Pacific Ocean coast are with low Vs30 values (i.e., soft-to-stiff soil). Hence, the southern part of Tofino is more susceptible to higher ground motions than the northern part for a given seismic event.
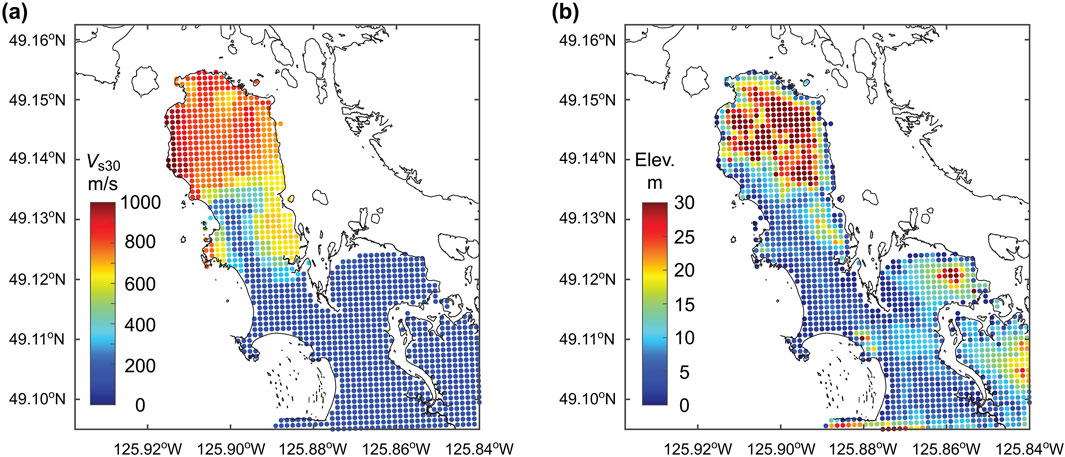
Figure 3. (a) Vs30 map for Tofino. (b) Elevation map for Tofino.
For tsunami inundation, accurate near-shore bathymetry and on-shore elevation data are crucial. The District of Tofino obtained 1-m bathymetry data in the Templar Channel (i.e., Pacific Ocean side of the Esowista Peninsula) and 0.5-m LiDAR-derived topographic data in 2018. These data were employed to create 5-m resolution computational grids for tsunami simulations (Goda, 2024), thereby local inundation profiles can be evaluated accurately. The elevation profiles in terms of the grids shown in Figure 2b, are displayed in Figure 3b. The inundation hazard is possibly low in Tofino Town due to relatively high elevation and indirect exposure to the Pacific Ocean, whereas the inundation hazard could be high in the beach areas due to low elevation and direct exposure to the Pacific Ocean.
2.2 Earthquake-tsunami risk model
The earthquake-tsunami risk model for Tofino, developed by Goda (2024), can be used for quantifying the effects of the local influential factors (Section 2.1.3) on the single-hazard and multi-hazard risks of the representative building (Section 2.1.2). The risk assessment is performed based on a Monte Carlo method, integrating stochastic event sets and scenario-based earthquake-tsunami damage assessments. A flowchart of this risk model is shown in Figure 4; a graphical version of this flowchart is included in Supplementary Material. Since the main research contribution of this study is not on the development/improvement of such an applicable risk model but on risk-based multi-hazard microzonation mapping, detailed descriptions of the earthquake-tsunami risk model are omitted and only the main model components are explained in this section. Interested readers are recommended to consult with Goda (2024).
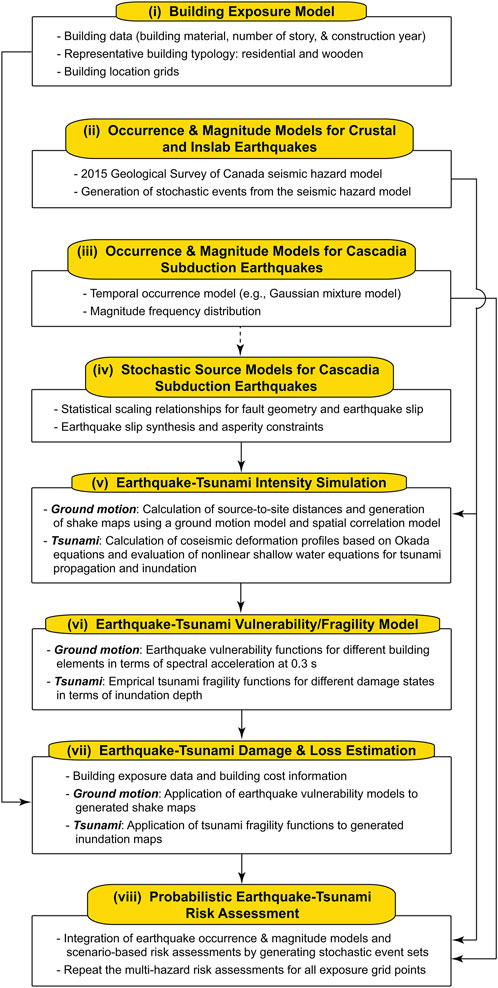
Figure 4. Flowchart of probabilistic earthquake-tsunami risk assessment with steps/components (i) building exposure model, (ii) seismic source models for crustal and inslab earthquakes, (iii) occurrence and magnitude models for the Cascadia subduction earthquakes, (iv) stochastic source models for the Cascadia subduction earthquakes, (v) earthquake-tsunami intensity simulations, (vi) earthquake vulnerability and tsunami fragility models, (vii) earthquake-tsunami damage and loss simulations, and (viii) probabilistic earthquake-tsunami risk assessment. A graphical version of this flowchart is available in Supplementary Material.
The probabilistic earthquake-tsunami risk assessment can be divided into eight steps (Figure 4). For the megathrust Cascadia subduction events, full-margin ruptures only are considered in the risk assessment. This is because when the main rupture areas are in the central and southern margins of the Cascadia subduction zone (Figure 1), the source-to-site distances become large (more than 200 km) and these rupture sources along the U.S. coast do not radiate large tsunami waves towards Canada (Goda, 2022).
i. Building exposure model: A suitable building model for microzonation mapping is selected based on available exposure data. For Tofino, a wooden house with pre-code seismic design is applicable. This representative building is placed at grid points defined over the study area. This approach represents assessing the risk levels of both existing and prospective buildings of this type, rather than a snapshot of existing assets. Differentiating local factors for earthquake and tsunami risks are defined within the study area (Figure 3). A duration of the earthquake and tsunami risk assessment, T, and the number of stochastic event sets, N, are chosen to obtain stable results.
ii. Occurrence and magnitude models for non-tsunamigenic earthquakes: Non-tsunamigenic seismic sources, such as crustal and inslab earthquakes that occur in the Cascadia subduction zone, can cause seismic damage and loss to buildings and infrastructure. For this purpose, a seismic hazard model, which typically consists of an earthquake occurrence model and a magnitude model, can be adopted. In the current study, the national seismic hazard model developed by the Geological Survey of Canada is adopted (Halchuk et al., 2014). Using the seismic hazard model information (seismic source zones, magnitude recurrence relationships, and their associated logic-tree models), stochastic event sets, which are accompanied with occurrence time, magnitude, location, and other information (e.g., faulting mechanism), can be generated. It is assumed these events do not affect the tsunami hazard.
iii. Occurrence and magnitude models for tsunamigenic earthquakes: The recurrence characteristics of megathrust subduction events can be approximated by a time-dependent renewal process. More specifically, the 3-component Gaussian mixture model can be adopted as the inter-arrival time distribution for the full-margin Cascadia subduction events (Goda, 2023). This model was developed based on the offshore marine turbidite records (spanning 10,000 years) estimated by Goldfinger et al. (2012) and captures the uncertainty due to radiocarbon dating techniques in determining the earthquake occurrence history. When generating the first Cascadia subduction event, the conditional probability distribution for the interarrival time of the Cascadia earthquakes is used to account for the elapsed time since the last megathrust event (Goda, 2023). For the magnitude model of the full-margin rupture cases (between Mw 8.7 and Mw 9.1), the truncated exponential model can be considered. Using the adopted occurrence and magnitude models, stochastic event sets for the Cascadia subduction earthquakes can be generated. In this process, neither far-field nor regional field tsunamis are considered, nor other tsunamigenic sources.
iv. Stochastic source models for tsunamigenic earthquakes: The finite-fault dimensions and their positions within the overall fault plane have significant impacts on both ground motion and tsunami simulations. For ground motions, source-to-site distances are directly influenced by such geometrical characteristics. For tsunamis, in addition to fault geometry and position, rupture characteristics, such as earthquake slip distribution, have significant effects. To capture these uncertainties, earthquake ruptures are synthesized using the stochastic source models for the Cascadia subduction earthquakes (Goda, 2022). Specifically, 2,000 stochastic source models are generated for the full-margin rupture scenarios, having moment magnitudes between Mw 8.7 and Mw 9.1. In simulating the stochastic source models for the Cascadia megathrust rupture cases, statistical scaling relationships of Goda et al. (2016) are employed to generate values of fault source parameters, such as fault length, fault width, mean and maximum slips, and correlation length parameters. Subsequently, synthetic earthquake slip distributions are generated over the simulated fault plane. During this simulation, several constrains are applied to ensure that the generated stochastic source models are consistent with known geological and geophysical constrains of the Cascadia subduction zone.
v. Earthquake and tsunami intensity simulations: For a given seismic event, ground motion intensities (i.e., spectral acceleration at 0.3 s, Sa (0.3)) at the grid points for microzonation can be generated using applicable ground motion models and intra-event spatial correlation model. The choice of Sa (0.3) as a main ground motion intensity parameter can be explained from two aspects. Firstly, the past empirical and experimental studies in California and Canada indicated that Sa (0.3) is an efficient seismic intensity measure for earthquake insurance loss (Wesson et al., 2004) and that the vibration periods of typical constructions in British Columbia are in the range between 0.25 s and 0.4 s (White and Ventura, 2006). Secondly, the seismic vulnerability functions for low-rise wooden buildings adopt Sa (0.3) as an input seismic hazard parameter (Hobbs et al., 2021; see Step (vi) below). In this study, a composite ground motion model by Atkinson and Adams (2013), which was considered in the national seismic hazard model for Canada (Halchuk et al., 2014), is implemented together with the logic tree branches and weights. The effects of local Vs30 profiles in Tofino (Figure 3a) are reflected in the ground motion simulations. The consideration of the intra-event spatial correlation model facilitates the simulation of spatially correlated ground motion fields at the grid locations.
For the tsunamigenic Cascadia subduction earthquakes (i.e., stochastic source models generated in Step (iv)), initial displacement profiles of sea surface can be evaluated using analytical formulae by Okada (1985) and then nonlinear shallow water equations can be solved numerically using the finite-difference method (Goto et al., 1997). The results of the tsunami simulations, when implemented with a nested grid system (the finest grid resolution that covers the District of Tofino is set to 5 m), can capture detailed local topographical effects (Figure 3b) on inundation flow depths. For all computational cells, the bottom friction and surface roughness are represented by a Manning’s coefficient equal to 0.025 m-1/3s, which is considered a conservative value (Cárdenas and Catalán, 2022). These simulations are carried out by taking into account variability associated with random realizations.
vi. Earthquake vulnerability and tsunami fragility functions: The seismic vulnerability functions for the representative building in Tofino are obtained from Hobbs et al. (2021), which define the mean loss ratios for structural, non-structural, and contents elements as a function of spectral acceleration at 0.3 s. To account for the uncertainty associated with the loss ratio, a lognormal random variable with the mean loss predicted by the vulnerability functions and the coefficient of variation equal to 0.3 is used. For a given shaking intensity level, vulnerability functions for the three components are evaluated separately (by considering their uncertainties) and then these generated (random) seismic losses are summed to obtain the total seismic loss for a building, noting that the proportions of the component costs are specified by Hobbs et al. (2021).
The tsunami damage assessment is carried out using tsunami fragility functions. Because there are no directly applicable tsunami fragility functions to Canadian buildings, an empirical tsunami fragility model by De Risi et al. (2017) is adopted. This model was developed using extensive tsunami damage data of the 2011 Great East Japan earthquake. The intensity parameter of the tsunami fragility functions is flow depth at a building site. There are five tsunami damage states, i.e., minor, moderate, extensive, complete, and collapse, which are associated with damage ratio ranges of 0.03–0.1, 0.1–0.3, 0.3–0.5, 0.5–1.0, and 1.0, respectively. The realization of tsunami damage states can be achieved by generating a uniform random number between 0 and 1 and by comparing it with calculated probabilities for different damage states for a given flow depth. Once the tsunami damage state is determined, a tsunami damage ratio is sampled from the range for the selected damage state by considering a uniform distribution (e.g., for the moderate damage state, a uniform random value is generated between 0.1 and 0.3) and is used to calculate the tsunami loss for the building.
For the multi-hazard loss estimation, the larger of the shaking building loss and tsunami building loss for a given scenario is adopted. This is a simple approach where the resulting state after the earthquake is not considered to affect the tsunami vulnerability.
vii. Earthquake and tsunami damage and loss estimation: For a given seismic event, a shake map and an inundation map, generated in Step (v), is converted into a shaking loss map and a tsunami loss map by applying the earthquake and tsunami vulnerability/fragility functions, outlined in Step (vi). For tsunamigenic Cascadia subduction events, the generated loss maps represent random realizations of the earthquake-tsunami impact condition on the common fault rupture model (i.e., geometry, position, and slip distribution). To obtain the multi-hazard loss for a given event, the larger of the estimated losses for shaking and tsunami damage is adopted. This simplistic approach yields comparable risk indices (Kappes et al., 2012), yet it does not account for the interactive damage accumulation process between shaking and tsunami damage. As a result, a single integrated risk index is obtained at each grid point for a given megathrust event from the Cascadia subduction zone.
viii. Probabilistic earthquake and tsunami risk assessment: In the final step, Steps (iv) to (vii) are repeated for each stochastic event, generated in Steps (ii) and (iii). Note that for non-tsunamigenic earthquakes, steps related to tsunami inundation simulations and damage assessments are skipped. For each grid point, N simulated losses for single-hazard cases (i.e., Cascadia shaking, Cascadia tsunami, and non-Cascadia shaking) and for multi-hazard cases (i.e., Cascadia multi-hazard and all combined) are obtained (note: each simulated loss corresponds to T-year duration). Using these loss results, exceedance probability curves can be derived, and loss fractiles for target return period levels can be extracted. Once the above multi-hazard risk assessment is repeated for all grid locations, various risk-based microzonation maps can be produced.
It is instructive to show how Steps (iv) to (vii) work for specific stochastic sources for the Cascadia subduction events. Figure 5 presents three sets of scenario-based multi-hazard risk assessments. For each scenario, an earthquake slip distribution, shaking loss map, tsunami loss map, and multi-hazard loss map are included. As explained above, each scenario-based multi-hazard risk assessment is performed for a common source model (i.e., Figures 5a–c) and simulated shaking and tsunami loss maps (i.e., Figures 5d–i) reflect the characteristics of the common source model. The dependency of the loss maps on the simulated earthquake slip distribution is more obvious in tsunami loss maps than shaking loss maps. The existence of closer asperities in the earthquake slip distributions results in more extensive tsunami inundation (e.g., Figures 5a,g versus 5b,h). The tsunami inundation results are also strongly affected by local topography (Figure 3b). The event-to-event variability of the simulated shaking loss maps is large (e.g., Figures 5d,e show higher shaking intensities than Figure 5f) and each shaking loss map exhibits the effect of intra-event spatial correlation of seismic intensities at different grid locations. The final multi-hazard loss maps reflect the spatial distributions of the shaking and tsunami loss maps (by taking the maximum of the two per location). These scenario-based features of the shaking and tsunami losses are incorporated in the probabilistic earthquake and tsunami risk assessment.
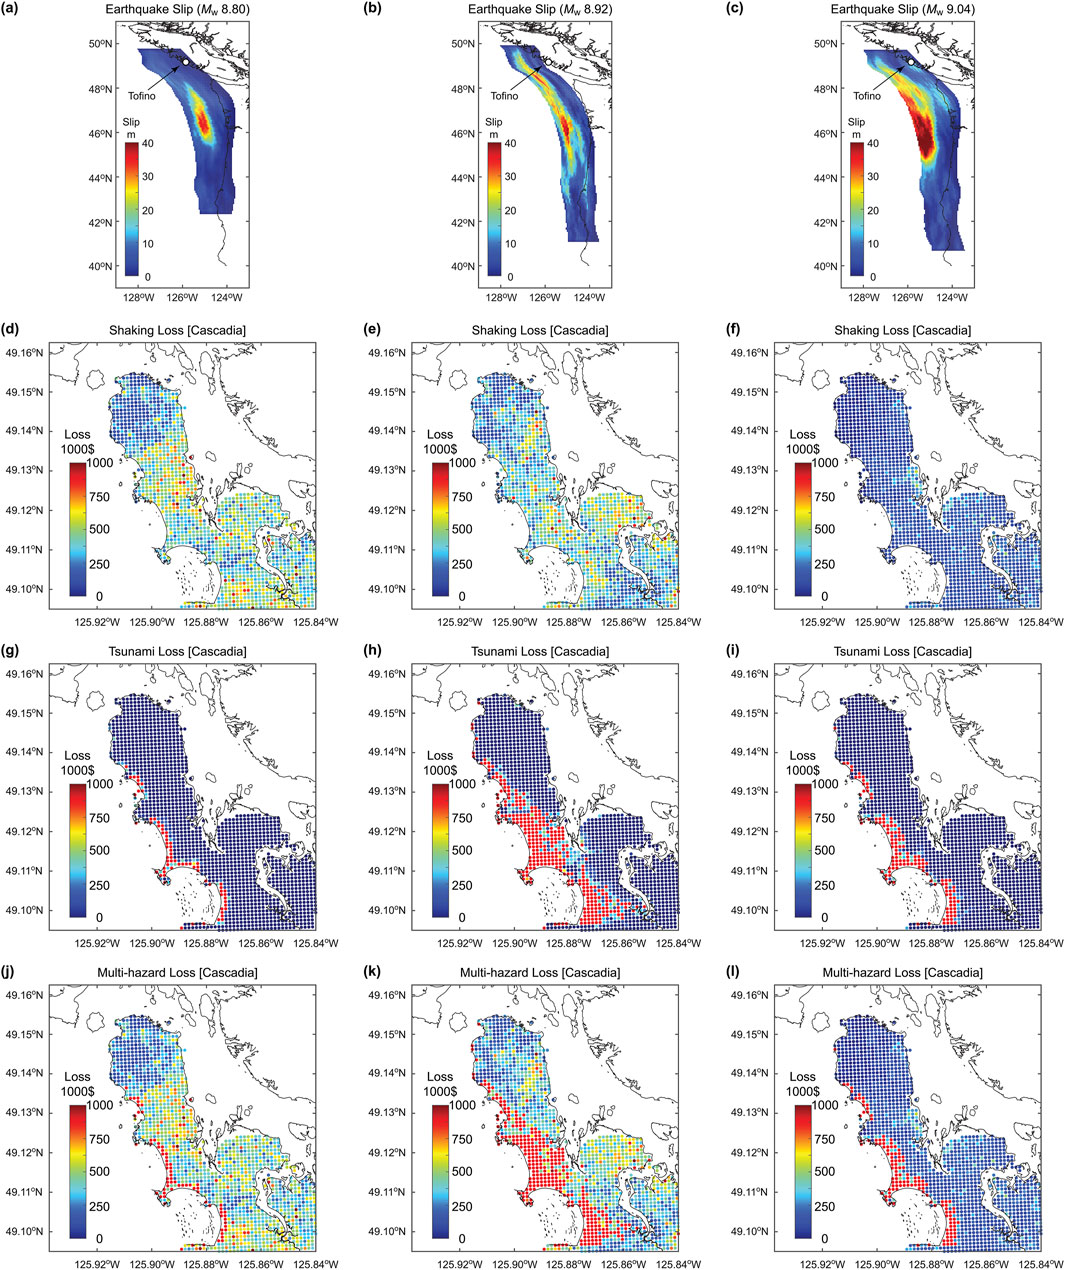
Figure 5. Earthquake slip distribution, shaking loss map, tsunami loss map, and multi-hazard loss map for three Cascadia subduction earthquake scenarios. (a,d,g,j) Mw 8.80 scenario, (b,e,h,k) Mw 8.92 scenario, and (c,f,i,l) Mw 9.04 scenario.
It is important to mention the limitations of the preceding earthquake-tsunami risk model for Tofino. It is acknowledged that there is significant uncertainty in the estimated occurrence history of megathrust subduction earthquakes, and there are alternative hypotheses that could be adopted in developing such occurrence models (Walton et al., 2021). Such alternative models could be incorporated into the earthquake-tsunami risk model using a logic tree method. From the source characterization viewpoint, partial rupture scenarios of the Cascadia subduction earthquakes are not incorporated in the risk assessment. As noted above, this omission does not cause significant underestimation of shaking and tsunami damage because of long source-to-site distances for shaking and radiation patterns of generated waves for tsunamis. Moreover, the current risk model does not include distant tsunamigenic seismic sources, such as megathrust events in Alaska and Japan. A notable limitation of tsunami inundation simulations, which has direct impact on tsunami microzonation mapping, is the consideration of uniform roughness coefficient across the study area. With heterogeneous roughness coefficients reflecting different land surface coverage, more realistic tsunami inundation modeling can be conducted. From the multi-hazard loss estimation viewpoints, the simplistic approach of combining the shaking and tsunami losses should be improved by accounting for the cumulative effects due to an earthquake-tsunami load sequence (Attary et al., 2021). Inclusion of such new models that take into account compounding effects of shaking and tsunamis in physical vulnerability will allow more accurate characterization of multi-hazard risks. From broader viewpoints, considered hazard sources can be expanded to include other geohazards (e.g., liquefaction and landslides as well as landslide-triggered tsunamis) and hydrometeorological hazards (e.g., coastal flooding and sea level rise). However, these are outside of the scope of this study.
Finally, the employed earthquake-tsunami risk model can be improved by addressing these limitations that are described in the above paragraph. The accuracy of the modeled consequences depends on the capability of the hazard-exposure-vulnerability elements of the risk model. Each model element also consists of multiple sub-models. For instance, seismic hazard assessment can be divided into spatiotemporal seismicity model, ground motion model, and local site amplification model, where the latter is the focus in conducting seismic microzonation. Whenever it is possible, it is important to validate the model against the data. On occasion, it is not feasible to validate the model as a whole. In such situations, the sub-models should be validated against available data. In the context of the adopted earthquake-tsunami risk model, the use of the seismic hazard model for crustal and inslab earthquakes in southwestern British Columbia may be judged as suitable on the basis that the national seismic hazard model for Canada was developed by the Geological Survey of Canada and various checks were conducted during the process of its development (Halchuk et al., 2014). For the megathrust events from the Cascadia subduction zone, the earthquake occurrence model was based on the longest history of the marine turbidite deposit data (Goldfinger et al., 2012; Goda, 2023), although as mentioned as one of the limitations of the employed risk model, there are alternative hypotheses about the past paleo-seismic and tsunami histories. Similarly, stochastic source modeling has been based on the global database of previously inverted source models (Goda et al., 2016), while no inversion model is available for the Cascadia subduction zone. Regarding the vulnerability modeling, a suite of national seismic vulnerability functions, developed by Hobbs et al. (2021), is deemed to be applicable to Canadian buildings (based on the best expertise available); however, its suitability has not been fully validated due to the lack of earthquake damage and loss data in Canada. On the other hand, the empirical fragility functions implemented in this risk model are based on the extensive tsunami damage data from the 2011 Tohoku earthquake in Japan (De Risi et al., 2017). Yet, its applicability to Canadian buildings has not been validated. In this study, a pragmatic approach that the multi-hazard risk model for Tofino (Goda, 2024) is applicable to risk-based multi-hazard microzonation is considered, although the model cannot be validated entirely. It is necessary to keep in mind that the multi-hazard risk mapping results presented in Section 3 depend on the capability of the adopted multi-hazard risk model and because of its unknown validity as a whole, the results may be biased.
3 Results
This section presents single-hazard and multi-hazard microzonation results, generated by using the risk model for Tofino, introduced in Section 2. The duration of the risk assessment is set to T = 1 year and the number of stochastic event sets is set to N = 10,000,000 (i.e., ten million 1-year loss samples are simulated for each grid site). Since the renewal model is adopted for the full-margin Cascadia subduction earthquakes, the elapsed time since the last major event is set to 325 years. For microzonation mapping purposes, risk levels corresponding to the return periods of 1,000, 2,500, and 5,000 years are focused upon. The return period of 2,500 years corresponds to the exceedance probability level considered for national seismic hazard mapping in Canada, while the exceedance probability levels for 1,000 and 5,000 years may also be relevant for disaster risk management perspectives.
3.1 Exceedance probability loss curves at specific locations
The multi-hazard risk model for the representative wooden house in Tofino produces exceedance probability loss curves for single-hazard and multi-hazard cases at individual locations. It is important to point out that the simple summation of the single-hazard loss curves do not result in the multi-hazard loss curves. As demonstrated in Figure 5, the Cascadia-shaking and Cascadia-tsunami losses are integrated for individual Cascadia rupture cases by taking into account the dependency of these hazards. In other words, the loss scenarios for different hazard cases at the same return period are not identical. These site-specific loss results are affected by the local factors, such as Vs30 for shaking loss and elevation for tsunami loss. To demonstrate the influences of these factors on the single-hazard and multi-hazard loss curves, four grids are selected. The locations of the four grid points are indicated in Figure 2b. From Sites 1 to 4, distances from the Pacific Ocean coast become farther and elevations become higher (except for Site 4, which is on the opposite side of the ridgeline of the Esowista Peninsula), thus, inundation risks become less. On the other hand, Vs30 values increase from Site 1 to Site 4.
Figure 6 compares exceedance probability loss curves for Cascadia-shaking, Cascadia-tsunami, non-Cascadia-shaking, and multi-hazard cases for the four sites. First, the shaking loss curves (both Cascadia and non-Cascadia) for the four locations are similar and are less variable, compared to the tsunami loss curves. The close inspection of the non-Cascadia shaking loss curves by overlaying the four cases reveals that the loss curves become severer with decreasing Vs30 values. This is because site amplifications at softer soil conditions become higher when the shaking damage is relatively small (less than 20% in terms of loss ratio). On the other hand, the close examination of the Cascadia shaking curves shows that the four curves intersect. The loss curves for softer soil conditions are severer than those for harder soil conditions, when the shaking loss levels are relatively small (similar to the non-Cascadia shaking loss curves). This trend is reversed at the higher shaking loss levels (greater than 20% in terms of loss ratio) due to the deamplification of the site effects in the short vibration period range (Humar, 2015). Second, a clear trend is evident for the tsunami loss curves of the four sites. Sites 1 and 2 are more exposed to tsunamis arriving from the Pacific Ocean side than Sites 3 and 4. Because the tsunami resistance of the residential wooden house is not so high and its fragility tends to approach the collapse damage probability of 1 at the flow depth of 2–4 m (De Risi et al., 2017), the tsunami loss curves increase rapidly. Thirdly, the multi-hazard loss curves for Sites 1 to 4 exhibit different characteristics, depending on the local influential factors and dominant features of the different causes of the building loss. In all cases, the multi-hazard loss is larger than single-hazard losses, owing to the worst-value condition. Risk-based microzonation maps, which will be discussed in the following section, aim to capture different loss contributions at different locations and to display on maps to convey relative risk levels across the study area.
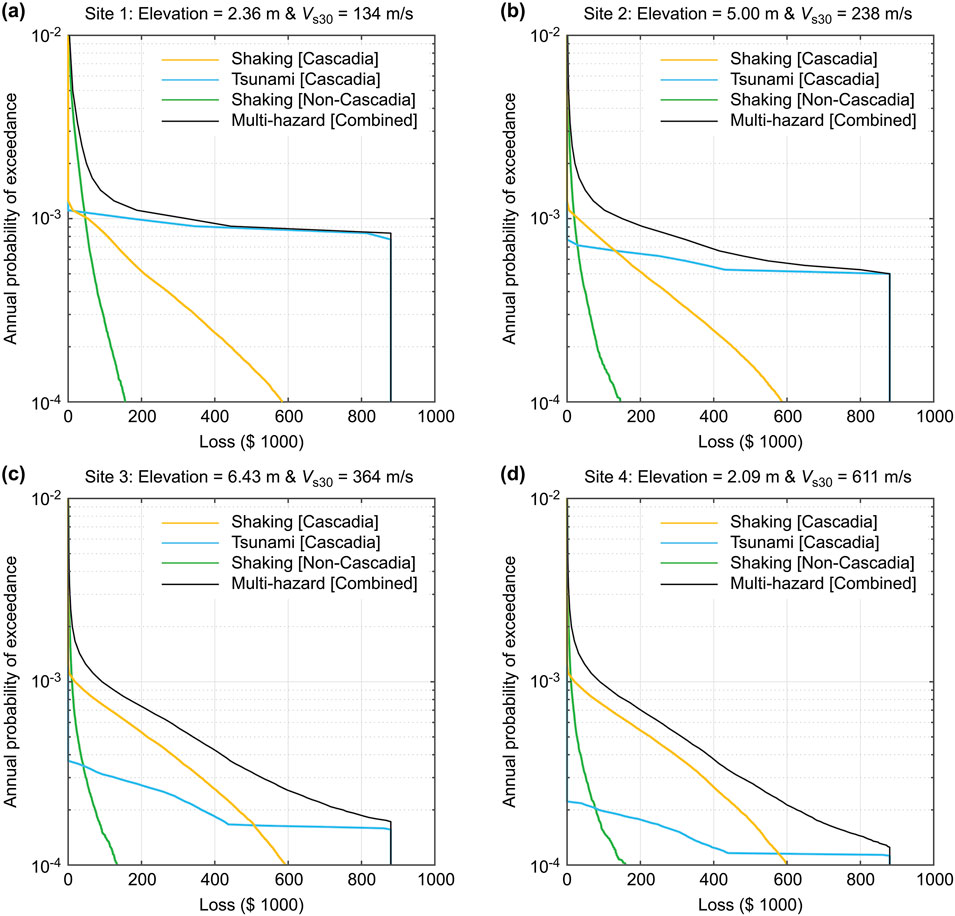
Figure 6. Exceedance probability loss curves for shaking (Cascadia), tsunami (Cascadia), shaking (non-Cascadia), and multi-hazard cases at (a) Site 1, (b) Site 2, (c) Site 3, and (d) Site 4. The locations of the sites are indicated in Figure 2b.
3.2 Risk-based microzonation maps
To perform risk-based microzonation for earthquakes and tsunamis, loss values at three return periods are extracted for individual grid locations and are displayed on a map. Three single-hazard cases and one multiple-hazard case are considered. These microzonation maps are useful for visualizing relative risk levels by reflecting spatially varying local factors. It is noteworthy that conceptually, this risk-based mapping extends a so-called uniform (exceedance probability) hazard mapping that is often used in probabilistic seismic hazard analysis (i.e., there is an equal chance that the mapped hazard value will be exceeded during the considered time interval). In this sense, the proposed approach for risk-based microzonation can be viewed as a uniform exceedance probability risk mapping.
In this section, two visualizations for risk-based microzonation are considered to assess their comparative performances. Different approaches can lead to conflicting information (Liu et al., 2016) and may make interpretations more difficult (San Martín et al., 2024). The first approach displays the absolute loss values for different hazard sources (i.e., Cascadia-shaking, Cascadia-tsunami, non-Cascadia-shaking, and multi-hazard). For a selected return period level, adopting a common loss range for different hazard sources facilitates the visual comparison of microzonation maps for different hazard cases. The second approach displays the relative loss values in terms of loss ratio (loss value with respect to the replacement cost of C$ 880,000). For each hazard, the base loss ratio of 1.0 is set to mean loss across 1,426 sites and then the loss ratio range for each map is set to 0.5 to 2.0 (i.e., a factor of 2 difference with respect to the mean loss) to emphasize the relative risk profile across different sites (note: a different factor for the relative risk range can be adopted).
Figure 7 shows the single-hazard and multi-hazard microzonation maps for Tofino by considering absolute risk levels and return period levels of 1,000, 2,500, and 5,000 years. This corresponds to the visualization approach 1 mentioned above. The color range for the absolute loss values is set to be identical for different hazard cases (0 to C$ 400,000 for the 1,000-year return period and 0 to C$ 800,000 for the 2,500 and 5,000 return periods).
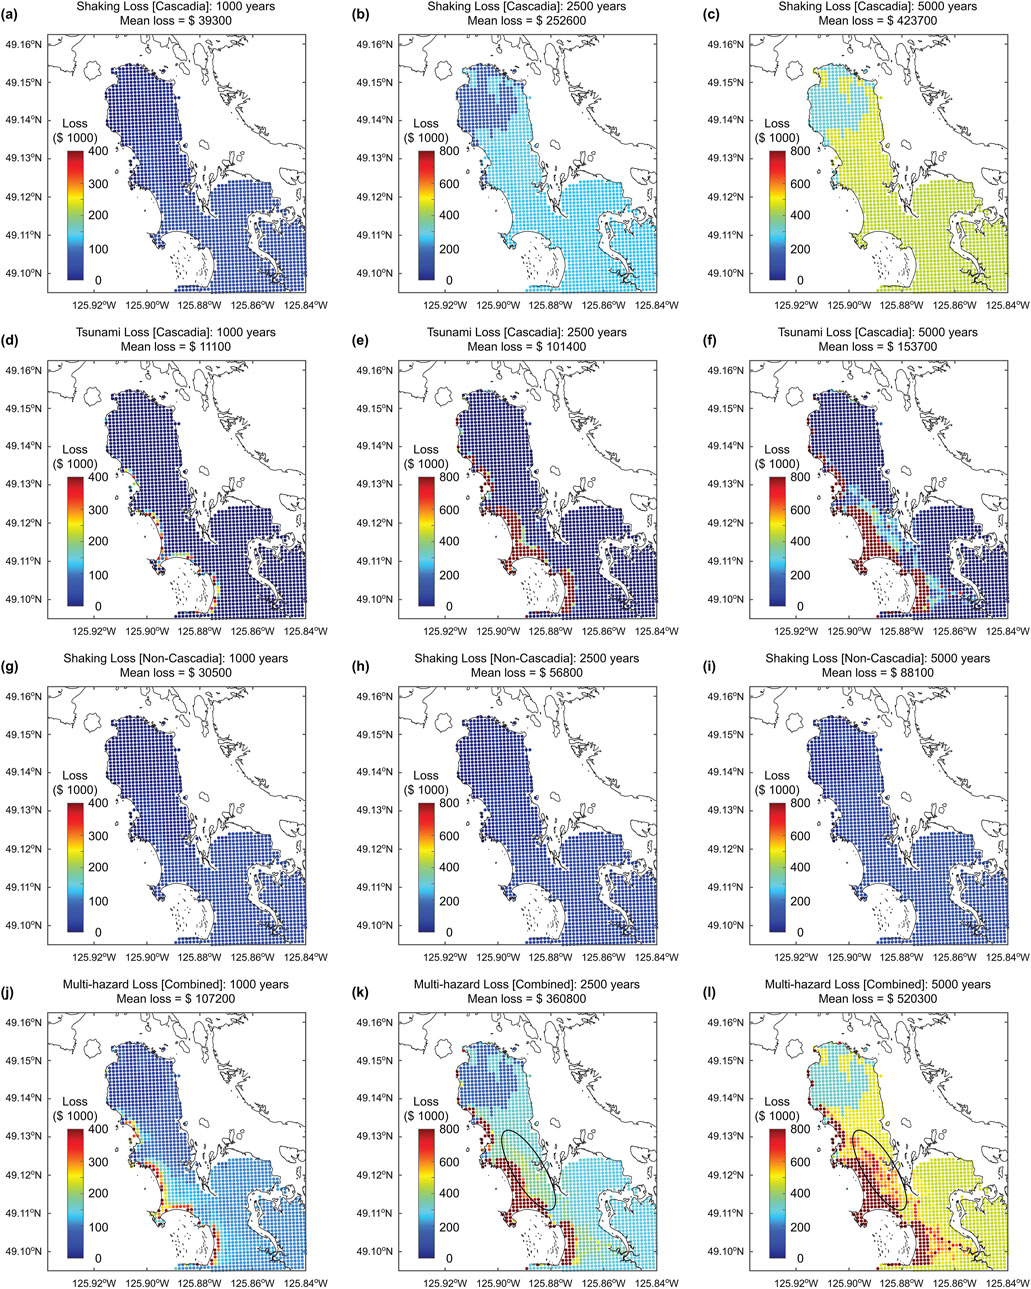
Figure 7. Single-hazard and multi-hazard microzonation maps for Tofino by considering absolute risk levels and return period levels of 1,000, 2,500, and 5,000 years. (a–c) shaking loss (Cascadia), (d–f) tsunami loss (Cascadia), (g–i) shaking loss (non-Cascadia), and (j–l) multi-hazard loss.
By looking into the microzonation maps for the 1,000-year return period (Figures 7a,d,g,j), widespread relatively minor losses are caused by the Cascadia-shaking and non-Cascadia-shaking (note: the mean loss levels are C$ 39,300 and C$ 30,500, respectively). In contrast, tsunami losses are highly concentrated along the Pacific Ocean coast and can be very high, reaching C$ 400,000 (i.e., loss ratio of 45% or greater) for some locations. The multi-hazard map shows composite characteristics of the shaking and tsunami losses; land areas with relatively high elevation are mainly affected by shaking risks and the effects of local site conditions are observable (lower shaking risks in the northern part of Tofino compared to the southern part), whereas the near-shore areas facing the Pacific Ocean are exposed to high tsunami risks.
The inspection of the maps for the 2,500-year return period (Figures 7b,e,h,k) indicates that the Cascadia-shaking risks are significantly greater than the non-Cascadia shaking risks (C$ 252,600 versus C$ 56,800 in terms of mean loss), and in the Cascadia shaking map (Figure 7b), the effects of the local site conditions, which essentially separates rock sites and soil sites, are obvious. Note that similar tendencies can be seen in the non-Cascadia shaking risk map when a different color range is adopted. For the Cascadia tsunami risks, the general patterns for the 2,500-year return period are similar to those for the 1,000-year return period but the inundation areas for the former have been expanded spatially. The resulting multi-hazard microzonation map exhibits the combined features from the Cascadia-shaking and Cascadia-tsunami maps, indicating the Cascadia subduction events are the main contributors for total risks at this return period level. More specifically, an area that is outlined with an oval in Figure 7k is influenced by both shaking and tsunami risks.
Lastly, the trends and observations obtained from the maps for the 5,000-year return period (Figures 7c,f,i,l) are similar to those for the 2,500-year return period (Figures 7b,e,h,k), noting that the color ranges for these two sets of microzonation maps are identical. The loss levels for the higher return period are increased, and the combined effects of the shaking and tsunami risks are observable in several specific areas (e.g., an oval outlined in Figure 7l).
Figure 8 shows the single-hazard and multi-hazard microzonation maps for Tofino by considering relative risk levels and return period levels of 1,000, 2,500, and 5,000 years. This corresponds to the visualization approach 2 mentioned above. The loss ratio color range is the same for all maps, thereby, the direct comparison of the maps can be facilitated. Note that the absolute risk levels in these maps can be understood by looking at the mean loss ratio values for individual maps.
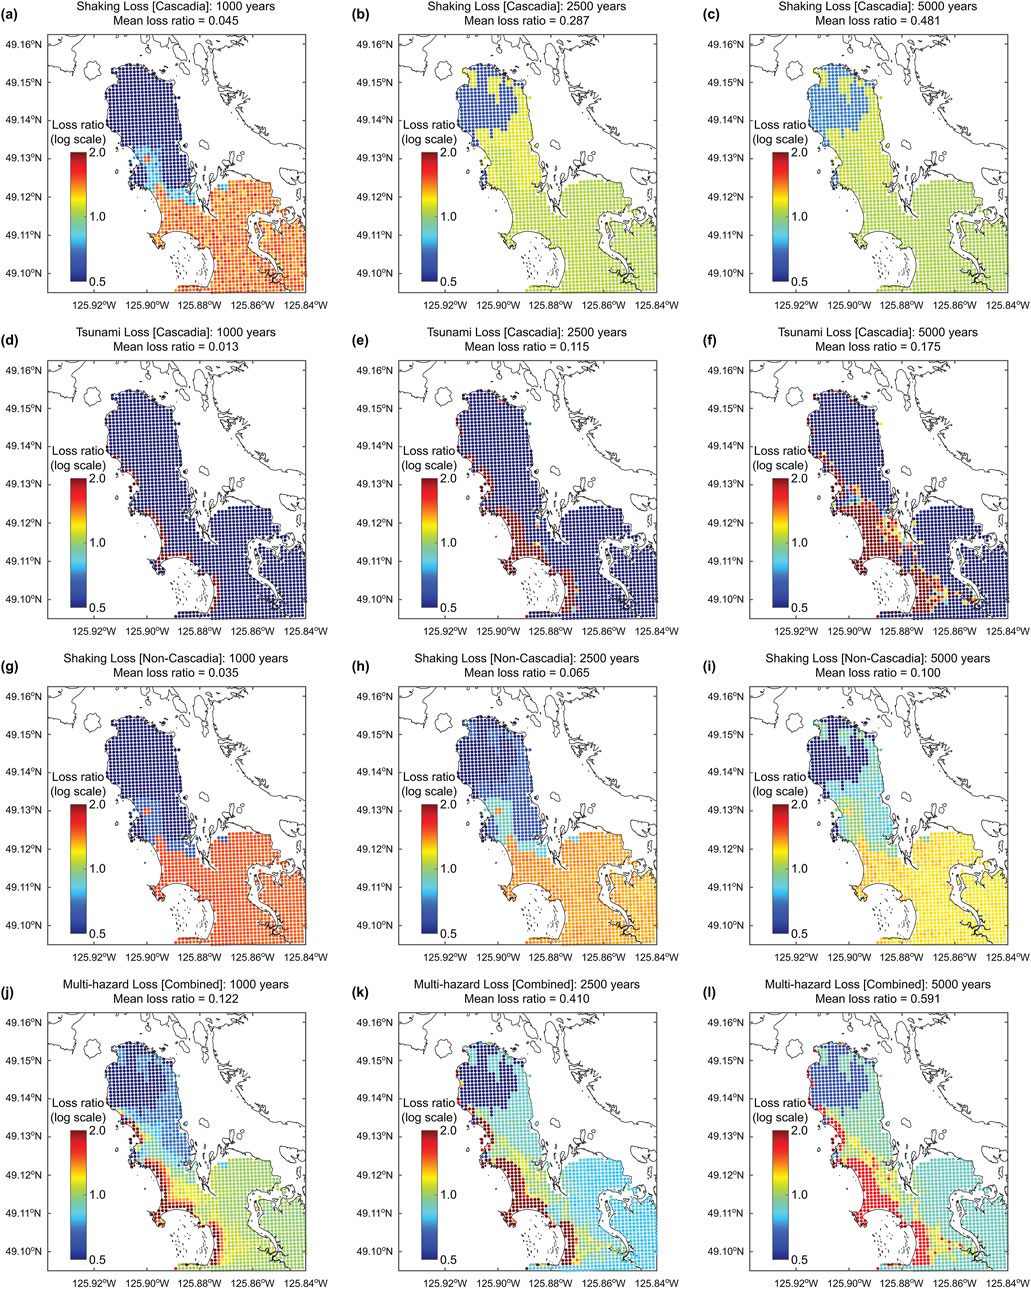
Figure 8. Single-hazard and multi-hazard microzonation maps for Tofino by considering relative risk levels and return period levels of 1,000, 2,500, and 5,000 years. (a–c) shaking loss (Cascadia), (d–f) tsunami loss (Cascadia), (g–i) shaking loss (non-Cascadia), and (j–l) multi-hazard loss.
Inspecting the maps for the same loss type, the Cascadia shaking loss maps (Figures 8a–c) show that at the 1,000-year return period level (mean loss ratio = 0.045), three distinct zones can be identified, reflecting rock, hard soil, and soft soil conditions, while at the 2,500-year and 5,000-year return period levels, only two distinct zones are visible, being affected by the deamplified site effects at higher ground motion levels. Similarly, the non-Cascadia shaking loss maps (Figures 8g–i) show three distinct zones for all three return period levels (note: the mean loss ratios for these three maps are relatively minor and are less than 0.10). This is because the shaking levels caused by the crustal and inslab earthquakes are not as intense as those caused by the extreme Cascadia subduction earthquakes. On the other hand, the Cascadia tsunami loss maps (Figures 8d–f) show the increasing risk patterns with the return period level, resembling tsunami inundations. Finally, the multi-hazard microzonation maps for the three return periods (Figures 8j–l) reveal the complex spatial patterns of the relative earthquake-tsunami risks.
In summary, risk-based microzonation maps for earthquakes and tsunamis display important characteristics of potential risks from major catastrophic seismic events. The selection of the return period levels is relevant to disaster risk management and risk communications with residents and stakeholders. Different spatial risk patterns, exhibited by the Cascadia-shaking, Cascadia-tsunami, and non-Cascadia shaking loss maps, indicate that single-hazard maps fail to provide a comprehensive risk profile of the District of Tofino. Moreover, the choice of absolute versus relative risk maps and related selection of the mapped loss metric’s range are important.
Finally, another important aspect is the selection of multi-hazard risk indicators for microzonation mapping. The indicator of choice will depend on the consequence that is intended to be mitigated, though the choice must consider potential conflicts with other indicators (e.g., Liu et al., 2016). For example, Zamora et al. (2021) incorporated tsunami arrival time as a proxy for casualties to obtain a microzonation map that was based on a combined maximum tsunami flow depth‒minimum arrival time risk matrix, aimed at informing tsunami evacuation strategies. They did not use a probabilistic approach, upon consideration that evacuation needs to be designed for the worst-case scenario. In this study, the financial loss is considered the appropriate metric since it allows for direct comparison among the different hazards. Other metrics offering meaningful comparison are casualties and fatalities.
4 Conclusion
This study introduced a new risk-based microzonation approach for earthquakes and tsunamis by considering multiple hazard sources for causing building loss. Adopting such risk-based multi-hazard microzonation maps is beneficial to produce integrated risk profiles of a coastal community by accounting for local risk factors of the multiple hazards and to improve risk communication with residents and local stakeholders. The proposed method was demonstrated by focusing on the District of Tofino, British Columbia, Canada, which is situated in the Cascadia subduction zone. The multi-hazard catastrophe model by Goda (2024), which comprises modules for time-dependent earthquake occurrence, stochastic source generation, earthquake-tsunami intensity simulations, and earthquake-tsunami damage assessments. The representative building was defined using available building exposure data and was placed at 1,426 grid locations across Tofino. The site-specific multi-hazard risk assessments were conducted and loss values at three return periods were extracted for the individual grid locations.
The visualized single-hazard and multi-hazard risk results in terms of exceedance probability loss curves and microzonation maps exhibit complex risk profiles, which are significantly dependent on local risk factors and return period levels. Shaking risks are influenced by local site conditions, and their effects change depending on anticipated ground motion levels (from linear to nonlinear site responses). On the other hand, tsunami risks are dominantly controlled by spatial inundation patterns, reflecting local topography. The multi-hazard microzonation maps can be visualized in different formats (e.g., absolute loss values versus relative loss ratios) to compare loss contributions at different locations and to highlight the relative risk profile across different sites.
Lastly, it is important to mention that the risk-based multi-hazard microzonation results presented in this study depend on the capability of the underlying multi-hazard risk model. The model has limitations (see Section 2.2) and can be improved. The model validation against data and theories needs to be conducted as part of such investigations. The potential model bias and uncertainty should not be overlooked when the modeled risk products are discussed and interpreted in deciding upon disaster risk management actions.
Data availability statement
The data that are generated using the earthquake-tsunami risk model will be made available by the authors, without undue reservation.
Author contributions
KG: Writing – original draft. PC: Writing – review and editing.
Funding
The author(s) declare that financial support was received for the research and/or publication of this article. PAC was supported by the Agencia Nacional de Investi-gación y Desarrollo (ANID), Chile through FONDECYT grant 1220648, the Centro de Investigación para la Gestión Integrada del Riesgo de De-sastres (CIGIDEN), Chile through the ANID/FONDAP/1523A0009, and PIA/APOYO AFB230003.
Conflict of interest
The authors declare that the research was conducted in the absence of any commercial or financial relationships that could be construed as a potential conflict of interest.
The author(s) declared that they were an editorial board member of Frontiers, at the time of submission. This had no impact on the peer review process and the final decision.
Generative AI statement
The author(s) declare that no Generative AI was used in the creation of this manuscript.
Publisher’s note
All claims expressed in this article are solely those of the authors and do not necessarily represent those of their affiliated organizations, or those of the publisher, the editors and the reviewers. Any product that may be evaluated in this article, or claim that may be made by its manufacturer, is not guaranteed or endorsed by the publisher.
Supplementary material
The Supplementary Material for this article can be found online at: https://www.frontiersin.org/articles/10.3389/feart.2025.1568069/full#supplementary-material
References
Akiyama, M., Frangopol, D. M., and Ishibashi, H. (2020). Toward life-cycle reliability-, risk- and resilience-based design and assessment of bridges andbridge networks under independent and interacting hazards: emphasis on earthquake, tsunami and corrosion. Struct. and Infra. Eng. 161, 26–50. doi:10.1080/15732479.2019.1604770
Atkinson, G. M., and Adams, J. (2013). Ground motion prediction equations for application to the 2015 Canadian national seismic hazard maps? Can. J. Civ. Eng. 40, 988–998. doi:10.1139/cjce-2012-0544
Attary, N., van de Lindt, J. W., Barbosa, A. R., Cox, D. T., and Unnikrishnan, V. U. (2021). Performance-based tsunami engineering for risk assessment of structures subjected to multi-hazards: tsunami following earthquake. J. Earthq. Eng. 25, 2065–2084. doi:10.1080/13632469.2019.1616335
Ayyub, B. M. (2014). Systems resilience for multi-hazard environments: definition, metrics, and valuation for decision making. Risk Anal. 34, 340–355. doi:10.1111/risa.12093
Baker, J. W., Bradley, B., and Stafford, P. (2021). Seismic hazard and risk analysis. Cambridge University Press, 600. doi:10.1017/9781108425056
British Columbia Ministry of the Environment (1985). Soils of south vancouver Island, British Columbia (soil survey report No. 44, map sheet 4 of 7, kennedy lake, 92F/SW). Victoria, British Columbia, Canada: Ministry of Environment.
Cárdenas, G., and Catalán, P. A. (2022). Accelerating tsunami modeling for evacuation studies through modification of the Manning roughness values. GeoHazards 3, 492–508. doi:10.3390/geohazards3040025
Cassidy, J. F., Rogers, G. C., Lamontagne, M., Halchuk, S., and Adams, J. (2010). Canada’s earthquakes: the good, the bad, and the ugly. Geosci. Can. 37, 1–16. Available at: https://journals.lib.unb.ca/index.php/GC/article/view/15300.
DeMets, C., Gordon, R. G., and Argus, D. F. (2010). Geologically current plate motions. Geophys. J. Int. 181, 1–80. doi:10.1111/j.1365-246X.2009.04491.x
De Risi, R., Goda, K., Yasuda, T., and Mori, N. (2017). Is flow velocity important in tsunami empirical fragility modeling? Earth-Science Rev. 166, 64–82. doi:10.1016/j.earscirev.2016.12.015
Fraser, S., Pomonis, A., Raby, A., Goda, K., Chian, S. C., Macabuag, J., et al. (2013). Tsunami damage to coastal defences and buildings in the March 11th 2011 Mw9.0 Great East Japan earthquake and tsunami. Bull. Earthq. Eng. 11, 205–239. doi:10.1007/s10518-012-9348-9
Fritz, H. M., Petroff, C. M., Catala´n, P. A., Cienfuegos, R., Winckler, P., Kalligeris, N., et al. (2011). Field survey of the 27 february 2010 Chile tsunami. Pure Appl. Geophys. 168, 1989–2010. doi:10.1007/s00024-011-0283-5
Ghobarah, A., Saatcioglu, M., and Nistor, I. (2006). The impact of the 26 December 2004 earthquake and tsunami on structures and infrastructure. Eng. Struct. 28, 312–326. doi:10.1016/j.engstruct.2005.09.028
Goda, K. (2022). Stochastic source modeling and tsunami simulations of Cascadia subduction earthquakes for Canadian Pacific coast. Coast. Eng. J. 64, 575–596. doi:10.1080/21664250.2022.2139918
Goda, K. (2023). Statistical characterization of full-margin rupture recurrence for Cascadia subduction zone using event time resampling and Gaussian mixture model. Geosci. Lett. 10, 52. doi:10.1186/s40562-023-00306-6
Goda, K. (2024). Probabilistic earthquake-tsunami financial risk evaluation for the District of Tofino, British Columbia, Canada. Georisk Assess. Manag. Risk Eng. Syst. Geohazards 18, 904–924. doi:10.1080/17499518.2024.2346656
Goda, K., and De Risi, R. (2023). Future perspectives of earthquake-tsunami catastrophe modelling: from single-hazards to cascading and compounding multi-hazards. Front. Built Environ. 8, 1022736. doi:10.3389/fbuil.2022.1022736
Goda, K., De Risi, R., De Luca, F., Muhammad, A., Yasuda, T., and Mori, N. (2021). Multi-hazard earthquake-tsunami loss estimation of Kuroshio Town, Kochi Prefecture, Japan considering the Nankai-Tonankai megathrust rupture scenarios. Int. J. Disaster Risk Reduct. 54, 102050. doi:10.1016/j.ijdrr.2021.102050
Goda, K., De Risi, R., Gusman, A. R., and Nistor, I. (2025). Probabilistic tsunami hazard and risk analysis - towards disaster risk reduction and resilience. Elsevier, 598. doi:10.1016/C2022-0-00360-3
Goda, K., Yasuda, T., Mori, N., and Maruyama, T. (2016). New scaling relationships of earthquake source parameters for stochastic tsunami simulation. Coast. Eng. J. 58, 1650010-1–40. doi:10.1142/S0578563416500108
Goldfinger, C., Nelson, C. H., Morey, A. E., Johnson, J. E., Patton, J., Karabanov, E., et al. (2012). Turbidite event history: methods and implications for Holocene paleoseismicity of the Cascadia subduction zone. U. S. Geol. Surv. Prof. Pap. 1661–F. Available online at: https://pubs.er.usgs.gov/publication/pp1661F.
Goto, C., Ogawa, Y., Shuto, N., and Imamura, F. (1997). “Numerical method of tsunami simulation with the leap-frog scheme,”, 35. Paris, France: UNESCO.
Halchuk, S., Allen, T. I., Adams, J., and Rogers, G. C. (2014). Fifth generation seismic hazard model input files as proposed to produce values for the 2015 National Building Code of Canada. Geol. Surv. Can. Open File 7576, 15. doi:10.4095/293907
Hobbs, T., Journeay, J. M., and LeSueur, P. (2021). Developing a retrofit scheme for Canada's seismic risk model. Geol. Surv. Can. Open File 8822, 10. doi:10.4095/328860
Hochrainer-Stigler, S., Šakić Trogrlić, R., Reiter, K., Ward, P. J., de Ruiter, M. C., Duncan, M. J., et al. (2023). Toward a framework for systemic multi-hazard and multi-risk assessment and management. iScience 26, 106736. doi:10.1016/j.isci.2023.106736
Humar, J. (2015). Background to some of the seismic design provisions of the 2015 National Building Code of Canada. Can. J. Civ. Eng. 42, 940–952. doi:10.1139/cjce-2014-0385
Hyndman, R. D., and Rogers, G. C. (2010). Great earthquakes on Canada’s west coast: a review This article is one of a series of papers published in this Special Issue on the themeLithoprobe — parameters, processes, and the evolution of a continent. Geological Survey of Canada Contribution 20090196. Can. J. Earth Sci. 47, 801–820. doi:10.1139/E10-011
Kaiser, G., Scheele, L., Kortenhaus, A., Løvholt, F., Romer, H., and Leschka, S. (2011). The influence of land cover roughness on the results of high resolution tsunami inundation modeling. Nat. Hazards Earth Syst. Sci. 11, 2521–2540. doi:10.5194/nhess-11-2521-2011
Kappes, M. S., Keiler, M., von Elverfeldt, K., and Glade, T. (2012). Challenges of analyzing multi-hazard risk: a review. Nat. Hazards 64, 1925–1958. doi:10.1007/s11069-012-0294-2
Liu, B., Siu, Y. L., Mitchell, G., and Xu, W. (2016). The danger of mapping risk from multiple natural hazards. Nat. Hazards 82, 139–153. doi:10.1007/s11069-016-2184-5
Marzocchi, W., Garcia-Aristizabal, A., Gasparini, P., Mastellone, M. L., and Di Ruocco, A. (2012). Basic principles of multi-risk assessment: a case study in Italy. Nat. Hazards 62, 551–573. doi:10.1007/s11069-012-0092-x
Matsuoka, M., Wakamatsu, K., Hashimoto, M., Senna, S., and Midorikawa, S. (2015). Evaluation of liquefaction potential for large areas based on geomorphologic classification. Earthq. Spectra 31, 2375–2395. doi:10.1193/072313EQS211M
Mitchell-Wallace, K., Jones, M., Hillier, J., and Foote, M. (2017). Natural catastrophe risk management and modelling: a practitioner’s guide. Chichester, UK: Wiley-Blackwell, 536. doi:10.1002/9781118906057
Molnar, S., Assaf, J., Sirohey, A., and Adhikari, S. R. (2020). Overview of local site effects and seismic microzonation mapping in Metropolitan Vancouver, British Columbia, Canada. Eng. Geol. 270, 105568. doi:10.1016/j.enggeo.2020.105568
Novakovic, M., Borozan, J., Assatourians, K., Goda, K., Martinez-Alcala, K., Yang, Y., et al. (2023). “Assessment of earthquake and tsunami risk for Tofino, British Columbia,” in Proceedings of the Canadian-pacific conference on earthquake engineering 2023 (Vancouver, Canada).
OECD (2018). Financial management of earthquake risk. Available online at: https://www.oecd.org/finance/financial-management-of-earthquake-risk.htm.
Okada, Y. (1985). Surface deformation due to shear and tensile faults in a half-space. Bull. Seismol. Soc. Am. 75, 1135–1154. doi:10.1785/BSSA0750041135
Park, H., Alam, M. S., Cox, D. T., Barbosa, A. R., and van de Lindt, J. W. (2019). Probabilistic seismic and tsunami damage analysis (PSTDA) of the Cascadia Subduction Zone applied to Seaside, Oregon. Int. J. Disaster Risk Reduct. 35, 101076. doi:10.1016/j.ijdrr.2019.101076
Salamon, A., Rockwell, T., Ward, S. N., Guidoboni, E., and Comastri, A. (2007). Tsunami hazard evaluation of the eastern Mediterranean: historical analysis and selected modeling. Bull. Seismol. Soc. Am. 97, 705–724. doi:10.1785/0120060147
San Martín, T. V., López, G. I., Mestanza-Ramón, C., Milanés, C. B., and Canales, F. A. (2024). Assessing perceptions and interpretations of tsunami maps: insights from the public and risk experts. Water 16, 3423. doi:10.3390/w16233423
Selva, J. (2013). Long-term multi-risk assessment: statistical treatment of interaction among risks. Nat. Hazards 67, 701–722. doi:10.1007/s11069-013-0599-9
Walton, M., Staisch, L., Dura, T., Pearl, J., Sherrod, B., Gomberg, J., et al. (2021). Toward an integrative geological and geophysical view of Cascadia Subduction Zone earthquakes. Annu. Rev. Earth Planet. Sci. 49, 367–398. doi:10.1146/annurev-earth-071620-065605
Wesson, R. L., Perkins, D. M., Leyendecker, E. V., Roth, R. J., and Petersen, M. D. (2004). Losses to single-family housing from ground motions in the 1994 Northridge, California, earthquake. Earthq. Spectra 20, 1021–1045. doi:10.1193/1.1775238
White, T. W., and Ventura, C. E. (2006). Seismic performance of wood-frame residential construction in British columbia-technical report. Earthquake engineering research facility report No. 06-03. Vancouver, British Columbia, Canada: University of British Columbia.
Yamazaki, F., and Maruyama, Y. (2011). “Seismic microzonation,” in Encyclopedia of solid earth geophysics. Editor H. K. Gupta (Dordrecht: Springer). doi:10.1007/978-90-481-8702-7_187
Zamora, N., Catalán, P. A., Gubler, A., and Carvajal, M. (2021). Microzoning tsunami hazard by combining flow depths and arrival times. Front. Earth Sci. 8, 591514. doi:10.3389/feart.2020.591514
Keywords: multi-hazard, risk mapping, earthquake, tsunami, microzonation, disaster risk management, Cascadia subduction zone
Citation: Goda K and Catalan PA (2025) Risk-based multi-hazard microzonation for earthquakes and tsunamis. Front. Earth Sci. 13:1568069. doi: 10.3389/feart.2025.1568069
Received: 28 January 2025; Accepted: 09 July 2025;
Published: 28 July 2025.
Edited by:
Matteo Picozzi, University of Naples Federico II, ItalyReviewed by:
You Dong, Hong Kong Polytechnic University, Hong Kong SAR, ChinaMatteo Fiorucci, University of Cassino, Italy
Copyright © 2025 Goda and Catalan. This is an open-access article distributed under the terms of the Creative Commons Attribution License (CC BY). The use, distribution or reproduction in other forums is permitted, provided the original author(s) and the copyright owner(s) are credited and that the original publication in this journal is cited, in accordance with accepted academic practice. No use, distribution or reproduction is permitted which does not comply with these terms.
*Correspondence: Katsuichiro Goda, a2dvZGEyQHV3by5jYQ==