 Ayatu Ojonugwa Usman
 Joseph Sunday Nomeh1,2†
 George-Best Azuoko
- 1Department of Geology/Geophysics, Alex Ekwueme Federal University, Ikwo, Nigeria
- 2JSN Consult Limited, Abakaliki, Nigeria
The Jurassic Younger Granite (JYG) Province in Nigeria is notable for its rich mineral resources, though much of its subsurface wealth remains unexplored. This study utilizes integrated magnetic geophysical techniques to assess the region’s concealed mineral potential. High-resolution aeromagnetic data was employed to map geologic structures, lithological variations, and zones of mineralization. Advanced filtering methods, including reduce to magnetic equator (RTME), Butterworth bandpass filter, analytical signal (AS), tilt derivative (TRD), and first vertical derivative (FVD), alongside depth estimation tools like source parameter imaging (SPI), Euler deconvolution, and 3D magnetic inversion, were used to uncover new mineralization patterns. Magnetic anomaly maps reveal variations in magnetic intensity, indicating rock bodies with differing magnetic properties. The RTME map shows deeply seated deformations, while TRD and Rose diagram analysis identify NE-SW and minor E-W fault and fold trends related to Pan-African orogeny. FVD and phase symmetry analysis indicate granitic rock intrusions, contributing to intense faulting and folding. The AS map highlights minor magnetic irregularities tied to deposits of tin, columbite, and monazite. Depth estimations using SPI indicate shallow magnetic sources, concentrated in the central and northwestern regions. Euler deconvolution, with a structural index of 0, identifies clusters of solutions interpreted as dykes and sills at depths of 100–300 m, with E-W trending structures. 3D inversion model reveals evidence of geologic structures that can host appreciable mineral deposits in the region. These results demonstrate a strong correlation between magnetic anomalies and known mineral deposits, suggesting further untapped resources. This integrated approach highlights the effectiveness of magnetic geophysical techniques in mineral exploration and offers a foundation for similar studies in comparable geological settings.
1 Introduction
The increasing instability of oil prices has a great impact on Nigeria’s economy, and for the country to attain growth and development, there is a need to diversify the economy. In fact, it has become expedient to reevaluate other sources of revenue to boost growth in Nigeria. The Nigerian mineral and mining sector has the potential to add significantly to the country’s Gross Domestic Product (GDP). However, achieving this potential is increasingly becoming a mirage. Perhaps this could be related to lack of detailed road maps that can guide exploitation and the artisanal miners, who believe that standard exploration techniques are expensive (Abraham E. M. et al., 2024; Abraham E. et al., 2024; Chibuike et al., 2024). The Younger Granite region of Nigeria, which is part of the Central African Tin Belt, has been extensively studied due to its mineral wealth. The region represents a significant geological province located in the north-central part of the country. The volcanic rocks of the region, primarily composed of basaltic lava flows, tuffs, and pyroclastic deposits, that are associated with significant mineralization, yet their geological complexity has historically made exploration challenging (Abraham et al., 2022; Buyuksarac et al., 2005). Again, the mineral potential of this region has been an area of interest for both local and international mining companies, particularly in the exploration for metallic ores such as gold, copper, and iron (Ekwok et al., 2023; Usman et al., 2025). In the past, mineral exploration in the Younger Basement region relied heavily on surface mapping and geochemical sampling, which often provided limited results due to the region’s complex geology (Usman et al., 2023; Elhussein et al., 2024). However, recent advancements in geophysical techniques, combined with improved data processing capabilities, have transformed the way mineral exploration is conducted. These methods now allow for the identification of deep-seated mineral deposits that were previously hidden beneath layers of sedimentary cover or complex faulted structures. Traditional methods of mineral exploration, including surface geological mapping and geochemical sampling, have provided limited insight into the deeper, hidden mineral deposits of the region (Mahdi et al., 2022; Eldosouky et al., 2024; Usman et al., 2024a; Usman A. O. et al., 2024). Hence, geophysical methods, particularly magnetic surveys, have become critical in the search for these hidden treasures. Magnetic surveys detect magnetic intensity variations of the Earth caused by subsurface lithological variations and mineral deposits, offering a cost-effective and non-invasive means to investigate areas that are difficult to access or interpret with surface methods alone.
This research area has a complex tectonic history that has led to the formation of numerous economically treasured minerals, including cassiterite, columbite, tantalite, and Rare Earth Elements (REEs) (Obaje, 2009; Tijani Moshood, 2023). The Jurassic Younger Granite (JYG) Province of Nigeria, which is part of the Pan-African belt, is a geologically significant region characterized by diverse igneous intrusions and associated mineralization (Rahaman, 1988; Rahaman, 1989). The mineral potential of the JYG is closely linked to its tectonic evolution, particularly the processes of rifting, magmatism, and hydrothermal fluid activity that occurred during the Jurassic period (Olade and Elueze, 1979; Ofoegbu, 1985; Ominigbo et al., 2020; Ojo et al., 2020). These processes have given rise to a variety of mineralization styles, including hydrothermal vein deposits, strata-bound ore bodies, and igneous-related mineralization. The region’s complex tectonic history, marked by faulting, folding, and igneous intrusions, has created structural traps and pathways for the circulation of mineralizing fluids. As a result, this area is believed to host significant undiscovered mineral resources. Despite its potential, the JYG provinces remain underexplored in many areas. Mineral exploration in these regions is often hindered by complex subsurface geology and the limited accessibility of traditional prospecting methods. However, the intricate geological structures, coupled with deep-seated faults and magmatic intrusions, present challenges for mineral discovery using conventional methods. In recent years, the application of modern geophysical techniques has been a powerful tool in overcoming these limitations, providing a clearer view of the subsurface and unraveling the previously undiscovered mineral resources. Historically, the area has been a source of tin, columbite, and other valuable minerals, yet large portions of its subsurface geology remain poorly understood, making it a prime location for further exploration.
The magnetic method serves as an effective technique for identifying subsurface structures (Usman et al., 2025). Extensive aeromagnetic surveys are commonly employed to detect faults, shear zones, and fractures, which could potentially act as hosts for a variety of mineral deposits. It is also useful in exploring epigenetic and stress-related mineralization zones surrounded by rocks (Udensi and Osazuwa, 2004; Usman et al., 2018; Okonkwo et al., 2021). The magnetic method is renowned for its application at the reconnaissance stage of hydrocarbon exploration (Leu, 1981; Likkason, 2007; Okonkwo et al., 2012). However, over the years its applications in the investigation of metallic ore deposits in fractured rocks have grown significantly, and this is partly due to their efficiency in mapping ore minerals (Megwara and Udensi, 2014; Obiora et al., 2016; Odoh et al., 2021) and partly to the fact that it is relatively cheap, less stressful to operate, non-invasive, and fast. The application of integrated advanced geophysical techniques helps us to easily decipher the geologic structures that can host mineral deposits in the region. Among the technique deploy is Source Parameter Imaging (SPI), which is a depth estimation technique based on potential field data. It calculates the depth to the causative source bodies, which helps to map subsurface structures that control mineralization. SPI provides reliable estimates of depths to faults, fractures, and intrusions that act as hosts for mineralization (such as tin, niobium, tantalum, and tungsten) (Benson et al., 2023). Euler Deconvolution technique was used to estimate the location (position and depth) of magnetic or gravity sources by solving Euler’s homogeneity equation. It is particularly useful for mapping the edges of geological bodies. The Euler Deconvolution technique provides precise locations of faults, fractures, and shear zones that control the emplacement of granite intrusions and associated mineral deposits. It also enhances the definition of lithological boundaries and ring dykes associated with the Jurassic granites, which are key features for hosting mineralization, while 3D inversion model transforms the geophysical data (magnetic anomalous data) into three-dimensional subsurface models, revealing the geometry and physical properties of causative bodies. 3D inversion produces detailed images of the subsurface, allowing geologists to visualize the geometry of granitic intrusions, faults, and mineralized zones in three dimensions.
This paper investigates the use of integrated magnetic geophysical techniques to uncover potential mineral resources in the Jurassic Younger Granite of Nigeria. The combination of magnetic geophysical techniques with geological information of the region enhances the accuracy and resolution of mineral investigation efforts, ultimately improving the success rate of locating economically viable deposits. We aim to produce a comprehensive understanding of the subsurface geology, highlight potential mineralization zones, and provide a roadmap for future exploration efforts in this underexplored region. The use of integrated magnetic geophysical techniques is critical in this context, as it enhances the ability to detect and delineate mineral deposits that may not be immediately apparent through surface observations alone. The findings from this research will contribute significantly to the mineral exploration efforts in the younger granite province and help unlock the region’s economic potential.
2 Geologic framework and tectonic evolution of the research region
The Younger Granites of North Central Nigeria represent one of the most significant geological and mineral-rich terrains in West Africa. The Younger Granite Province is part of the Jos Plateau and spans an area of approximately 8,000 km2 (Figure 1). It comprises several intrusive igneous bodies emplaced during the Jurassic period (approximately 213–143 million years ago) (Odeyemi, 1981; Reynolds et al., 1990). The granitic intrusions, which occur as ring complexes, are associated with extensive hydrothermal events that accounted for the deposition of economic minerals, particularly tin and columbite (Figure 2). The province is also known for its complex tectonic history and interplay of magmatic and structural processes. This igneous province is part of a broader anorogenic granitic system known as the Nigerian Younger Granite Province, characterized by high silica content and strong mineralization (Ajakaiye et al., 1991; Ajakaiye et al., 1988; Ananaba and Ajakaiye, 1987; Ezeh et al., 2022). It is part of the Pan-African Orogenic Belt and is famous for its association with various rare metal deposits. The JYG are discrete from the Older Granites (Precambrian Basement Complex rocks) and are predominantly Late Jurassic to Early Cretaceous in age (∼200–150 Ma). These granites intrude the Pre-Cambrian Basement Complex rocks and are distributed in a series of ring complexes across North Central Nigeria, primarily in the Jos Plateau, extending to parts of Bauchi, Kaduna, and Nasarawa States. The rocks consist of a range of igneous materials, including alkaline granites. The granites are rich in alkali feldspars and quartz and the Rhyolites are extrusive equivalents of granites, found in volcanic settings. Pegmatites and aplites are often associated with mineralization. Syenites and peralkaline rocks occurring in minor proportions (Chinwuko et al., 2014; Abraham E. et al., 2024; Ekwok et al., 2024). These rocks formed in an extensional tectonic time and exhibit characteristics of A-type granites, typically associated with rift environments and continental break-up processes.
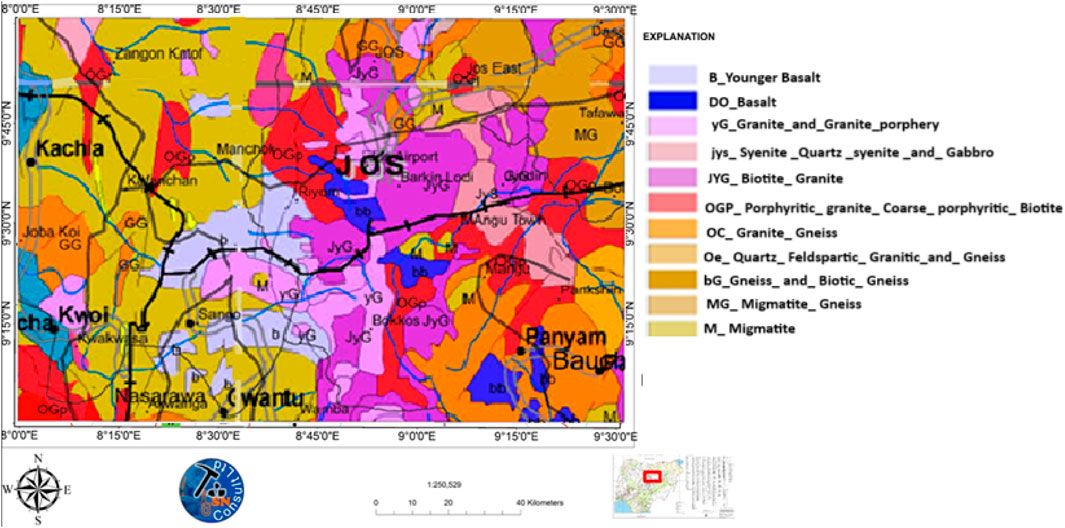
Figure 1. Geological map of research area showing the lithological units exposed in the region.
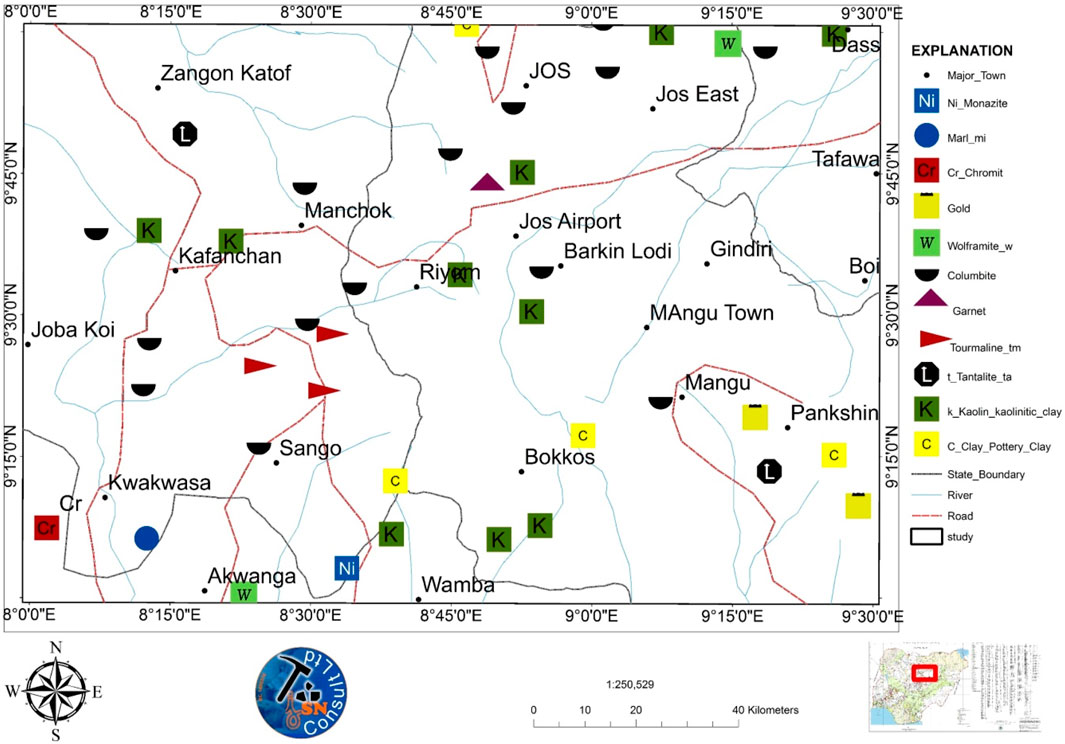
Figure 2. Mineral map of the region (from mineral map of Nigeria NGSA, 2009).
The structural framework of the Younger Granite Province includes several features that control the emplacement of the granites and associated mineralization. Ring Dykes and Ring Complexes; The granites often occur as circular to elliptical ring complexes, formed by magmatic intrusion emplace in the pre-existing fractures and weaknesses in the Basement Complex (Tijani Moshood, 2023). These ring structures contain mineral deposits along their peripheries, where hydrothermal fluid have deposited economically valuable minerals. Numerous fractures and fault systems, particularly NW-SE and NE-SW trending faults, are prominent (Abdelrahman et al., 2023; Abubakar et al., 2024; Eze et al., 2024). These fractures acted as conduits for magma ascent and subsequent hydrothermal fluid movement. These alteration zones are rich in quartz and mica and are associated with the cooling and fluid activity within the granites. These zones played the role of host for tin and tungsten mineralization. Radial and concentric fractures are common in complexes, reflecting the stresses during magmatic emplacement and these structures localize the ore bodies. North Central Nigeria’s Younger Granites are world-renowned for their mineral wealth, especially in tin, columbite, and rare earth elements (REEs). The Jos Plateau and its environs have been a major global source of tin, since colonial times (Reid and Thurston, 2014; Fan et al., 2024). Tin mineralization is associated with greisenized granites and hydrothermal veins within the ring complexes. Cassiterite (SnO2) occurs as disseminations within granites, as well as in veins, placers, and alluvial deposits and (columbite-tantalite-niobium-tantalum Nb-Ta oxides) minerals occur in pegmatite zones and greisenized granites. Columbite and tantalite are often recovered as by-products of tin mining. Wolframite (W) is found within quartz veins and greisenized zones in association with tin deposits. Peralkaline granites host significant concentrations of rare earth elements (REEs) contained in zircon, monazite, and xenotime (Figure 2). The elements are often found in association with accessory minerals like apatite and allanite. Residual weathering of the granites produces economically viable kaolin deposits. The Younger Granite Province has been a focus of mining activities for over a century. While tin mining dominated historically, recent exploration emphasizes the potential of REEs, niobium, and tantalum due to their strategic importance in high-tech industries. However, much of the mining in the area has traditionally been carried out through trial-and-error methods, such as lotto mining. As a result, the full extent of cassiterite deposits in the region may remain underutilized. Furthermore, the lack of structured and sustainable mining practices has contributed to significant environmental degradation and posed health risks to local communities.
3 Materials and methods
3.1 Data acquisition
The primary datasets utilized in this research are aeromagnetic data. High-resolution aeromagnetic surveys were purchased from Geological Agency of Nigeria. The airborne data sheet covers the entire research region. The data has a line spacing of 500 m and a nominal flight height of 80 m. The data was digitized into grids, each representing 55 by 55 km. These datasets underwent preprocessing to correct for diurnal variations, International Geomagnetic Reference Field (IGRF) removal, and leveling. The survey was conducted at an average flight height of 120 m, with flight lines and tie lines spaced at 500 m and 5,000 m, respectively. The flight lines were oriented along a 135° trend, while the tie lines followed a 45° trend. Key processing steps included compiling the six sheets covering the surveyed region and end at modeling the mineral potential zone of the region (Figure 3).
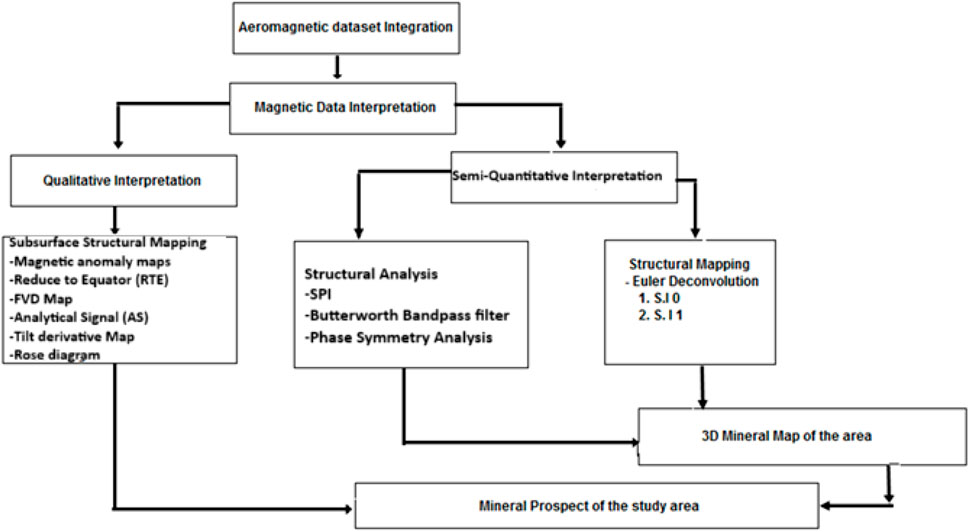
Figure 3. Flow chart.
The mathematically background for Butterworth pass filter was summary by Abraham E. et al. (2024) (Equation 1).
Where, s = complex frequency variable (s = jw)
Wc is the cutoff frequency of the low-pass filter
n is the order of filter
To design a Bandpass filter, we transform the low-pass prototype into a Bandpass filter as shown in Equation 2
Where w0 = center frequency of the Bandpass filter
• B = w2-w1 is the bandwidth of the filter
• w1 and w2 are lower cutoff frequencies of the badpass filter
Mathematical Background of Phase symmetry analysis relies on decomposing a signal into its constituent frequency components and analyzing their phase relationships. This is commonly done using tools like the Fourier transform or the analytic signal derived from the Hilbert transform. The analytical signal A(x) of a real-valued signal f(x) is given by Igwesi and Umego (2013), Abdelrahman et al. (2024) (Equation 3):
Where j is the imaginary unit, H (f(x)) is the Hilbert transform off (x), which produces a 900 phase shift, effectively creating a complex signal.
Phase congruency is a measure used to determine the degree to which the phases of the different frequency components of a signal are aligned. It is defined as Equation 4:
Where:
• Wn(x) are the weights typically related to the amplitude of the Fourier components at scale n
• Φn(x) is the phase of the nth component.
• ϕo(x) is the reference phase, often taken as the mean phase or a particular scale’s phase.
• ∣E(x)∣ represents a small positive constant to avoid division by zero.
The mathematical background for the tilt derivative TDR (x, y) at a given point in the magnetic field is defined Equation 5 as stated by Miller and Singh (1994), Hamimi et al. (2023), Hegab (2024):
Where:
• T(x, y, z) is the total magnetic field at a point (x, y, z)
• ∂T/∂z is the vertical derivative of the magnetic field.
• ∂T/∂x and ∂x/∂T are the horizontal derivatives in the x- and y-directions, respectively.
The 3-D Euler deconvolution method was deployed in depth estimation by clustering solutions and mapping the locations of geological contacts of magnetic anomalous bodies in a 2-D grid. The method works independently of remanent magnetization or geomagnetic inclination and declination, although choosing a suitable structural index is crucial for accurate interpretation (Equations 6 and 7) and is summarized by Ferreira et al. (2013), Ikumbur et al. (2013), Benson et al. (2023).
In geophysics, the function
Where
The SPI method was used to estimate depth to the anomalous bodies. The depth estimation is independent of magnetic inclination, declination, dip, strike, or any remanent magnetization (Verduzco et al., 2004; Ferreira et al., 2013) (Equation 8).
where Kmax = peak value of the local of number K over the step source (Thurston and Smith, 1997).
4 Results
The airborne magnetic data was interpreted qualitatively and semi-quantitatively.
4.1 Qualitative interpretation
Qualitative interpretation was done using visual assessment of the magnetic anomalous map, reducing it to the magnetic equator, the first vertical derivative, the analytic signal, the Butterworth bandpass filter, the tilt derivative map, and phase symmetry analysis, which helps in our structural analysis, while the quantitative interpretation was basically for depth calculation and modeling, where we deployed source parameter imaging and Euler deconvolution. Qualitatively, the magnetic anomalous map reveals variations in the magnetic field intensity in the study area. Regions of high magnetic value (>66.4 nT) (Kaduna, Plateau, Mangu, and Kwakwasa areas) were traced to the Precambrian and Jurassic granitic rock intrusion of the north-central basement, while regions of low magnetic value (<−5.3 nT) (Barkin, Iodi, Jos, Kachia, Zongon, Katof, and Bokko areas) were traced to the sandstone deposits of late Cretaceous sediment (Figure 4). The magnetic intensity variation in the research region is an indication of a geologic body with different magnetic characterization. Reduce to magnetic equator (RTME) (Figure 5) transforms magnetic data to appear as though observed directly above the magnetic poles. To correct for the effects of the Earth’s magnetic inclination and declination, the total magnetic intensity data were adjusted as though they were measured at the North Magnetic Pole, where the inclination and declination are ideally 90° and 0°, respectively. RTME map (Figure 5) reveals evidence of geologic structure, which was interpreted as faults and fractures. These structures are mainly orienting according to Abraham E. M. et al. (2024), Adelana et al., (2008), Lelièvre and Oldenburg, (2009) and Usman et al. (2024b) to the NE-SW direction, however, a small amount of them exhibit a E-W direction. These structural trends we believe are associated with the Pan-African orogeny, which is the main source of deformation in the region (Abraham E. et al., 2024; Usman et al., 2024b). The central part of the research region reveals low structuration that may not support mineral deposit. Abraham E. M. et al. (2024) believes that it is the subsurface geologic structure that controls mineralization in a region. The tilt derivative (TRD) map enhances weak magnetic anomalies and maps edges of subsurface sources. It is particularly useful in delineating fault lines and lithological contacts. Result obtained from TRD (Figure 6), which was interpreted as faults and folds. The azimuth of these major structures is the same as those found in the RTME results, supporting the ideal of a regional deformation marked by NE-SW and E-W trends. The intense faulting and folding may be a result of the intrusive bodies (Figure 1) recorded in the region. The rose diagram (Figure 7) also affirms that the main structural trend is in the NE-SW direction. The mark region shows high evidence of mineralization although there may be little evidence of mineralization in other regions not highlighted. The first vertical derivative (FVD) was superimposed in the lineament map of the region (Figure 8), and it enhances shallow anomalies mapping, making it valuable for delineating near-surface mineralized zones. In plotting a lineament map on a First Vertical Derivative (FVD) magnetic map, several filters are applied to enhance structural features and suppress noise. Some of the filters applied include; directional/gradient Filters, these filters help in detecting edges and enhancing linear features in specific orientations, improving the clarity of lineaments and high-pass filtering, allowing better detection of structurally controlled features. Result Figure 8 reveals clear evidence of intrusion in the southeastern and part of the central region of the study area. This intrusive we believe accounted for the high faulting and folding recorded in the region (Abdelrahman et al., 2024). Ekwok et al. (2024) says that granites often show distinct magnetic signatures that are crucial for identifying rare-metal-bearing intrusions as highlighted by our RTMP map.
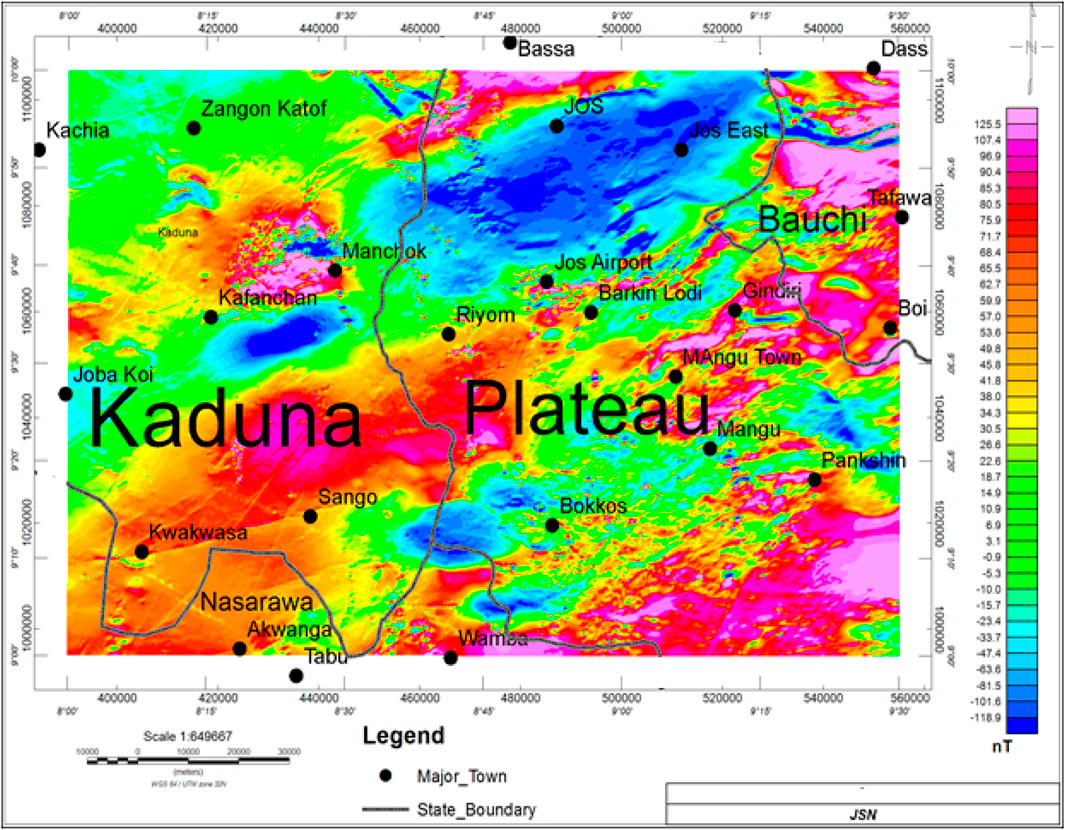
Figure 4. Magnetic anomalous map of the region highlighting variation in the magnetic field intensity suggesting lithological variation in the region.
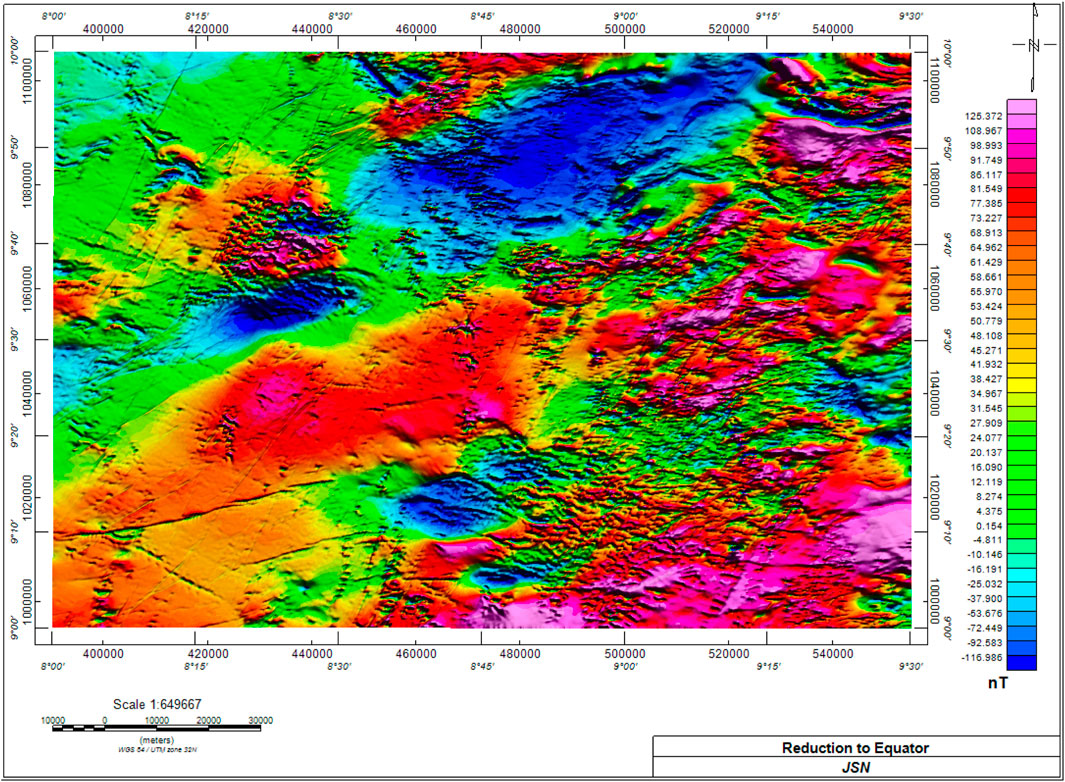
Figure 5. Reduce to magnetic equator (RTME) of the study area revealing deeply seated geologic structures that may host minerals in the region.
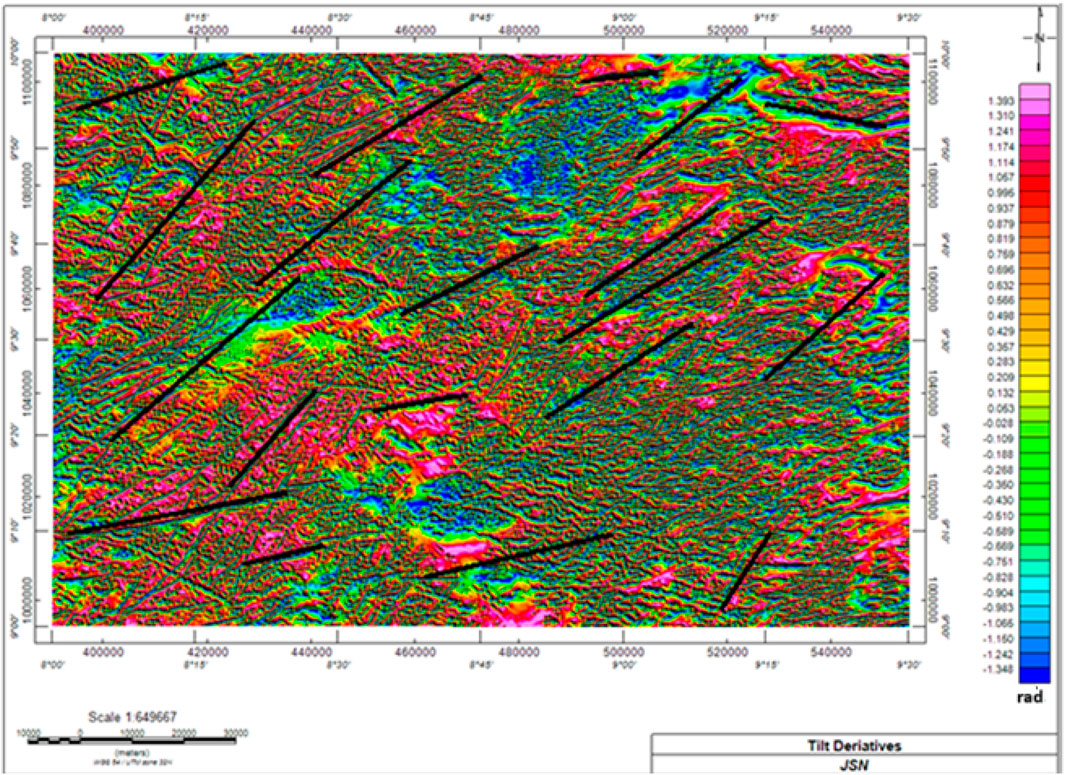
Figure 6. TRD map of the region showing intense structuration with major faults orienting NE-SW and minor ones trending E-W directions.
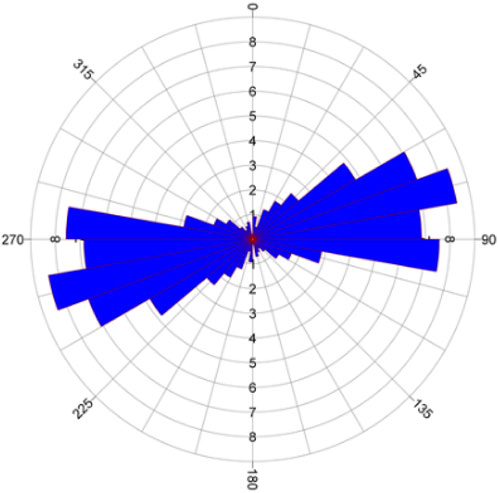
Figure 7. The rose diagram reveals a NE-SW structural trend of the basic geologic structures mapped, and it agrees with the structural orientation recorded in the Pan Africa Orogeny, which is the main event that influences the structural geodynamics of the region.
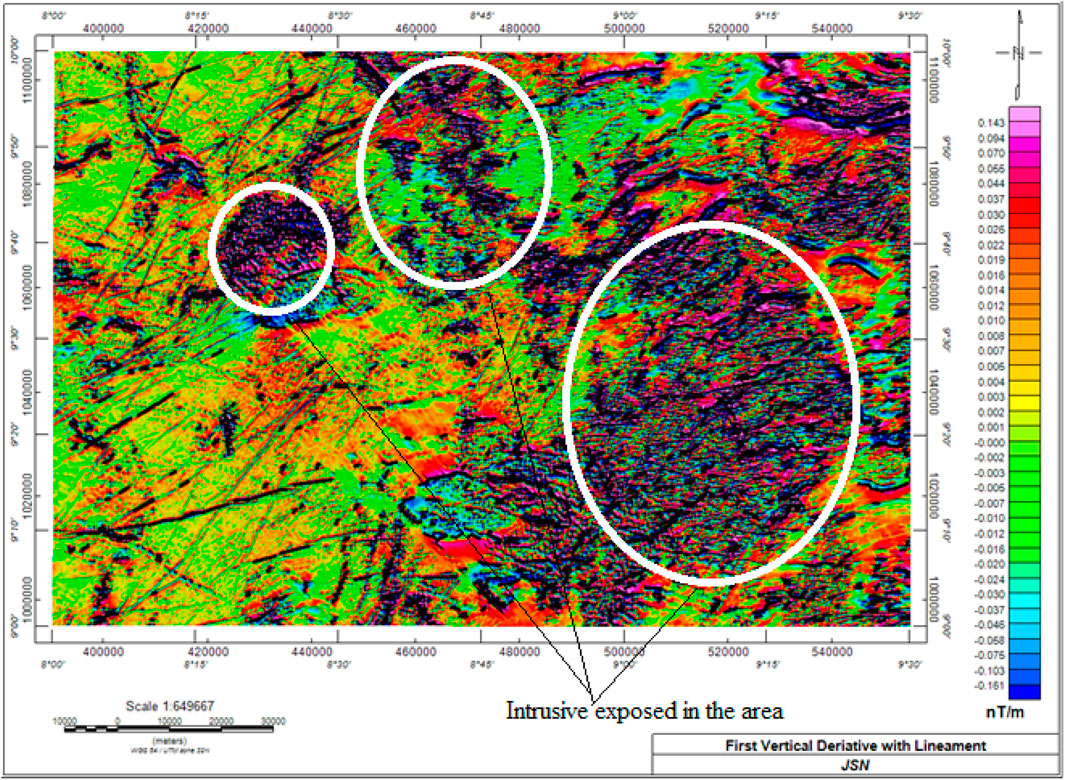
Figure 8. The first vertical derivative (FVD) map superimposed in the lineament map of the area reveals intrusive bodies that suggest high faulting and folding.
The Butterworth bandpass filter (Figure 9) which is a frequency domain filtering technique was used to isolate specific ranges of wavelengths in magnetic data. The Butterworth filter suppresses high-frequency noise while retaining the essential geological signal and this improves the accuracy of structural interpretations. The Butterworth bandpass filter (Figure 9) reveals basically two magnetic sources, namely, regions of high magnetic source that range from 3.29 to 15.75 nT (Bauchi, Mangu, Sango, Plateau, and Kwakwasa areas) typically represent shallow sources, and regions of low magnetic source that range from −0.36 to 2.74 nT (Zongon, Barkin Iodi, Bokko, and Jos areas) are linked to deeper structures. Figure 9 also agreed and confirmed the qualitative analysis results presented from the visual inception of the magnetic anomalous map (Figure 4). The analytical signal (AS) map (Figure 10) helps to uncover subtle magnetic anomalies linked to weakly magnetic mineral deposits, including tin, columbite, monazite, and accessory minerals such as zircon and topaz. Key locations suspected to host mineralized were marked as boxes A, B, and C for further investigation. In general, areas with stronger AS signals correspond to subsurface structures enriched with minerals such as Ka, Sn, Nb, Be, and Tm. These findings are corroborated by the Butterworth Bandpass Filter map shown in Figure 9. Phase symmetry analysis (Figure 11) is a signal-processing technique used to identify symmetrical patterns in magnetic data, often indicative of geological boundaries or mineralized zones. Phase symmetry analysis (Figure 11) reveals evidence of intrusive bodies. These regions were mapped, and they also correspond to previous analysis from the AS and Butterworth filter analysis, and this gives credence to our computations.
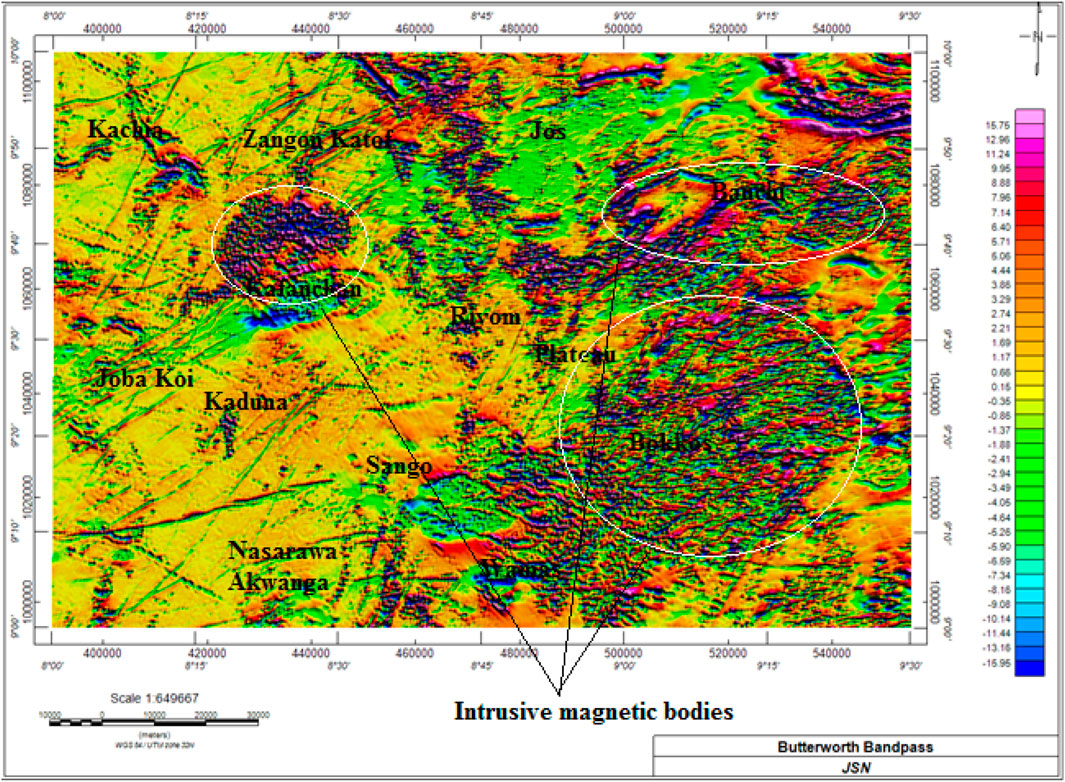
Figure 9. Butterworth bandpass filter map of the region. The map targets concealed magnetic bodies. A long wavelength cutoff was set at 2,200 cycles/meter, and a short wavelength cutoff at 1,550 cycles/meter was used to enhance the noise and background signals through the application of amplitude thresholding techniques.
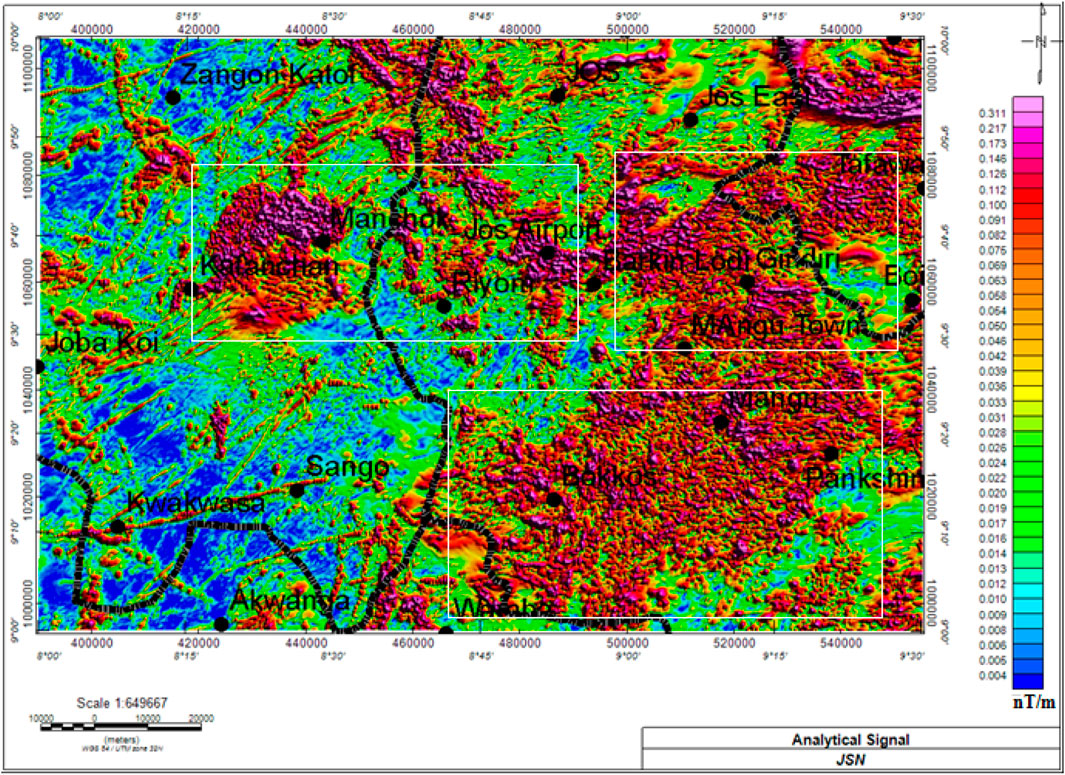
Figure 10. AS map of the region with our flash point region (A,B and C) revealing a high analytical signal value >0.075 nT/m.
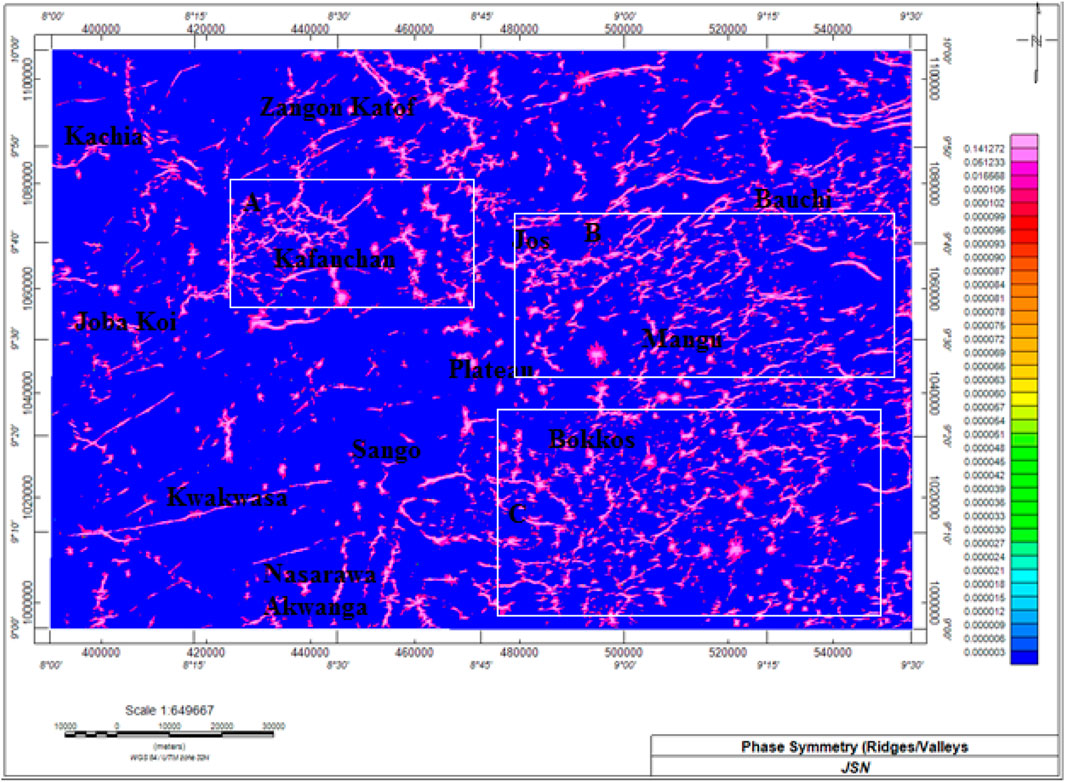
Figure 11. Phase symmetry analysis map of the research region that provides a sophisticated tool for identifying ridges and valleys associated with near-surface anomalies, such as contacts and discontinuities. The observed patterns in the map predominantly indicate the presence of intrusive bodies in the area, which aligns with the findings from the FVD map.
4.2 Depth estimation
Since no single geophysical technique is ever conclusive, source parameter imaging (SPI) and Euler deconvolution geophysical techniques were deployed in our depth calculations. SPI results (Figure 12) reveal two depth models: the shallow depth model, which ranges from 92 to 167 m, was found in the central and northwest regions of the study area, while the deep depth model, which ranges from 174 to 450 m, was found in the northeast edge of the research area. The Euler deconvolution analysis, which is regarded as the most convenient method for targeting and estimating anomalies that result from isolated or multiple anomaly contacts. In this study, computer programs based on the generalization of linear inverse theory were utilized, employing a least-squares approach to solve Euler’s equation. The Euler deconvolution analysis was conducted using structural indices (SI) of 0 and 1. 3D Euler deconvolution results using structural index 0 (SI 0) (Figure 13a) were applied for the identification of high-value mineral deposits that are localized and discrete. Structural Index 1 (SI 1) (Figure 13b) is suitable for elongated features like veins, dykes, and fault zones, which are common in the tectonic framework of the younger granite region. It facilitates the detection of mineralized zones associated with these structures. 3D inversion models help in revealing the geometry and physical properties of causative bodies. The residual anomaly map of the area was divided into two blocks (Figure 14) to enable magnetic inversion; the 3D inversion produces detailed images of the subsurface, allowing geologists to visualize the geometry of the granitic intrusions, faults, and mineralized zones in three dimensions. 3D magnetic inversion model (Figure 15) shows evidence of mineralization that is structurally controlled in the region. 3D inversion was achieved by clipping susceptibility <0.004 SI. Clipping susceptibility values to less than 0.004 SI during 3D magnetic inversion is often done because most common rock-forming minerals have magnetic susceptibilities lower than 0.004 SI so by clipping to this threshold, the inversion model better reflects realistic geologic conditions, especially in sedimentary or non-magnetic terrains. Again, high susceptibility values in inversion results can sometimes be numerical artifacts or due to noise, especially in areas with poor data coverage. Clipping helps stabilize the inversion and avoid overfitting anomalies with unrealistically high susceptibility values.
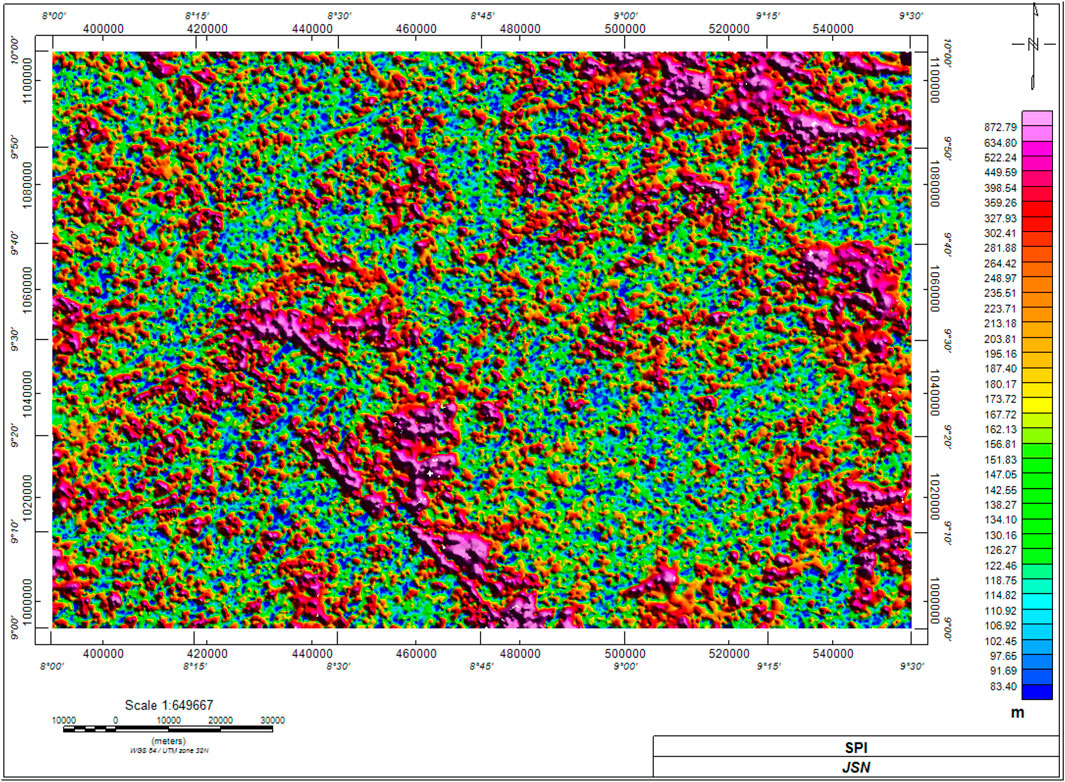
Figure 12. The SPI analysis for the study area estimates the depths to the top of magnetic sources. The results indicate that shallow depths are predominantly concentrated in the central and northwestern parts of the region.
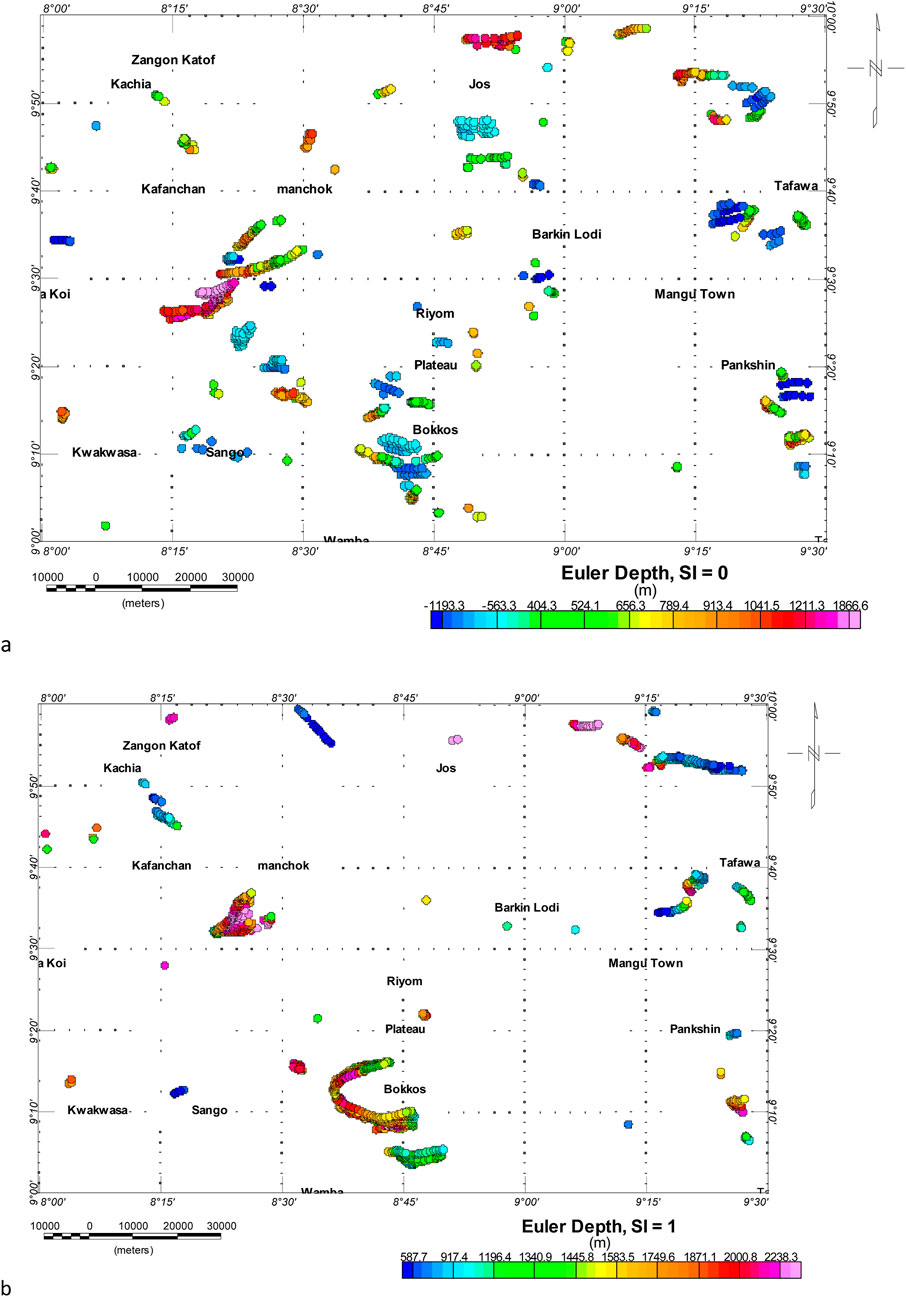
Figure 13. (a) Euler depths solution for a structural index of 0 (b) Euler depths solutions for a structural index of 1 revealing dyke and sill in the reason.
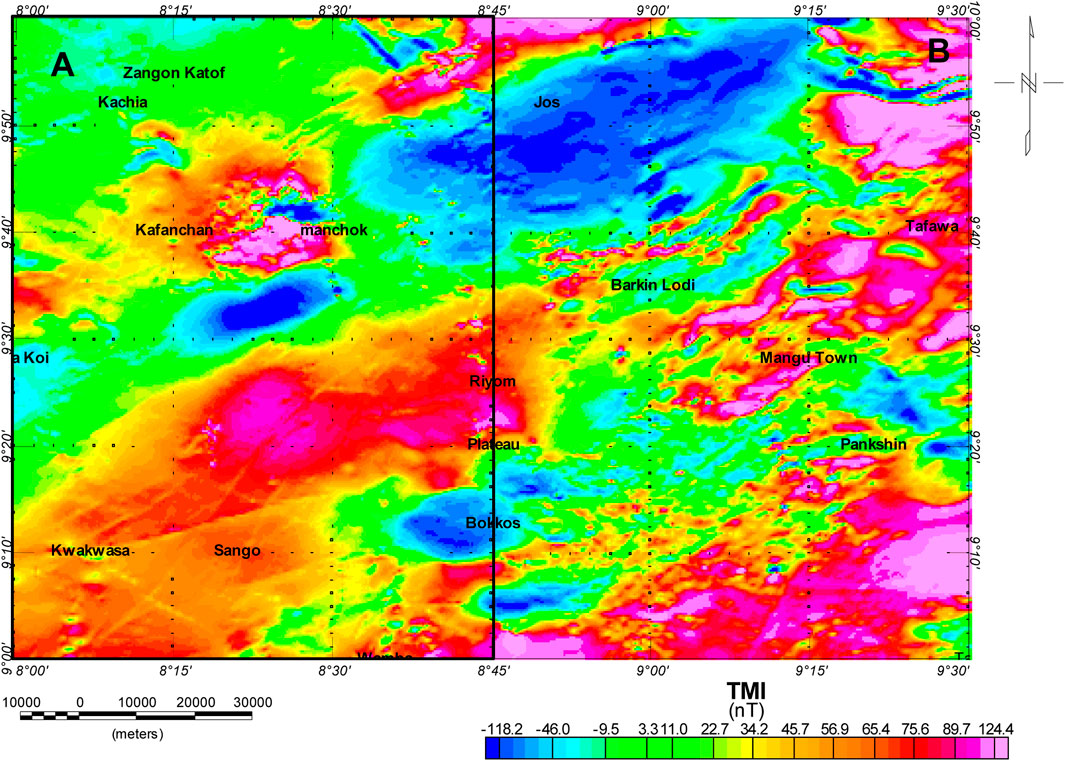
Figure 14. Residual magnetic anomaly data. Inserted blocks (A,B) represents blocks taken for the 3D inversion computations.
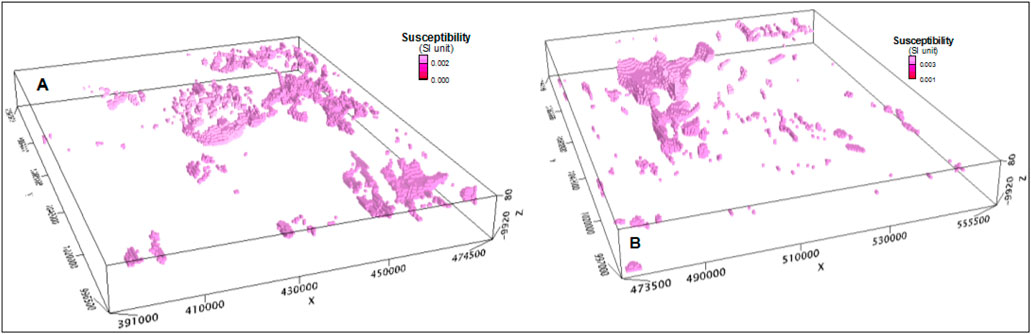
Figure 15. (A) 3D inversion result for section A of the study area. This was achieved by clipping susceptibility <0.004 SI. (B) 3D inversion result for section B of the study area. This was achieved by clipping susceptibility <0.004 SI.
5 Discussion
The magnetic anomaly map (Figure 4) reveals regions of high magnetic value (>66.7 nT); this region we believe corresponds to shallow sedimentary pills. There are evidence of intrusive bodies probable relating to granitic rocks intrusion of north-central basement of Nigeria while regions of low magnetic value (<−5.3 nT) suggest thicker sedimentary infilling and they are traced to the Cretaceous sedimentary rock with deeply seated basement rock at the base. The mixture of positive (7–66 nT) and negative (−1 to −22 nT) magnetic anomalies at Barkin Iodi, Sango, and Plateau locations could be indicators that come from the tin deposits that are eminent in the region (Abraham E. et al., 2024). Tin (cassiterite) magnetic intensity is normally low, because of its weak magnetic susceptibility. The variation in the magnetic field intensity in the research region (Figure 4) exhibits lithological heterogeneity, with granitic, syenitic, and volcanic rocks exposed (Figure 1), providing insights into the geological history and mineralization processes while the intrusive account to the high structuration in the region. RTME (Figure 5) reveals intense faulting in the area with faults orienting in the NE-SW direction; this is in conformity to the trend of structures of the Pan African Orogeny, which is the main tectonic event in the area. The Rose diagram (Figure 7) agrees with the structural trend pattern revealed in the RTME map. The TRD map (Figure 6) reveals E-W trending faults, aligning with regional tectonic patterns of the research region. Miller and Singh (1994) as well as Usman et al. (2025) believe that TRD technique can be used in enhancing weak anomalies and mapping edges of magnetic sources. It is particularly useful for delineating structural features such as faults, fractures, and lithological contacts, which are critical for understanding mineralization controls. The processed TRD and Rose diagram magnetic maps (Figures 6, 7) revealed a sharp contrast suggesting shallow granitic intrusions that are often rich in minerals, and this accounted for the numerous structural features, including faults and ring fractures, which align with known mineralized zones. These mapped structures we believe will likely act as conduits for tin-bearing hydrothermal fluids, facilitating mineral deposition. The TRD also reveals weak magnetic anomalies in the northwestern part of the study area, which we believe are due to low magnetization or complex geology, and the Rose diagram (Figure 7) reveals the trend of the main geologic structure. These fluids often can deposit economically significant minerals in favorable zones within or around the granite intrusions and they migrate via channels such as faults and folds. These structural features may promote the circulation of hydrothermal fluids, leading to alteration and mineralization. Abraham E. M. et al. (2024), in their work, believe that greisenization, which is a common alteration process in younger granites, is structurally controlled and is responsible for concentrating rare metals.
FVD and phrase symmetry analysis maps (Figures 8, 11) highlighted high-intensity anomalies that may be associated with mineralized granitic intrusions in the region. These intrusive bodies account for the high faulting and fracturing in the region, and we believe that these geologic structures can host minerals. The FVD superimposed with the lineament map revealed prominent anomalies, correlating well with known tin mineral deposits in the area. FVD emphasizes shallow anomalies in the central part of the research area, and we believe that this intrusive rock could be associated with tin and rare earth elements (REEs) such as those in the region. Abraham E. et al. (2024) believes that areas with high tin (Sn) concentrations show strong shallow magnetic responses when analyzed using FVD. The Butterworth bandpass filter (Figure 9) isolates specific wavelength components from magnetic data, enabling the identification of geological features associated with particular depths or scales. The Butterworth bandpass filter helps separate long-wavelength anomalies caused by deep-seated regional structures from shorter-wavelength anomalies generated by shallow sources like mineralized zones and fractures. The short wavelength anomalies delineated in the southeastern and northeast part (portion highlighted with sphere) were believed to reveal shallow granitic intrusions which are usually associated with tin and columbite mineralization from deeper crustal features. The flash points zones highlighted in Figure 9 reveal short wavelengths that help us isolate anomalies directly related to these intrusions, as the province is characterized by Late Jurassic granitic bodies with varying magnetic properties, Ekwok et al. (2023) believes that tin and tungsten deposits are often found in proximal zones of the intrusion, while niobium and tantalum are typically in more distal pegmatitic zones, influenced by structural conduits. The analytical signal (Figure 10) analysis identified sharp magnetic gradients indicative of fault-controlled mineralization. Areas of high AS were interpreted as region of high structuration (Barkin Iodi, Jos, Kachia, and Zongon areas) while low AS regions reveal higher sedimentary cover.
SPI result (Figure 12) reveals two depth models that suggest varying depth to the anomalous bodies. The region of shallower sedimentary fill (Barkin Iodi, Jos, Kachia, and Zongon areas) ranges from 83.4 to 110 m, and these regions was trace to the high mineralized zones (Figure 2), and the depths seem shallower in contrast with other zones and indicate likely near proximity of the magnetic minerals deposit to the surface, while the region of thicker sedimentary infilling (Mamgu, Sango, and Mangu areas) reveals regions where the basement is deeply seated or covered with much sediment and should be avoided during mineral exploitation. To ascertain the impact of geological contact on the environment, Euler deconvolution using SI of 0 was done. The good clustering of solution at a depth of 100–300 m was interpreted as dyke, and we believe that these structures control mineralization in the region (Figure 13). Euler deconvolution analysis using SI of 1 (Figure 14) reveals clear impact of geologic intrusion, which is predominant in the SW and SE regions of the research area. These regions were also flagged by the Butterworth bandpass filter, FVD, and AS model map of the area as regions with good mineral prospects because of the high faulting and folding recorded in the region. Ekwok et al. (2024) as well as Usman et al. (2025), in their studies, highlighted those faults, fractures, and shear zones provide pathways for magma to ascend from deeper crustal levels to form granite intrusions. These structures, according to them, control the emplacement of the younger granites, which are often associated with rare metal deposits like tin, tungsten, niobium, and tantalum, also observed in the region. 3D magnetic inversion (Figure 15) provided insights into the depth and geometry of the causative bodies. Most mineralized structures were found at depths ranging between 100 and 500 m, with some extending deeper. 3D inversion model (Figure 15) reveals evidence of subsurface structure that may host mineral deposits in the region.
Integrated analysis identified multiple zones with high mineralization potential, including previously uncharted areas. The geologic and mineral maps of the region confirmed the presence of altered rocks supporting the geophysical findings (Figure 16). The application of the integrated magnetic techniques provided a robust knowledge of the subsurface geology and mineralization patterns of the Younger Granite Province. The SPI, Euler Deconvolution, and 3D inversion create a comprehensive model that highlights the interplay between structural features and mineralization patterns. The model reveals clear evidence of mineralization that is structurally controlled in the region. Pre-existing Pan-African structures such as faults, shear zones, and lineaments mapped in the region were believed to have been reactivated during the Jurassic, creating pathways for magmatic intrusion and hydrothermal fluid flow (Abraham et al., 2022). These structural features may provide the necessary conduits for mineralization processes. The identification of concealed mineral zones underscores the application of magnetic methods in resource exploration. Furthermore, the correlation between magnetic anomalies and structural features highlights the significance of incorporating geophysical data with geological information.
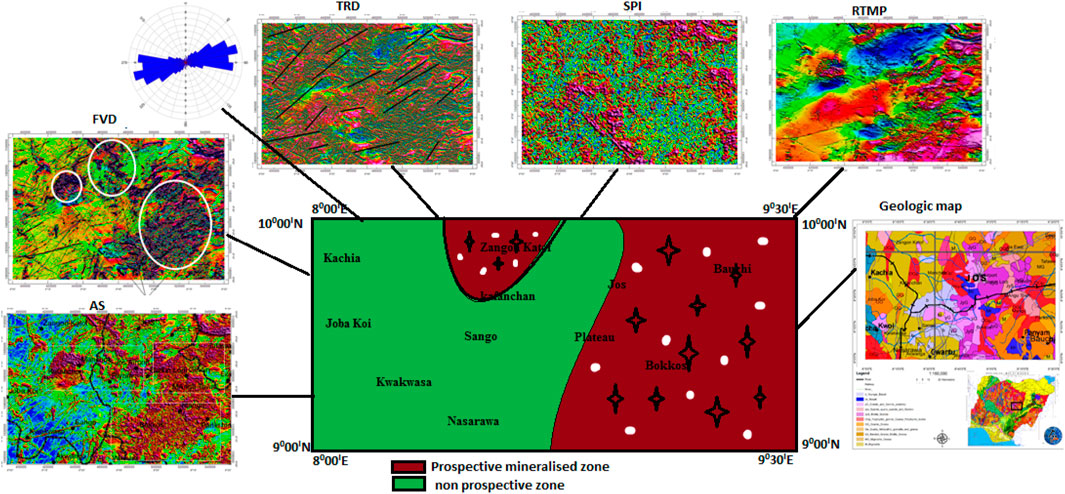
Figure 16. Idealized mineral prospectivity zone map of the region revealing region of high mineral prospectivity.
6 Conclusion
This study demonstrates that integrated magnetic geophysical techniques are highly effective in uncovering hidden mineral resources within the JYG Province of Nigeria. The results not only enhance our understanding of the region’s mineral potential but also provide a methodological framework for similar studies globally. Subsurface structural mapping using magnetic datasets provides a robust approach for understanding the structural framework and mineralization processes in this province. The Butterworth Bandpass filter, tilt derivative, and first vertical derivative play complementary roles in mapping structural features and enhancing understanding of mineralization processes. The geologic structure plays a critical role in controlling the emplacement, distribution, and concentration of mineral deposits in a volcanic region such as the JYG region. The promising mineralization zones delineated from 3D inversion, SPI, and Euler deconvolution validate the use of multidisciplinary geophysical techniques to guide further exploration and resource estimation. Their application not only enhances the accuracy of subsurface interpretations but also guides mineral exploration efforts effectively, contributing to the sustainable development of the region’s resources. The results underscore the importance of faults and intrusive granitic bodies as key controls on mineralization. Future research should incorporate additional geophysical methods, such as gravity, geochemical, resistivity, and induced polarization, to further refine exploration models.
Data availability statement
The raw data supporting the conclusions of this article will be made available by the authors, without undue reservation.
Author contributions
AU: Conceptualization, Data curation, Formal Analysis, Visualization, Writing – original draft. JN: Methodology, Project administration, Software, Validation, Writing – review and editing. EA: Formal Analysis, Investigation, Methodology, Software, Writing – review and editing. G-BA: Investigation, Methodology, Supervision, Writing – review and editing.
Funding
The author(s) declare that no financial support was received for the research and/or publication of this article.
Acknowledgments
We appreciate JSN consultant for providing the software and their technical assistant during data processing. To the entire reviewer and the academic staff of the Geology/Geophysics department, AE-FUNAI, we say thanks for strengthening this draft manuscript.
Conflict of interest
Author JN was employed by JSN Consult Limited.
The remaining authors declare that the research was conducted in the absence of any commercial or financial relationships that could be construed as a potential conflict of interest.
Generative AI statement
The author(s) declare that no Generative AI was used in the creation of this manuscript.
Publisher’s note
All claims expressed in this article are solely those of the authors and do not necessarily represent those of their affiliated organizations, or those of the publisher, the editors and the reviewers. Any product that may be evaluated in this article, or claim that may be made by its manufacturer, is not guaranteed or endorsed by the publisher.
Abbreviations
AS, Analytical signal; SPI, Source parameter imaging; TRD, tilt derivate; REE, Rare Earth Element; RTME, Reduce to magnetic Equator; JYG, Jurassic Younger Granite; FVD, first vertical derivative.
References
Abdelrahman, K., El-Qassas, R. A. Y., Fnais, M. S., Andráš, P., and Eldosouky, A. M. (2023). Geological structures controlling Au/Ba mineralization from aeromagnetic data: Harrat ad Danun area, Saudi Arabia. Minerals 13, 866. doi:10.3390/min13070866
Abdelrahman, K., Nguyen, D. V., Prasad, K. N. D., Thanh Vo, Q., Van Le, D., Pham, L. T., et al. (2024). Structural mapping of the west central Arabian Shield (Saudi Arabia) using downward continued magnetic data. J. King Saud Univ. Sci. 36 (2), 103039. doi:10.1016/j.jksus.2023.103039
Abraham, E., Usman, A., Chıma, K., Azuoko, G., and Ikeazota, I. (2024b). Magnetic inversion modeling of subsurface geologic structures for mineral deposits mapping in southeastern Nigeria. Bull. Mineral Res. Explor. 173 (173), 85–105. doi:10.19111/bulletinofmre.1267876
Abraham, E. M., Onwe, M. R., Ojonugwa, U. A., Gwazah, C. A., and Uchenna, M. E. (2022). Mapping of mineral deposits within granitic rocks by aeromagnetic data – a case study from Northern Nigeria. Arabian J. Geosciences 15, 16–56. doi:10.1007/s12517-022-10947-0
Abraham, E. M., Uwaezuoke, A. E., and Usman, A. O. (2024a). Geophysical investigation of subsurface mineral potentials in north-central Nigeria: implications for sustainable mining and development. Geomechanics Geophys. Geo-Energy Geo-Resources 10, 192. doi:10.1007/s40948-024-00913-3
Abubakar, F., Ahmad Abir, I., and Hassan, A. A. (2024). Kogi West geophysical mineralisation appraisal using analytical hierarchy process (AHP). J. Afr. Earth Sci. 224, 105532. doi:10.1016/j.jafrearsci.2024.105532
Adelana, S. M. A., Olasehinde, P. I., Bale, R. B., Vrbka, P., Edet, A. E., and Goni, I. B. (2008). “An overview of the geology and hydrogeology of Nigeria,” in Applied groundwater studies in Africa. Editors S. M. A. Adelana, and A. M. MacDonald (London: Taylor and Francis), 171–197. doi:10.1201/9780203889497
Ajakaiye, D. E., Hall, D. H., Ashiekaa, J. A., and Udensi, E. E. (1991). Magnetic anomalies in the Nigerian Continental mass based on aeromagnetic surveys. Tectonophysics 192 (1), 211–230. doi:10.1016/0040-1951(91)90258-1
Ajakaiye, D. E., Olatinwo, M. D., and Scheidegger, A. E. (1988). Another possible earthquake near Gombe in Nigeria on the 18-19 June 1985. Bull. Seismol. Soc. Am. 78 (2), 1006–1010. doi:10.1785/bssa0780021006
Ananaba, S. E., and Ajakaiye, D. E. (1987). Evidence of tectonic control of mineralization in Nigeria from lineament density analysis: a land-sat study. Int. J. Remote Sens. 8 (10), 1445–1453. doi:10.1080/01431168708954788
Benson, I. E., Godwin, O. A., Kenechukwu, A. E., Ifeanyi, C. A., and Ojonugwa, U. A. (2023). Evolution of geothermal energy potential of parts of the Middle Benue Trough Nigeria: aeromagnetic and aero-radiometric approach. Iran. J. Geophys. 16 (4), 7–52. doi:10.30499/ijg.2022.295242.1343
Büyüksaraç, A., Jordanova, D., Ates¸, A., and Karloukovski, V. (2005). Interpretation of the gravity and magnetic anomalies of the cappadocia region, Central Turkey. Pure Appl. Geophys. 162, 2197–2213. doi:10.1007/s00024-005-2712-9
Chibuike, A., Chukwu Ani, C., Ekwok, S. E., Alzahrani, H., Abdelrahman, K., Andráš, P., et al. (2024). Insights into Afikpo Synclinorium structures: subsurface analysis and intrusion outlining from airborne magnetic data. J. Afr. Earth Sci. 218, 105374. doi:10.1016/j.jafrearsci.2024.105374
Chinwuko, A. I., Usman, A. O., Onwuemesi, A. G., Anakwuba, E. K., Okonkwo, C. C., and Ikumbur, E. B. (2014). Interpretations of aeromagnetic data over Lokoja and environs, Nigeria. Int. J. Adv. Geosciences 2 (4), 66–71. doi:10.14419/ijag.v2i2.2305
Ekwok, S. E., Ahmed, M. E., Thompson, E. A., Ojong, R. A., George, A. M., Alarifi, S. S., et al. (2024). Mapping of geological structures and sediment thickness from analysis of aeromagnetic data over the Obudu basement complex of Nigeria. J. Geophys. Eng. 21 (2), 413–425. doi:10.1093/jge/gxae012
Ekwok, S. E., Eldosouky, A. M., Essa, K. S., George, A. M., Abdelrahman, K., Fnais, M. S., et al. (2023). Particle swarm optimization (PSO) of high-quality magnetic data of the obudu basement complex, Nigeria. Minerals 13, 1209. doi:10.3390/min13091209
Eldosouky, A. M., Eleraki, M., Mansour, A., Saada, S. A., and Zamzam, S. (2024). Geological controls of mineralization occurrences in the Egyptian Eastern Desert using advanced integration of remote sensing and magnetic data. Sci. Rep. 14, 16700. doi:10.1038/s41598-024-66924-y
Elhussein, M., Barakat, M. K., Alexakis, D. E., Alarifi, N., Mohamed, E. S., Kucher, D. E., et al. (2024). Aeromagnetic data analysis for sustainable structural mapping of the Missiakat Al Jukh area in the central eastern desert: enhancing resource exploration with minimal environmental impact. Sustainability 16, 8764. doi:10.3390/su16208764
Eze, O. E., Okiwelu, A. A., Ekwok, S. E., Abdelrahman, K., Alzahrani, H., Ibrahim, A., et al. (2024). Delineation of deep-seated crustal structures from magnetic data in the southeastern part of the Niger Delta basin, Nigeria. Front. Earth Sci. 12, 1439199. doi:10.3389/feart.2024.1439199
Ezeh, C. C., Okanya, O. S., Usman, A. O., and Odoh, O. P. (2022). Evaluation of aeromagnetic data over some parts of lower benue trough, Nigeria using spectral analysis. J. La Multiapp 03 (01), 008–017. doi:10.37899/journallamultiapp.v3i1.555
Fan, Z., Xiong, S., Yang, H., Fan, Z., Li, F., Ge, T., et al. (2024). Discussion of deep–seated structures as plumbing systems of hydrothermal minerals using gravity and magnetic data from the West Qinling Orogenic Belt. Front. Earth Sci. 12, 1408099. doi:10.3389/feart.2024.1408099
Ferreira, F. J., de Castro, L. G., and Bongiolo, A. B. S. (2013). Enhancement of the total horizontal gradient of magnetic anomalies using the tilt angle. Geophysics 78 (3), J33–J41. doi:10.1190/geo2011-0441.1
Hamimi, Z., Eldosouky, A. M., Hagag, W., and Kamh, S. Z. (2023). Large-scale geological structures of the Egyptian Nubian shield. Sci. Rep. 13, 1923. doi:10.1038/s41598-023-29008-x
Hegab, M. A. R. (2024). Mineral exploration and environmental impact assessment in the Jabal Hamadat Area, Central Eastern Desert, Egypt, using remote sensing and airborne radiometric data. Sci. Rep. 14, 21986. doi:10.1038/s41598-024-71387-2
Igwesi, D. I., and Umego, M. N. (2013). Interpretation of aeromagnetic anomalies over some parts of lower benue trough using spectral analysis technique. Int. J. Sci. Techn. Res. 2 (8), 153–165.
Ikumbur, E. B., Onwuemesi, A. G., Anakwuba, E. K., Chinwuko, A. I., Usman, A. O., and Okonkwo, C. C. (2013). Spectral analysis of aeromagnetic data over part of the southern Bida basin, west-Central Nigeria. Int. J. Fundam. Phys. Sci. 3 (2), 27–31. doi:10.14331/ijfps.2013.330050
Lelièvre, P. G., and Oldenburg, D. W. (2009). A 3D total magnetization inversion applicable when significant, complicated remanence is present. Geophysics 74 (3), L21–L30. doi:10.1190/1.3103249
Leu, L. K. (1981). Use of reduction-to-the-equator process for magnetic data interpretation. Geophysics 47, 445.
Likkason, O. K. (2007). Angular spectral analysis of aeromagnetic data over the Middle Benue Trough, Nigeria. J. Min. Geol. 43 (1), 53–62. doi:10.4314/jmg.v43i1.18864
Mahdi, A. M., Eldosouky, A. M., El Khateeb, S. O., Youssef, A. M., and Saad, A. A. (2022). Integration of remote sensing and geophysical data for the extraction of hydrothermal alteration zones and lineaments; Gabal Shilman basement area, Southeastern Desert, Egypt. J. Afr. Earth Sci. 194, 104640. doi:10.1016/j.jafrearsci.2022.104640
Megwara, J. U., and Udensi, E. E. (2014). Structural analysis using aeromagnetic data: case study of parts of southern Bida basin, Nigeria and the surrounding basement rocks. Earth Sci. Res. 3 (2). doi:10.5539/esr.v3n2p27
Miller, H. G., and Singh, V. (1994). Potential field tilt—a new concept for location of potential field sources. J. Appl. Geophys. 32 (3), 213–217. doi:10.1016/0926-9851(94)90022-1
Obaje, N. G. (2009). Geology and mineral resources in Nigeria. Springer Berlin, Heidelberg. 120. doi:10.1007/978-3-540-92685-6
Obiora, D. N., Yakubu, J. A., Okeke, F. N., Chukudebelu, J. U., and Oha, A. I. (2016). Interpretation of aeromagnetic data of Idah area in North Central Nigeria using combined methods. J. Geol. Soc. India 88, 98–106. doi:10.1007/s12594-016-0462-1
Odeyemi, I. (1981). A review of the orogenic events in the Precambrian basement of Nigeria, West Africa. Geol. Rundsch. 70 (3), 897–909. doi:10.1007/bf01820170
Odoh, O. P., Ezeh, C. C., Usman, A. O., Okanya, O. S., and Chima, C. J. (2021). Delineation of basin geometry within parts of northern Anambra basin, Nigeria: an aeromagnetic approach. J. Environ. Earth Sci. 11 (4), 28–39. doi:10.7176/JEES/11-4-04
Ofoegbu, C. O. (1985). A review of the geology of the Benue Trough, Nigeria. J. Afr. Earth Sci. 3, 283–291. doi:10.1016/0899-5362(85)90001-6
Ojo, O. J., Jimoh, Y. A., Umelo, J. C., and Akande, O. S. (2020). Organic geochemical and palynological studies of the Maastrichtian source rock intervals in Bida Basin, Nigeria: implications for hydrocarbon prospectivity. J. Petroleum Explor. Prod. Technol. 10 (4), 3191–3206. doi:10.1007/s13202-020-00989-z
Okonkwo, C. C., Onwuemesi, A. G., Anakwuba, E. K., Chinwuko, A. I., Ikumbur, B. E., and Usman, A. O. (2012). Aeromagnetic interpretation over maiduguri and environs, southern Chad basin, Nigeria. J. Earth Sci. Geotechnical Eng. 2 (3), 77–93.
Okonkwo, C. C., Onwuemesi, A. G., Anakwuba, E. K., Chinwuko, A. I., Okeke, S. O., and Usman, A. O. (2021). Evaluation of thermomagnetic properties and geothermal energy potential in parts of Bida basin, Nigeria, using spectral analysis. Bull. Mineral Res. Explor. 165, 1–26. doi:10.19111/bulletinofmre.796381
Olade, M. A., and Elueze, A. A. (1979). Petrochemistry of the Ilesha amphibolites and Precambrian crustal evolution in the Pan-African domain of SW Nigeria. Precambrian Res. 8, 303–318. doi:10.1016/0301-9268(79)90033-0
Ominigbo, O. E., Ukwang, E. E., Okumoko, D. P., and Ukpai, U. J. (2020). Petrogenesis and tectonic setting of the basement rocks around Irruan area, Bamenda Massif, SE Nigeria. J. Geosciences Geomatics 8 (1), 35–44. doi:10.12691/jgg-8-1-5
Rahaman, M. A. (1988). “Recent advances in the study of the basement complex of Nigeria,” in Precambrian geology of Nigeria (Geological Survey of Nigeria, Kaduna South), 11–43.
Rahaman, M. A. (1989). “Review of the geology of the basement complex of Southeastern Nigeria,” in Geology of Nigeria. Editor C. A. Kogbe 2nd edition (Special Publication of Geological Survey of Nigeria), 39–56.
Reid, A. B., and Thurston, J. B. (2014). The structural index in gravity and magnetic interpretation: errors, uses, and abuses. Geophysics 79, J61–J66. doi:10.1190/geo2013-0235.1
Reynolds, R. L., Roseenbaum, J. G., Hudson, M. R., and Fishman, N. S. (1990). Rock magnetism, the distribution of the magnetic minerals in the earth crust, and aeromagnetic anomalies. U.S. Geol. Surv. Bull. 19 (24), 24–45.
Thurston, J. B., and Smith, R. S. (1997). Automatic conversion of magnetic data to depth, dip and susceptibility contrast using the SPITM method. Geophysics 62, 807–813. doi:10.1190/1.1444190
Tijani Moshood, N. (2023). Geology of Nigeria. Springer Nature Switzerland AG. doi:10.1007/978-3-031-17972-3_1
Udensi, E. E., and Osazuwa, I. B. (2004). Spectral determination of depth to magnetic rocks under the Nupe Basin, Nigeria. Niger. Assoc. Petroleum Explor. Bull. 17, 22–27.
Usman, A. O., Abraham, E. M., Ezeh, C. C., Azuoko, G.-B., Chinwuko, A. I., Chizoba, C. J., et al. (2024b). Structural modelling of subsurface geologic structures in Anambra and adjoining Bida Basins using aeromagnetic data: implications for mineral explorations. Kuwait J. Sci. 52, 100307. doi:10.1016/j.kjs.2024.100307
Usman, A. O., Chinwuko, I. A., Azuoko, G., Ekwe, A. C., Abraham, E. M., and Chizoba, J. C. (2023). Geo-morphological mapping of the basin configuration of parts of Southern Nupe Basin, Nigeria, using high resolution aeromagnetic and core drill dataset. Iran. J. Geophys. 17 (3), 91–110. doi:10.30499/IJG.2023.383276.1486
Usman, A. O., Ezeh, C. C., and Chinwuko, I. A. (2018). Integration of aeromagnetic interpretation and induced polarization methods in delineating mineral deposit and basement configuration within Southern Bida Basin, Northwest Nigeria. J. Geol. Geophys. 7, 1–13. doi:10.4172/2381-8719.1000449
Usman, A. O., Mbachu, V. M., Okonkwo, C. C., Chinwuko, A. I., and Chizoba, C. J. (2024c). Modelling the geothermal potentials energy of Abakaliki, lower benue trough Nigeria using fourier transform of digital aeromagnetic data. Int. J. Phys. Sci. 19 (2), 112–126. doi:10.5897/IJPS2024.5072
Usman, A. O., Michael Abraham, E., Churchill, C. O., Chinwuko, A. I., and Azuoko, G.-B. (2024a). Geothermal energy appraisal and subsurface structural mapping of the Rafin Rewa warm spring region, precambrian basement complex of Nigeria. Sci. Rep. 14, 17368. doi:10.1038/s41598-024-66927-9
Usman, A. O., Nomeh, J. S., and Abraham, E. M. (2025). Subsurface structural mapping a tool in understanding the geodynamics of mineralization within the North-central precambrian basement of Nigeria, using aeromagnetic dataset. Earth Sci. Inform. 18, 169. doi:10.1007/s12145-024-01492-3
Keywords: young granite, magnetic dataset, subsurface structures, SPI, magnetic surveys
Citation: Usman AO, Nomeh JS, Abraham EM and Azuoko G-B (2025) Uncovering the hidden mineral treasure of the Jurassic Younger Granite region of Nigeria using integrated magnetic geophysical techniques. Front. Earth Sci. 13:1568232. doi: 10.3389/feart.2025.1568232
Received: 29 January 2025; Accepted: 22 April 2025;
Published: 30 April 2025.
Edited by:
J. Gregory Shellnutt, National Taiwan Normal University, TaiwanReviewed by:
Ana Gonçalves, University of Porto, PortugalFilippo Accomando, CNR IREA (Istituto per il Rilevamento Elettromagnetico dell’Ambiente), Italy
Copyright © 2025 Usman, Nomeh, Abraham and Azuoko. This is an open-access article distributed under the terms of the Creative Commons Attribution License (CC BY). The use, distribution or reproduction in other forums is permitted, provided the original author(s) and the copyright owner(s) are credited and that the original publication in this journal is cited, in accordance with accepted academic practice. No use, distribution or reproduction is permitted which does not comply with these terms.
*Correspondence: Ayatu Ojonugwa Usman, YXlhdHUuYW9AZnVuYWkuZWR1Lm5n
†ORCID: Joseph Sunday Nomeh, orcid.org/0000-0003-3154-6148; Ema Michael Abraham, orcid.org/0000-0003-0623-5604