 Fangping Chen
 Zhenzhen Shen
 Jian Li1
- 1Shaanxi Yanchang Petroleum (Group) Co., Ltd., Research Institute, Xi’an, Shaanxi, China
- 2Yangtze University, Jingzhou, Hubei, China
Tight oil reservoirs, such as the Chang 8 formation in the Dadonggou area of the Ordos Basin, commonly encounter severe challenges including strong heterogeneity, and low recovery factors under conventional development methods. Effectively enhancing the recovery of such reservoirs represents a key challenge for efficient field development. Based on the characteristics of the actual reservoir, a large-scale three-dimensional (3D) physical simulation model was designed and constructed. Using two typical horizontal well patterns, row well pattern and five-spot well pattern, physical simulation experiments were conducted to evaluate the effects of N2 flooding, water-alternating-gas (WAG) flooding, water flooding, and nano-microsphere flooding on oil recovery. The results demonstrate that for reservoirs with a permeability of 0.3 mD, WAG flooding significantly improves oil recovery after N2 flooding, increasing the recovery factor by 14.5% and 16% for the row well and five-spot well patterns, respectively. For reservoirs with a permeability of 3.3 mD, nano-microsphere flooding exhibits excellent capability for expanding the sweep volume, resulting in a recovery improvement of 14.5% and 13.5% compared with water flooding for the row well and five-spot well patterns. Additionally, the five-spot well pattern outperforms the row well pattern in terms of recovery efficiency and uniform sweep distribution for all flooding techniques evaluated. This work validated the potential of technologies, such as nano-microsphere flooding, to enhance tight oil recovery, providing key technical support for refined field development.
1 Introduction
Oil and gas remain critical resources for both daily life and strategic energy needs globally (Han et al., 2021). As major oilfields gradually age, enhancing oil recovery has become an urgent challenge. Most of China’s oilfields are lacustrine in origin, characterized by complex geological conditions and demanding extraction technologies (Zhong et al., 2025). Notably, low-permeability reservoirs account for more than half of the proven reserves (Hu et al., 2018; Kang et al., 2022). These reservoirs often lack natural drive energy, exhibit low single-well productivity, and thus necessitate artificial water flooding as a primary recovery method (Sander et al., 2017; Deng et al., 2023). However, during the later stages of water flooding, wellhead water cut increases sharply while oil recovery rates decline rapidly, resulting in low overall recovery efficiency (Tang et al., 2024).
Low-permeability reservoirs are typically characterized by small pore-throat sizes, severe heterogeneity, high injection pressures, and strong water sensitivity (Lin et al., 2013; Liu et al., 2019; Li et al., 2016; Lian et al., 2023). To address these challenges, various enhanced oil recovery (EOR) techniques have been applied, including gas flooding, surfactant flooding, nanofluid flooding, imbibition-assisted recovery, and gel plugging technology for pressure reduction and injection enhancement (Kang et al., 2022; Wang et al., 2017; Xu et al., 2024). Currently, laboratory-scale physical simulations of low-permeability reservoirs predominantly use one-dimensional cylindrical cores. Li et al. (2019), through a comparative study of CO2 and N2 huff-n-puff experiments, highlighted that CO2 molecular diffusion allows a significant portion of CO2 to exist as dissolved gas in the reservoir, thereby enhancing oil and gas recovery. Wei et al. (2018) conducted core flooding experiments in low-permeability reservoirs, focusing on N2-based gas flooding, WAG flooding, and foam flooding. Their findings revealed that N2 foam flooding effectively regulates displacement, controls water production, and enhances recovery in low-permeability reservoirs with severe heterogeneity. Olabode et al. (2018) systematically evaluated WAG and foam flooding in thin oil rims using experimental design and response surface modeling with Pareto analysis. Results demonstrate updip WAG injection EOR (enhanced oil recovery) by 9.2%–30.1%, while foam injection achieved 14.2%–52.7% improvements. Li et al. (2025) demonstrated that thickened CO2 flooding enhances oil recovery in low-permeability sandstone reservoirs by modifying pore morphology and diverting flow, while reducing thickener use, based on core flooding, Computed Tomography (CT), and Nuclear Magnetic Resonance (NMR) tests. Qu et al. (2024a) investigated surfactant-EOR mechanisms in low-permeability glutenite based on high-P/T imbibition tests and NMR analysis. Results show anionic KPS achieved 49.02% recovery via IFT reduction, outperforming nonionic OP-10’s 48.11% through emulsification. However, the accuracy of laboratory-scale physical simulations for low-permeability reservoirs is limited by the small size of the models, making it challenging to replicate the complex flow dynamics and pressure variations during reservoir development, including the replenishment and release of reservoir energy.
To overcome the limitations of one-dimensional cylindrical cores, many researchers have turned to large-scale physical simulation experiments to study low-permeability reservoirs. Wang et al. (2020) conducted physical simulations of CO2 huff-n-puff development in tight oil reservoirs using hydraulically fractured horizontal wells. Their study revealed that CO2 huff-n-puff increases the contact area between CO2 and crude oil, enhancing oil extraction, dissolution, and viscosity reduction (Nchila et al., 2022). Furthermore, horizontal wells and fractures reduce flow resistance, improving crude oil mobility. Tang et al. (2021) employed large outcrop square and long cores to investigate CO2 huff-n-puff under various injection-production parameters and soak times. They found that the contribution of CO2 huff-n-puff to recovery is primarily due to flow and diffusion effects, with diffusion-driven recovery dominating when soak times are sufficiently long, as dissolved gas drive plays a key role. Fang et al. (2024) established a large-scale 3D physical simulation model to study water invasion patterns and residual gas distribution in multi-well edge and bottom water gas reservoirs. Their results indicated that water breakthrough occurs first near fractures and high-permeability zones. Closing low-position gas wells after water breakthrough can extend the water-free production period, with residual gas primarily located around fractures and reservoir edges. Sun et al. (2022) developed a mathematical model for the water huff-n-puff process in tight oil reservoirs, accounting for reservoir volume changes. They proposed and validated corresponding calibration criteria and used outcrop tight reservoir materials to construct large physical models. Three sets of water huff-n-puff experiments under varying conditions provided theoretical insights into recovery mechanisms and development characteristics. Currently, large-scale physical simulation studies predominantly focus on vertical well production, with limited research on horizontal well patterns. Moreover, traditional water and gas flooding dominate these studies, leaving emerging tertiary recovery techniques, such as chemical flooding and microbial enhanced oil recovery (MEOR), relatively underexplored (Olabode, 2020).
Nano-microsphere flooding, recognized as a groundbreaking EOR technology for low-permeability reservoirs, has been extensively validated by researchers and institutions worldwide. Its unique mechanisms, such as pore-throat mobility control and selective plugging, position it as a pivotal innovation for enhancing oil recovery in challenging reservoirs (Yang et al., 2017; Chen et al., 2020a). On one hand, nano-microspheres can effectively regulate the permeability profile in far-field reservoir zones. Their nano-scale size allows them to enter small pore throats, where they swell upon water absorption, blocking dominant flow channels and homogenizing the reservoir. On the other hand, nano-microspheres leverage their hydrophobic and hydrophilic functional groups to alter oil-water interfacial tension and reservoir wettability, thereby improving oil displacement efficiency. He et al. (2015) successfully synthesized uniform polymer nano-microspheres using dispersion polymerization in a low-toxicity ethanol/water solvent system and investigated how solvent composition, initiator concentration, and monomer composition affect microsphere yield and morphology. Olabode et al. (2020) and Olabode et al. (2024) investigated biopolymer flooding. They demonstrated that plant-based polymers, specifically those derived from Jatropha and potato peel, enhance oil recovery significantly, achieving increases of up to 38.8% and 74%. This enhancement results from optimizing viscosity and mobility ratio through concentration adjustments, thereby proving the eco-economic viability of these materials as alternatives to conventional chemical EOR agents. Zhang et al. (2023) revealed that polymer nano-microspheres enhance oil recovery in porous media by forming dynamic bridge plugging in pore throats and exhibiting cyclic “migrate-plug-breakthrough-replug” behavior, while achieving 17.31% incremental recovery, based on the environmental scanning electron microscopy (ESEM) imaging and microfluidic displacement tests. Using pore-scale models and flooding experiments, Chen et al. (2024) revealed microspheres preferentially plug large pore throats within a matching factor limit of 1.21–1.47, enhancing oil recovery by 6.85% over polymer flooding through three mechanisms: pressure increase, dominant channel plugging, and residual oil displacement, demonstrating effective flow diversion in heterogeneous reservoirs. Qu et al. (2024) synthesized temperature/salt-resistant polymer microspheres via inverse suspension polymerization. The microspheres effectively plugged low-permeability zones and improved water injection profiles, demonstrating great potential for EOR in high-temperature, high-salinity reservoirs. While significant progress has been made in understanding nano-microsphere flooding, most studies have been limited to short-core experiments. Large-scale physical models for investigating nano-microsphere flooding in low-permeability reservoirs remain relatively unexplored (Chen et al., 2020b).
To summarize, previous studies have extensively employed core-scale experiments and numerical simulations to evaluate the potential of various EOR techniques in low-permeability reservoirs. Although some work has progressed to large-scale physical modeling, the focus has primarily centered on traditional water flooding and gas flooding processes, or analyses have predominantly utilized vertical well patterns. Consequently, the performance of emerging EOR techniques especially nano-microsphere flooding, along with their suitability and effectiveness under different horizontal well patterns, has not yet been sufficiently and systematically investigated. In particular, systematic and comparative evaluations using large-scale 3D physical models that realistically capture macroscopic reservoir characteristics are still largely lacking.
This work focuses on the Chang 8 tight oil reservoir in the Dadonggou area of the Ordos Basin. Based on the characteristics of the actual reservoir, a large-scale 3D physical simulation model was designed and constructed. Two typical horizontal well patterns, row well pattern and five-spot well pattern, were employed to explore the injection-production characteristics and optimization paths of various technologies, including N2 flooding, WAG flooding, water flooding and nano-microsphere flooding. The study systematically analyzed the effects of different development strategies on oil recovery. Its primary aim is to uncover efficient displacement mechanisms under the complex conditions of tight oil reservoirs and to provide innovative experimental support and technical guidance for enhancing oil recovery in such challenging formations.
2 Materials and methods
2.1 Experimental system and equipment
The 3D physical simulation apparatus for horizontal well patterns consists of four main components: injection system (for water and gas injection), reservoir simulation system, back-pressure system, and data acquisition and control system, as shown in Figure 1. While the overall setup is similar to conventional displacement simulation devices, a key distinction lies in the specially designed core holder, which accommodates the 3D rectangular core, unlike the holders used for one-dimensional small cores.
a. Injection System: This includes N2 gas cylinders, a booster pump, a constant flow pump, and exhaust equipment, enabling precise gas and water injection.
b. Reservoir Simulation System: The core component of the setup, consisting of a 3D physical model housed in a thermostatic chamber, replicates the geological conditions of the reservoir and simulates the subsurface environment.
c. Back-Pressure System: Comprising N2 cylinders, an intermediate container, pressure gauges, and a back-pressure device, this system maintains the required back pressure to mimic actual reservoir pressure during production.
d. Data Acquisition System: Equipped with a computer, high-precision data acquisition platform, graphical display and control software, and production fluid collection equipment, this system records and monitors experimental parameters such as pressure, fluid flow, and production rates in real-time.
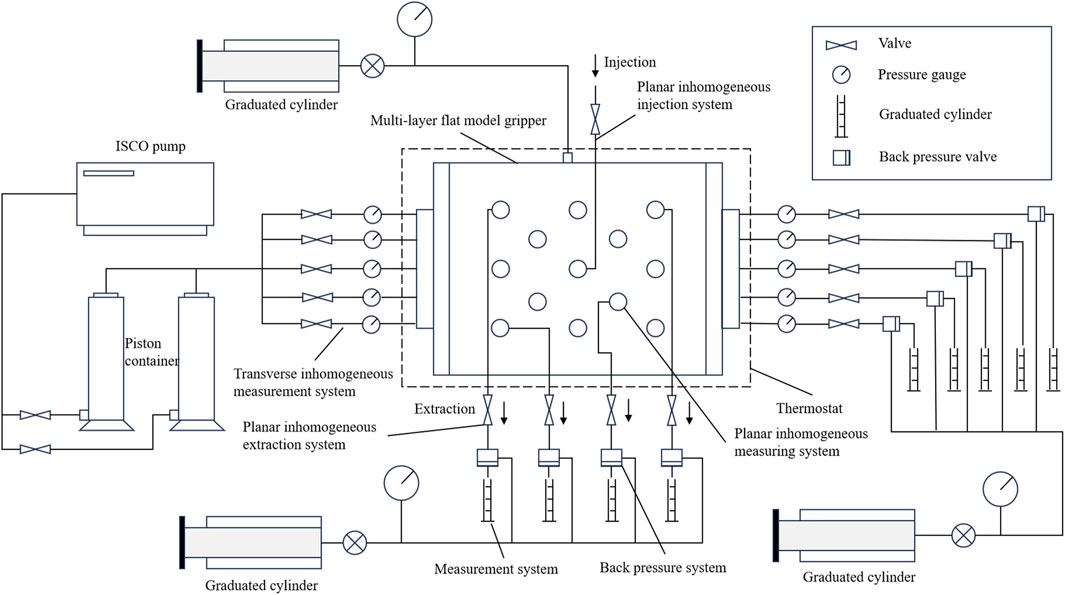
Figure 1. Schematic diagram of the three-dimensional physical simulation apparatus for horizontal well displacement experiments.
2.2 Sample design and preparation
2.2.1 Design of the 3D rectangular core
To ensure experimental stability and reliability, sand with a grain size distribution consistent with that of the sampled cores was selected. The core model was fabricated using advanced artificial core manufacturing techniques, resulting in a rectangular 3D core with dimensions of 30 cm × 30 cm × 4.5 cm (length × width × height). Multiple monitoring points were strategically arranged on the model, as illustrated in the Figure 2.
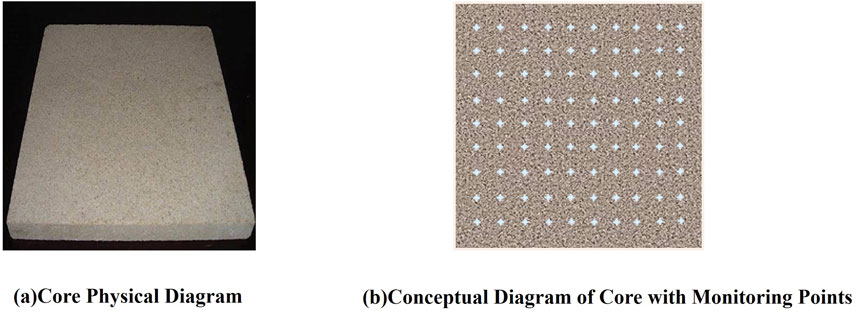
Figure 2. Synthetic Three-Dimensional Rock Core. (a) Core physical diagram (b) Conceptual diagram of core with monitoring points.
The 3D artificial cores used in this study have permeabilities of 0.3 mD and 3.3 mD, respectively. The 0.3 mD rectangular core corresponds to the average permeability of the tight reservoir in the study area (0.3 mD), while the 3.3 mD core represents the high-permeability streaks within the same reservoir. Constant-rate mercury intrusion tests were conducted for both cores, as shown in Figure 3. The results indicate that the artificial cores, with similar permeability and porosity, exhibit pore-throat distribution characteristics comparable to those of the actual reservoir rocks. By using artificial cores with microstructural features resembling the study area’s reservoir, the experimental outcomes closely approximate real reservoir behavior, providing valuable guidance for oilfield development.
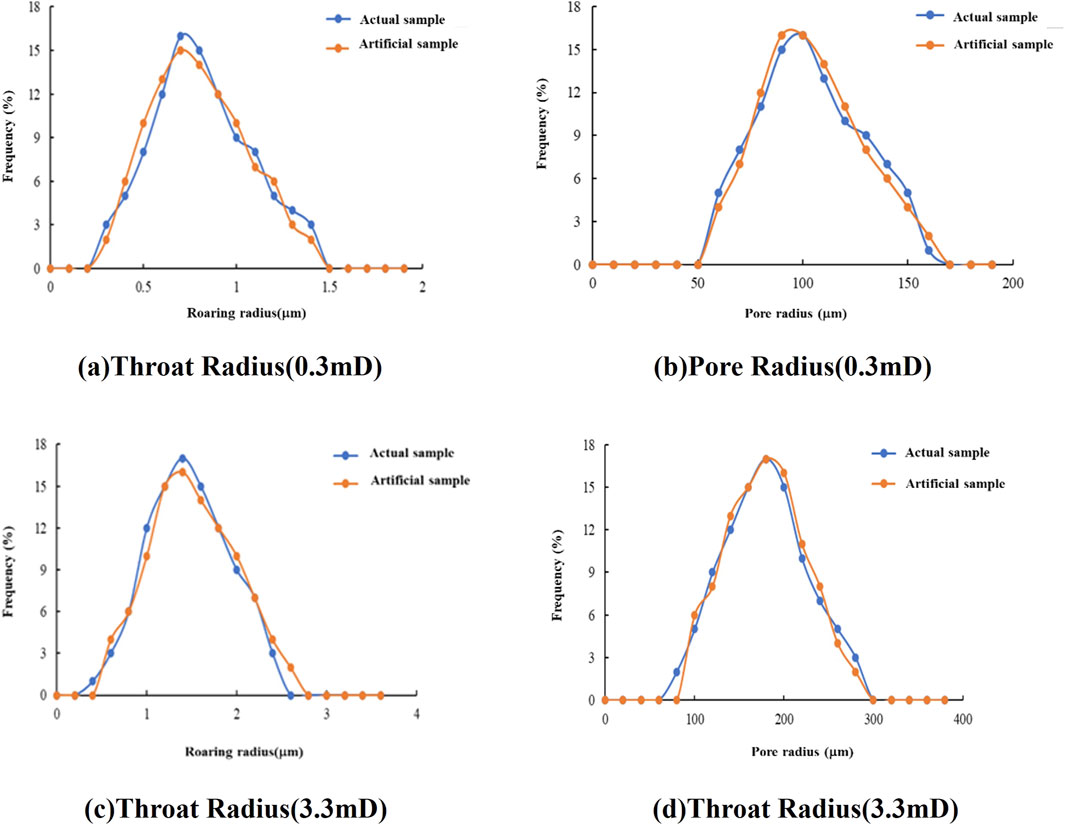
Figure 3. Comparison of pore-throat structures between artificial cores and actual reservoir cores. (a) Throat Radius (0.3mD). (b) Pore Radius (0.3mD). (c) Throat Radius(3.3mD). (d) Throat Radius(3.3mD).
2.2.2 Design of horizontal well patterns
In the development of low-permeability tight oil reservoirs, a well-designed horizontal well pattern is crucial for efficient reservoir exploitation. Although numerical simulation is commonly used to optimize well pattern types, the parameters used in these models must be calibrated based on laboratory-scale physical simulation results. Due to the unique reservoir conditions of different target areas, the results of physical simulation experiments cannot be universally applied, necessitating specific experiments tailored to individual reservoir conditions. For the Chang 8 reservoir in the Dadonggou oilfield, horizontal well development can maximize geological reserve control and enhance overall recovery efficiency in the block. However, there is currently a lack of physical simulation studies evaluating different horizontal well patterns under comparable conditions.
To address this, physical simulation experiments were conducted with different well patterns arranged within the model to optimize the design. The success of such experiments depends on constructing high-temperature, high-pressure scaled physical models and carefully designing the internal well configurations. Many researchers have successfully developed such physical models and conducted experiments to compare the performance of different well patterns (Olabode et al., 2021a; Olabode et al., 2021b). In this work, the Chang 8 reservoir in the Dadonggou oilfield was taken as the prototype. Using physical simulation methods, experiments were conducted to evaluate N2 flooding, WAG flooding, and nano-microsphere flooding under two types of horizontal well patterns: row well pattern and five-spot well pattern. The designs of the physical models for these horizontal well patterns are shown in Figure 4. It should be emphasized that this study simplified the complete well pattern, conducting experimental simulations on only a 1/4 element of the pattern.
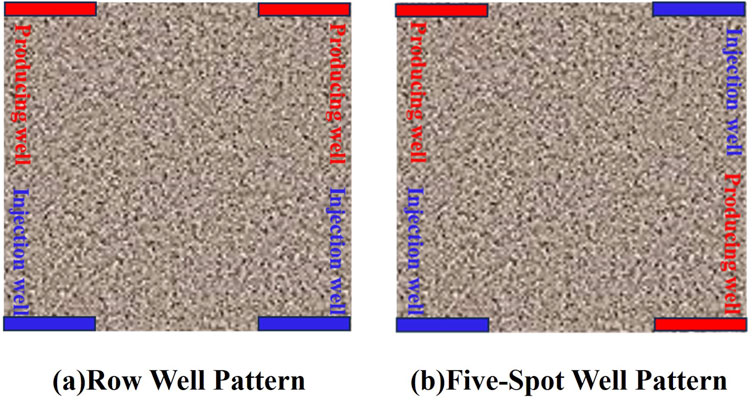
Figure 4. Horizontal well pattern model. (a) Row well pattern (b) Five-spot well pattern.
2.3 Experimental procedure and plan
The experimental oil was sourced from the field, with a viscosity of 6.38 mPa·s under experimental conditions. The test water, also sourced from the field, was of the CaCl2 type with an average total salinity of 2.4 × 10⁵ mg/L. The experimental temperature was maintained at 53.12°C, and the nano-microspheres used for profile control had a particle size of 300 nm. The experimental scheme and parameters are summarized in Table 1.
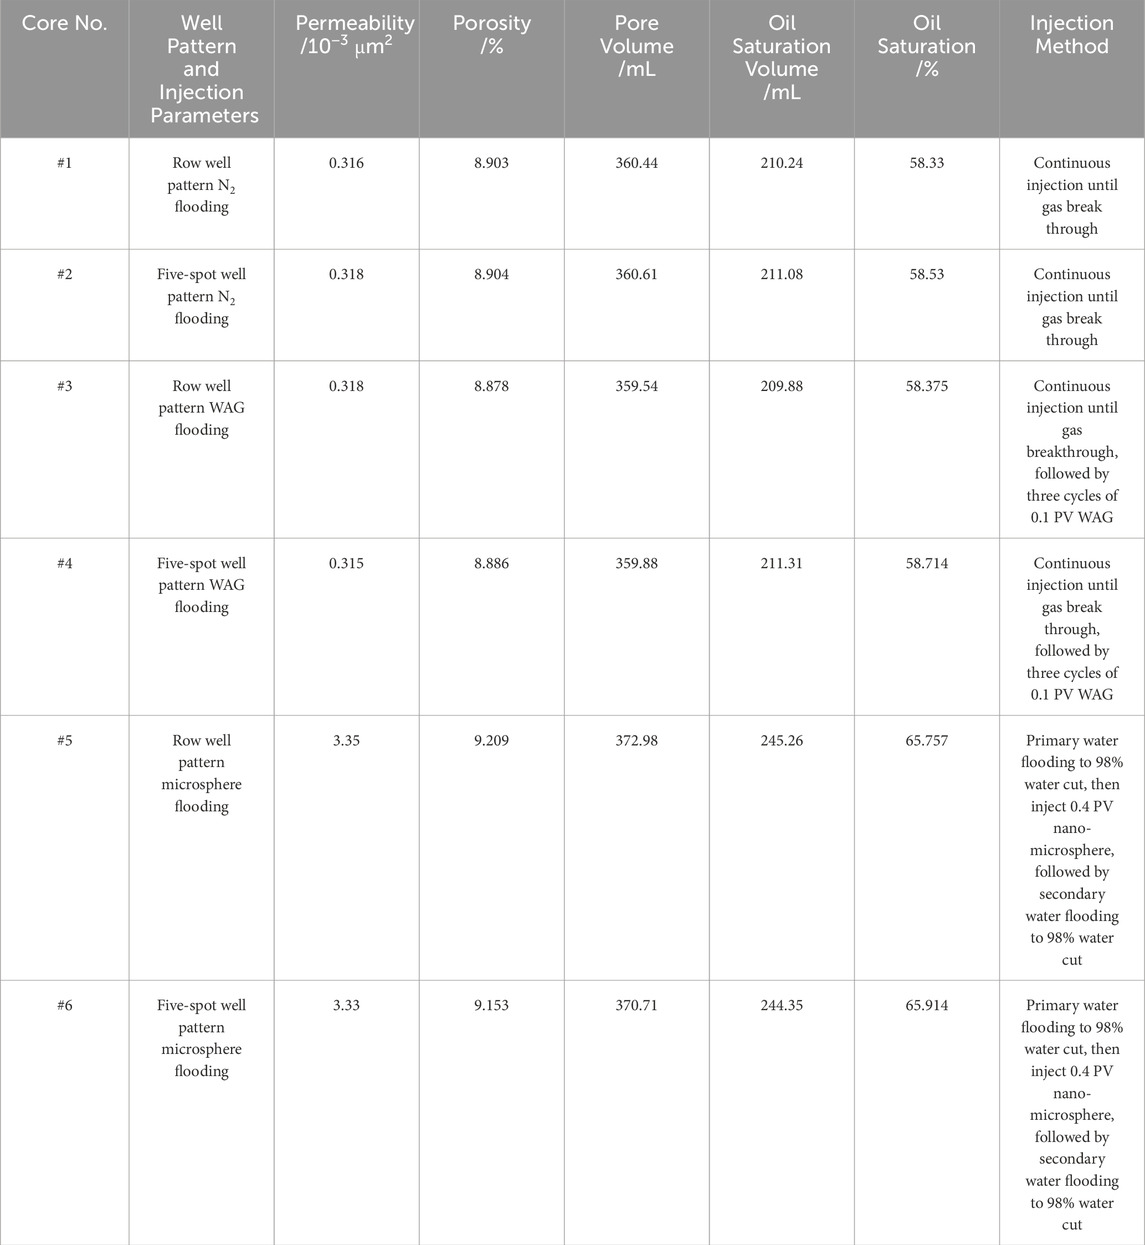
Table 1. Comparative experiments of different flooding methods under different well patterns.
The operational steps for the experimental process are as follows:
a. Design two horizontal well patterns (row well pattern and five-spot well pattern) as shown in Figure 4. Connect the experimental apparatus as depicted in Figure 1, and maintain the experimental temperature at a constant 53°C.
b. Use a vacuum pump to evacuate the 3D core. Saturate the core with simulated formation water using a constant flow pump to calculate the pore volume. Inject the experimental oil into the core at a constant flow rate to establish irreducible water saturation and calculate the oil saturation. Conduct an aging process at reservoir temperature for 3 days.
c. Conduct N2 flooding experiments on the 3D horizontal well cores. Set the back pressure at the horizontal well outlet to 10 MPa. Inject N2 continuously at an injection pressure of 11 MPa at the inlet until the gas-oil ratio (GOR) at the outlet exceeds 5,000 m3/m3. Record the variation in oil production and the gas-liquid ratio at the outlet to calculate the N2 flooding recovery. Perform two groups of displacement experiments (one for the row well pattern and one for the five-spot well pattern) using two cores.
d. Conduct WAG experiments by alternately injecting 0.1 PV of water and 0.1 PV of gas for three cycles. After the alternating cycles, inject N2 continuously until the GOR at the outlet exceeds 5,000 m3/m3. Record the variation in oil production and the gas-liquid ratio at the outlet to calculate the WAG recovery. Perform two groups of displacement experiments (one for the row well pattern and one for the five-spot well pattern).
e. Conduct a 3D core nanosphere flooding experiment in a horizontal well pattern. After injecting 0.4 PV of nanospheres, water is injected again until the water cut at the outlet reaches 98%. During the displacement process, measure the changes in oil production and water cut at the outlet. The nanosphere injection experiment consists of two groups: one with a line drive well pattern and the other with a horizontal well pattern.
3 Results and discussion
3.1 N2 flooding experiments in the 0.3 mD core sample
3.1.1 Row well pattern
As shown in the Figure 5, during N2 injection using the row well pattern, the remaining oil is primarily concentrated at the production end, particularly in the middle regions perpendicular to the injection direction. Due to the effects of pressure differential and mobility ratio, the oil saturation along the injection-production line decreases significantly, while the remaining oil saturation in the central part of the well pattern remains high. At 0.2 PV of N2 injection, the swept volume reaches nearly 70%. By 0.6 PV, the gas-liquid ratio at the outlet has risen to 5,000 m3/m3. From the changes in oil saturation with increasing N2 injection, it is evident that gas breakthrough is prominent in the row well pattern during N2 flooding.
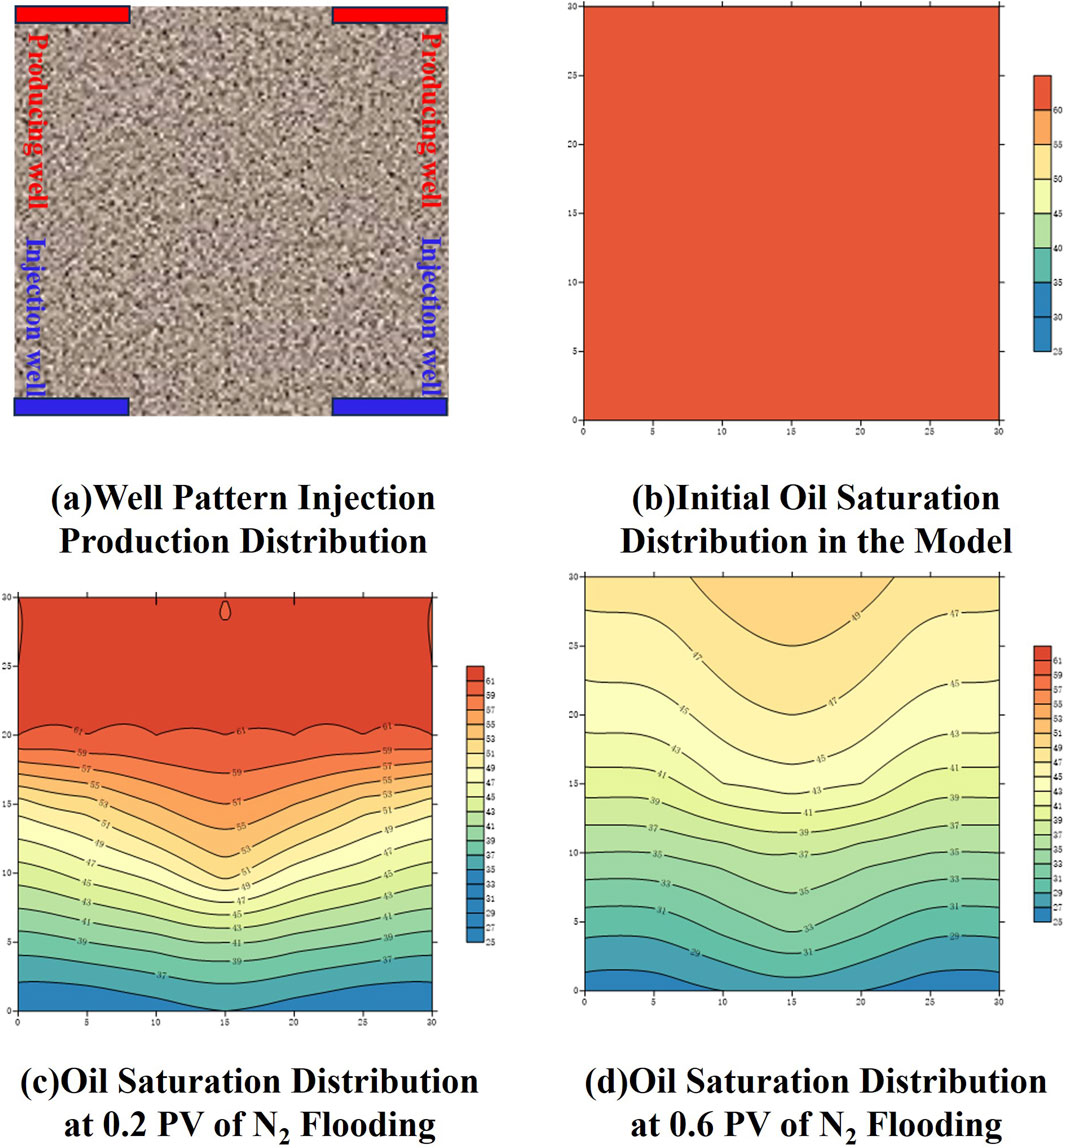
Figure 5. N2 flooding process for the row well pattern. (a) Well pattern injection production distribution (b) Initial oil saturation distribution in the model (c) Oil saturation distribution at 0.2 PV of N2 flooding (d) Oil saturation distribution at 0.6 PV of N2 flooding.
The results of the N2 flooding experiment for the row well pattern are shown in Figure 6. The final recovery factor for N2 flooding with the row well pattern is 26%. The gas breakthrough time occurs at 0.2 PV, and the rapid rise in gas-liquid ratio takes place between 0.3 PV and 0.4 PV. After gas breakthrough, the system quickly enters the high gas-liquid ratio stage. From the development characteristics, the main production period is before 0.3 PV of N2 injection. After entering the high gas-liquid ratio stage, the increase in recovery factor becomes relatively small.
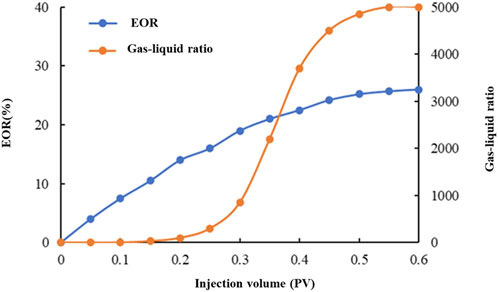
Figure 6. Results of the N2 flooding experiment for the row well pattern.
3.1.2 Five-spot well pattern
The N2 flooding process for the five-spot horizontal well pattern is shown in Figure 7. From the figure, during N2 flooding using the five-spot horizontal well pattern, the remaining oil is mainly distributed in the central part of the well pattern, followed by the production end. On the plane, the remaining oil is distributed along the line connecting the two production wells. The oil saturation around the injection wells decreases significantly, while the remaining oil saturation in the central part of the well pattern and near the production wells is high. Unlike the row well pattern, at 0.2 PV of N2 injection, the entire model is swept by the gas, but the degree of utilization varies in different areas due to differences in the well pattern. By around 0.6 PV of N2 injection, the outlet gas-liquid ratio reaches 5,000 m3/m3, which is consistent with the row well pattern. After gas breakthrough, the distribution of remaining oil is completely different from that of the row well pattern. From the changes in saturation with increasing N2 flooding, the gas channeling phenomenon is also evident in the five-spot horizontal well pattern.
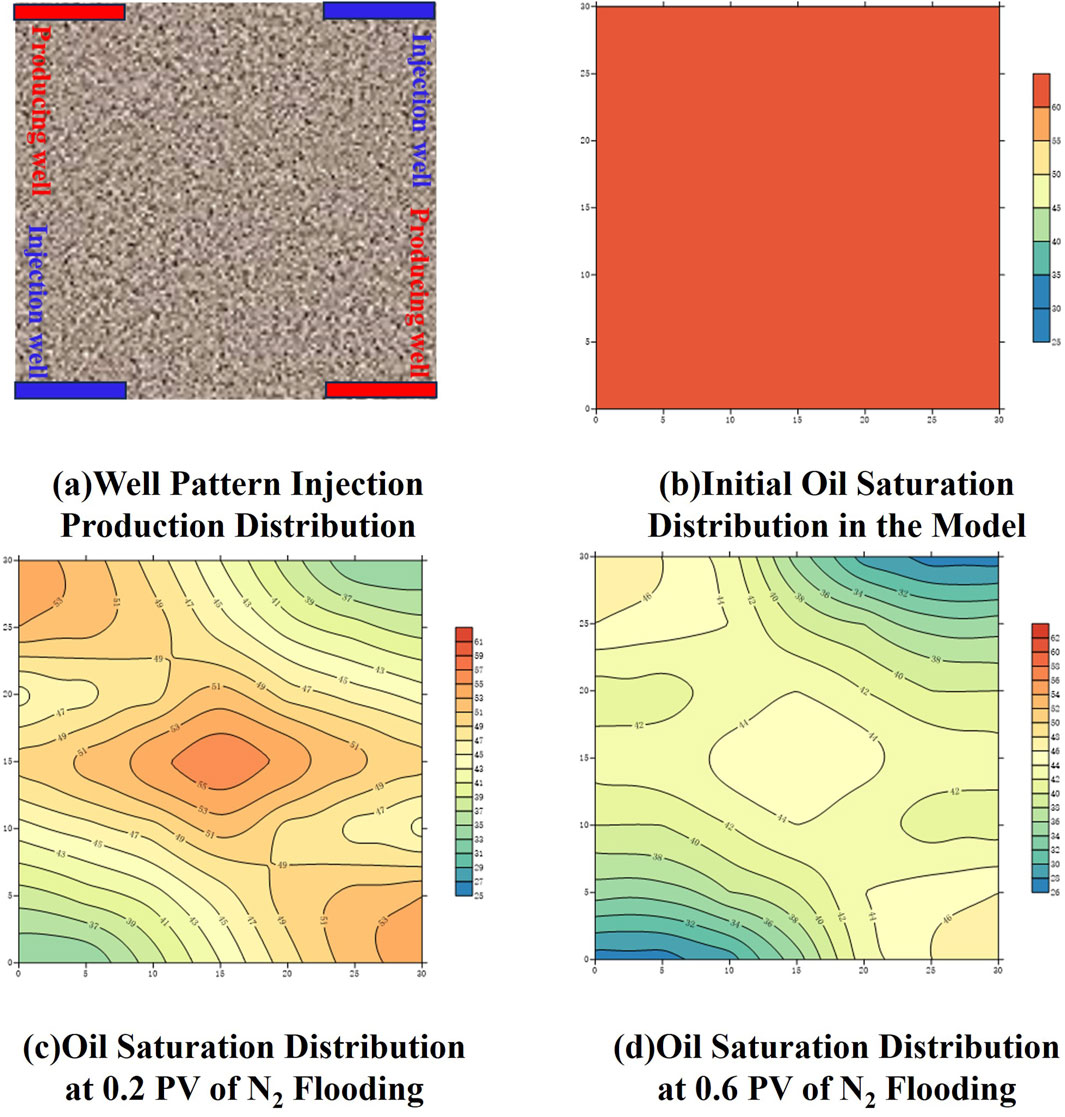
Figure 7. N2 Flooding process for the five spot horizontal well pattern. (a) Well pattern injection production distribution (b) Initial oil saturation distribution in the model (c) Oil saturation distribution at 0.2 PV of N2 flooding (d) Oil saturation distribution at 0.6 PV of N2 flooding.
The results of the N2 flooding experiment for the five-spot horizontal well pattern are shown in Figure 8. The final recovery factor for N2 flooding in the five-spot horizontal well pattern is 27%, slightly higher than that of the row well pattern. The gas breakthrough time occurs at 0.1 PV, which is earlier than the 0.2 PV in the row well pattern. The gas-liquid ratio increases during 0.1–0.5 PV. Compared with the row well pattern, the main production period in the five-spot pattern occurs after gas break-through, with the gas-liquid ratio increasing relatively slowly and progressively, unlike the rapid increase observed in the row well pattern. From the development characteristics, the main production period occurs before 0.5 PV of N2 injection. After entering the high gas-liquid ratio stage, the increase in recovery factor is relatively low.
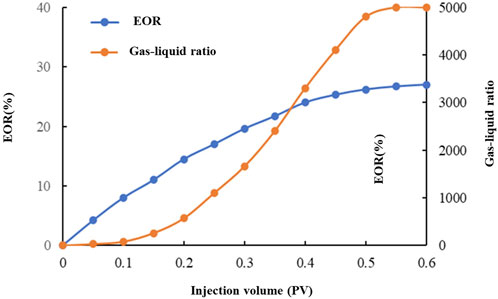
Figure 8. Results of the N2 flooding experiment for the five-spot horizontal well pattern.
3.2 Water-alternating-gas flooding experiments in the 0.3 mD core sample
3.2.1 Row well pattern
The WAG flooding process for the row well pattern is shown in Figures 9a–f. Before WAG injection, continuous N2 flooding was conducted, consistent with the N2 flooding process described earlier. This section focuses on analyzing the WAG process after gas channeling occurs during continuous N2 flooding. The experimental results are shown in Figures 9e, f. During the three cycles of WAG injection, oil saturation gradually and uniformly decreases from the injection end to the production end, and the gas channeling pathways are significantly suppressed. In comparison, during single N2 flooding, high oil saturation is observed in the central area of the well pattern when gas channeling occurs. After WAG injection, the difference in oil saturation between the central part of the well pattern and the injection end is reduced. Following the secondary gas flooding after WAG, oil saturation further decreases, and the distribution becomes relatively uniform. This indicates that WAG injection effectively suppresses gas channeling, increases the swept volume, and improves oil recovery.
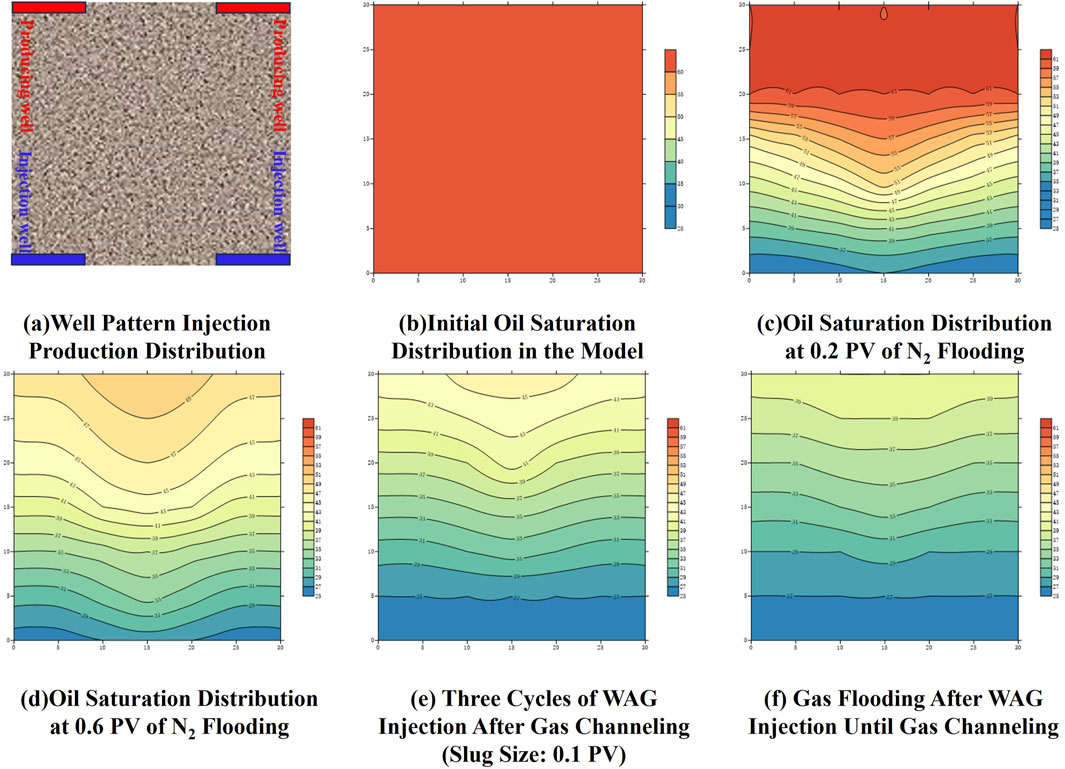
Figure 9. WAG injection process for the row well pattern. (a) Well pattern injection production distribution (b) Initial oil saturation distribution in the model (c) Oil saturation distribution at 0.2 PV of N2 flooding (d) Oil saturation distribution at 0.6 PV of N2 flooding (e) Three cycles of WAG injection after gas channeling (Slug Size: 0.1 PV) (f) Gas flooding after WAG injection until gas channeling.
The results of the WAG injection experiment for the row well pattern are shown in Figure 10. The final recovery factor for WAG injection in the row well pattern is 40.5%, which is 14.5% higher than that of single N2 flooding. During the three cycles of WAG injection, the gas-liquid ratio decreases significantly, while the recovery factor increases substantially. In the subsequent N2 flooding process, the gas-liquid ratio rises more slowly, and gas channeling does not occur again until 0.45 PV of N2 injection. This indicates that WAG injection following N2 flooding can further expand the swept volume and improve oil recovery.
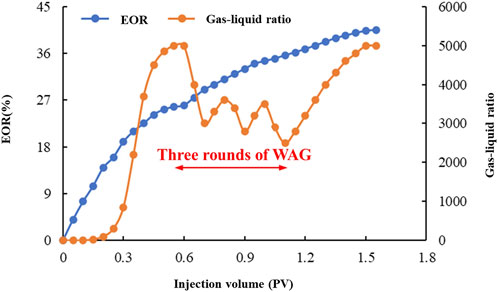
Figure 10. Results of the WAG injection experiment for the row well pattern.
3.2.2 Five-spot well pattern
The results of the WAG injection experiment for the five-spot horizontal well pattern are shown in Figures 11a–f. As in the previous experiments, WAG injection was preceded by continuous N2 flooding, consistent with the N2 flooding process for the five-spot horizontal well pattern. This section focuses on the WAG process following gas channeling. The results are shown in Figures 11e, f. During the three cycles of WAG injection, the oil saturation decreases significantly, and the gas channeling pathways are suppressed. However, due to pressure gradient differences, the oil saturation along the line connecting the two production wells remains higher than in other regions, while the oil saturation near the two injection wells is noticeably lower. Compared to single N2 flooding, this trend is significantly reduced, indicating a more uniform sweep. After WAG injection, secondary continuous gas flooding was conducted, further reducing the oil saturation and making the distribution relatively more uniform. This demonstrates that WAG injection in the five-spot well pattern can effectively suppress gas channeling, expand the swept volume, and improve oil recovery.
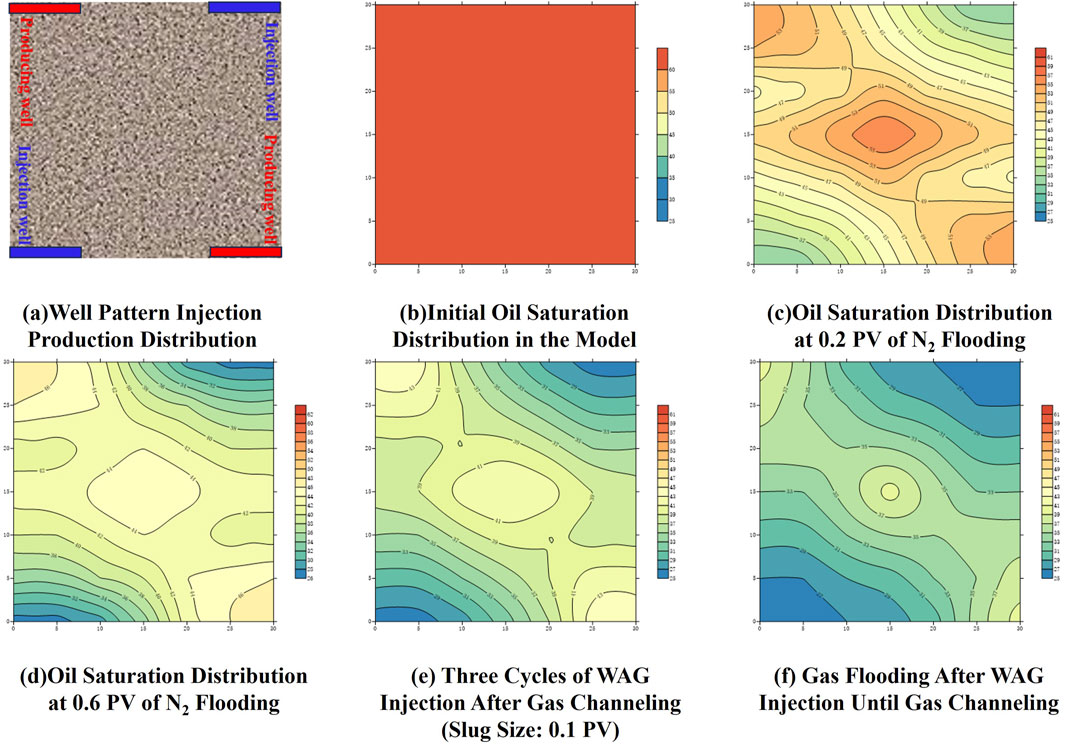
Figure 11. WAG injection process for the five-spot horizontal well pattern. (a) Well pattern injection production distribution (b) Initial oil saturation distribution in the model (c) Oil saturation distribution at 0.2 PV of N2 flooding (d) Oil saturation distribution at 0.6 PV of N2 flooding (e) Three cycles of WAG injection after gas channeling (Slug Size: 0.1 PV) (f) Gas flooding after WAG injection until gas channeling.
The results of the WAG injection experiment for the five-spot horizontal well pattern are shown in Figure 12. The final recovery factor for WAG injection in the five-spot horizontal well pattern is 43%, which is 16% higher than that of single N2 flooding. Compared to the row well pattern, the recovery factor is higher. Similarly, during the three cycles of WAG injection, the gas-liquid ratio decreases significantly, and the recovery factor shows a substantial increase. In the subsequent N2 flooding process, the gas-liquid ratio rises more slowly, and gas channeling does not occur again until 0.6 PV of N2 injection. This indicates that WAG injection in the five-spot horizontal well pattern can further expand the swept volume after N2 flooding, improving oil recovery.
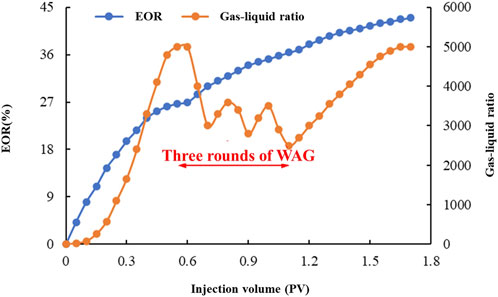
Figure 12. Results of the WAG injection experiment for the five-spot horizontal well pattern.
3.3 Water flooding and microsphere flooding experiments in the 3.3 mD core sample
3.3.1 Row well pattern
The nano-microsphere flooding process for the row well pattern is shown in Figures 13a–d. At the end of the initial water flooding when the water cut reaches 98%, the oil saturation distribution forms a “V” shape, indicating significant non-uniformity, as shown in Figure 13b. After injecting 0.4 PV of nano-microspheres, the oil saturation distribution not only decreases further but also shows a uniform stepwise distribution along the injection-production direction. Following secondary water flooding to a water cut of 98%, the oil saturation decreases further, and the uniform stepwise distribution along the injection-production direction is maintained. This indicates that nano-microspheres have a good capacity for controlling the swept volume and enhancing oil recovery.
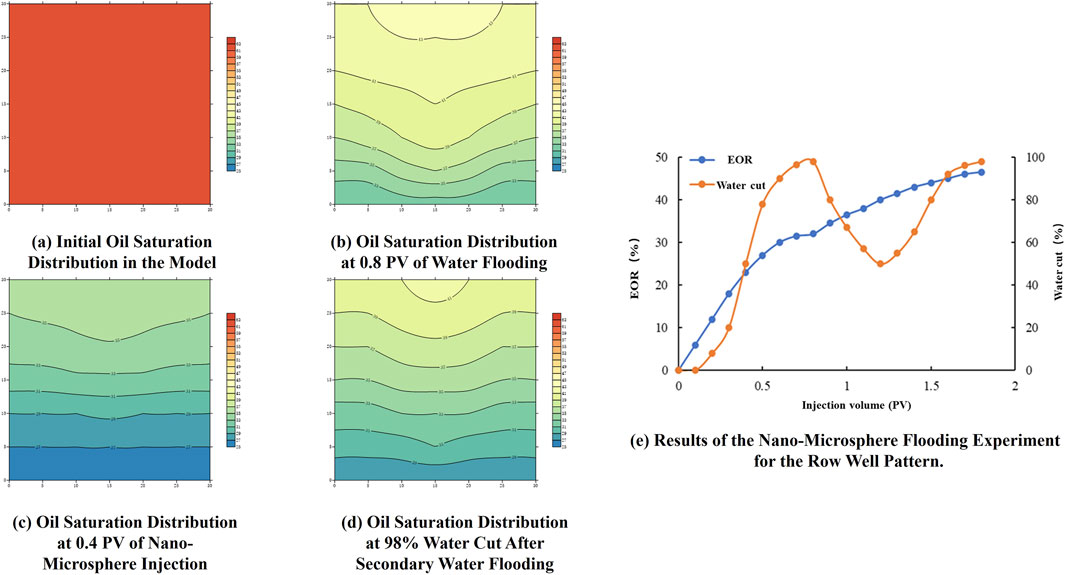
Figure 13. Nano-microsphere flooding process for the row well pattern. (a) Initial oil saturation distribution in the model (b) Oil saturation distribution at 0.8 PV of water flooding (c) Oil saturation distribution at 0.4 PV of nano-microsphere injection (d) Oil saturation distribution at 98% water cut after secondary water flooding (e) Results of the nano-microsphere flooding experiment for the row well pattern.
The results of the nano-microsphere flooding experiment for the row well pattern are shown in Figure 13e. The recovery factor for the initial water flooding is 32%, while the final recovery factor after nano-microsphere flooding reaches 46.5%, representing an increase of 14.5% compared to single water flooding. During the nano-microsphere injection process, the water cut decreases significantly, and the recovery factor increases substantially. In the subsequent water flooding process, the water cut gradually rises again, and water channeling occurs after 0.6 PV of water injection. This indicates that nano-microsphere flooding in the row well pattern can effectively expand the swept volume and improve oil recovery.
3.3.2 Five-spot well pattern
The nano-microsphere flooding process for the five-spot horizontal well pattern is shown in Figures 14a–d. At the end of the initial water flooding, when the water cut reaches 98%, the oil saturation along the line connecting the two production wells remains high due to pressure differences and flow field effects, indicating low utilization, as shown in Figure 14b. After injecting 0.4 PV of nano-microspheres, the overall oil saturation in the model decreases further, and the oil saturation in the production well connection area is significantly reduced. Following secondary water flooding to a water cut of 98%, the overall oil saturation decreases further and exhibits a more uniform stepwise distribution. This indicates that for the five-spot horizontal well pattern, nano-microspheres effectively regulate the swept volume and enhance oil recovery.
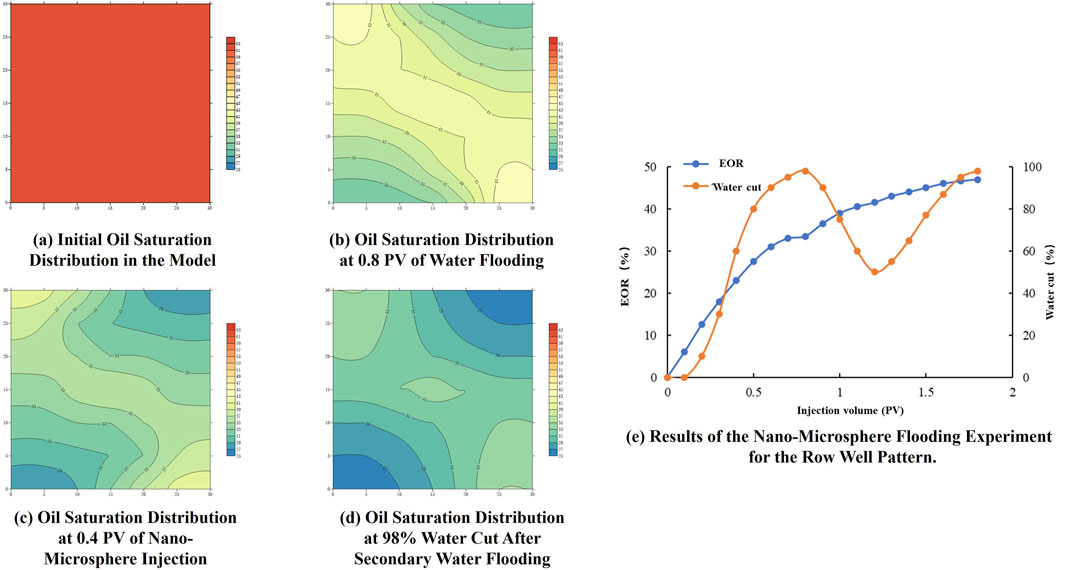
Figure 14. Nano-microsphere flooding process for the five-spot horizontal well pattern. (a) Initial oil saturation distribution in the model (b) Oil saturation distribution at 0.8 PV of water flooding (c) Oil saturation distribution at 0.4 PV of nano-microsphere injection (d) Oil saturation distribution at 98% water cut after secondary water flooding (e) Results of the nano-microsphere flooding experiment for the row well pattern.
The results of the nano-microsphere flooding experiment for the five-spot horizontal well pattern are shown in Figure 14e. The recovery factor for the initial water flooding is 33.5%, while the final recovery factor after nano-microsphere flooding reaches 47%, representing an increase of 13.5% compared to single water flooding. During the nano-microsphere injection process, the water cut decreases significantly, and the recovery factor increases substantially. In the subsequent water flooding process, the water cut begins to gradually increase, but the rate of increase is relatively slow. This indicates that nano-microsphere flooding in the five-spot horizontal well pattern can effectively expand the swept volume during water flooding.
4 Conclusion
This work systematically investigated the oil recovery performance of N2 flooding, WAG flooding, water flooding and nano-microsphere flooding using a large-scale 3D physical simulation model based on the characteristics of the Chang 8 tight oil reservoir in the Dadonggou area of the Ordos Basin. The key findings are as follows:
(1) For tight reservoirs with a permeability of 0.3 mD, N2 flooding in horizontal well networks achieved moderate recovery efficiencies. The final recovery factor for the row well pattern was 26%, while the five-spot well pattern reached 27%. However, significant residual oil remained after gas breakthrough, indicating the need for further EOR strategies.
(2) WAG injection significantly improved recovery by suppressing gas channeling and expanding the swept volume. WAG increased the recovery factor to 40.5% for the row well pattern and 43% for the five-spot well pattern, representing improvements of 14.5% and 16%, respectively.
(3) For reservoirs with higher permeability (3.3mD), water flooding combined with nano-microsphere injection demonstrated superior performance. Nano-microsphere injection effectively controlled the flow profile, reduced water channeling, and further improved recovery. The final recovery factors reached 46.5% for the row well pattern and 47% for the five-spot well pattern, representing improvements of 14.5% and 13.5% over single water flooding.
In summary, N2 flooding combined with WAG injection is suitable for low-permeability reservoirs, while nano-microsphere-assisted water flooding is highly effective in higher-permeability reservoirs. Future work will focus on further exploring the field-scale implementation of these findings and evaluating the long-term stability of nano-microsphere injection. Additionally, the combination of emerging EOR techniques, such as chemical or hybrid injection strategies, could be investigated to further optimize recovery in tight and complex reservoirs.
Data availability statement
The original contributions presented in the study are included in the article/supplementary material, further inquiries can be directed to the corresponding author.
Author contributions
FC: Software, Writing – original draft, Writing – review and editing. ZS: Conceptualization, Funding acquisition, Methodology, Project administration, Resources, Supervision, Writing – review and editing. JL: Validation, Writing – review and editing. ZY: Formal Analysis, Writing – review and editing. KL: Data curation, Writing – review and editing. FL: Investigation, Writing – review and editing. BL: Visualization, Writing – review and editing.
Funding
The author(s) declare that financial support was received for the research and/or publication of this article. This research was funded by Shaanxi Yanchang Petroleum (Group) Co., Ltd. selecting the best candidates to undertake key research projects, grant number ycsy2021jbgs-A-03.
Conflict of interest
Authors FC, ZS, JL, ZY, KL, FL and BL were employed by Research Institute of Shaanxi Yanchang Petroleum (Group) Co., Ltd.
The authors declare that this study received funding from Shaanxi Yanchang Petroleum (Group) Co., Ltd. The funder had the following involvement in the study: conceptualization, methodology, resources, supervision, project administration and funding acquisition.
Generative AI statement
The author(s) declare that no Generative AI was used in the creation of this manuscript.
Publisher’s note
All claims expressed in this article are solely those of the authors and do not necessarily represent those of their affiliated organizations, or those of the publisher, the editors and the reviewers. Any product that may be evaluated in this article, or claim that may be made by its manufacturer, is not guaranteed or endorsed by the publisher.
References
Chen, X., Li, X., Wu, P., Li, Y., Li, Y., Cheng, Y., et al. (2024). Pore-scale transport dynamic behavior of microspheres and their mechanisms for enhanced oil recovery. Energy & Fuels 38, 2803–2815. doi:10.1021/acs.energyfuels.3c03931
Chen, X., Li, Y., Liu, Z., Li, X., Zhang, J., and Zhang, H. (2020a). Core-and pore-scale investigation on the migration and plugging of polymer microspheres in a heterogeneous porous media. J. Petroleum Sci. Eng. 195, 107636. doi:10.1016/j.petrol.2020.107636
Chen, X., Li, Y., Liu, Z., Zhang, J., Chen, C., and Ma, M. (2020b). Investigation on matching relationship and plugging mechanism of self-adaptive micro-gel (SMG) as a profile control and oil displacement agent. Powder Technol. 364, 774–784. doi:10.1016/j.powtec.2020.02.027
Deng, X., Qiang, X., Si, R., Fang, Q., and Wang, W. (2023). Main controlling factors of imbibition oil recovery technology and field application inChang8 tight oil reservoirs in Honghe Oilfield. Unconv. Oil & Gas 10, 91–96+120. doi:10.19901/j.fcgyq.2023.05.12
Fang, F., He, S., Zhuang, J., Zhang, J., and Bian, Y. (2024). Large-scale physical simulation experiment of water invasion law for multi-well development in sandstone gas reservoirs with strong water drive. Appl. Sci. 14, 8067. doi:10.3390/app14178067
Han, B., Cui, G., Wang, Y., Zhang, J., Zhai, Z., Shi, Y., et al. (2021). Effect of fracture network on water injection huff-puff for volume stimulation horizontal wells in tight oil reservoir: field test and numerical simulation study. J. Petroleum Sci. Eng. 207, 109106. doi:10.1016/j.petrol.2021.109106
He, J., Sun, Y., Feng, X., and Tan, X. (2015). Preparation of uniform poly (Acrylamide-co-DVB) microspheres in a low toxicity solvent by dispersion polymerization. Aust. J. Chem. 68, 1276–1281. doi:10.1071/CH14670
Hu, W., Wei, Y., and Bao, J. (2018). Development of the theory and technology for low permeability reservoirs in China. Petroleum Explor. Dev. 45, 685–697. doi:10.1016/S1876-3804(18)30072-7
Kang, W., Zhou, B., Issakhov, M., and Gabdullin, M. (2022). Advances in enhanced oil recovery technologies for low permeability reservoirs. Petroleum Sci. 19, 1622–1640. doi:10.1016/j.petsci.2022.06.010
Li, G., Fu, M., Hu, J., Lu, S., and Meng, F. (2025). Study of thickened CO2 flooding for enhancing oil recovery in Low-Permeability sandstone reservoirs. Fuel 385, 134148. doi:10.1016/J.FUEL.2024.134148
Li, H., Li, Y., Chen, S., Guo, J., Wang, K., and Luo, H. (2016). Effects of chemical additives on dynamic capillary pressure during waterflooding in low permeability reservoirs, Energy fuels. 30, 7082–7093. doi:10.1021/acs.energyfuels.6b01272
Li, L., Su, Y., Hao, Y., Zhan, S., Lv, Y., Zhao, Q., et al. (2019). A comparative study of CO2 and N2 huff-n-puff EOR performance in shale oil production. J. Petroleum Sci. Eng. 181, 106174. doi:10.1016/j.petrol.2019.06.038
Lian, H., Zheng, X., and Li, C. (2023). Calculation model of water breakthrough time of reverse nine-point well patternin low permeability reservoir. Unconv. Oil & Gas 10, 67–78. doi:10.19901/j.fcgyq.2023.04.08
Lin, C., Li, W. L., Lei, J. C., and Li, R. B. (2013). The current situation and prospects of development of low permeability oil reservoir. Adv. Mater. Res. 734, 1286–1289. doi:10.4028/www.scientific.net/AMR.734-737.1286
Liu, J., Sheng, J. J., Wang, X., Ge, H., and Yao, E. (2019). Experimental study of wettability alteration and spontaneous imbibition in Chinese shale oil reservoirs using anionic and nonionic surfactants. J. Petroleum Sci. Eng. 175, 624–633. doi:10.1016/j.petrol.2019.01.003
Nchila, Y. T., Ogunkunle, F. T., Rachael, J. E., Olabode, O. A., and Dinga, C. N. (2022). “Gas condensate reservoir developmental techniques,” in Bioenergy and biochemical processing technologies: recent advances and future demands (Springer), 377–393.
Olabode, O., Dike, H., Olaniyan, D., Oni, B., and Faleye, M. (2024). Experimental investigation of the effect of surfactant–polymer flooding on enhanced oil recovery for medium crude oil. Polymers 16, 1674. doi:10.3390/polym16121674
Olabode, O., Isehunwa, S., Orodu, O., and Ake, D. (2021a). Optimizing productivity in oil rims: simulation studies on horizontal well placement under simultaneous oil and gas production. J. Petroleum Explor. Prod. 11, 385–397. doi:10.1007/s13202-020-01018-9
Olabode, O., Ojo, T., Oguntade, T., and Oduwole, D. (2020). Recovery potential of biopolymer (BP) formulation from Solanum tuberosum (waste) starch for enhancing recovery from oil reservoirs. Energy Rep. 6, 1448–1455. doi:10.1016/j.egyr.2020.05.027
Olabode, O., Pastor, A.-N., Charles, O., Christopher, N., and Seyi, O. (2021b). Optimizing productivity in oil rims: simulation studies on water and gas injection patterns. Arabian J. Geosciences 14, 1–20. doi:10.1007/s12517-021-06945-3
Olabode, O. A. (2020). Effect of water and gas injection schemes on synthetic oil rim models. J. Petroleum Explor. Prod. Technol. 10, 1343–1358. doi:10.1007/s13202-020-00850-3
Olabode, O. A., Orodu, O. D., Isehunwa, S. O., Mamudu, A., and Rotimi, T. (2018). Effect of foam and WAG (water alternating gas) injection on performance of thin oil rim reservoirs. J. Petroleum Sci. Eng. 171, 1443–1454. doi:10.1016/j.petrol.2018.07.043
Qu, G., Li, B., Liu, Y., Zhang, Z., Bo, L., Zhi, J., et al. (2024b). Preparation and performance evaluation of self-cementing nanoscale polymeric microspheres with salt and temperature tolerance. Molecules 29, 2596. doi:10.3390/molecules29112596
Qu, H., Shi, J., Wu, M., Zhou, F., Zhang, J., Peng, Y., et al. (2024a). Experimental study on the mechanism of enhanced imbibition with different types of surfactants in low-permeability glutenite reservoirs. Molecules 29, 5953. doi:10.3390/MOLECULES29245953
Sander, R., Pan, Z., and Connell, L. D. (2017). Laboratory measurement of low permeability unconventional gas reservoir rocks: a review of experimental methods. J. Nat. Gas Sci. Eng. 37, 248–279. doi:10.1016/j.jngse.2016.11.041
Sun, K., Liu, H., Wang, J., Wei, X., Ma, L., Kang, Z., et al. (2022). Three-dimensional physical simulation of water huff-n-puff in a tight oil reservoir with stimulated reservoir volume. J. Petroleum Sci. Eng. 208, 109212. doi:10.1016/j.petrol.2021.109212
Tang, R., Chen, L., Jiang, S., Wang, B., and Xie, X. (2024). Experimental study on the effect of enhanced CO2/water alternate flooding in low permeability reservoir. Unconv. Oil & Gas 11, 70–78. doi:10.19901/j.fcgyq.2024.04.08
Tang, X., Li, Y., Han, X., Zhou, Y., Zhan, J., Xu, M., et al. (2021). Dynamic characteristics and influencing factors of CO2 huff and puff in tight oil reservoirs. Petroleum Explor. Dev. 48, 946–955. doi:10.1016/S1876-3804(21)60079-4
Wang, L., Tian, Y., Yu, X., Wang, C., Yao, B., Wang, S., et al. (2017). Advances in improved/enhanced oil recovery technologies for tight and shale reservoirs. Fuel 210, 425–445. doi:10.1016/j.fuel.2017.08.095
Wang, X.-w., Xiao, P., Yang, Z., Liu, X., Xia, Z., and Wang, L. (2020). Laboratory and field-scale parameter optimization of CO2 huff–n–puff with the staged-fracturing horizontal well in tight oil reservoirs. J. Petroleum Sci. Eng. 186, 106703. doi:10.1016/j.petrol.2019.106703
Wei, P., Pu, W., Sun, L., Pu, Y., Wang, S., and Fang, Z. (2018). Oil recovery enhancement in low permeable and severe heterogeneous oil reservoirs via gas and foam flooding. J. Petroleum Sci. Eng. 163, 340–348. doi:10.1016/j.petrol.2018.01.011
Xu, N., Gu, T., Chen, Z., Guo, X., Guo, X., Jiang, M., et al. (2024). Relative permeability characteristic of nano-oil displacement agent and its effect on the development of shale oil. Unconv. Oil & Gas 11, 84–90. doi:10.19901/j.fcgyq.2024.03.10
Yang, H., Kang, W., Yin, X., Tang, X., Song, S., Lashari, Z. A., et al. (2017). Research on matching mechanism between polymer microspheres with different storage modulus and pore throats in the reservoir. Powder Technol. 313, 191–200. doi:10.1016/j.powtec.2017.03.023
Zhang, F., Hou, B., Wang, S., Chen, H., Yang, J., Fan, H., et al. (2023). Study on the profile control and oil displacement mechanism of a polymer nano-microsphere for oilfield. Energy & Fuels 37, 2692–2701. doi:10.1021/acs.energyfuels.2c03301
Keywords: tight oil reservoirs, nano-microsphere, horizontal well patterns, injectionproduction optimization, 3D physical model
Citation: Chen F, Shen Z, Li J, Yao Z, Liu K, Liu F and Li B (2025) Optimization of nano-microsphere flooding and injection-production for tight oil reservoirs based on the three-dimensional physical model. Front. Earth Sci. 13:1572001. doi: 10.3389/feart.2025.1572001
Received: 06 February 2025; Accepted: 08 May 2025;
Published: 21 May 2025.
Edited by:
Shruti Kanga, Central University of Punjab, IndiaReviewed by:
Imran Zahid, Government College University, Faisalabad, PakistanOluwasanmi Olabode, Covenant University, Nigeria
Copyright © 2025 Chen, Shen, Li, Yao, Liu, Liu and Li. This is an open-access article distributed under the terms of the Creative Commons Attribution License (CC BY). The use, distribution or reproduction in other forums is permitted, provided the original author(s) and the copyright owner(s) are credited and that the original publication in this journal is cited, in accordance with accepted academic practice. No use, distribution or reproduction is permitted which does not comply with these terms.
*Correspondence: Zhenzhen Shen, MjMyMTEwMTAwMDdAc3R1bWFpbC54c3l1LmVkdS5jbg==