 Jiangchun Hu
 Wenqing Zhou
- School of Intelligent Construction and Civil Engineering, Zhongyuan University of Technology, Zhengzhou, China
The dynamic evolution of effective stress and pore water pressure is a key scientific issue of study in the field of seepage-stress coupling in geotechnical engineering. To address the imbalance in effective stress redistribution caused by pore water pressure anomalies during water surges in underground engineering, the study employed numerical simulations to reveal the dynamic evolution of effective stress and pore water pressure within the sandstone matrix. The simulation was conducted by developing a coupled granular flow-permeability model in PFC6.0, which accounts for pore water pressure transfer. The model was calibrated through parameter inversion based on UCS experimental results, and a triaxial consolidation-relaxation test was designed using the model and calibrated parameters. The parameter calibration results indicate that the four key mesoscale parameters—tensile strength, cohesion, internal friction angle, and modulus of elasticity—obtained through inverse calibration, allow the numerical test results to deviate from the actual experimental results by only 1.3%. The numerical simulation results reveal the following findings: 1) The effective stress response of rocks under constant confining pressure conditions consistently shows peak strength characteristics. 2) A strong positive correlation exists between the confining pressure stress level and the peak effective stress. 3) The evolution of effective stress before the rock reaches peak stress follows a nonlinear pattern, initially decreasing and increasing, with the final value asymptotically approaching the level of peripheral confining pressure. The study’s findings on the dynamic evolution of effective stress and pore water pressure provide a crucial theoretical foundation for predicting water influx in deep tunnels and optimizing fracturing processes in shale gas reservoirs.
1 Introduction
The influence of groundwater on rock stability is a global concern, with issues such as earthquakes, karst formations, fault activity, and underground water surges frequently arising from these interactions (Laouafa, F. et al., 2021). Groundwater surges can cause significant damage and lead to underground engineering accidents, posing serious risks of injury and even fatalities. In the world, several coal mines across various areas have experienced water surge accidents, resulting in significant casualties and both direct and indirect economic losses. Water-rock interactions have been studied extensively, such as Duryagin et al. (2023) exploring the behavior of oil-saturated rocks under spontaneous water infiltration to understand the deeper relationship between water and rocks. Warning signs typically precede sudden water accidents, including the appearance of water droplets on the walls, sounds related to water pressure, and changes in seepage patterns (Fan et al., 2016). These signs suggest that water seepage along the rock walls is intensifying, indicative of rising pore water pressure within the rock (Huang and Li, 2014; Hashiba et al., 2019). As pore water pressure increases, the resulting decrease in effective stress creates an imbalance that can compromise the rock’s internal structure and lead to large-scale water surges. This paper focuses on the uneven distribution of effective stress and pore water pressure, along with the rapid pressure redistribution that can cause rock failure and subsequent water surges.
Effective stress is a fundamental concept in geotechnics and is crucial for addressing coupled soil-water stress analysis (Gudehus, 2021). It plays a vital role in geological assessment and optimizing resource extraction and mining safety, serving as a cornerstone for reservoir analysis and recovery efforts (Beeler et al., 2016; Heibrock et al., 2018; Zhu and Ma, 2018). Understanding the properties of effective stress and its fluctuations under varying conditions is critical for advancing underground engineering and energy reservoir development (Golovin and Baykin, 2016). Recent studies have highlighted its importance in resource extraction, particularly regarding its impact on permeability anisotropy (Li et al., 2023). Despite significant advancements, the understanding of effective stress remains in its foundational stages, especially concerning its application in underground construction. The distribution of effective stress and pore water pressure in rock poses unique challenges for engineers. The concept originated in the early 20th century, with Terzaghi and Peck (1948) emphasizing the role of pore water pressure in rock deformation and refining the theory of effective stress. Skempton (1961) later expanded upon Terzaghi’s work, applying these principles to soils, concrete, and rocks Recent research has furthered our understanding of effective stress through various models and simulations. For instance, researchers have developed permeability-dependent fluid-solid coupling models to explore how effective stress influences the permeability of fractured rocks under different pressure conditions (Sun et al., 2024; Wenrui and Peng, 2023). A three-phase model involving capillary water, pore air, and a generalized soil skeleton has also been proposed to enhance the understanding of effective stress in unsaturated soils (Zeng et al., 2024). Numerical simulations have proven valuable as well; Huang et al. (2024) investigated gas flow in rock fractures under varying effective stress, focusing on changes in fracture conditions. Similarly, (Huang et al., 2023). Examined effective stress parameters in unsaturated soils under rotationally induced compressive and shear forces. Previous studies have examined effective stress and its impact on rock permeability through modeling, laboratory tests, and numerical simulations. Researchers typically treat effective stress as an independent variable, adjusting or controlling it unidirectionally to observe its impact on the system (e.g., permeability, deformation). However, in this study, effective stress is considered part of a dynamic feedback loop within the system. Changes in pore pressure, for example, lead to the redistribution of effective stress, and these changes, in turn, trigger responses in other parameters that further influence effective stress.
In this paper, triaxial numerical experiments are conducted to investigate rock effective stress, and a coupled fluid-solid model is built using numerical software. In this model, effective stress is incorporated as a key component of the dynamic feedback system between pore water pressure and effective stress. Control variables are applied to analyze the changes in effective stress and examine the feedback mechanism. This approach seeks to explore the equilibrium of effective stress and pore water pressure distribution, offering insights for addressing underground water influx issues in construction.
2 Modeling theory and experimental materials
2.1 Modeling theory
The contact rule is central to particle flow modeling. Using the PFC linear contact model as a foundation, an adjustable, parameterized contact mechanism is developed between rock particles. This mechanism ensures that particles experience normal forces and bending moments while preventing overlap. The model manages inter-particle and particle-wall interactions through linear elements, which simulate tension-free friction, and damping elements, which represent viscous behavior. These two elements operate primarily within the localized areas of particle-particle or particle-wall contact points, transmitting forces exclusively through these contact points (Xu et al., 2010; Renzo and Maio, 2004). This paper employs the linear parallel bond model as the contact model (2D), which is mainly used for mutual contact between particles (non-rigid bodies). The following are the key formulas utilized in this study (Itasca Consulting GroupInc, 2021):
The linear parallel bond model’s force-displacement law continuously calculates the contact force and moment as shown in Equation 1.
where
The parallel-bond force is resolved into a normal and shear force, and the parallel-bond moment is resolved into a twisting and bending moment as shown in Equation 2:
where
The parallel-bond shear force and bending moment lie on the contact plane and are expressed in the contact plane coordinate system as shown in Equation 3.
The parallel-bond surface gap is defined as the cumulative relative normal displacement of the piece surfaces as shown in Equation 4:
where Δδn is the relative normal-displacement increment.
The force-displacement law for the parallel-bond force and moment consists of the following steps: Update the bond cross-sectional properties as shown in Equation 5:
where
Update
Update
Update
Update the maximum normal
Enforce the strength limits. If the tensile-strength limit is exceeded (
If the bond has not broken in tension, then enforce the shear-strength limit. The shear strength
If the bond has broken, then the bond_break callback event is triggered.
2.2 Sample materials
The experimental model was designed based on the physical properties of actual sandstone, which features an abundant pore and fissure structure. This characteristic makes it an ideal subject for observing particle changes and spatial movements, facilitating the study of microstructural alterations.
Considering that rocks of the same species can display structural or material differences when sourced from different regions, the test materials in this study were meticulously selected to enhance experimental reproducibility and facilitate future research. Similar rock materials were utilized to maintain consistency throughout the experiments. Similar materials are widely accessible and affordable, enabling proportional mixing to create specimens that are identical to one another. Their consistent properties increase the reliability of the study. If subsequent tests are performed, they can build on this foundation without the need to revisit previous research. Following the model testing conducted by Yang et al. (2021), this study chose a mortar specimen as the test material (Figure 1).

Figure 1. Material composition diagram. Samples consist of travertine, sand gesso and water.
The mortar was created using a mixture of lime, quartz sand, gypsum, and water in a ratio of 9:13:1:5. The resulting specimen had a diameter of 50 mm and a height of 100 mm. After fabrication, the specimens were kept under controlled temperature and humidity conditions for 28 days. The simulated object is sandstone, which features a complex pore structure that provides benefits for measuring effective stress. Quartz sand forms the primary skeleton of the simulated sandstone, with its particle size, shape, and sorting directly influencing the porosity and permeability of the specimen. Gypsum serves as a cementing agent, partially filling the pores between quartz sand particles, thereby simulating the effect of siliceous or calcareous cement in the natural sandstone. The lime reacts with water to form calcium carbonate, which not only strengthens the bonding between particles but also creates a microcrystalline structure that fills some of the pores. The combination of lime, quartz sand, and gypsum allows the simulated specimens to effectively support flow-coupling analysis by replicating the pore structure, cementation pattern, and chemical stability of natural sandstone.
3 Modeling and parameter calibration
3.1 Model building
The discrete element method (DEM) was selected for numerical simulations due to its suitability for studying effective stresses in rocks. This approach captures the physical properties and interactions of media particles, allowing for insights into the micromechanical behavior of rock materials. The contact force represents a local interaction between particles at the microscopic scale. In the discrete element simulation of PFC, the contact force vectors—comprising both normal and tangential components—can be directly monitored between neighboring particles. The local stress distribution is essentially a statistical average of microscopic contact forces on a macroscopic scale. Discrete contact forces can be transformed into a continuous stress field through volume averaging or Gaussian smoothing. The effective stress, on the other hand, is a macroscopic statistical quantity in the mechanics of porous media, which contains both the contribution of statistical averaging of contact forces and needs to be corrected by pore pressure to reflect the actual bearing state of the solid skeleton. This approach allows us to explore the control laws governing the mechanical behavior of the granular material from two perspectives: direct observation (microscopic contact forces) and indirect correlation (macroscopic stress and pore pressure).
This study research focuses on the variation of rock effective stress under different confining pressure loads. Numerical simulations were performed to observe effective stress changes in sandstone under various confining pressures using discrete element software (PFC). The modeling involved simulating a triaxial test and examining seepage behavior in the rock. By varying pore water pressure, the resulting changes in effective stress were analyzed to gain insights into its behavior under different conditions.
Key parameters such as density, porosity, cohesion, and internal friction angle (Φ) were selected based on empirical data from actual sandstone, and their optimal values were determined. Using the discrete element software PFC, a two-dimensional simulation specimen was created with a diameter and height of 100 mm, consisting of 6,320 particles ranging in size from 0.5 mm to 1 mm. The Random module was employed to avoid positional overlap among particles, ensuring that the particle distribution reflects the natural heterogeneity found in actual sandstone.
3.2 Servo system
Building on the aforementioned theory, the contact parameters of the PB model will be assigned to the disordered stacked particles. This approach aims to simulate the interaction forces within the rock’s internal structure. The introduction of contact parameters generates contact forces, as illustrated in Figure 2a. At this stage, the contact force is dissipated, as shown in Figure 2b. Following this, a parameter state check is conducted. The pb_state analysis indicates that the particle contact state is in State 3, which signifies that the contact remains intact and undamaged, as depicted in Figure 2c. The final step involves setting both the particle displacement and contact force to zero. This ensures that subsequent calculations of force and displacement are not influenced by the initial modeling and parameter assignment, as illustrated in Figure 2d.
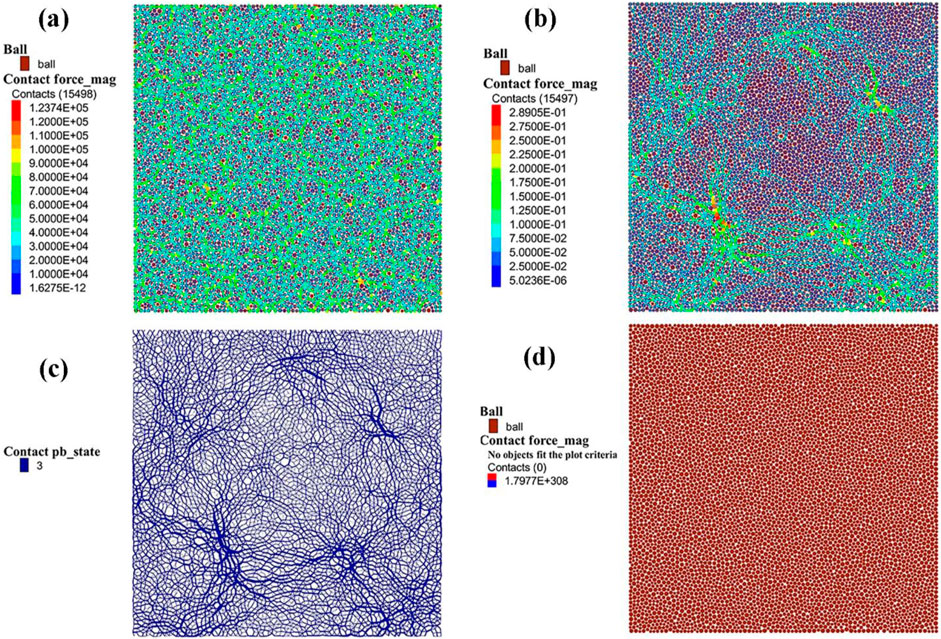
Figure 2. Contact interaction diagram (a)The force chain values in the figure are mainly distributed in the green value range, and it can be clearly seen that the green force chains are interconnected with each other. (b) The introduction of the parameter disperses the original force by deformation, and the green force chain in the figure becomes sparse. (c) The blue mesh connection represents an intact state of cementation. (d) Natural contact state of the force-free chain after displacement is returned to 0.
After the initial model creation and the assignment of contact parameters, the next step is to develop the servo system. The complete servo system facilitates the application of loads through the movement of the walls. The contact model between the wall (rigid body) and particles (non-rigid body) is a linear contact model that does not include bonding. Unlike complex particle-particle contact models that include bonding. Indirect pressure or displacement loads are applied to the particle system by adjusting the wall position or controlling the wall velocity, which is effective for simulating confining pressure.
The PFC servo system developed in this study consists of a three-step process. 1) Gain calculation: determining the servo gain parameters through the get_gain function to optimize the stress control accuracy. 2) Dynamic adjustment: The wall’s moving speed is adjusted in real-time based on feedback to maintain the target stress state. This process involves monitoring the difference between the boundary force and the target stress and then adjusting the wall speed accordingly. The key aspect of this step is the immediate feedback and control mechanism, which uses a numerical algorithm to maintain the individual forces balance. 3) Iterative convergence: This process involves iterative stress calculations and monitoring of the contact state, guiding the system to asymptotically approach the target stress. The core of this step is achieving global stress equilibrium. A numerical algorithm is used to iteratively eliminate residual stress differences, ultimately establishing a stable confining pressure environment.
3.3 Parameter calibration method
The discrete element software PFC allows for convenient monitoring of the contact states between particles. It also records particle forces and the overall force distribution within the specimen in real time, providing valuable data for analysis and model refinement. Numerical studies on the effective stress of rocks must carefully consider fine-scale parameter values to ensure the accuracy of the tests. Precise calibration of these parameters is essential for producing reliable and meaningful results. Most discrete element-based simulations use uniaxial compressive strength (UCS) as the fundamental mechanical test. Given its well-established simulation and calibration methods, UCS is chosen as the standard test in this laboratory study. Following the methodology of Yoon (2007) for sensitivity analysis of microscopic parameters related to the UCS test, the rock material is first subjected to mechanical testing. It is then simulated using PFC, and the results are compared to ensure the accuracy and validity of the simulation.
In the numerical experimental study, the parameter calibration test follows the same procedure as the UCS test. The calibration focuses on four key parameters that have the most significant impact on the model’s outcomes: tensile strength (pb_ten), bonding force (pb_coh), internal friction angle (pb_fa), and modulus of elasticity (pb_emod). Continuous testing has shown that these parameters greatly influence the final results, while the effect of other parameters in the UCS test is minimal. Calibration was conducted using the trial-and-error method typically employed in particle flow modeling. This approach involved continuously adjusting the four key parameters until the test results matched the actual values. The PFC2D was chosen for the calibration to simulate uniaxial compressive testing of rocks, and Table 1 shows the fine-scale parameters of the above commissioning. Figure 3 presents the results of the parameter sensitivity analysis. The analysis is conducted by using the calibrated data as the base, applying a fixed 1% fluctuation (both upward and downward) to the parameter values, and observing the resulting changes in peak stress to assess the sensitivity of these parameters. Table 1 is a summary table of the sensitivities of the corresponding parameters.
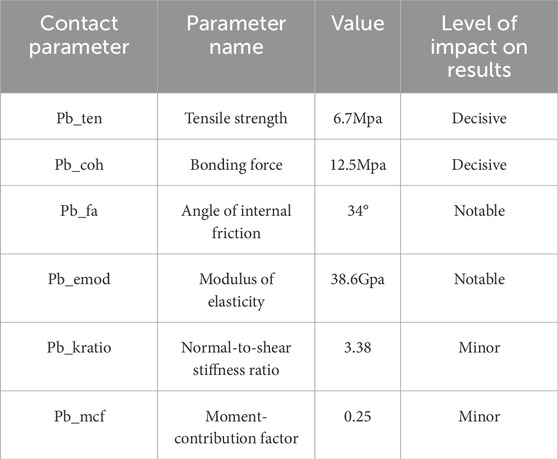
Table 1. Main meso-parameters of the bond model.
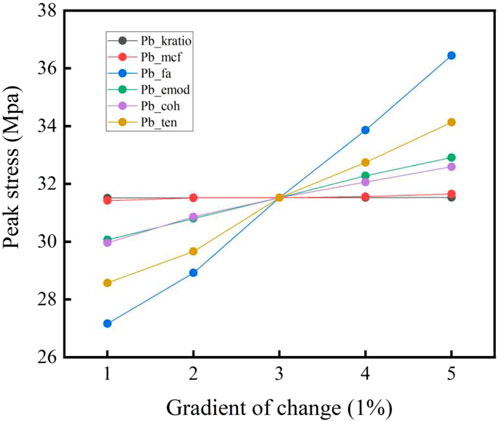
Figure 3. Parameter sensitivity analysis. The images demonstrate the sensitivity of the six tuning parameters to the peak stress. Scale 3 is the initial standard parameter. The four scales before and after this scale are for 1% and 2% fluctuations up and down, respectively.
3.4 Parameter calibration results
A laboratory UCS test is performed before calibration to determine the compressive strength of the specimen. After obtaining the stress-strain curves, the parameters of the numerically simulated specimens are calibrated to align the simulated data with the actual data. By continuously adjusting the parameters and comparing them with the results of laboratory uniaxial compressive tests, the values that best aligned with the actual experimental data were determined through iterative trial and error. This step was undertaken to confirm that these parameters apply not only to uniaxial compression tests but also to all rock numerical simulations, utilizing test results alongside conventional reference values from mechanical tests. Table 2 presents a comparison of the parameter calibration data.
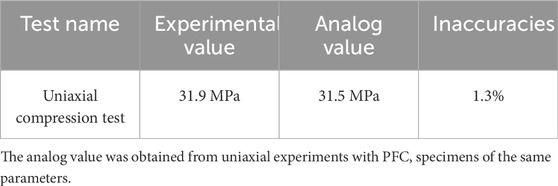
Table 2. Comparison of uniaxial compression tests.
Meanwhile, the actual experimental specimens and the numerically simulated specimens exhibit similar structural damage (Figure 4), which partially confirms the accuracy of the parameter calibration results. Figure 4 presents the uniaxial compression experimental fracturing results on the left and the numerical simulation results on the right. Both exhibit a high degree of similarity in fracture morphology and distribution.
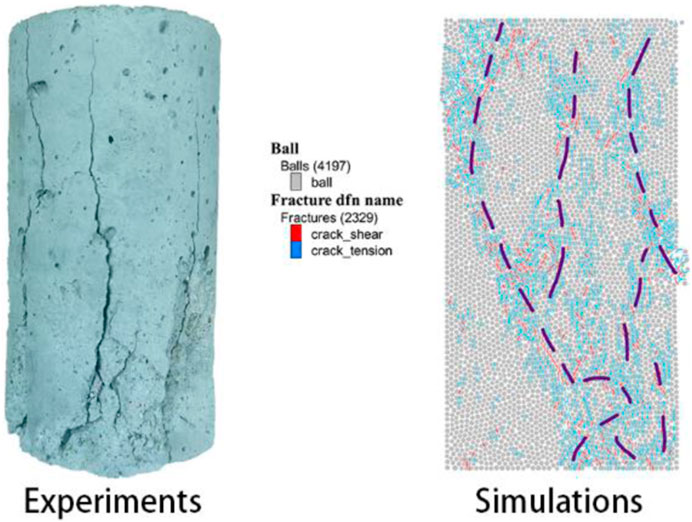
Figure 4. Comparison of UCS results. A high degree of similarity between actual experiments and numerical simulation results is demonstrated.
The modulus of elasticity obtained from the numerical experiment is compared with its calibrated value to verify the numerical experiment. The simulation test data must fall within an acceptable error range relative to the actual data to ensure that the final numerical model accurately represents the macroscopic mechanical properties of sandstone. Figure 5 illustrates the comparison of the uniaxial compressive test (UCS) results.
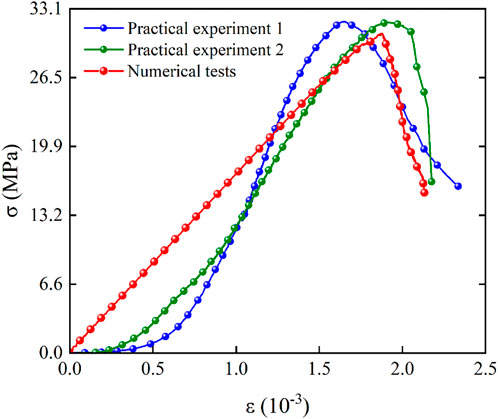
Figure 5. Stress-strain diagram. The two sets of experimental results in Figure 5 closely match the numerical simulation results, suggesting that the model parameters are well calibrated.
The error between the experimental and simulation results, as shown in the figure, occurs because the material is assumed to be a uniform continuum. This assumption stems from the conventional intrinsic model, which is based on the principles of continuum mechanics. However, at small strain stages, the microscopic responses of the material—such as inter-particle sliding, rotation, and reconfiguration of contact force chains—may not be fully captured. PFC simulations explicitly capture these discrete properties, whereas continuous models may introduce bias due to oversimplification. Many constitutive models assume linear elastic behavior at small strains, while real soil or granular materials often display nonlinear elasticity—such as stress-dependent contact stiffness—or initial anisotropy. Neglecting these nonlinearities at the small strain stage can result in biased predictions of the stress-strain curve. Errors can also arise from experimental measurement inaccuracies, variations in boundary conditions, and the inherent limitations of the discrete element method. However, this error is stored in the base parameter calibration model and is corrected in the model contact setup for subsequent simulations.
4 Numerical simulation of effective stress
4.1 Environmental parameter setting
The triaxial compression consolidation undrained test simulated in this experiment focuses on monitoring the rock’s pore water pressure. Table 3 shows the experimental parameter settings.
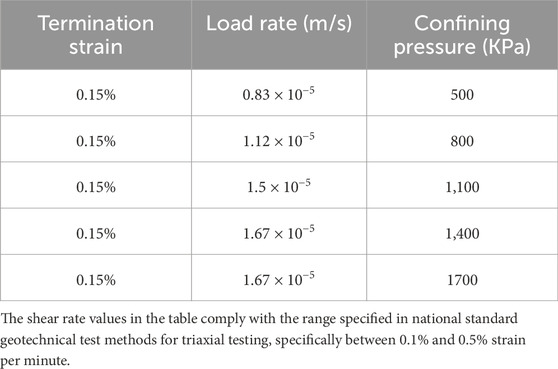
Table 3. Parameter settings for numerical experiments.
During the test, the shear rate should be maintained between 0.5% and 1% per minute to ensure adequate variation in pore water pressure under slow shear conditions. Three different confining pressure values within the rock’s pressure range were selected to investigate how variations in shear rate and confining pressure affect pore water pressure and effective stress. It is worth noting that the contact model parameters do not change when the peripheral pressure and shear rate change, but the contact force, displacement, and porosity do, and the specific changes are analyzed in the following content.
4.2 Effect of loading rate on pore water pressure
Using the test parameters from Table 1, data from each test group were obtained and processed, resulting in the pore water pressure outcomes displayed in Figure 6. The time step length shown in the figure corresponds to the duration of the test and aligns with its termination conditions. Analysis of the figure indicates that variations in shear rate do not affect the minimum effective stress when the confining pressure remains constant. However, the time required to reach the minimum effective stress is affected. A faster shear rate shortens the time needed to reach this minimum, with step size corresponding to strain. The time step represents the duration required to reach the target strain. It is not predefined; instead, it adjusts automatically based on the time needed to complete the experiment.
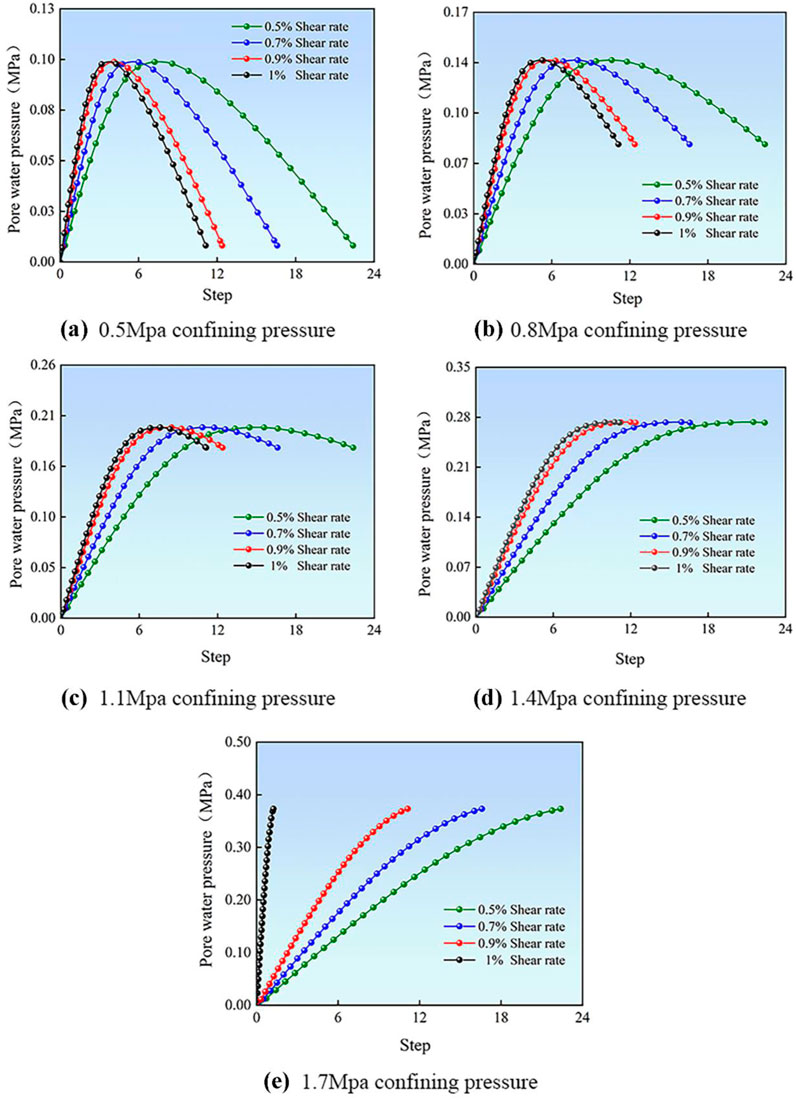
Figure 6. Experimental data across varying loading rates. (a) Effect of different loading rates on pore water pressure under 0.5 MPa confining pressure. (b) Effect of different loading rates on pore water pressure under 0.8 MPa confining pressure. (c) Effect of different loading rates on pore water pressure under 1.1 MPa confining pressure. (d) Effect of different loading rates on pore water pressure under 1.4 MPa confining pressure. (e) Effect of different loading rates on pore water pressure under1.7 MPa confining pressure.
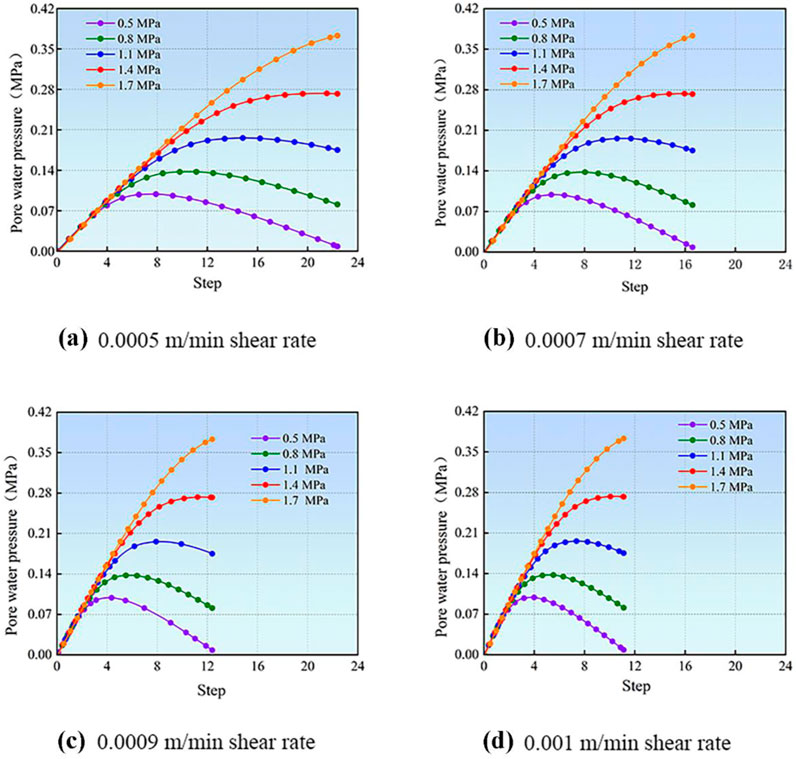
Figure 7. Experimental data across varying confining pressures. (a) Effect of different confining pressures on pore water pressure at 0.0005 m/min loading rate. (b) Effect of different confining pressures on pore water pressure at 0.0007 m/min loading rate. (c)Effect of different confining pressures on pore water pressure at 0.0009 m/min loading rate. (d)Effect of different confining pressures on pore water pressure at 0.001 m/min loading rate.
When the pore water pressure reaches its maximum value, the rate of change is related to the shear rate. Specifically, a higher shear rate corresponds to a more rapid decrease in pore water pressure from its maximum value. The maximum value of pore water pressure always depends on the confining pressure. The greater the confining pressure, the higher the maximum value of pore water pressure.
As the confining pressure increases while the total strain remains constant, the effective stress may gradually fail to reach its peak, resulting in the slope of the effective stress curve becoming zero. It can be inferred that, under constant total strain, the effective stress variation curve may gradually approach a straight line as confining pressure increases.
4.3 Effect of confining pressure on pore water pressure
The results above are all from the same pressure and different shear rates. Figure 7 shows the data obtained for the same shear rate and different pressure criteria.
From the figure, it is evident that under the same shear rate, different confining pressures primarily influence the minimum value of effective stress. Specifically, higher confining pressure leads to a higher peak in pore water pressure, causing the rock’s effective stress to reach its minimum value. The pore water pressure also tends to increase linearly with increasing confining pressure. His growth curve exhibits a relatively straightforward primary functional relationship within the range of envelope pressures examined in this study.
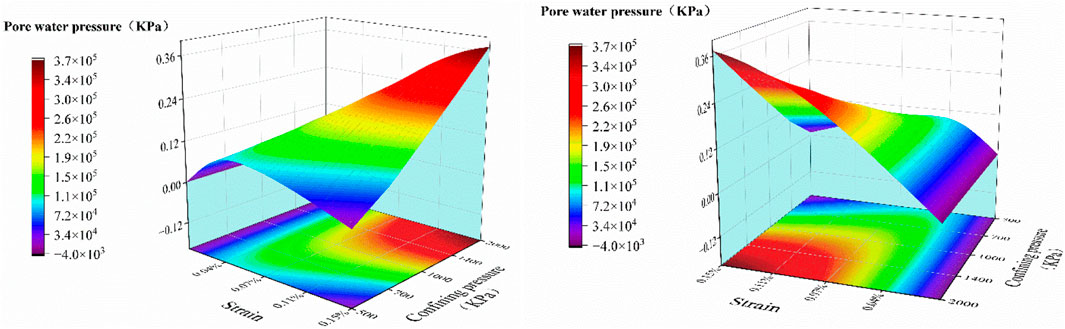
Figure 8. Strain-Confining pressure-Pore water pressure coupled surface map. Consider the variation surface of the three coupled confining pressure, loading rate and pore water pressure. X-axis is the strain. Y-axis is the perimeter pressure. Z-axis is the pore water pressure.
At the same shear rate, the changes in confining stress within the rock at different confining pressures coincide until they reach a peak value. It shows that the effect of loading the confining pressure on the rock pore water pressure is consistent until the rock structure is not destroyed. This effect occurs mainly in the period before the effective stress peaks. The changes produced by the different confining pressures are all essentially similar, the process is essentially the same, the differences mostly exist in the numerical values, and the process is the same.
Increased confining pressure and loading rate alter the particle contact force network through boundary loading. Higher peripheral pressure increases the contact force between particles, causing rearrangement that results in a denser structure and a reduction in pore volume. On the other hand, high loading rates delay particle adjustments, leading to localized stress concentrations and uneven pore structure. Pour water pressure variations are influenced by the interaction between fluid flow and the deformation of the particle skeleton. Increased confining pressure compresses the pore space, reducing the permeability coefficient and hindering water migration. Meanwhile, a faster loading rate shortens drainage time, exacerbating the accumulation of pore water pressure. As the particle arrangement tightens, permeability decreases, creating a positive feedback loop: increased pore water pressure leads to a reduction in effective stress, making particles more easily compressed and further decreasing permeability. This behavior is consistent with previous studies on the same characteristic, such as those by Bai et al. (2024), Bai et al. (2020). The characteristic curve shows a steeper slope with higher peak pressure (indicating a significant time effect) as the loading rate increases, while the perimeter pressure remains fixed. At a fixed loading rate, an increase in perimeter pressure results in an upward shift of the curve and a rise in steady-state pore water pressure, primarily driven by pore compression effects.
4.4 Macro integrative analysis
Based on the above results, it is evident that effective stresses respond to both the loading rate and confining pressure to varying degrees. Therefore, in this study, the relationship between pore water pressure, strain, and envelope pressure was analyzed comprehensively and their previous nonlinear relationship was fitted as shown in Figure 8. The analysis based on the results suggests that this is related to the double effective stress, which is very significant. Intrinsic deformation and structural deformation occurred in the specimen. The structural deformation resulted in denser particles inside the specimen, which usually occurred at the place where the contact stress was most intensive. Under the action of dual effective stresses, as the specimen body deformed, the structure also deformed accordingly, resulting in the pore water pressure first increasing and then decreasing. Pore volume changes are caused by changes in particle arrangement.
Under the loading of the confining pressure, a certain degree of structural damage occurs in the specimen. The destruction of the main skeleton of the specimen leads to a significant change in the effective stress. The stresses borne by the particle skeleton of the specimen will be partially released during the damage process, and the corresponding pore water pressure will decrease after reaching the peak value. It is demonstrated that the decrease in pore water pressure after reaching the peak value is not perfectly symmetrical with the initial increase during loading. The 3D surface in Figure 8 illustrates that the image gradually develops into a cone shape as the confining pressure increases.
5 Multifaceted analysis based on PFC
5.1 Physical fields analysis
Another advantage of numerical simulation of effective stresses over traditional tests is that changes in microstructure before and after the test can be observed more clearly and easily. Additionally, post-processing of experimental results using Python facilitates more convenient microstructural characterization.
The most influential factor in this experiment is porosity. Typically, porosity for a specific type of rock is represented as an average value. However, it is challenging to observe porosity and its distribution at specific locations within the rock mass. The advantage of the PFC2D model lies in its ability to flatten the 3D structure, allowing for clearer observation of porosity distribution. In this study, post-processing utilized Python to grid a model of more than 6,000 particles, calculating and summarizing the porosity for each grid to create a porosity cloud (Figure 9) This clearly shows that porosity decreases before and after the application of confining pressure. The skeleton particles are displaced to varying degrees, compressing the internal space and increasing particle contact. The pore water pressure before and after particle displacement exhibits a parabolic shape, which corresponds to a decrease in effective stress followed by an increase.
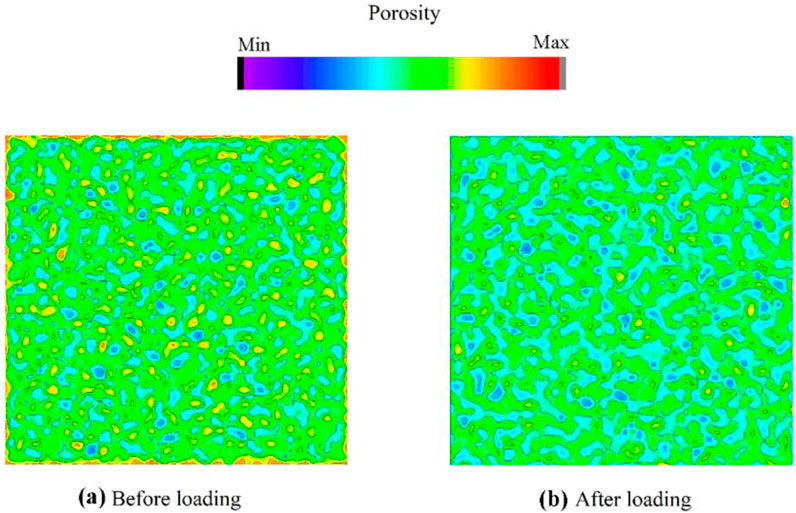
Figure 9. Pore cloud map. The cloud view illustrates changes in pore water pressure before and after loading, with the pre-loading image as (a) and the post-loading image as (b).
Vector analysis of the force chain is then conducted. Using Python, the directional components of each force chain are parsed, allowing for the determination of their magnitude and direction. This analysis enables the plotting of a fitness analysis of the force chain, as illustrated in Figure 10. The force chain before loading displays an irregular distribution due to the random generation of particles and free contact. In contrast, the loaded rock model exhibits a regular distribution of the force chain, influenced by the confining pressure. The boundary of the enclosing action experiences the greatest force, which is transmitted to the center, the point farthest from the boundary. This supports the general rule that the direction of effective stress transfer is from the boundary toward the center.
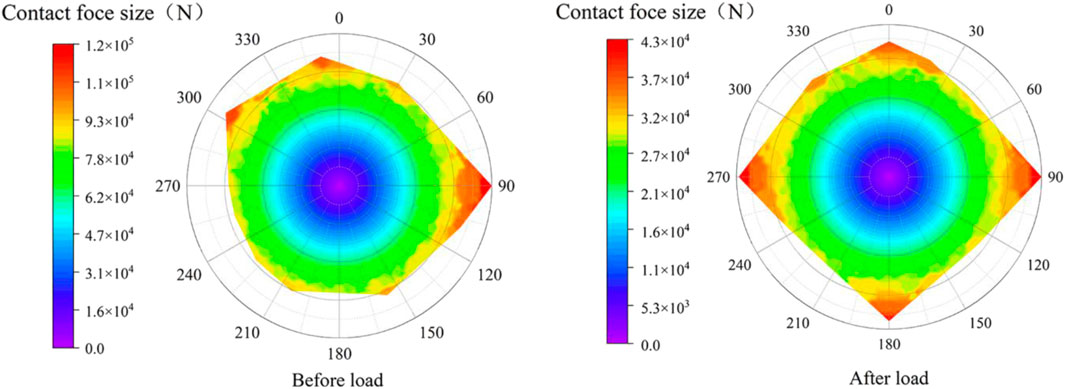
Figure 10. Contact force polar plot. The picture shows the force chain vector cloud before and after loading, the direction is 0° direction horizontally to the right with the specimen proper center as the origin. (a) is the force chain vector cloud before loading, (b) is the force chain vector cloud after loading.
Finally, displacement analysis was conducted using the same method, along with displacement images from the actual model (Figure 11, where the top shows the magnitude and direction of the displacement, and the bottom displays actual model displacement monitoring. The vector cloud map is oriented at 0° horizontally, directed to the right from the center of the model.). The application of confining pressure in this model maximizes the displacement at the boundary corners, while displacements further from the boundary corners are minimized. The displacement direction reflects the direction indicated by the resultant of the vectors associated with the different confining pressure directions. By analyzing the displacement images of the particles, the direction of displacement and the specific expansion trend of the rock skeleton under confining pressure can be clearly understood. The response mechanism of effective stress during this process indicates that effective stress increases whenever a displacement occurs in the same direction as the confining pressure.
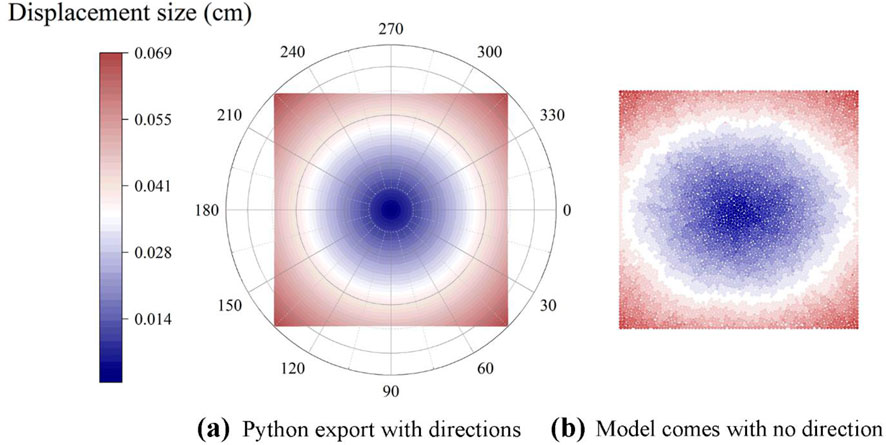
Figure 11. Displacement polar plot. The picture shows the displacement vector cloud after python processing after loading compared with the displacement scalar map that comes with the software, the direction is the 0° direction with the specimen proper center as the origin and horizontally to the right. (a) is the displacement vector cloud after python processing, (b) is the displacement scalar cloud of the software.
5.2 Effective stress analysis based on physical fields
In summary, the spatial structure, force, and displacement are analyzed as a triple-resultant coupling to understand their impact on effective stresses.
At lower loading rates, no structural damage to the rock was observed. The simulated triaxial compression consolidation without drainage was conducted at controlled loading rates ranging from 0.00001 m/s to 0.0001 m/s. Within this range, the displacement, force chain, and pore structure of the particles showed no abnormal variations, all exhibiting regular changes under the influence of confining pressure. At low loading rates, the effective stress characteristic curve of the rock model decreases nonlinearly before stabilizing at a specific value, which is determined by the magnitude of the confining pressure. This process is accompanied by changes in the pore structure, force transmission direction, and the directional displacement of the particles.
Changes in effective stresses are strongly influenced by mechanical parameters at low confining pressures and less so at higher confining pressures. The fluctuations caused by specific mechanical parameters remain constant, significantly impacting the results at low confining pressures, but becoming less prominent as confining pressure increases. This diminished effect at higher pressures is consistent with the findings of Mian et al. (2000), who noted that fracture toughness plays a more significant role in fracture behavior under lower confining pressures and a smaller role under higher confining pressures.
Under high confining pressure, the rock’s effective stress decreases over time. Structural damage to the rock leads to a sharp decline in effective stress, altering the stress state in different locations within the rock. This, in turn, affects the kinematic behavior of the entire rock system or layer. The influence of fluid-solid coupling should be considered when studying and predicting rock stability and kinematic behavior.
The numerical value of the rock’s effective stress gradually converges to a constant as peripheral pressure increases. Higher confining pressure leads to a decrease in effective stress and an increase in pore water pressure. The impact of structural damage on effective stress under larger changes in peripheral pressure varies, influencing the final effective stress to different degrees. As peripheral pressure rises, changes in effective stress become smoother or nearly linear.
As the confining pressure continues to increase, the graph approaches a diagonal line with a slope (K value) of 1, passing through the origin. The increase in confining pressure causes greater deformation in the rock, reducing the distance between particles. This decrease in porosity, coupled with the rise in pore water pressure, further affects the effective stress. When the confining pressure reaches a critical threshold, the rock’s pores begin to close, reducing the influence of pore water pressure. At this point, the rate of change in effective stress stabilizes. As confining pressure continues to rise, the rock’s porosity decreases further, and the effective stress stabilizes, exhibiting a more linear trend.
6 Conclusion
In this study, a numerical coupled hydraulic model was developed using the inverse calibration method to determine the appropriate values for microscopic parameters, including tensile strength, cohesion, angle of internal friction, and modulus of elasticity. The model’s pore cloud maps, displacements, and polar plots of contact forces were generated using the built-in Python tools of the discrete element software. These outputs were used to analyze the dynamic evolution of pore water pressure in conjunction with the redistribution of effective stress. A detailed analysis of pore water pressure under experimental conditions, controlled by confining pressure and loading rate, shows that the effective stress response of the specimens under constant confining pressure consistently exhibits peak intensity characteristics when the loading rate is within the quasi-static range. A strong positive correlation exists between the confining pressure stress level and the peak effective stress. During the pre-peak stage, when the structural integrity of the samples remains intact, the effective stress evolution follows a nonlinear pattern of decreasing and then increasing, with the final value asymptotically converging to the peripheral confining pressure level.
Data availability statement
The raw data supporting the conclusions of this article will be made available by the authors, without undue reservation.
Author contributions
JH: Conceptualization, Writing – original draft, Writing – review and editing. WZ: Writing – original draft, Writing – review and editing, Data curation, Formal Analysis. ZR: Data curation, Investigation, Writing – review and editing. ML: Data curation, Investigation, Writing – review and editing. BL: Formal Analysis, Methodology, Writing – review and editing.
Funding
The author(s) declare that financial support was received for the research and/or publication of this article. This research was supported by the National Natural Science Foundation of China (51574296).
Conflict of interest
The authors declare that the research was conducted in the absence of any commercial or financial relationships that could be construed as a potential conflict of interest.
Generative AI statement
The author(s) declare that no Gen AI was used in the creation of this manuscript.
Publisher’s note
All claims expressed in this article are solely those of the authors and do not necessarily represent those of their affiliated organizations, or those of the publisher, the editors and the reviewers. Any product that may be evaluated in this article, or claim that may be made by its manufacturer, is not guaranteed or endorsed by the publisher.
References
Bai, B., Chen, J., Bai, F., Nie, Q., and Jia, X. (2024). Corrosion effect of acid/alkali on cementitious red mud-fly ash materials containing heavy metal residues. Environ. Technol. and Innovation 33, 103485. doi:10.1016/j.eti.2023.103485
Bai, B., Xu, T., Nie, Q., and Li, P. (2020). Temperature-driven migration of heavy metal pb2+ along with moisture movement in unsaturated soils. Int. J. Heat Mass Transf. 153, 119573. doi:10.1016/j.ijheatmasstransfer.2020.119573
Beeler, N. M., Hirth, G., Thomas, A., and Bürgmann, R. (2016). Effective stress, friction, and deep crustal faulting. J. Geophys. Res. Solid Earth. 121, 1040–1059. doi:10.1002/2015JB012115
Duryagin, V., Nguyen Van, T., Onegov, N., and Shamsutdinova, G. (2023). Investigation of the selectivity of the water shutoff Technology. Energies 16, 366. doi:10.3390/en16010366
Fan, Y., Lu, W. B., Zhou, Y. H., Yan, P., Leng, Z. D., and Chen, M. (2016). Influence of tunneling methods on the strainburst characteristics during the excavation of deep rock masses. Eng. Geol. 201, 85–95. doi:10.1016/j.enggeo.2015.12.015
Golovin, S. V., and Baykin, A. N. (2016). Influence of pore pressure on the development of a hydraulic fracture in poroelastic medium. Int. J. Rock Mech. Min. 108, 198–208. doi:10.1016/j.ijrmms.2018.04.055
Gudehus, G. (2021). Implications of the principle of effective stress. Acta Geotech. 16, 1939–1947. doi:10.1007/s11440-020-01068-7
Hashiba, K., Fukui, K., and Kataoka, M. (2019). Effects of water saturation on the strength and loading-rate dependence of andesite. Int. J. Rock Mech. Min. 117, 142–149. doi:10.1016/j.ijrmms.2019.03.023
Heibrock, G., König, D., Datcheva, M., Pourzargar, A., Alabdullah, J., and Schanz, T. (2018). Prediction of effective stress in partially saturated sand kaolin mixtures. Geomech. Energy. Envir 15, 85–94. doi:10.1016/j.gete.2018.06.001
Huang, D., and Li, Y. (2014). Conversion of strain energy in triaxial unloading tests on marble. Int. J. Rock Mech. Min. 66, 160–168. doi:10.1016/j.ijrmms.2013.12.001
Huang, T., Zhai, C., Liu, T., Xu, J., Sun, Y., Tang, W., et al. (2024). A numerical study of nonlinear gas flow in shale anisotropic fracture under effective stress. Energ. Fuel. 38 (9), 7826–7839. doi:10.1021/acs.energyfuels.3c04914
Huang, X., Ren, T., and Horn, R. (2023). Effective stress and shear strength parameters of unsaturated soils as affected by compaction and subsequent shearing. Eur. J. Soil Sci. 74 (3). doi:10.1111/ejss.13384
Itasca Consulting Group, Inc (2021). PFC user’s guide. Available online at: https://docs.itascacg.com/pfc600/pfc/docproject/index.html.
Laouafa, F., Guo, J., and Quintard, M. (2021). Underground rock dissolution and geomechanical issues. Rock Mech. Rock Eng. 54, 3423–3445. doi:10.1007/s00603-020-02320-y
Li, R., Zhang, L., Han, Z., Zhou, J., Wang, S., and Schuettrumpf, H. (2023). Effect of interlayer mixed zone and effective stress on permeability anisotropy of NGH turbidite reservoir. Energy 284, 129172. doi:10.1016/j.energy.2023.129172
Mian, C., Fei, P., and Yan, J. (2000). Experiments and analysis on hydraulic fracturing by a large-size triaxial simulator. Chin. J. Rock Mech. Eng. 5 (z1). doi:10.3321/j.issn:1000-6915.2000.z1.010
Renzo, A. D., and Maio, F. P. D. (2004). Comparison of contact-force models for the simulation of collisions in dem-based granular flow codes. Chem. Eng. Sci. 59 (3), 525–541. doi:10.1016/j.ces.2003.09.037
Skempton, A. W. (1961). Effective stress in soils, concrete and rocks. Sel. Pap. Soil Mech., 106–118. doi:10.1680/sposm.02050.0014
Sun, K., Liu, H., Leung, J. Y., Wang, J., Feng, Y., Liu, R., et al. (2024). Impact of effective stress on permeability for carbonate fractured-vuggy rocks. J. Rock Mech. Geotech. 16 (3), 942–960. doi:10.1016/j.jrmge.2023.04.007
Terzaghi, K., and Peck, R. B. (1948). Soil mechanics in engineering practice. doi:10.1016/S0013-7952(97)81919-9
Wenrui, L., and Peng, L. (2023). Novel shale permeability model considering the internal dependencies of effective stress, gas sorption, and flow-regime effects, gas sorption, and flow-regime effects. Energ. Fuel. 37 (8), 5777–5791. doi:10.1021/acs.energyfuels.2c04149
Xu, X. M., Ling, D. S., Chen, Y. M., and Huang, B. (2010). Correlation of microscopic and macroscopic elastic constants of granular materials based on linear contact model. Chin. J. Geotechnical Eng. 32 (7), 991–998. doi:10.3788/HPLPB20102208.1935
Yang, M., Yang, Y., and Zhao, B. (2021). Study on the proportion of conglomerate similar materials based on the orthogonal test. Shock. Vib. 47 (3). doi:10.1155/2021/6657323
Yoon, J. (2007). Application of experimental design and optimization to pfc model calibration in uniaxial compression simulation. Int. J. Rock. Mech. Min. 44 (6), 871–889. doi:10.1016/j.ijrmms.2007.01.004
Zeng, L., Shao, L., Guo, X., and Niu, G. (2024). Physical meaning and mechanical effects of the neutral stress and effective stress in unsaturated soils. Acta Geotech. 19 (7), 4343–4366. doi:10.1007/s11440-023-02127-5
Keywords: rock mechanics, effective stress, numerical simulation, stress analysis, pore water pressure, PFC 2D
Citation: Hu J, Zhou W, Ren Z, Liu M and Liu B (2025) Numerical simulation of the dynamic evolution of effective stress and pore water pressure within a rock matrix. Front. Earth Sci. 13:1572441. doi: 10.3389/feart.2025.1572441
Received: 07 February 2025; Accepted: 17 April 2025;
Published: 06 May 2025.
Edited by:
Qibin Lin, University of South China, ChinaReviewed by:
Bing Bai, Beijing Jiaotong University, ChinaWeiqi Wang, Wuhan University of Science and Technology, China
Copyright © 2025 Hu, Zhou, Ren, Liu and Liu. This is an open-access article distributed under the terms of the Creative Commons Attribution License (CC BY). The use, distribution or reproduction in other forums is permitted, provided the original author(s) and the copyright owner(s) are credited and that the original publication in this journal is cited, in accordance with accepted academic practice. No use, distribution or reproduction is permitted which does not comply with these terms.
*Correspondence: WenQing Zhou, emhvdXdlbnFpbmdAenV0LmVkdS5jbg==
†These authors have contributed equally to this work