 Hu Rongrong1
 Wang Chenchen
- 1School of Petroleum Engineering, Yangtze University, Wuhan, China
- 2Research Institute of Petroleum Exploration and Development of PetroChina, Beijing, China
- 3Cooperative Innovation Center of Unconventional Oil and Gas, Yangtze University, Wuhan, China
- 4iRock Technologies Co., Ltd., Beijing, China
Introduction: Pore space in tight sandstone formation is very complex with micro-scale and nano-scale pores/throats, the multi-scale characteristics needs to be considered for the construction of microscopic pore model accurately.
Methods: In this paper, micro-CT is used to obtain the representative 3D micro-scale gray image, and nano-CT is used to obtain the representative 3D nano-scale gray image based on the representative nano subsample. Then, the multi-threshold image segmentation algorithm is introduced to segment the micro-scale and nano-scale gray image respectively. Three distinct phases are identified in microscale images: (1) micro pore/throat phase, (2) micro-particle phase, and (3) a transitional matrix phase exhibiting intermediate grayscale values. This matrix phase represents unresolved nano-porosity and nano-particles beyond micro-CT resolution limits. Conversely, nanoscale images reveals two discrete phases: well-defined nanopore/throat phase and nano-particle phase. The micro-pore/throat and nano-pore/throat digital rocks are constructed respectively, and the corresponding pore network model in tight sandstone are extracted, the porosity and pore/throat size distribution at micro scale and nano scale is calculated respectively.
Results and discussion: Moreover, the nano pore/throat characteristics in nano-pore/throat digital rock is upscaled into the matrix phase of micro-pore/throat digital rock, which could calculate the total porosity and multiscale pore/throat size distribution in tight sandstone formation accurately. The digital rock analysis results are verified correctly with the comparison of the lab test results, which provides a fundamental platform for multiscale pore/throat characterization and formation evaluation in tight sandstone formation with important academic and application value.
1 Introduction
There is huge oil and gas resources in tight sandstone, however, the tight formation space is very complex with micro-scale and nano-scale pores/throats. It is important to characterize the tight sandstone microstructure in detail (Luo et al., 2013; Lin et al., 2022; Yuan et al., 2021; Wang X. et al., 2018).
At present, many methods are proposed to characterize the microscopic pore/throat of tight reservoir including indirect and direct methods, while the indirect method includes mercury injection and gas adsorption method, and direct method includes cast thin slice, scanning electron microscope (SEM), focused ion beam scanning electron microscope (FIB-SEM) and X-ray computed tomography (CT) scanning method (Lamme et al., 2004; Tomutsa et al., 2003; Lowell et al., 2005).
In indirect method, mercury injection method can quickly measure the rock porosity and pore size, etc., but it only applies to interconnected pores; the gas adsorption method can determine the specific surface area and pore size distribution, but it cannot measure the isolated micropores and the measurement error is large for the rock with small specific surface area. In the direct method, the cast thin sections and SEM can observe the 2D pore/throat morphology at different scales, but cannot reflect the 3D distribution characteristics. FIB-SEM uses ion beam to continuously denudate rocks at nano scale to obtain a series of 2D images, and combines them into 3D images to obtain the 3D images with tiny denudation area. X-ray CT scanning could emit X-ray to penetrate the rock samples and reconstruct the 3D images, which could be used to describe pore/throat characteristics. While Micro-CT and nano-CT scanning are often used in tight formation with different resolution, and the 3D images at micro and nano scale can be obtained respectively to characterize pore/throat characteristics and visualize the positions of pore/throats accurately (Yao et al., 2005; Yao and Zhao, 2010; Wang et al., 2013a; Wang et al., 2012; Yang et al., 2018; Cai et al., 2021).
While the pore/throat structure of tight sandstone are characterized by single scale CT scanning images, the multi-scale characteristics cannot be fully expressed (Luo et al., 2013; Bai et al., 2013). In order to describe the multi-scale pore/throat characteristics, many scholars have studied the multi-scale modeling methods, which are mainly divided into two categories. One is image superposition method (Wu et al., 2019; Karsanina et al., 2018; Yao et al., 2015), which is mainly based on the direct superposition of 3D images at different scales and resolutions, and the image based superposition method can be used to build multi-scale digital rock. The other is the model integration method (Cai et al., 2022; de Vries et al., 2017a; Jiang et al., 2013; Wang et al., 2013b; Yang et al., 2021), which mainly integrates pore network models at different scales through stochastic modeling, and the integration method based on pore network models can be used to model multi-scale pore network models.
In 2013, Jiang et al. generated an equivalent pore network model of arbitrary volume through random modeling based on high-resolution images, and generated a network model describing both large and small pores by adding links between networks of different scales (Jiang et al., 2013). In 2013, Yao et al. reconstructed macro pore digital rock by simulated annealing method based on 2D low-resolution SEM images, reconstructed micro pore digital rock by Markov Chain Monte Carlo method based on 2D high-resolution SEM images, and then obtained multi-scale digital rock with both macro pores and micro pores by hybrid image superposition (Yao et al., 2013). In 2017, de Vries et al. constructed a multi-scale pore network, which assumed that the micro aggregate domains containing a large number of randomly generated micro pores were assigned into the macropore domain, and analyzed the influence of aggregate parameters (porosity and permeability) on the dual pore network (de Vries E. T. et al., 2017). In 2018, Tahmasebi and Kamrava proposed an innovative framework for multiscale pore network modeling by synergistically integrating macro- and microstructural data, the methodology combined low-resolution CT-derived 3D volumetric data for macropore network generation with high-resolution 2D SEM images to stochastically reconstruct spatially correlated 3D microporosity domains (Tahmasebi and Kamrava, 2018). Totally speaking, the multi-scale model obtained by the superposition method has limited voxel size and the computational storage requirement is too large; the multi-scale model obtained by the integration method simplifies the pore/throat structure and does not fully describe the spatial location information of small-scale pore/throat (Wang Y. et al., 2018; Bultreys et al., 2015; Zhao et al., 2021).
In this paper, due to the limitations of the current multi-scale model method, the multi-threshold image segmentation algorithm is introduced to segment the micro-scale and nano-scale gray image respectively, and the weighted pore/throat information at different scales in tight sandstone is carried out, which effectively keeps the spatial location of nano pore/throat in matrix phase, and accurately calculates the total porosity and multi-scale pore/throat size distribution in tight sandstone formation, which provides a new platform for the characterization of multi-scale pore/throat and reservoir evaluation in tight sandstones.
2 Methodology
2.1 Micro and nano CT scanning
The tight sandstone samples in this paper were taken from the tight sandstone reservoirs of the Honghe Oilfield in the Ordos Basin. The lithology of the reservoir is mainly composed of interlayers of fine sandstone, siltstone and mudstone with poor physical properties. The average porosity of the reservoir is only 8.2% and the average permeability is 0.21 mD, which is a typical tight sandstone reservoir. The pore types are complex due to multi-stage karstification, the reservoir develops micro-scale pores and nano-scale pores, among which micro-scale pores are mainly composed of primary residual intergranular pores and intramateritic dissolution pores of feldspar debris. The nano-scale pores are mainly composed of authigenic kaolinite, authigenic illite, and inter-crystalline pores in the illite/montmorillonite mixed layer (Guo et al., 2019).
In this paper, X-ray CT scanning method is used to obtain the representative 3D gray images of tight sandstone at micro scale and nano scale. During the scanning process, X-ray penetrates the sample and magnifies the image based on the objective lens of different multiples. The sample is rotated 360° to obtain the X-ray attenuation image and then reconstruct the 3D gray image. The CT scanning image reflects the energy attenuation information of X-ray in the process of penetrating the object. Therefore, the 3D gray image obtained by CT scanning can reflect the actual pore structure and the relative density inside the sample.
As can be seen in Figure 1, based on the tight sandstone sample, a diameter of 2mm sub-sample was drilled and scanned by Zeiss MCT-400 micro-CT equipment to obtain representative micro-scale 3D gray image. Then, a diameter of 65μm subsample was obtained and scanned by Zeiss Ultra L-200 nm CT equipment to obtain representative 3D nano-scale 3D gray scale image.
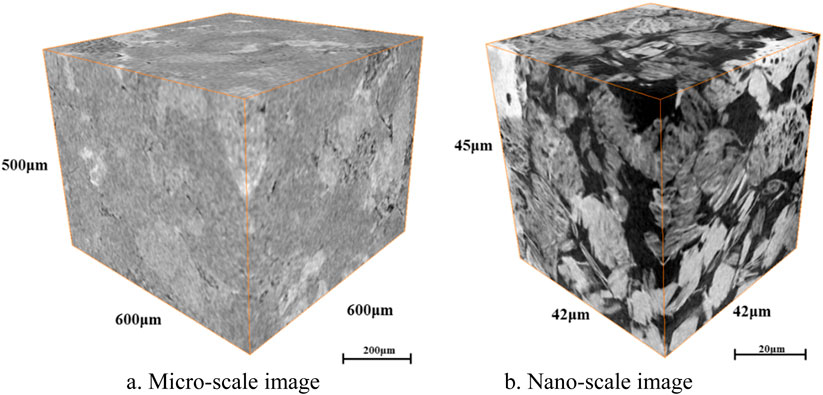
Figure 1. 3D gray image with micro and nano CT scanning. (a) Micro-scale image (b). Nano-scale image.
The resolution of micron-scale 3D gray image is 1μm, the voxel size is 600 × 600 × 500, and the physical size is 600 μm × 600 μm × 500 μm, which mainly represents the micron-scale pore characteristics of tight sandstone reservoir; the resolution of nano-scale 3D gray image is 65nm, the voxel size is 650 × 650 × 700, and the physical size is 42 μm × 42 μm × 45 μm, which mainly represents the nano-scale pore characteristics of tight sandstone reservoir.
2.2 Multi-threshold segmentation algorithm
Based on the 3D micro-scale and nano-scale gray image, multi-threshold image segmentation is carried out by the improved maximum inter-class variance method. The maximum inter-class variance method is used for single threshold segmentation, and its principle is to set a threshold value with the maximum of variance between the two separated classes (Otsu, 1975; Wang and Duan, 2008). Here it is improved for multi-threshold segmentation. In the image X, set the total image voxel number to N, the gray level to L, and the voxel number with gray level i to Ni, then the probability of each gray level is as follows (Equation 1):
If there are m classes, then m-1 thresholds [t1, … , tn, … ,tm-1] are used to classify the image into m classes. These classes are represented as C0 = [0, 1, … , t1], …, Cn = [tn+1, tn+2, … , tn+1], …, Cm-1 = [tm-1+1, tm-1+2, … , L-1], the inter-class variance is defined as (Equation 2):
The probability of all classes [C0, … , Cn, … , Cm-1] (Equation 3):
The average gray level of all classes (Equation 4):
The total average gray level of the image (Equation 5):
Select the set of thresholds [t1*, …, tn*, …, tm-1*] to meet the optimal threshold, with which the
As shown in Figure 2a, according to the gray threshold
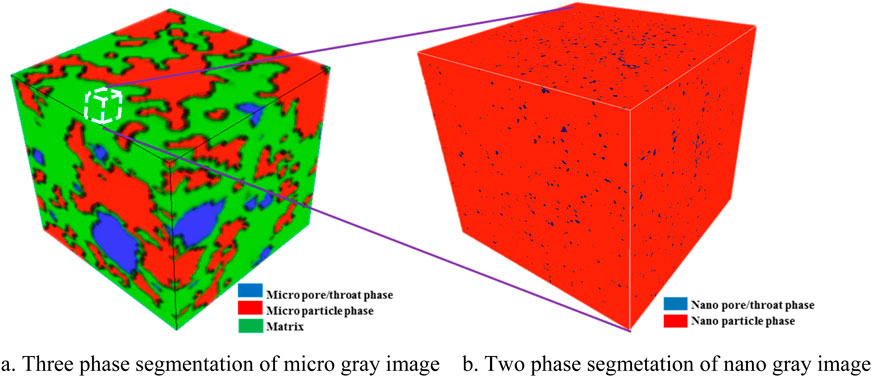
Figure 2. Multi-threshold segmentation with micro/nano scale gray image (a). Three phase segmentation of micro gray image (B). Two phase segmetation of nano gray image.
As shown in Figure 2b, according to the gray threshold t, the gray level of the nano-scale gray image is divided into two types: C0 (nano pore/throat phase) and C1 (nano particle phase), that is,
2.3 Multi-scale digital rock construction
Based on the 3D gray images of actual tight sandstone at micron scale and nano scale, according to the improved maximum inter-class variance method, the micro scale image of tight sandstone can be segmented into three phases (m = 3, L = 256, N = 600 × 600 × 500): micro pore/throat phase, micro particle phase and matrix phase (Figure 3a); the nano scale image of tight sandstone can be segmented into two phases (m = 2, L = 256, N = 650 × 650 × 700): nano pore/throat phase and nano particle phase (Figure 3b). Then, the micro scale digital rock and nano scale digital rock were constructed respectively, and a multi-scale digital rock platform based on multi-threshold segmentation algorithm was established.
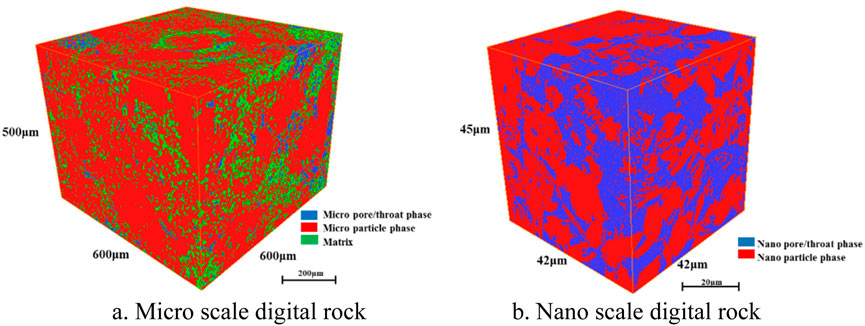
Figure 3. Construction of multi-scale digital rock with multi-threshold segmentation. (a). Micro scale digital rock (b). Nano scale digital rock.
Among them, the gray value of the matrix phase is between the micro pore/throat phase and micro particle phase, which is used to characterize the nano pore/throat and particle region that cannot be identified under the resolution of micro-CT scanning. The nano pore/throat and nano particle are included in the matrix phase region, and it needs to be characterized by nano CT with high resolution, so the sub-sample of nano-CT scanning is precisely located in the matrix phase region of the micro-CT scanning sample (Yao et al., 2005; Yang et al., 2016).
3 Results and discussion
Based on the research platform of multi-scale digital rock in tight sandstone formation, the porosity and pore/throat radius distributions at the micro and nano scale were calculated respectively, the total porosity and multi-scale pore/throat distribution can be accurately calculated through the weighting of multi-scale digital rock.
3.1 Porosity
Based on micro and nano scale digital rock, the micro pore and nano pore porosity can be obtained respectively. On this basis, the pore/throat ratio of the nano scale digital rock is fused into the matrix phase of micro scale digital rock, and the total porosity of the tight sandstone formation is obtained by weighting calculation as follows (Equations 6–8):
Where,
As shown in Table 1, based on the micro scale and nano scale digital rock in tight sandstone formation, the porosity of micro scale digital rock is 3.3%, and the porosity of nano scale digital rock is 30.7%. The total porosity of tight sandstone formation obtained by weighting the above formula is 9.4%, which is basically consistent with the gas lab test porosity of 8.9%.
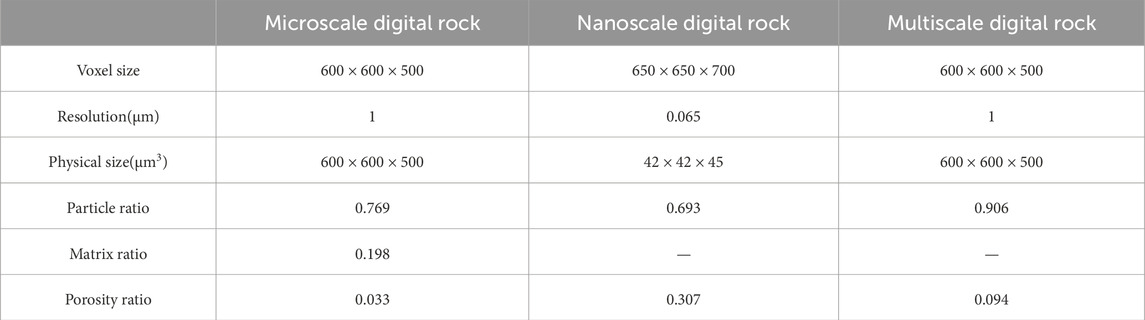
Table 1. Physical parameters based on multiscale digital rock analysis.
3.2 Pore/throat radius distribution
Based on micro scale and nano scale digital rocks, the corresponding pore network models were extracted respectively to obtain pore/throat radius distribution characteristics at micro and nano scale (Dong et al., 2007; Øren and Bakke, 2003; Blunt, 2001).
On this basis, the pore/throat distribution characteristics of nano digital rock is fused into the matrix phase of micro scale digital rock, and the multi-scale pore/throat radius distribution characteristics of tight sandstone formation are obtained by weighting calculation. The formula is shown as follows (Equation 9):
Where,
Based on the micro scale and nano scale digital rock of tight sandstone formation, the corresponding micro pore network model (Figure 4a) and nano pore network model (Figure 4b) are extracted respectively, the micro and nanopore/throat radius distribution are obtained with pore network analysis.
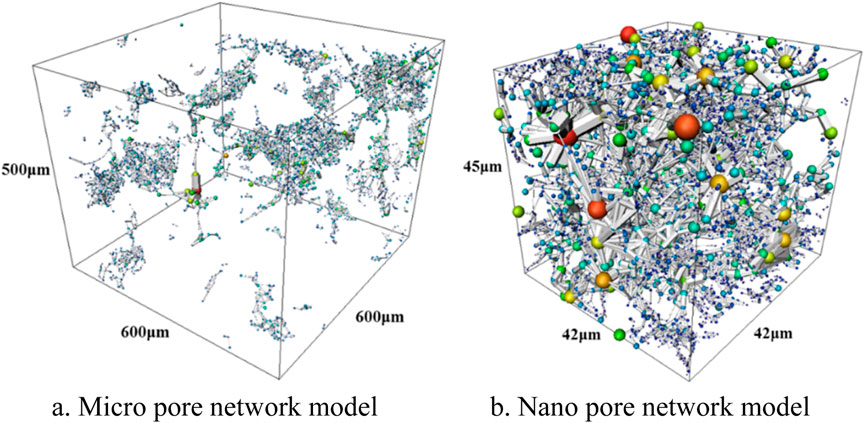
Figure 4. Extraction of micro-nano pore network model. (a). Micro pore network model (b). Nano pore network model.
As shown in Figure 5a, the micro pore/throat radius distribution curve mainly shows the distribution characteristics of micro pore/throat in tight sandstone, and the peak value of micro pore/throat radius is 3.24 μm. As shown in Figure 5b, the nano pore/throat radius distribution curve mainly shows the distribution characteristics of nano pore/throat in tight sandstone, and the peak value of nano pore/throat radius is 380 nm.
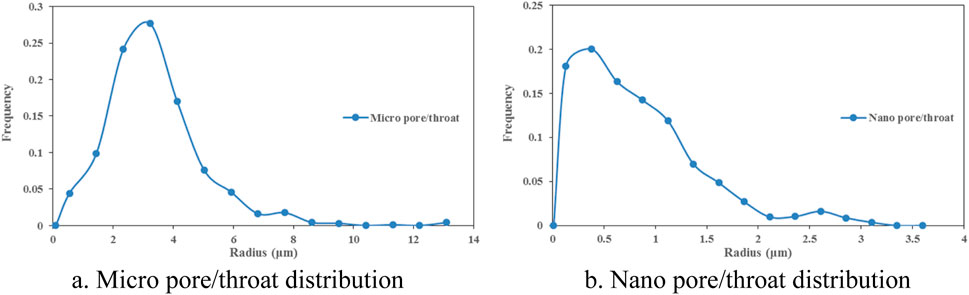
Figure 5. Pore-throat radius distribution based on pore network model. (a). Micro pore/throat distribution (b). Nano pore/throat distribution.
As shown in Figure 6a, the pore/throat distribution of nano scale digital rock is fused into the matrix phase of micro scale digital rock, and the multi-scale pore/throat radius distribution of tight sandstone formation is obtained after weighted calculation. It can be found that, the peak value of weighted pore/throat radius is 1.01 μm, and the distribution curve ranges 30 nm–13.1 μm, which can contain the pore/throat characteristics at micro and nano scale in tight sandstone formation.
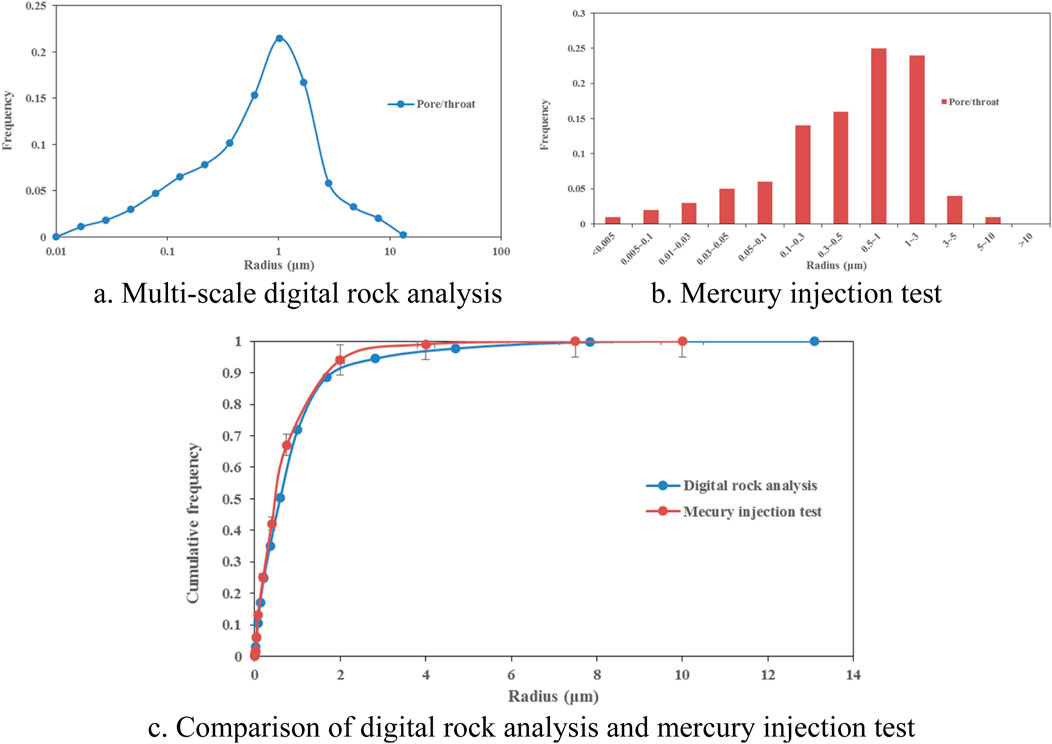
Figure 6. Multiscale pore-throat radius distribution curve in tight sandstone formation (a). Multi-scale digital rock analysis (b). Mercury injection test (c). Comparison of digital rock analysis and mercury injection test.
At the same time, the result of multi-scale digital rock analysis is compared with that of indoor high-pressure mercury injection test (Figures 6b,c), it can be found that, the pore/throat radius distribution with high-pressure mercury injection test and multi-scale digital rock analysis are basically consistent, while the error range is 5%. Moreover, the pore/throat radius distribution curve with high-pressure mercury injection test is slightly lower than that with digital rock analysis, this is because the high pressure mercury injection mainly reflects the structural characteristics of throats, and multi scale digital rock analysis can reflect the characteristics of pores and throats at the same time.
Compared with traditional superposition methods, the multi-threshold image segmentation algorithm could fuse the information of nano scale digital rock into that of micro scale digital rock directly, which could describe the multi-scale characteristics effectively. However, the pore structure of tight sandstone is significantly affected by sedimentary environment and diagenesis, the sampling position and scanning resolution may affect the model accuracy. REV (Representative Elementary Volume) test is necessary for more complex pore-throat structures during the digital rock construction process (Zhang et al., 2019; Du et al., 2025).
4 Conclusion
(1) X-ray CT scanning has the advantages of actual 3D imaging and nondestructive features. Representative 3D grayscale image at the micro scale is obtained through micro CT scanning. On this basis, representative nano subsample are selected for high resolution nano CT scanning to obtain representative 3D grayscale images at the nano scale, which can provide a basis for the construction of multi-scale digital rocks of tight sandstone.
(2) According to the improved multi-threshold segmentation algorithm, three distinct phases are identified in microscale images: micro pore/throat phase, micro-particle phase and a transitional matrix phase exhibiting intermediate grayscale values. This matrix phase represents unresolved nano-porosity and nano-particles beyond micro-CT resolution limits. The nano-scale gray image is segmented into two phases including nano-pore/throat phase and nano-particle phase. Thus, the micro pore/throat digital rock and nano pore/throat digital rock are constructed respectively, and then a multi-scale digital rock platform based on multi-threshold segmentation algorithm is established.
(3) Based on multiscale digital rock and the corresponding pore network model in tight sandstone, the porosity and pore/throat size distribution at micro scale and nano scale is calculated respectively. Moreover, the nano pore/throat characteristics in nano-pore/throat digital rock is upscaled into the matrix phase of micro-pore/throat digital rock, which could calculate the total porosity and multiscale pore/throat size distribution in tight sandstone formation accurately. The digital rock analysis results are verified correctly with the comparison of the lab test results, which provides a fundamental platform for multiscale pore/throat characterization and formation evaluation in tight sandstone formation with important academic and application value.
Data availability statement
The original contributions presented in the study are included in the article/supplementary material, further inquiries can be directed to the corresponding author.
Author contributions
HR: Writing – review and editing, Methodology, Validation. HJ: Formal Analysis, Investigation, Resources, Writing – original draft. WC: Conceptualization, Data curation, Writing – original draft. ZJ: Formal Analysis, Software, Validation, Writing – original draft. DH: Investigation, Supervision, Visualization, Writing – review and editing.
Funding
The author(s) declare that no financial support was received for the research and/or publication of this article.
Conflict of interest
Author HJ was employed by Research Institute of Petroleum Exploration and Development of PetroChina.
Authors ZJ and DH were employed by iRock Technologies Co., Ltd.
The remaining authors declare that the research was conducted in the absence of any commercial or financial relationships that could be construed as a potential conflict of interest.
Generative AI statement
The author(s) declare that no Generative AI was used in the creation of this manuscript.
Publisher’s note
All claims expressed in this article are solely those of the authors and do not necessarily represent those of their affiliated organizations, or those of the publisher, the editors and the reviewers. Any product that may be evaluated in this article, or claim that may be made by its manufacturer, is not guaranteed or endorsed by the publisher.
References
Bai, B., Zhu, R., and Wu, S. (2013). Multi-scale method of nano(micro)-CT study on microscopic pore pore structure of tight sandstone of YanChang Formation, Ordos Basin. Petroleum Explor. Dev. 40 (3), 329–333. doi:10.11698/PED.2013.03.09
Blunt, M. J. (2001). Flow in porous media - pore-network models and multiphase flow. Curr. Opin. Colloid and Interface Sci. 6 (3), 197–207. doi:10.1016/s1359-0294(01)00084-x
Bultreys, T., Hoorebeke, L. V., and Cnudde, V. (2015). Multi-scale, micro-computed tomography-based pore network models to simulate drainage in heterogeneous rocks. Adv. Water Resour. 78, 36–49. doi:10.1016/j.advwatres.2015.02.003
Cai, J., Wood, D. A., Hajibeygi, H., and Iglauer, S. (2022). Multiscale and multiphysics influences on fluids in unconventional reservoirs: modeling and simulation. Adv. Geo-Energy Res. 6 (2), 91–94. doi:10.46690/ager.2022.02.01
Cai, S., Yang, Y., and Liu, J. (2021). Pore-scale simulation of multiphase flow considering thermo-hydro-mechanical coupling effect in porous media. Chin. J. Theor. Appl. Mech. 53 (8), 1–10. doi:10.6052/0459-1879-21-294
de Vries, E. T., Raoof, A., and van Genuchten, M. T. (2017a). Multiscale modelling of dual-porosity porous media; a computational pore-scale study for flow and solute transport. Adv. Water Resour. 105, 82–95. doi:10.1016/j.advwatres.2017.04.013
de Vries, E. T., Raoof, A., and van Genuchten, M. T. (2017b). Multiscale modelling of dual-porosity porous media; a computational pore-scale study for flow and solute transport. Adv. Water Resour. 105, 82–95. doi:10.1016/j.advwatres.2017.04.013
Dong, H., Touati, M., and Blunt, M. J. (2007). “Pore network modeling: analysis of pore size distribution of arabian core samples[A],” in Proceedings of the SPE Middle East oil and gas show and conference[C]. SPE 105156. Bahrain: Society of Petroleum Engineers, 518–522.
Du, H., Ma, B., Wang, C., Han, D., and Hu, R. (2025). Pore-fracture fusion modeling method for ultra-deep clastic reservoirs. Mar. Petroleum Geol. 173 (2025), 107307. doi:10.1016/j.marpetgeo.2025.107307
Guo, X., Xia, D., and Pang, W. (2019). Significance of microscope pore structure characterization for classification of tight reservoir: taking the 8th member of Yanchang formation in Honghe oilfield as an example. Sci. Technol. Eng. 19 (34), 129–136. doi:10.3969/j.issn.1671-1815.2019.34.018
Jiang, Z., Van Dijke, M., Sorbie, K. S., and Couples, G. D. (2013). Representation of multiscale heterogeneity via multiscale pore networks. Water Resour. Res. 49 (9), 5437–5449. doi:10.1002/wrcr.20304
Karsanina, M. V., Gerke, K. M., Skvortsova, E. B., Ivanov, A. L., and Mallants, D. (2018). Enhancing image resolution of soils by stochastic multiscale image fusion. Geoderma 314, 138–145. doi:10.1016/j.geoderma.2017.10.055
Lamme, O. L., Bellet, M., Di Michiel, M., and Bouvard, D. (2004). Bulk observation of metal powder sintering by X-ray synchrotron microtomography. Acta Mater. 52 (4), 977–984. doi:10.1016/j.actamat.2003.10.032
Lin, W., Wu, Z., Li, X., Yang, Z., Hu, M., Han, D., et al. (2022). Digital characterization and fractal quantification of the pore structures of tight sandstone at multiple scales. J. Petroleum Explor. Prod. Technol. 12, 2565–2575. doi:10.1007/s13202-022-01502-4
Lowell, S., Shields, J. E., and Thommes, M. (2005). Characterization of porous solids and powders: surface area, pore size and density. (doctoral dissertation). Netherlands: Springer.
Luo, S., Wei, W., and Wei, X. (2013). Microstructural characterization and development trend of tight sandstone reservoirs. J. Oil Gas Technol. 35 (009), 5–10. doi:10.3969/j.issn.1000-9752.2013.09.002
Øren, P. E., and Bakke, S. (2003). Reconstruction of Berea sandstone and pore-scale modelling of wettability effects. J. Petroleum Sci. Eng. 39 (3-4), 177–199. doi:10.1016/s0920-4105(03)00062-7
Otsu, N. (1975). A Gaussian sum approach to the multi-target identification-tracking problem. Automatica 11, 285–296. doi:10.1016/0005-1098(75)90044-8
Tahmasebi, P., and Kamrava, S. (2018). Rapid multiscale modeling of flow in porous media. Phys. Rev. E 98 (5), 052901. doi:10.1103/physreve.98.052901
Tomutsa, L., Radmilovic, V. L., and Berkeley, C. A. (2003). Focussed ion beam assisted three-dimensional rock imaging at submicron scale. Berkeley, CA: Ernest Orlando Lawrence Berkeley National Laboratory.
Wang, C., Yao, J., and Yang, Y. (2012). The flow properties of carbonate digital rock based on lattice Boltzmann method. J. China Univ. Petroleum Edition Nat. Sci. 36 (6), 94–98. doi:10.3969/j.issn.1673-5005.2012.06.017
Wang, C., Yao, J., and Yang, Y. (2013a). Structure characteristics analysis of carbonate dual pore digital rock. J. China Univ. PetroleumEdition Nat. Sci. 37 (2), 71–74. doi:10.3969/j.issn.1673-5005.2013.02.012
Wang, C., Yao, J., and Yang, Y. (2013b). The construction of carbonate multiscale network model based on regular network. Chin. J. Comput. Mech. 30 (2), 231–235. doi:10.7511/jslx201302010
Wang, L., and Duan, H. (2008). Application of Otsu method in multi-threshold image segmentation. Comput. Eng. Des. 29 (11), 2844–2845. doi:10.16208/j.issn1000-7024.2008.11.030
Wang, X., Guo, C., He, S., Jiang, Z., and Ma, Y. (2018a). Improved skeleton extraction method considering surface feature of natural micro fractures in unconventional shale/tight reservoirs. J. Petroleum ence and Eng. 168, 521–532. doi:10.1016/j.petrol.2018.05.040
Wang, Y., Zhou, X., Wang, Y., and Shou, Y. (2018b). A 3-D conjugated bond-pair-based peridynamic formulation for initiation and propagation of cracks in brittle solids. Int. J. Solids Struct. 134, 89–115. doi:10.1016/j.ijsolstr.2017.10.022
Wu, Y., Tahmasebi, P., Lin, C., Ren, L., and Dong, C. (2019). Multiscale modeling of shale samples based on low- and high-resolution images. Mar. Petroleum Geol. 109, 9–21. doi:10.1016/j.marpetgeo.2019.06.006
Yang, Y., Liu, Z., Yao, J., Wang, C., Sun, H., Zhang, L., et al. (2018). Pore space characterization method of shale matrix formation based on superposed digital rock and pore-network model. Sci. Sin. Tech. 48 (5), 488–498. doi:10.1360/n092017-00076
Yang, Y., Wang, C., and Yao, J. (2016). A new method for microscopic pore structure analysis in shale matrix. Earth Sci. 41 (6), 1067–1073. doi:10.3799/dqkx.2016.088
Yang, Y., Zhou, Y., Blunt, M., Yao, J., and Cai, J. (2021). Advances in multiscale numerical and experimental approaches for multiphysics problems in porous media. Adv. Geo-Energy Res. 5 (3), 233–238. doi:10.46690/ager.2021.03.01
Yao, J., Hu, R., Wang, C., and Yang, Y. (2015). Multiscale pore structure analysis in carbonate rocks. Int. J. Multiscale Comput. Eng. 13 (1), 1–9. doi:10.1615/intjmultcompeng.2014010500
Yao, J., Wang, C., Yang, Y., Hu, R., and Wang, X. (2013). The construction of carbonate digital rock with hybrid superposition method. J. Petroleum Sci. Eng. 110, 263–267. doi:10.1016/j.petrol.2013.10.005
Yao, J., and Zhao, X. (2010). Digital rock and pore scale flow simulation theory. Beijing: Petroleum Industry Press.
Yao, J., Zhao, X., and Yi, Y. (2005). The current situation and prospect on digital core technology. Oil and Gas Recovery Technol. 12 (6), 52–54. doi:10.3969/j.issn.1009-9603.2005.06.017
Yuan, R., Han, D., Tang, Y., Wei, H., Mo, T., and Wang, C. (2021). Fracture characterization in oil-based mud boreholes using image logs: example form tight sandstones of Lower Cretaceous Bashijiqike Formation of KS5 well area, Kuqa Depression, Tarim Basin, China. Arabian J. Geosciences 14 (6), 435–518. doi:10.1007/s12517-021-06750-y
Zhang, J., Zhou, X., Zhou, L., and Berto, F. (2019). Progressive failure of brittle rocks with non-isometric flaws: insights from acousto-optic-mechanical (AOM) data. Fatigue and Fract. Eng. Mater. and Struct. 42 (8), 1787–1802. doi:10.1111/ffe.13019
Keywords: tight sandstone, micro-nano pore/throat, 3D digital rock, multiscale characteristic, multi-threshold image segmentation
Citation: Rongrong H, Jiangchen H, Chenchen W, Jian Z and Hu D (2025) Multiscale pore/throat characterization in tight sandstone formation with multi-threshold image segmentation algorithm. Front. Earth Sci. 13:1576484. doi: 10.3389/feart.2025.1576484
Received: 14 February 2025; Accepted: 21 April 2025;
Published: 02 May 2025.
Edited by:
Soroush Abolfathi, University of Warwick, United KingdomReviewed by:
Jing Bi, Guizhou University, ChinaLingtan Zhang, China University of Petroleum (East China), China
Copyright © 2025 Rongrong, Jiangchen, Chenchen, Jian and Hu. This is an open-access article distributed under the terms of the Creative Commons Attribution License (CC BY). The use, distribution or reproduction in other forums is permitted, provided the original author(s) and the copyright owner(s) are credited and that the original publication in this journal is cited, in accordance with accepted academic practice. No use, distribution or reproduction is permitted which does not comply with these terms.
*Correspondence: Wang Chenchen, d2NjMTIyMEAxNjMuY29t