 Xiang Wang1,2
 Mingwei Yang
- 1Hunan Institute of Water Resources and Hydropower Research, Changsha, Hunan, China
- 2Hunan Dam Safety and Disease Prevention Engineering and Technology Research Centre, Changsha, Hunan, China
The detection of karst groundwater channels is of great significance for the development of underground cities and the prevention and control of geological disasters. Aiming at the characteristics of high spatial variability of karst geological groundwater channels, a new exploration model based on the three-dimensional (3D) electrical method is proposed. Combined with an urban exploration project in Hunan Province, China, the exploration efficiency and effect of the new mode of one-shaped layout arrangement exploration and conventional three-dimensional electric method exploration are compared and analyzed. The main process of this model is as follows: Firstly, determine the X and Y directions of electrophysical exploration according to the direction of the geological anomalies in the exploration area. Then, according to the exploration length and measuring point spacing in X and Y directions, the electrical grid parameters are determined. Finally, the coordinates of all power supply grids and the actual relative coordinates of the exploration area are calculated, and the power supply points are arranged in a pattern of one. The feasibility of the above model has been verified through the exploration project, and the results show that the exploration efficiency of this exploration model has been significantly improved compared with the conventional three-dimensional electric method, and the effect is excellent and highly applicable.The comparison of data shows that the number of power supplies and data acquisition of conventional 3D electrical method are 121 and 14520 respectively, while the number of new mode of one-shaped layout is only 17 and 2046 respectively, with a reduction of 85.9%. The research results can provide some reference for the exploration scheme design of urban karst groundwater channels.
1 Introduction
Given the increasing global population and acceleration of urbanization, the demand for groundwater resources has increased steadily (Asaue et al., 2021; Adamson et al., 2021; Reza and Singh, 2023). In karst areas, atmospheric precipitation seeps underground rapidly through surface sinkholes and fissures, resulting in a scarcity of surface water. The groundwater resources also demonstrate temporal non-uniformity under the influence of seasonal rainfall. These have caused water shortages as well as karst-related droughts and floods. In karst areas, groundwater is the primary source of water supply. Hence, exploration and utilization of karst groundwater is crucial for addressing the water supply demands for local industrial, agricultural, and domestic purposes. However, the exploration and development of karst groundwater entail significant challenges owing to the complex urban terrain, deep groundwater burial, and uneven karst development (Gong et al., 2024; Dai et al., 2024). The historical success rate of karst groundwater exploration has been approximately 30% (Bian et al., 2024). Therefore, accurately identifying the distribution of groundwater is crucial to the success of water exploration.
There are significant similarities and commonalities between the methods used for karst groundwater exploration. Typically, investigations of the groundwater pathways are conducted using geological or geophysical methods, followed by verification through drilling (Wu et al., 2024; Zhao et al., 2024; Lu et al., 2024). The geological methods include hydrogeological surveys, geological mapping, and remote sensing technologies. The geophysical methods include conventional direct current and electromagnetic methods (Yuan et al., 2024; Permanasari et al., 2019; Ou et al., 2020). The primary rock-forming minerals comprising the rocks possess high resistivity, while the pore water within the rocks is essentially a saline solution containing various conductive particles. This pore water exhibits good conductivity and makes electrical exploration a key method for locating and assessing groundwater resources (Xiong et al., 2019; Huang et al., 2023; Chirindja et al., 2016). Such electrical exploration methods have numerous successful applications in groundwater exploration worldwide and can be categorized into one-dimensional (1D), two-dimensional (2D), and three-dimensional (3D) methods (Chirindja et al., 2016; Kouadio et al., 2020). The 1D electrical method is rarely applied given its low precision and poor efficacy (Kevin et al., 2021; Rupesh and Sharma, 2021). In comparison, the 2D electrical method offers higher precision and better effects, but its exploration precision is still lower than that of the 3D method. The 3D electrical method has been widely adopted in geological exploration owing to its high accuracy and efficacy (Pilla and Torrese, 2022; Cardarelli et al., 2018). Han et al. (2023) compared and analyzed the influences of different electrode devices on the exploration effects based on engineering projects, and their results showed that the 3D high-density electrodynamic method is more effective at detecting low-resistance anomalies. Gong et al. (2019) found that 3D inversion could highlight the interface areas of the rock layers as well as the spatial distribution and continuity of the rock layers in the stratigraphic division; these were in agreement with the actual stratigraphy when performing 3D inversion on the exploration data. Yuan et al. (2024) conducted a comparative analysis of the electrical and drilling methods and found that the electrical methods can accurately detect underground water. Although the 3D electrical method has clear advantages in terms of precision and efficacy, its low efficiency, high cost, and strict terrain requirements limit the extent of application in practical field explorations. Hence, there is an urgent need to develop a precise exploration technology suitable for karst terrains.
The present study is based on a mineral water resources monitoring project in an urban area of Hunan Province; herein, we investigated the groundwater resources under the strong development characteristics of karst in this area. Based on the geological and geomorphological characteristics of the study area, a new model of urban groundwater exploration based on the 3D electrical method is proposed. The accuracy and effectiveness of this new exploration model were verified using the complete 3D electrical method and drilling results as the standard. The results of the exploration are intended to provide a reliable basis for urban groundwater exploration as well as for the development and utilization of water resources. This exploration model is also expected to provide guidance for the design of urban karst groundwater channel exploration programs.
2 Engineering background
2.1 Overview of the study area
The study area is located in the central urban region of Hexi District, Yiyang City (Figure 1). To address the issue of water supply for residents in the area, an exploration of underground karst water and fracture water pathways was undertaken. Owing to interference from nearby buildings, there were some challenges to implementing the conventional 3D electrical method, such as difficulties with grid distribution, limited measurement accuracies, and extended construction periods. To enhance the efficiency and accuracy of urban underground water channel exploration, we propose a layout for the 3D electrical method in the shape of the number one that was tailored for complex environments, such as urban areas.
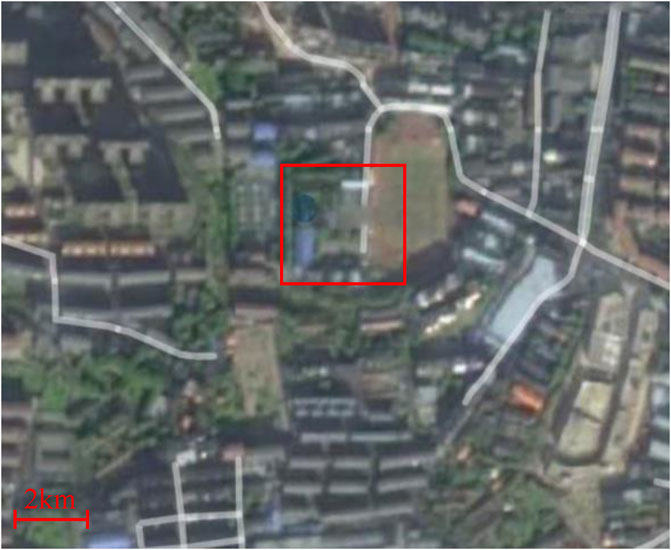
Figure 1. Geographic location of the project.
2.2 Hydrological conditions
According to the stratum lithology, geological structure, and hydrodynamic conditions, the groundwater in the study area can be divided into loose rock-like pore water, clastic rock-like pore water, carbonate fissure cavern water, and fissure water; here, the fissure water includes fracture tectonic water, tectonic fissure or dyke fissure water, and weathering fissure water. The stratigraphy of the study area is simple, and the lithology is single (Table 1). The Quaternary sediment strata in this area include clay and sandy soils that exhibit low resistivity values ranging from 10 to 50 Ω·m. The resistivity of basic volcanic rocks ranges from 100 to 500 Ω·m and is similar to that of the Quaternary strata, as shown in Table 1. The resistivity of the semi-weathered strata is between those of the Quaternary strata and volcanic rocks. If faults develop within the Quaternary strata and weathered strata of volcanic rocks, the resistivity will decrease further. If faults develop in relatively intact basic volcanic rocks, then it is more likely to result in a trend of resistivity decline. There are two categories of caves, of which the water- and mud-filled caves typically have resistivities of less than 50 Ω·m while the unfilled caves generally have resistivities exceeding 3,000 Ω·m.
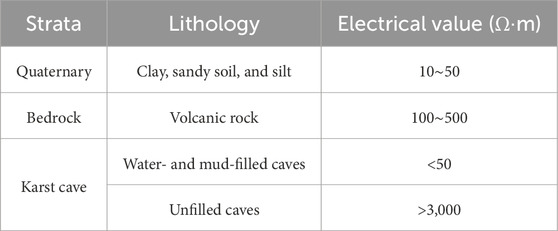
Table 1. Electrical characteristics in the survey area.
3 Detection method and survey line layout
3.1 One-shaped 3D electrical method
Based on the topographical characteristics, the one-shaped 3D electrical method was designed. Here, the electrical exploration transmitter injects current into the ground through the electrodes of the power supply point. Simultaneously, the electrical exploration receiver synchronously collects electric field signals at each measurement point. By analyzing the apparent resistivity and induced polarization parameters at each measurement point upon activation of each power supply point, we achieved effective implementation of the one-shaped 3D electrical exploration. The specific descriptions of the measurements are as follows.
(1) Analysis of previous geological results and setting of exploration direction
Based on the preliminary geological results of the exploration area, the direction of the main geological anomalies in the area is inferred. Then, the direction that is approximately perpendicular to that of the geological anomalies is set as the X direction (the angle between the X direction and main geological anomalies is in the range of 60°–120° and as close to or equal to 90° as possible), while the direction parallel to the geological anomalies is set as the Y direction (the angle between the Y direction and main geological anomalies is in the range of −30° to 30° and as close to or equal to 0° as possible). These directions are perpendicular to each other and are both horizontal.
(2) Determination of exploration length and grid parameters
Based on the exploration objectives and requirements, we established the exploration lengths L for the X direction and M for the Y direction. Concurrently, we determined the measurement point spacings c in the X direction and d in the Y direction. Using the center of the exploration area as the reference point, we next calculated the grid parameters a in the X direction and b in the Y direction through Equation 1.
(3) Grid layout of the power supply point
Based on the topographical characteristics, we arranged the 3D electrical exploration measurement points reasonably. When the length of the measurement line in the X direction of the rectangular exploration area reaches or exceeds twice the predicted width of the exploration target, the layout of the power supply points should adhere to the following guidelines.
Assuming that the coordinates of the lower-left and upper-right corners of the rectangular exploration area are (-a, -b) and (a, b), respectively, the grid coordinates (x, y) of the power supply points are calculated by Equation 2. Thus, the actual relative coordinates (XC, YC) of the electrical grid points can be determined by Equation 3.
where x, y, a, and i are all integers.
To reduce the boundary effects of the boundary measurement points and improve the exploration accuracy, when the length of the measurement line in the X direction is less than twice the predicted width of the exploration target, all the electrical grid points should be arranged at the same interval as the measurement points. Thus, the coordinates (x, y) of the electrical grid points are calculated using Equation 4.
Combining the aforementioned rules with the conversion relationship between grid coordinates (x, y) and actual relative coordinates (XC, YC), the positions of all power supply points are determined. Then, these points are reasonably arranged within the exploration area to ensure accuracy and efficiency.
(4) Arrangement of the measurement points
Based on the exploration requirements and calculated grid parameters, including the spacing and measurement points in the X and Y directions, the layout scheme for the 3D electrical measurement points is established.
(5) Data acquisition and measurements
On the preset grid lines, the power supply points are activated sequentially using a multichannel electrical measurement system or multiple independent measurement systems to collect the electrical data from all measurement points within the exploration area.
(6) Data processing and integration of results
The collected electrical data are organized and processed through the one-shaped 3D electrical method to generate the electrical exploration results for the surveyed area.
3.2 Survey line arrangement
The field layout diagram of the one-shaped 3D electrical method is presented in Figure 2. A total of six 3D electrical measurement lines are arranged within the site area, as illustrated in Figure 3. Owing to constraints from the terrain and topography, the layout of the measurement points and power supply points is primarily a grid of 20 × 40 m. In addition, some measurement points were adjusted and shifted based on the unique topography of the urban area. Within this measurement area, the one-shaped 3D electrical survey line was arranged along both east–west and north–south orientations, resulting in a total of 121 measurement points. Owing to the presence of obstacles, such as buildings, the spacing between the measurement points and lines is adjusted flexibly according to the actual on-site conditions. The distances between the measurement points range from 10 to 20 m, while the line spacing is approximately 40 m. The working frequencies of the dual-frequency electrical instrument are 4 Hz and 4/13 Hz, where the supply current is maintained above 800 mA. The obtained data are completely devoid of human electromagnetic interference in the measurement area, meaning that the data are reliable.
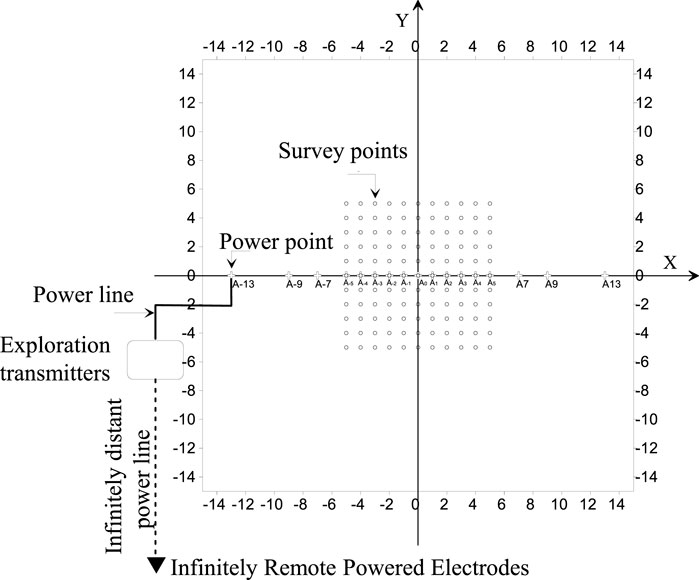
Figure 2. Schematic illustration of the survey field.
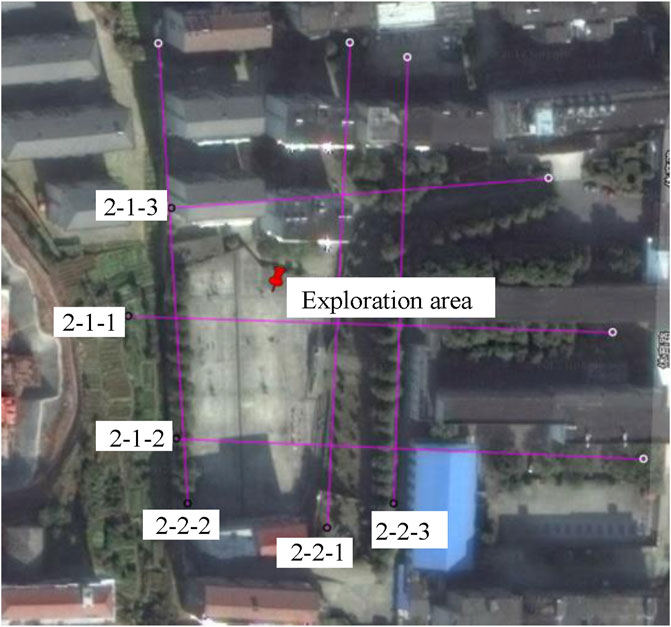
Figure 3. Layout of the exploration survey lines.
Within the measurement area, the complete 3D electrical method was employed for exploration, where the exploration area was divided into 11 × 11 grids. The lengths of the measurement lines in the X direction exceeded twice the predicted width of the exploration target. Hence, a total of 121 complete 3D electrical measurement points and power supply points were calculated using Equation 5, 6, and the number of electrical data acquisitions was 14,520.
Here,
where
4 Effect analysis
4.1 Effect analysis of the one-shaped 3D electrical method
The 3D electrical exploration cross-section and contour map of the measurement area are shown in Figure 4. It can be observed that the southern part of the measurement area exhibits an overall low-resistivity anomaly in a “funnel” shape, suggesting the presence of a near east–west-trending fault or fracture zone inclined to the south. The 3D electrical exploration cross-section and contour map of the measurement area as viewed from the east are shown in Figure 5. It can be inferred that the low-resistivity anomaly between the measurement points −100 and 0, with point 0 as the boundary, is indicative of a near east–west-trending fault or fracture zone. The section from 0 to 70 mainly exhibits high resistivity, which is presumed to represent relatively intact volcanic rocks. Between measurement points 70 and 100, there is a trend of low-resistivity anomalies presumed to be caused by the presence of a fracture zone or karst caves in the measurement area.
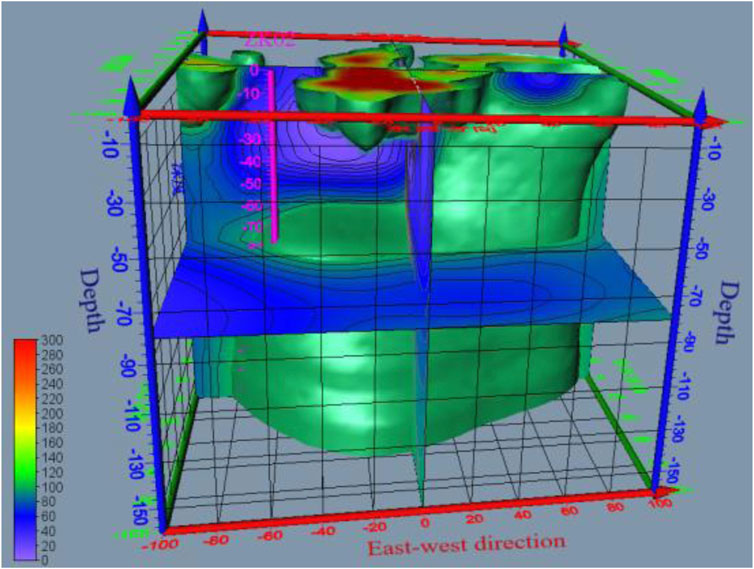
Figure 4. Three-dimensional view of the electrical exploration section and isosurface results map of the detection area (viewed from the south).
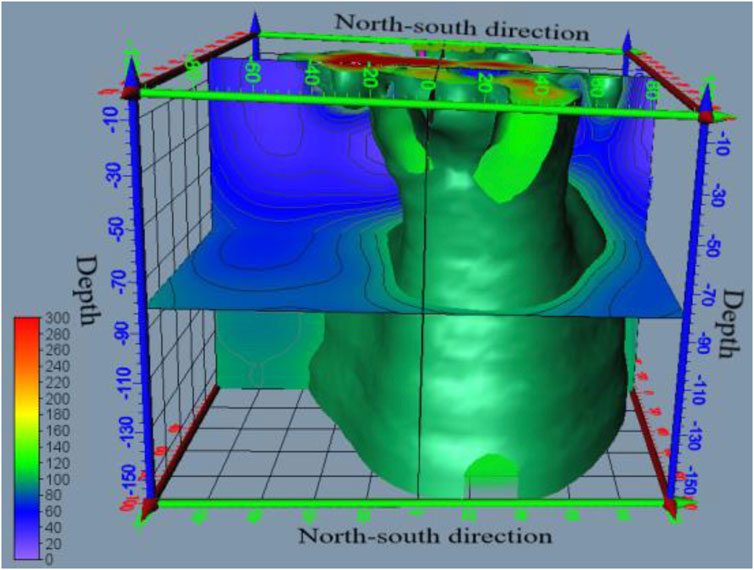
Figure 5. Three-dimensional view of the electrical exploration section and isosurface results map of the detection area (viewed from the east).
The results of the 3D electrical exploration section and isosurface from the perspective of the north of the survey area are shown in Figure 6. It is seen that the resistivity trend is generally nearly east–west, indicating relatively complete volcanic rocks and a near east–west fracture zone. The 3D electrical exploration section and isosurface results of the survey area viewed from the west are shown in Figure 7; here, the shallow high-resistance body is inferred to be the influence of the cement floor of the basketball court. There is a relatively thick low-resistance anomaly underneath the high-resistance body, which is speculated to be the response of the near north–south faults, fracture zones, or karst caves in the west of the survey area. The southwest corner generally shows a low-resistance anomaly from shallow to deep, and it is speculated that this part is the intersection of the north–south-trending fault or fracture zone in the west with the nearly east–west-trending fault or fracture zone in the south.
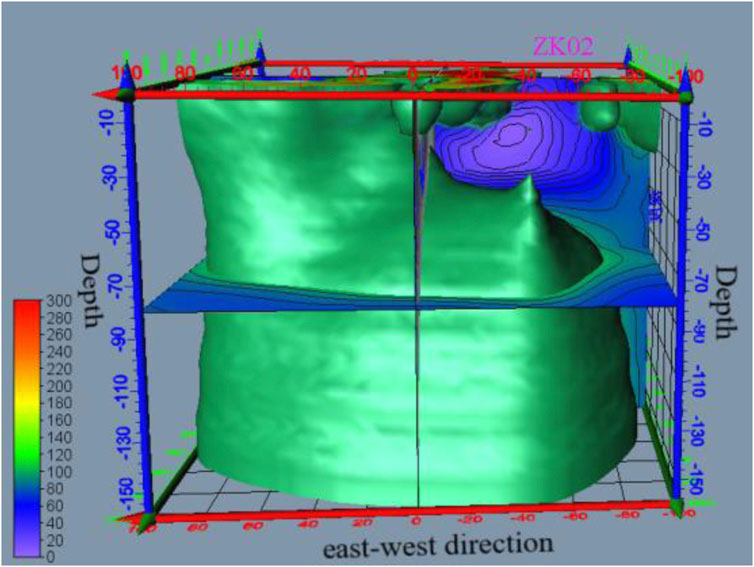
Figure 6. Three-dimensional view of the electrical exploration section and isosurface results map of the detection area (viewed from the north).
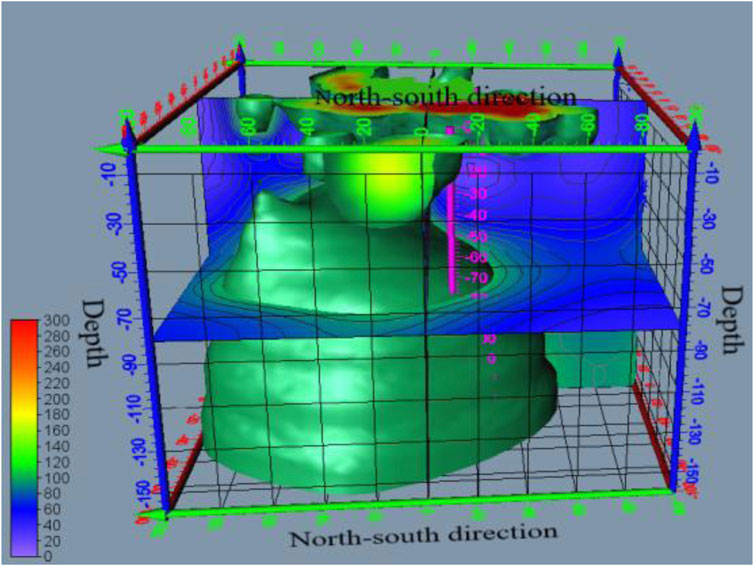
Figure 7. Three-dimensional view of the electrical exploration section and isosurface results map of the detection area (viewed from the west).
From the electrical exploration results map of the measurement area (Figure 8), it is seen that three faults or fracture zones are developed within this area. The overall trend in the southern area indicates a low-resistivity anomaly from shallow to deep, implying the existence of a fault or fracture zone (referred to as F2-1); the orientation of this is nearly east–west, with a southward dip at a steep angle, suggesting a development depth of greater than 200 m. The overall trend in the northern area indicates a high-resistivity anomaly from shallow to deep, implying that the thickness of the Quaternary and highly weathered layers decreases in the north as this fracture zone is situated at the boundary of the measurement area (referred to as F2-2).
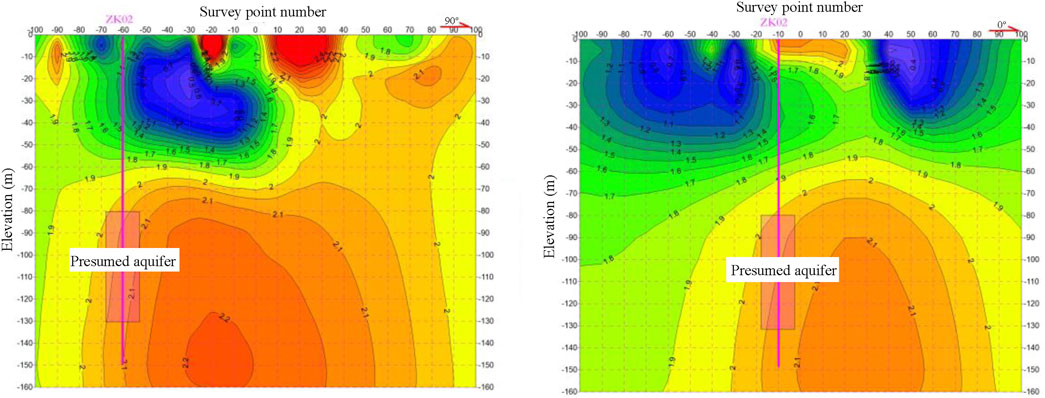
Figure 8. Three-dimensional electrical prospecting resistivity inversion result diagram of one-shaped layout.
The eastern part of the survey area exhibits generally higher resistivity, suggesting that the Quaternary and strongly weathered layers in this region are relatively thin. In contrast, the shallow resistivity in the western part is generally lower, indicating that the Quaternary and strongly weathered layers in the west are thicker than those in the east. The western area is characterized by faults, fracture zones, or caverns, where these structures are typically inclined to the west. They exhibit a gentle angle in the shallow sections and steepen at greater depths (designated as F2-3), as illustrated in Figure 9. The depth of the development exceeds 200 m, leading to the inference that this structure serves as a primary water-controlling feature.
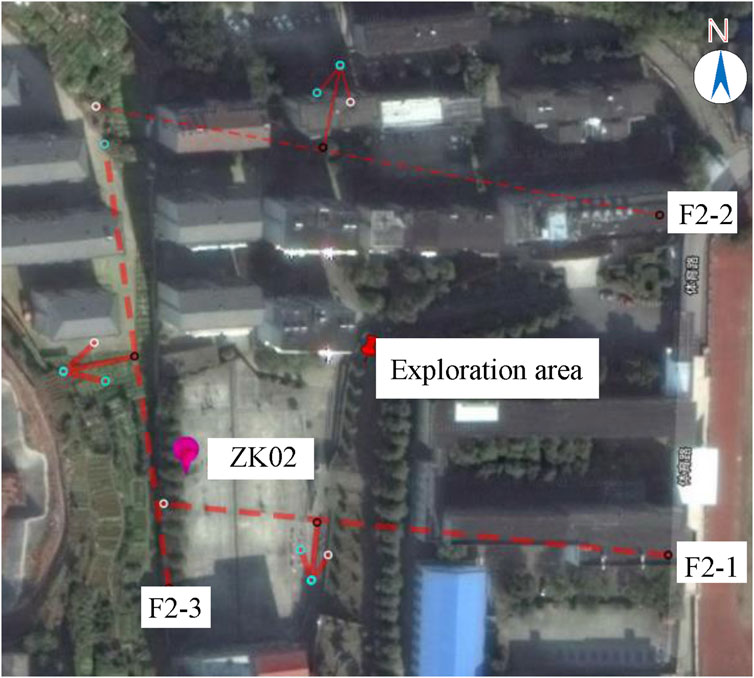
Figure 9. Three-dimensional electrical exploration plane results of the survey area.
4.2 Conventional 3D electrical application analysis
The inversion results of the complete 3D electrical exploration resistivity for the survey area are illustrated in Figure 10. A comparative analysis reveals that the resistivity variations obtained from both methods are similar in this area. This implies that the one-shaped layout of the 3D electrical method exhibits comparable accuracy to that of the complete 3D electrical method. However, the complete 3D electrical method requires 121 measurement points and 121 power supply points, resulting in a total of 14,520 electrical data collection points. In contrast, the application of the one-shaped layout with the 3D electrical method allows a reduction of up to 85.9% in terms of both the number of power supply points and volume of electrical data collected, which is more efficient for exploration compared to the conventional 3D electrical method.
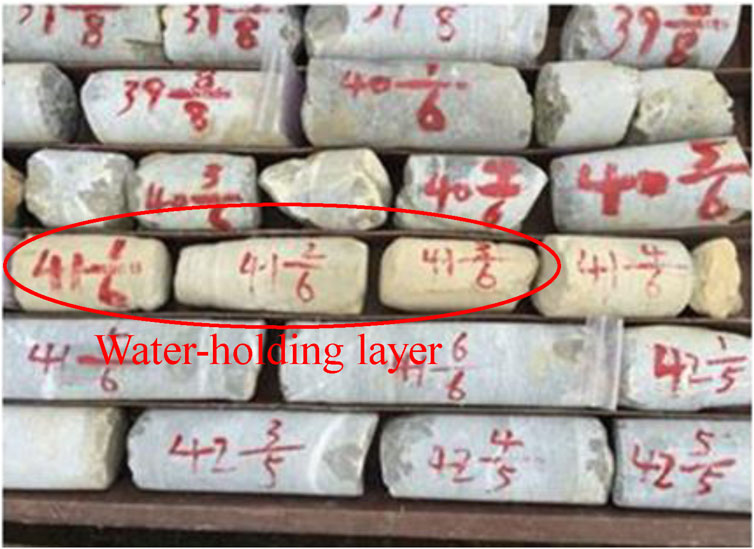
Figure 10. Resistivity inversion maps obtained with the conventional 3D electrical method.
4.3 Setting and verification of drilling
Based on the results obtained with the 1D and 3D electrical methods, three faults or fractures were identified in the survey area. The fissures developed in the upper bedrock create channels to facilitate the infiltration and replenishment of surface water. Furthermore, the gradually increasing resistivity at greater depth indicates the limited development of deep fractures within the fracture zone, which acts as a barrier to water and creates conditions favorable for groundwater accumulation. Consequently, a drilling hole is planned at ZK02 to target the aquifers beneath the Quaternary and highly weathered layer, primarily at depths below 80 m, as illustrated in Figure 11. These plans align with the results obtained from the aforementioned 3D electrical method.
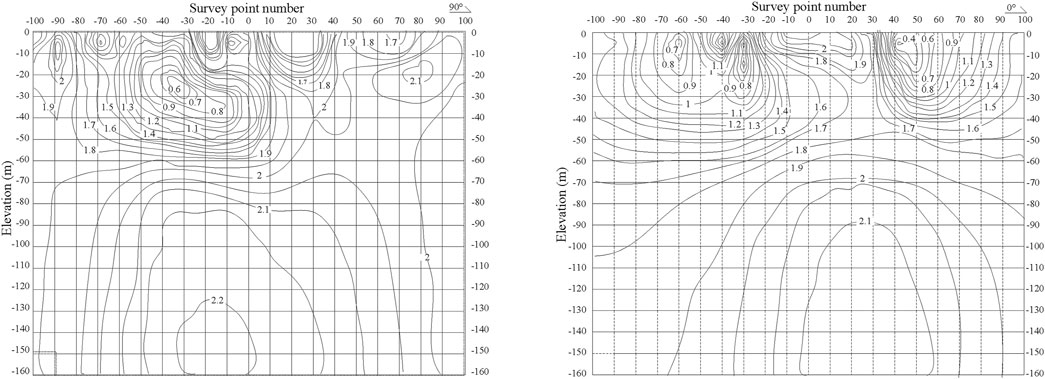
Figure 11. Drill-hole coring diagram.
5 Conclusion
The 3D electrical method is a key technique for groundwater exploration as it can effectively detect groundwater channels. In this paper, a new one-shaped layout is proposed for exploration based on the 3D electrical method, and its validity is assessed through practical engineering application to provide a reliable basis for the development and utilization of water resources in areas with complex topographical and geomorphological conditions. The specific conclusions of the present study are as follows:
(1) A new one-shaped layout model for the 3D electrical method is proposed. Initially, the X and Y directions of the electrical exploration are determined using the primary orientation of the geological anomalies in the exploration area. Then, the electrical grid parameters are established based on the measurement lengths in the X and Y directions as well as spacing between the measurement points in the exploration area. Finally, the coordinates of all power supply grids and their actual relative coordinates are calculated by arranging the power supply points in a one-shaped layout.
(2) Based on a groundwater exploration project in an urban area of Hunan Province, the feasibility of the proposed model layout was verified based on the results of the complete 3D electrical method and drilling. The reduction in the number of power supply points and data collection volume with the one-shaped 3D electrical method was 85.9% compared to the complete 3D electrical method. This indicates that the proposed model significantly improves exploration efficiency and produces excellent results compared to the traditional 3D electrical method.
(3) The new model offers considerable flexibility by allowing the selection of appropriate measurement line arrangements and point spacing based on different geological and geomorphological features of the survey area to accommodate various exploration zones effectively.
Data availability statement
The raw data supporting the conclusions of this article will be made available by the authors without undue reservation.
Author contributions
XW: conceptualization, methodology, and writing – original draft. MY: conceptualization, data curation, writing – original draft, and writing – review and editing. YZ: data curation, software, and writing – original draft. JL: data curation and writing – review and editing. HJ: data curation and writing – original draft.
Funding
The author(s) declare that financial support was received for the research and/or publication of this article. The research was supported by the Key R&D project of Hunan Province (no. 2024AQ2044), Natural Science Foundation Project of Hunan Province (no. 2024JJ6282), and Major Projects of Water Conservancy Science and Technology in Hunan Province (nos. XSKJ2023059-02, XSKJ2024064-2, XSKJ2024064-10, XSKJ2024064-9, and XSKJ2024064-6).
Conflict of interest
The authors declare that the research was conducted in the absence of any commercial or financial relationships that could be construed as a potential conflict of interest.
Generative AI statement
The authors declare that no Generative AI was used in the creation of this manuscript.
Publisher’s note
All claims expressed in this article are solely those of the authors and do not necessarily represent those of their affiliated organizations, or those of the publisher, the editors and the reviewers. Any product that may be evaluated in this article, or claim that may be made by its manufacturer, is not guaranteed or endorsed by the publisher.
References
Adamson, J., LaVanchy, T., Stone, B., Clark, J., and Taylor, M. (2021). Geological and hydrogeological assessment of the Brito Formation: Municipio de Tola, Nicaragua. Hydrogeol. J. 29 (6), 2285–2304. doi:10.1007/s10040-021-02360-w
Asaue, H., Koike, K., Yoshinaga, T., Tada-nori, G., and Yoshida, H. (2021). Development and application of a variable-frequency-based electric sounding system for increasing the accuracy of aquifer detection. Nat. Resour. Res. 30 (4), 3017–3034. doi:10.1007/s11053-020-09791-4
Bian, C., Lü, G., Zhang, H., Liu, J., Feng, C., Chen, T., et al. (2024). Hydrochemical characteristics and variation in karst groundwater in the Baiquan spring area of Xingtai over the last 30 years. Huan Jing Ke Xue 45 (9), 5277–5289. doi:10.13227/j.hjkx.202309208
Cardarelli, E., Donno, D., Uliveti, I., and Scatigno, C. (2018). Three-dimensional reconstruction of a masonry building through electrical and seismic tomography validated by biological analyses. Near Surf. Geophys 16 (1), 53–65. doi:10.3997/1873-0604.2017040
Chirindja, F., Dahlin, T., Juizo, D., and Steinbruch, F. (2016). Reconstructing the formation of a costal aquifer in Nampula Province, Mozambique,from ERT and IP methods for water prospection. Environ. Earth Sci. 76 (1), 36. doi:10.1007/s12665-016-6364-0
Dai, J., Wei, Z., Pan, Z., Yin, R., Wu, Y., and Guan, Z. (2024). Research on environmental geological problems caused by water and mud inrush in tunnels and long-term drainage: taking Chaoyang tunnel of Guinan high-speed railway as an example. Carbonate Evaporite 39 (4), 115. doi:10.1007/s13146-024-01036-2
Gong, C., Dai, J., Wan, Z., Zeng, H., and Zhang, H. (2024). Simulation of nitrate nitrogen concentrations and DOM characteristics in groundwater from southwest China's karst wetlands using an improved GMS model. Environ. Monit. Assess. 197 (1), 44. doi:10.1007/s10661-024-13473-6
Gong, S., Yang, Y., Lin, P., Wu, W., Zheng, C., Shi, F., et al. (2019). Three-dimensional electrical exploration methods for the mapping of polymetallic targets in Gansu Province, China. Geophys Prrospec 67 (7), 1929–1947. doi:10.1111/1365-2478.12787
Han, Y., Wang, Y., Tan, C., and Du, L. (2023). Research and application of 3D high density electrical method. J. Phys. Conf. Ser. 2651 (1), 012091. doi:10.1088/1742-6596/2651/1/012091
Huang, W., Sui, L., Wang, Y., Zhang, C., Jiang, D., Cai, X., et al. (2023). Study of the mining and aquifer interactions in complex geological conditions and its management. Sci. Rep. 13 (1), 9462. doi:10.1038/s41598-023-34947-6
Kevin, T., Abdurrahman, W., Nugroho, S., and Mariyanto, M. (2021). Analytical comparison of electrode configuration on 2D geoelectric method for identification of water seepage in the lake body. J. Phys. Conf. Ser. 1825 (1), 012019. doi:10.1088/1742-6596/1825/1/012019
Kouadio, K., Xu, Y., Liu, C. ; M., and Boukhalfa, Z. (2020). Two-dimensional inversion of CSAMT data and three-dimensional geological mapping for groundwater exploration in Tongkeng Area, Hunan Province, China. J. Appl. Geophys 183, 104204. doi:10.1016/j.jappgeo.2020.104204
Lu, C., Cheng, W., Yin, H., Li, S., Zhang, Y., Dong, F., et al. (2024). Study on inverse geochemical modeling of hydrochemical characteristics and genesis of groundwater system in coal mine area-a case study of Longwanggou Coal Mine in Ordos Basin. Environ. Sci. Pollut. R. 31 (11), 16583–16600. doi:10.1007/s11356-024-32153-z
Ou, Y., Zhang, P., Liu, C., Tan, L., and Sun, B. (2020). Comparative study of 3D joint inversion based on multi-section resistivity data. Aip Adv. 10 (8), 085102. doi:10.1063/5.0015601
Permanasari, P., Akbar, F., Handayani, G., and Hendarajaya, L. (2019). Determination of the type of soil using 2D geoelectric method and laboratory analysis for landslide area cililin west java. J. Phys. Conf. Ser. 1127 (1), 012042. doi:10.1088/1742-6596/1127/1/012042
Pilla, G., and Torrese, P. (2022). Hydrochemical-geophysical study of saline paleo-water contamination in alluvial aquifers. Hydrogeol. J. 30 (2), 511–532. doi:10.1007/s10040-021-02446-5
Reza, A., and Singh, S. (2023). Delineation of optimal locations for artificial groundwater recharge utilizing MIF and GIS in a semi-arid area. Environ. Earth Sci. 83 (1), 33. doi:10.1007/s12665-023-11338-8
Rupesh, P., and Sharma, S. (2021). High-resolution quasi-3D electric resistivity tomography for deciphering groundwater potential zones in lateritic terrain. Nat. Resour. Res. 30 (5), 1–15. doi:10.1007/S11053-021-09888-4
Wu, Z., Wang, X., Li, J., Cui, J., and Zhang, B. (2024). Hydrochemical constraints on the flowing paths of groundwater in limestone reservoirs beneath the Pingdingshan coalfield in north China. Acta Geol. Sin-Engl 98 (6), 1615–1636. doi:10.1111/1755-6724.15255
Xiong, Z., Tang, X., Li, D., and Zhao, C. (2019). Numerical simulation of 3D borehole-to-surface electrical method. Acta Geol. Sin-Engl 93 (s1), 340–341. doi:10.1111/1755-6724.14125
Yuan, K., Liu, H., Yao, Y., and Chen, X. (2024). Research on precise detection of landfill based on high density resistivity method. J. Phys. Conf. Se 2895 (1), 012021. doi:10.1088/1742-6596/2895/1/012021
Keywords: 3D electrical method, one-shaped layout, karst groundwater channel, detection efficiency, engineering application
Citation: Wang X, Yang M, Zhu Y, Liang J and Jiang H (2025) New exploration model and engineering application of urban karst groundwater channel based on the 3D electrical method. Front. Earth Sci. 13:1578357. doi: 10.3389/feart.2025.1578357
Received: 17 February 2025; Accepted: 19 March 2025;
Published: 22 April 2025.
Edited by:
Pengfei Liu, CCCC Second Harbor Engineering Co., Ltd., ChinaReviewed by:
Youjun Guo, Geological Survey Institute of Hunan Province, ChinaJiabin Yan, Central South University, China
Copyright © 2025 Wang, Yang, Zhu, Liang and Jiang. This is an open-access article distributed under the terms of the Creative Commons Attribution License (CC BY). The use, distribution or reproduction in other forums is permitted, provided the original author(s) and the copyright owner(s) are credited and that the original publication in this journal is cited, in accordance with accepted academic practice. No use, distribution or reproduction is permitted which does not comply with these terms.
*Correspondence: Mingwei Yang, aG5pd2hyQDE2My5jb20=