 Shanhong Zhang
 Qing Meng1
- 1Shaanxi Field Research Station of Ecohydrology at the Southern Qinling Mountains, Shangluo University, Shangluo, Shanxi Province, China
- 2School of Urban and Environment, Northwest University, Xi’an, China
- 3Xi’an Botanical Garden of Shaanxi Province, Institute of Botany of Shaanxi Province, Shaanxi Engineering Research Centre for Conservation and Utilization of Botanical Resources, Xi’an, China
To reveal the responses of plant phenology and climate change in the Qinling Mountains region, the phenological data of seven woody plants in the Qinling Mountains region from 1964 to 2020 were selected to analyze the patterns and characteristics of plant phenological changes in the Qinling Mountains region and explore the factors influencing temperature sensitivity changes during the spring phenology. The results revealed the following: (1) In the 60-year study period, the spring phenology of plants in the Qinling Mountains region showed an extremely significant advancing trend, the autumn phenology showed an extremely significant delaying trend, and the growth period of phenology increased. There was consistency between the plant phenological change and climate change in the Qinling Mountains region; that is, the year of the spring and autumn phenology change was basically the same as that of the climate change. (2) The temperature sensitivity of spring phenology showed a significant decreasing trend before the abrupt change but showed an insignificant increasing trend after the abrupt change. (3) The rate of change in spring temperature was the main factor affecting the change in temperature sensitivity of spring phenology. The temperature change rate is large in spring, the sensitivity of phenological temperature decreases in spring, the temperature increases steadily in spring, and the sensitivity of phenological temperature increases in spring. (4) Changes in the temperature zone are important causes of changes in temperature sensitivity of the spring phenology.
1 Introduction
Phenological phenomena refer to natural changes that occur annually and are influenced byclimate, hydrology, soil and other factors (Zhu and Phenology, 1973; Zhang, 1985). The leaf expansion period of plants is also known as the spring phenology; the leaf discoloration period of plants is also known as the autumn phenology. The focus of this study is on the spring phenology and autumn phenology of plant. Studies have showed that plant phenology has undergone significant changes in the context of climate Warming (Menzel et al., 2006; Elinger and Heimann, 1996; Wu et al., 2014). Changes in plant phenology can reflect the growth of vegetation. Under climate warming, plant phenology can exhibit sensitive responses of terrestrial ecosystems to climate change (Zhang et al., 2015; Song et al., 2010; Linderholm et al., 2008). Therefore, plant phenology is known as the “diagnostic fingerprint” of global change and the “language of nature” (Root et al., 2003; Schwartz, 1994). With the intensification of global warming, scholars at home and abroad have conducted extensive research on plant phenology and its response to climate change, which is highly important for addressing climate change and mitigating its impact on the global ecosystem.
Traditional ground-based observations excel in monitoring individual species with high temporal resolution and detailed information but are often geographically limited and data-intensive. In contrast, remote sensing technology, enabled by advancements in 3S technology, facilitates regional phenological monitoring by capturing large-scale vegetation index changes (Bhattacharjee et al., 2024; Bechkit et al., 2024). This approach offers advantages such as broad spatial coverage, strong temporal continuity, and diverse species representation. Furthermore, unmanned aerial vehicle (UAV) aerial photography, as well as advanced experimental and model analysis are used to predict and monitor changes in phenological data, supplementing these methods by providing high-precision phenological data (Lama and Crimaldi, 2022; Pirone et al., 2024; Giovannini et al., 2025; Pasquino et al., 2025), enhancing long-term monitoring capabilities in complex regions.
Temperature is the determining factor affecting the spring phenology, and as temperatures rise, the spring phenology advances, especially in the middle to high latitudes of the Northern Hemisphere (Jeong et al., 2011; Yu et al., 2010). In recent years, as the climate has warmed, the spring phenology of most plants in temperate regions of the Northern Hemisphere has clearly advanced (Ge et al., 2015; Menzel et al., 2006; Walther, 2004; Xu et al., 2019), while there are significant differences in the changes at the autumn phenology. The number of days during which vegetation phenology begins to change for every 1°C increase in temperature is called temperature sensitivity (Fu et al., 2015). In recent years, both domestic and international scholars have conducted extensive research on temperature sensitivity of spring phenology. For example, Fu et al. (Fu et al., 2014b) studied seven widely distributed woody plants in Europe from 1980 to 1994 and from 1999 to 2013 and reported that the temperature sensitivity of spring phenology decreased during both periods. However, compared with that in the previous period, the temperature sensitivity of spring phenology decreased by 40% in the latter period. However, when both research periods were extended to 30 years, there was no significant difference in temperature sensitivity of spring phenology between the research periods of 1984∼2013 and 1951∼1980 (Wang et al., 2017). Chen et al. (2019) studied four typical woody plants in Europe and reported that during the study periods of 1981–2013 and 1951–1980, the sensitivity of spring phenology in the later stage tended to decrease, whereas the sensitivity of spring phenology in the earlier stage tended to increase. Domestic scholars have studied the phenological sensitivity of typical woody plants in Northeast China, and the results revealed that the temperature sensitivity of spring phenology decreased during the warm period from 1988 to 2016 and the cold period from 1962 to 1987 (Dai, 2020). Another scholar studied the temperature sensitivity of more than 50 woody plants in temperate and subtropical regions of China and reported that the temperature sensitivity of subtropical plants at the spring phenology mostly tended to decrease, whereas in temperate regions, the temperature sensitivity of most plants at the spring phenology tended to increase (Xu et al., 2019). These findings indicate that different scales of research and temperature zones in which plants are located may lead to changes in temperature sensitivity of spring phenology at different times.
There is currently no unified answer in the academic community regarding the reasons for the changes in temperature sensitivity of spring phenology over time. There are four main viewpoints. The first viewpoint is that the changes in temperature sensitivity of spring phenology are related to the amount of cold shock in winter. As winter temperatures increase, the amount of cold shock experienced by plants decreases, the speed of leaf expansion decreases, and the temperature sensitivity of spring phenology decreases (Cook et al., 2012; Pope et al., 2013). The second viewpoint suggests that the temperature sensitivity of spring phenology is closely related to the rate of change in spring temperature. When the rate of temperature change is high in spring, disasters such as frost may occur; however, plants adapt to the environment through years of adaptation. When the rate of temperature change is high in spring, vegetation uses strategies to reduce temperature sensitivity to prevent premature leaf expansion and avoid frost disasters during germination and leaf expansion, thereby reducing the risk of frost disasters in early spring. The third viewpoint is that the temperature sensitivity of spring phenology is related to the photoperiod. Some plants are long-day plants. When the spring phenology is advanced and plant development reaches the photoperiod threshold, the spring phenology no longer advances, and the temperature sensitivity of spring phenology tends to decrease. The fourth viewpoint is that the temperature sensitivity of spring phenology may be related to temperature zones, which is also the viewpoint proposed in this article. The vegetation in temperate and subtropical regions has different demands for winter cold shock, and the accumulated temperature required for plant germination also varies. The winter cold shock required for the onset of vegetation phenology in subtropical regions is relatively low, and the accumulated temperature required for plant germination is also relatively low. Therefore, if the temperature zone in which vegetation is located changes, the sensitivity of plant phenology to temperature at the spring phenology also changes. Of course, some scholars believe that the temperature sensitivity of spring phenology may not be dominated by a single factor, but may be a complex combination of meteorological factors, especially the interaction between temperature and precipitation (Cong et al., 2021).
In this study, the phenological data of seven typical woody plants from the Xi’an station, which was the only site for phenological observations in the Qinling region of the China Phenology Observation Network from 1964 to 2020, are used to study the changes in and characteristics of plant phenology in the Qinling region. The aims of this study are to reveal the changes in temperature sensitivity of spring phenology in the transitional zone of climate against the background of climate change, the response of phenological changes to climate change, and the impact of temperature zone changes on plant phenology. The findings confirm the consistency between temperature zone changes and phenological changes and provide a scientific basis for the timely adjustment of agricultural and forestry production patterns in the Qinling region.
2 Overview of the study area
The Qinling Mountains stretch across the middle of China; they represent a large mountain range that runs from east to west and generally coincides with the January 0°C isotherm and 800 mm equipluve in China (Bai et al., 2019). The height and medium-height mountains in the Qinling Mountains generally have altitudes of 1,500–3,000 m, resulting in diverse climates and obvious vertical zoning characteristic of the mountains (Bai et al., 2019). As the altitude increases, vertical climate zones, such as the warm temperate zone, middle temperate zone, and cold temperate zone, are successively present (the southern slope has a northern subtropical zone below the warm temperate zone). The climate difference between the northern and southern Qinling Mountains is significant. The northern slope has a warm temperate semiarid and semihumid monsoon climate, with warm temperate deciduous broad-leaved forests as the base zone, whereas the southern slope has a northern subtropical humid monsoon climate, with mixed evergreen deciduous broad-leaved forests as the base zone (Lu and Lu, 2019). Qinling is an important area for conservation and as a water source for the Yangtze River and Yellow River and is therefore known as the “central water tower” of China. In this study, the narrow Qinling Mountains are taken as the research area, which is the hinterland of the Qinling Mountains in Shaanxi Province, located between 105° 30′−111° 05′E and 32° 40′−34° 35′N (Figure 1). This area starts from the Jialing River in the west, connects with Funiu Mountain in the east, is bounded by the Weihe River in the north, and is bordered by the Han River in the south. The Qinling Mountains are located in the transitional zone between warm temperate and subtropical regions, and are sensitive to climate change. Therefore, the vegetation phenology in the Qinling Mountains will also be very sensitive to climate change.
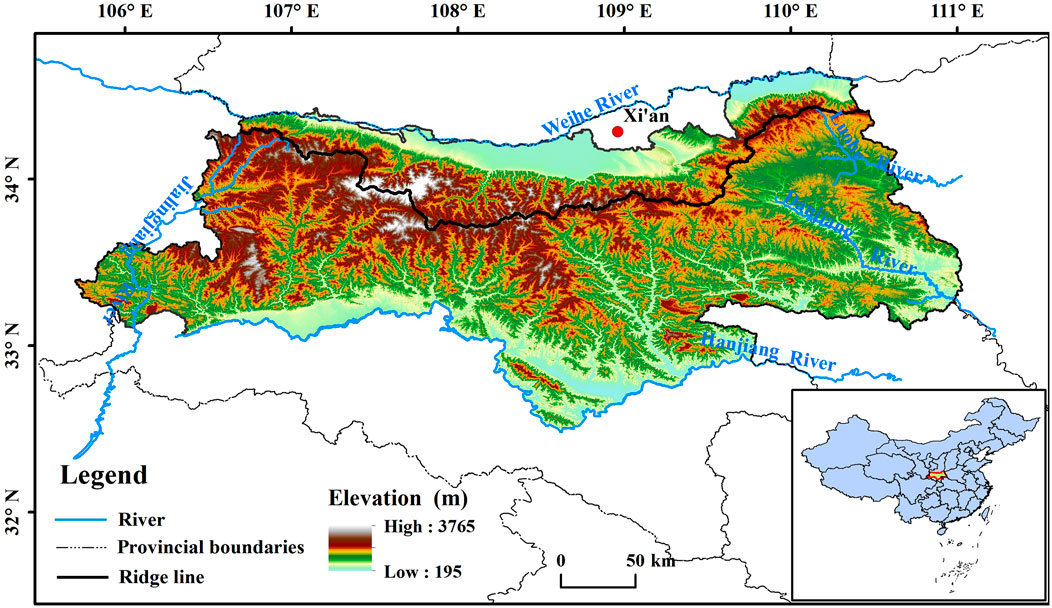
Figure 1. Geographical location of the study area
3 Data and methods
3.1 Research data
Phenological data: The spring phenology and autumn phenology data are of the 7 woody plants with the most complete and widely distributed recorded times in the study area from 1964 to 2020. The data are sourced from the Xi’an Station of the China Phenology Observation Network, which is located in the Xi’an Botanical Garden in Shaanxi Province (Cuihua South Road Botanical Garden). Table 1 shows the information of the 7 observed tree species.
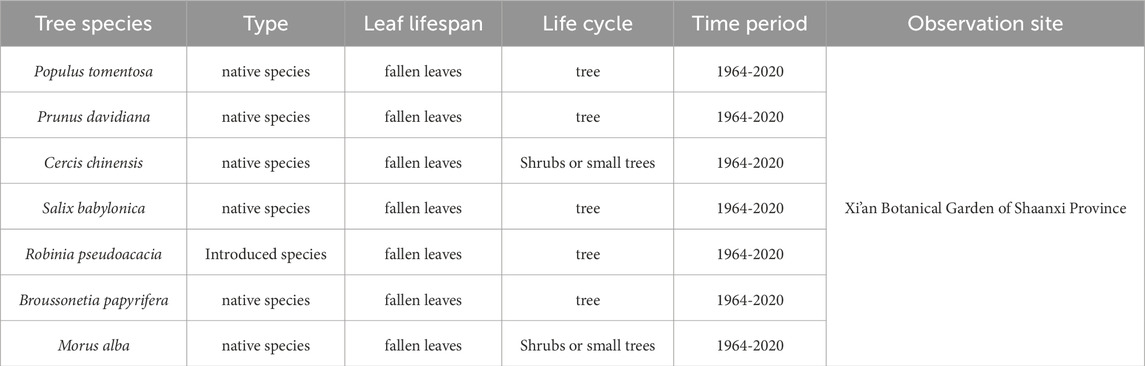
Table 1. Information on the 7 observed tree species.
Meteorological data: The daily average temperature, maximum temperature, and minimum temperature data from November 1963 to 2008 for Xi’an station and the daily average temperature, maximum temperature, and minimum temperature data from 2006 to 2020 for the Jinghe meteorological station are selected. The data are sourced from the Shaanxi Provincial Meteorological Service Center.
The data from two meteorological stations, namely, Xi’an and Jinghe, are used because, in 2005, the Xi’an meteorological station was relocated from its original location on Weiyang Road in the urban area to Jinghe station, which is 20 km away in the suburbs. The two stations have common observational data from 2006 to 2008, and Xi’an station was closed in 2009. Owing to the proximity of Xi’an station to the Xi’an Botanical Garden in Shaanxi Province, the temperature data from Jinghe station from 2009 to 2020 are homogenized to those of Xi’an station via the 3-year observation data shared by the two stations. In addition, the sine curve model is used to simulate daily temperature variations by simulating daily minimum and maximum temperatures, generating hourly temperature data, and calculating the number of cold shock days. The specific method of calculation is described in Reference (Chow and Levermore, 2007).
3.2 Research methods
3.2.1 Method for calculating the phenological period
The times of spring phenology and autumn phenology are calculated using the Day of Year (DOY), which represents the cumulative number of days in an annual sequence starting from January 1st of the current year, yielding the time series of spring phenology and autumn phenology (Deng, 2018; Deng et al., 2017). The duration from the spring phenology to the autumn phenology is referred to as the phenological growth period.
3.2.2 Method for calculating the number of cold shock days
The number of cold shock days is calculated using hourly temperature data. When the hourly temperature is lower than the threshold temperature Tchill, it is considered a cold shock. The accumulated sum of 24-h cold shocks is divided by 24 to obtain the number of cold shock days. The specific formulae are as follows (Equations 1, 2):
FCDH represents the number of cold days, whereas tchill0 and tchill1 denote the start and end dates of cold shock, which are set to November 1 of the previous year and the beginning of leaf expansion (spring phenology), respectively. The threshold temperature Tchill is set to 5°C (Tao et al., 2020a).
3.2.3 Method for calculating temperature sensitivity of spring phenology
First, the temperature-dependent period (TRP) (Dai et al., 2013; Matsumoto et al., 2003), during which the temperature has the most significant impact on the spring phenology, which is defined as the period when the average temperature before the season has the most significant impact on leaf development (Xu et al., 2019), is determined. The Pearson correlation coefficient between the average temperature of each period (15 days, 30 days, 45 days, 60 days, 75 days, 90 days, 105 days, and 120 days before spring phenology) and the spring phenology sequence is calculated via sliding units of 15 days before the average spring phenology. The period with the highest absolute value of the correlation coefficient is the period of the response of spring phenology to preseason temperature (Tao et al., 2020b). The slope of the regression equation between the period of spring phenology and the average temperature during the response period is the temperature sensitivity of spring phenology (Xu et al., 2019).
To estimate the trend of temperature sensitivity of spring phenology, continuous 15-year time windows (e.g., 1964–1978, 1965–1979, 1976–1990, 2006–2020) is first selected. A linear regression is subsequently performed between the spring phenology and the average temperature response time within the stated 15-year time window to obtain the temperature sensitivity of plant spring phenology within the time window. Finally, a linear regression was performed between the temperature sensitivity of spring phenology and the end year of the 15-year moving time window to obtain the regression coefficient, which represents the rate of change in temperature sensitivity of spring phenology.
4 Results and analysis
4.1 Characteristics of plant phenological changes in the Qinling Mountains over the past 60 years
4.1.1 Trend of phenological changes in plants in the Qinling Mountains from 1964 to 2020
Figure 2 shows the trends at the spring phenology, autumn phenology, and plant growth period of seven tree species in the Qinling Mountains from 1964 to 2020. Table 2 shows the linear changes at the spring phenology and autumn phenology for the seven tree species in the Qinling Mountains. As shown in Figures 2a,b, the average spring phenology of the seven tree species significantly advanced from 1964 to 2020, with an average advance of approximately 1.5 days per decade. The average autumn phenology showed a significant delay, with a delay of approximately 4.2 days per 10 years. As shown in Table 2, the spring phenology of the seven woody plants occurred between days 62 and 117, and the autumn phenology occurred between days 281 and 365. The spring phenology of the seven woody plants showed an early trend, whereas the autumn phenology showed a late trend. At the spring phenology, the rate of advance of trees was the highest, at approximately 2.4 days per 10 years, followed by that of Prunus davidiana, redbud, locust, and Populus tomentosa, at approximately 1.4–1.8 days per 10 years. However, the changes at the spring phenology in Morus alba and Salix babylonica trees did not reach a significant level. For the autumn phenology, all 7 tree species tended to be delayed. Among them, the rate of delay for S. babylonica was the highest, i.e., approximately 5.8 days per 10 years, followed by the rate of delay for Broussonetia papyrifera, i.e., approximately 5.7 days per 10 years. In addition, the rates of delay for M. alba, P. tomentosa, and Cercis chinensis reached a significant level, while the rates of delay for Robinia pseudoacacia and Prunus persica also reached a significant level.
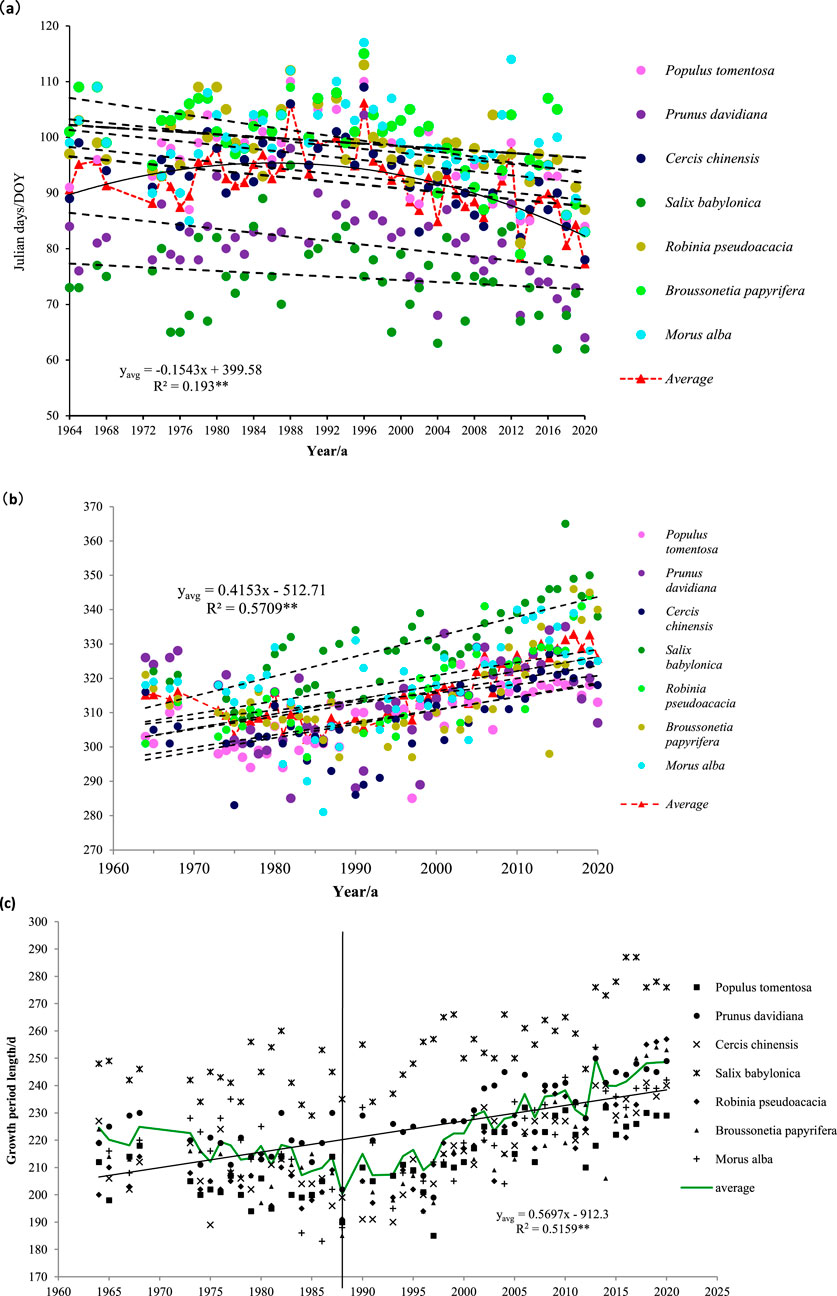
Figure 2. Changes in spring phenology, autumn phenology and growth period of the 7 tree species in Qinling Mountains from 1964 to 2020. (a) Spring phenology (b) autumn phenology (c) growth period.
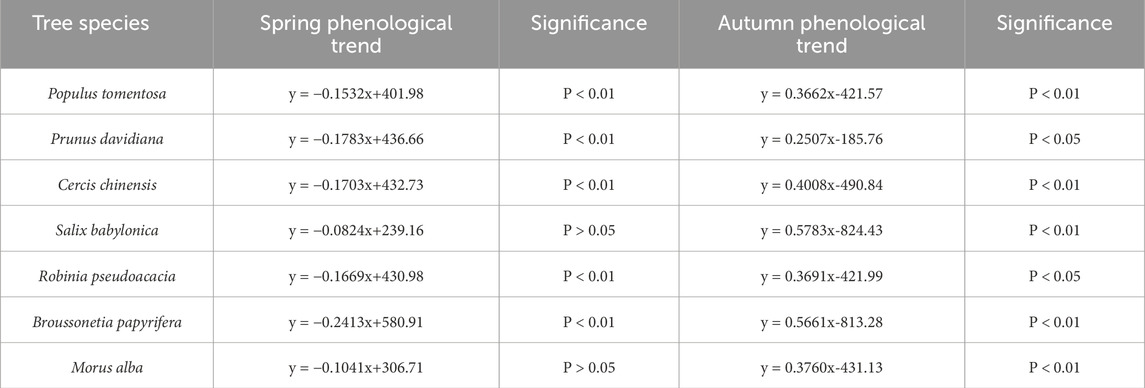
Table 2. Phenological changes of spring and autumn phenology of the 7 tree species in Qinling Mountains from 1964 to 2020.
As can be clearly seen from Figure 2c, the phenological growth period has shown a very significant increasing trend, with an average extension of about 5.7 days per 10 years. However, the growth period of weeping willow deviates more from the average growth period of the seven tree species, which may be due to the fact that weeping willow expands its leaves earlier in spring than other tree species, and falls leaves later in autumn than other tree species. As is evident from Figure 2C, there are two phases in the phenological growth period, with 1988 as the boundary. In the former phase (1964–1988), the growth period showed a decreasing trend, while in the latter phase (1988–2020), the growth period showed an increasing trend.
In summary, the spring phenology of vegetation in the Qinling region has advanced, the autumn phenologyhas been delayed, the growth period has increased, and the number of days of delay in the autumn leaf-falling period (autumn phenology) has contributed more to the extension of the growth period than the number of days of advance in the spring leaf-spreading period (spring phenology).
4.1.2 Analysis of phenological changes in plants in the Qinling Mountains
On the basis of the analysis in Section 4.1.1, in which the growth period of plant phenology in the Qinling Mountains is divided into two stages, it can be speculated that there are years of changes in the phenological period. Figure 3 shows the binomial fitting curve of the mean changes at the spring phenology and autumn phenology for the 7 tree species. Figure 3 shows that the fitting curves for the spring phenology and autumn phenology are in the form of quadratic parabolas with opposite directions, i.e., opening upward and opening downward; thus, there is a turning point where the slope of the curve is 0, which represents the year when the spring phenology and autumn phenology undergo a sudden change. Calculations reveal that spring phenology of the plants in the Qinling Mountains underwent a change in 1988, and autumn phenology underwent a change in 1984.
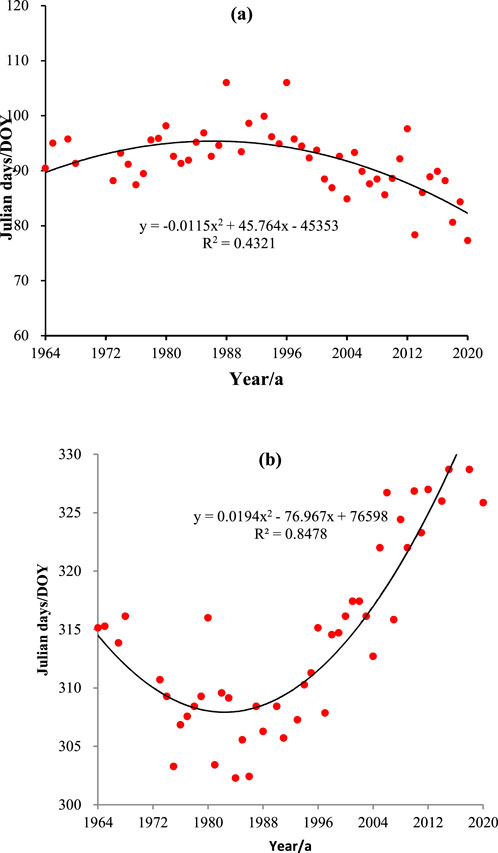
Figure 3. Changes in the spring and autumn phenology of 7 tree species in Qinling Mountains from 1964 to 2020. (a) Spring phenology (b) autumn phenology.
The abrupt change in climate warming in China occurred in 1984 (Zhang et al., 2021), while the spring phenology in the Qinling Mountains changed abruptly in 1988, and the autumn phenology changed abruptly in 1984, indicating that the abrupt change in plant phenology in the Qinling Mountains tended to respond to climate warming in China. Other studies have shown that the temperature zone in Xi’an underwent a sudden change prior to 1989, with the region previously classified as a warm temperate zone and now classified as a subtropical transition zone (Zhang et al., 2021). The plant phenological changes occurred in approximately 1986 and 1987, with durations of 1–2 years. The period of phenological change is almost the same as the period of temperature zone change, reflecting the consistency between phenological changes and temperature zone changes. This finding indicates that the years of abrupt changes at the spring phenology and autumn phenology are largely consistent with the years of abrupt climate changes, suggesting that plant phenological changes are a direct reflection and confirmation of climate warming.
Figure 4 shows the trends of changes in the spring phenology and autumn phenology dates of seven tree species in Qinling Mountains before and after the change. As shown in Figure 4a, the spring phenology before the change showed a nonsignificant trend of delay, whereas the spring phenology after change showed a highly significant advancing trend. The rates of delay and advance in spring phenology before and after the change were 1.9 d/10a and 5.3 d/10a, respectively. Before the change, the autumn phenology significantly advanced, whereas after the change, the autumn phenology was significantly delayed (Figure 4b). The rates of advance and delay at the autumn phenology before and after the change were 4.6 d/10a and 8.2 d/10a, respectively.
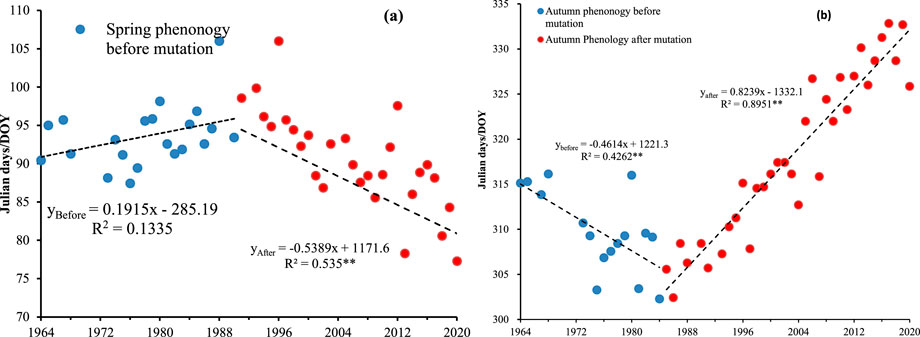
Figure 4. Trends of phenological changes before and after abrupt changes of 7 tree species in Qinling Mountains. (a) Spring phenology (b) autumn phenology.
4.2 Sensitivity of spring phenology to temperature
4.2.1 Selection of the temperature response period for the spring phenology
Scholars have different views (Menzel A et al., 2006) on the most significant stage of the impact of preseason temperature on the spring phenology (TRP); these views includes the following two main viewpoints. The first viewpoint defines the optimal period of influence as the time before the average spring phenology (with steps of 15 d, 30 d, 45 d, 60 d, 75 d, 90 d, 105 d, and 120 d), during which the correlation coefficient between the spring phenology and temperature is the highest (Fu et al., 2014a). The second viewpoint is that the average temperature from March–April each year has the greatest impact on the spring phenology (Wang et al., 2019); thus, a correlation analysis can be conducted between the average temperature from March–April each year and the spring phenology to analyze the changes in temperature sensitivity of spring phenology. However, some studies have suggested that the spring phenology has advanced over the past few decades and that the length of the optimal phase of impact has significantly changed. Therefore, the time scale of the study period can affect the change in temperature sensitivity of spring phenology (Fu et al., 2015; Tao et al., 2020b).
To verify the differences in the temperature sensitivity of spring phenology obtained by the two methods, i.e., correlating months and finding the optimal correlation stage, in this study, the average temperature from March to April each year is used as the most significant stage in which temperature affects the plant spring phenology, and the time before the average spring phenology (with steps of 15 d, 30 d, 45 d, 60 d, 75 d, 90 d, 105 d, and 120 d) is used as the optimal correlation stage. The temperature sensitivities calculated by these two methods are shown in Figure 5. The reliability of the temperature sensitivity of spring phenology obtained by the two methods is verified using one-way analysis of variance. The verification revealed that the difference in temperature sensitivity of spring phenology between the two methods was not significant (p value = 0.9698 > 0.05; see Table 3). A comparison of the temperature sensitivities obtained by the two methods revealed that the determination coefficients for temperature responses during the relevant stages of typical plant spring phenology in the Qinling Mountains were generally greater than those for the relevant months. Therefore, the optimal stage of spring phenological temperature sensitivity was selected for analysis.
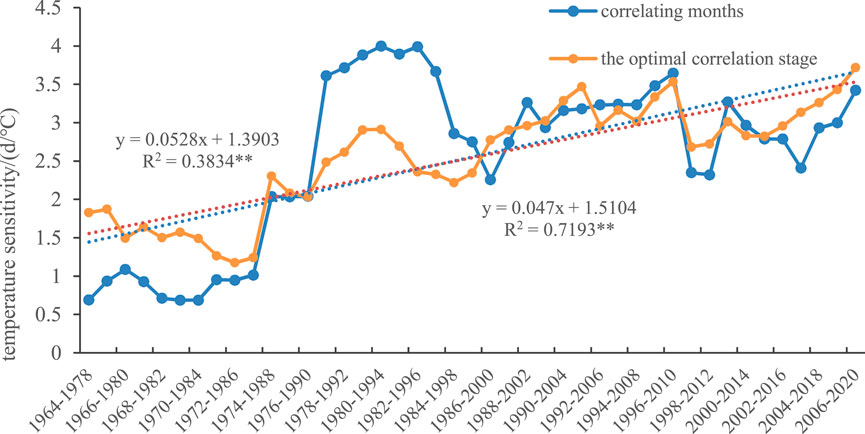
Figure 5. Temperature sensitivity of spring phenology obtained via the two methods.

Table 3. Single-factor ANOVA Table.
4.2.2 Analysis of temperature sensitivity of spring phenology
Figure 6 shows the change in the temperature sensitivity of spring phenology of the 15-year sliding window before and after the change. As shown in Figure 6, the temperature sensitivity of the spring phenology showed a significant decrease before the change but a nonsignificant increase after the change. Before the change (Figure 6a), the temperature sensitivity of spring phenology significantly decreased by 0.71 d°C (10a)−1, from an initial value of 1.83 d/°C to a later value of 1.30 d/°C, which was a decrease of 28.7%. After the change (Figure 6b), the sensitivity of the spring phenology showed a fluctuating increase in the early stage and a continuous increase in the later stage. After the change, the sensitivity of the spring phenology increased by 0.08 d°C (10a)−1, from 2.96 d/°C at the beginning to 3.72 d/°C later, which was an increase of 0.76 d/°C, or 25.68%. Overall, before the change in the spring phenology, the temperature sensitivity of spring phenology gradually weakened, and after the change, the temperature sensitivity of spring phenology increased.
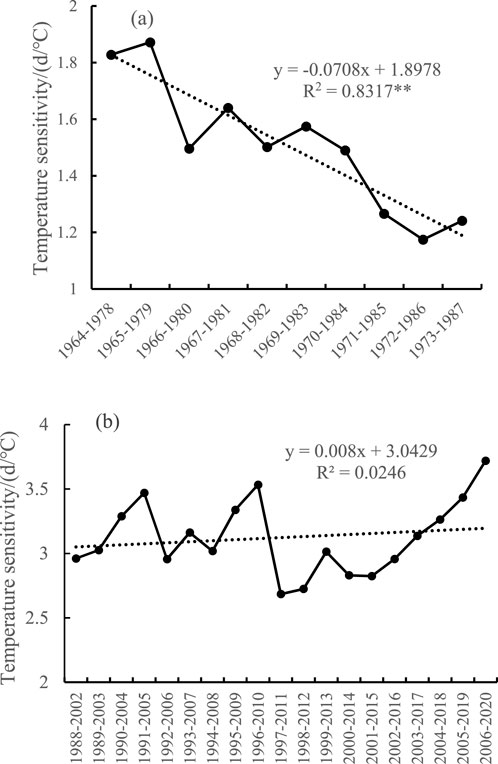
Figure 6. Changes in the 15-year sliding temperature sensitivity before and after mutation of the spring phenology change for the 7 tree species in the Qinling region. (a) Temperature sensitivity before mutation of the spring phenology; (b) temperature sensitivity after mutation of the spring phenology.
4.3 Factors influencing temperature sensitivity changes of spring phenology
4.3.1 Impact of cold shock in winter
As the climate warms in recent decades, the spring phenology in most regions of the Northern Hemisphere has gradually advanced, but the temperature sensitivity of spring phenology has varied during different periods. According to recent studies (Chen et al., 2019; Dai, 2020), an important reason for the change in temperature sensitivity of spring phenology is the change in the amount of cold shock in winter. As the climate warms, especially with increasing winter temperatures, the amount of cold shock experienced by plants decreases, the rate of leaf expansion decreases, and the temperature sensitivity of spring phenology decreases.
In this study, the number of days with cold shock in winter significantly decreased in the first (1964–1987) (Figure 7a) and second (1988–2020) (Figure 7b) studied periods, but the directions of temperature sensitivity changes of spring phenology differed, with downward and upward trends, respectively. This finding indicates that the main reason for the change in the temperature sensitivity of plant phenology in the Qinling Mountains was not the reduction in cold shock in winter.
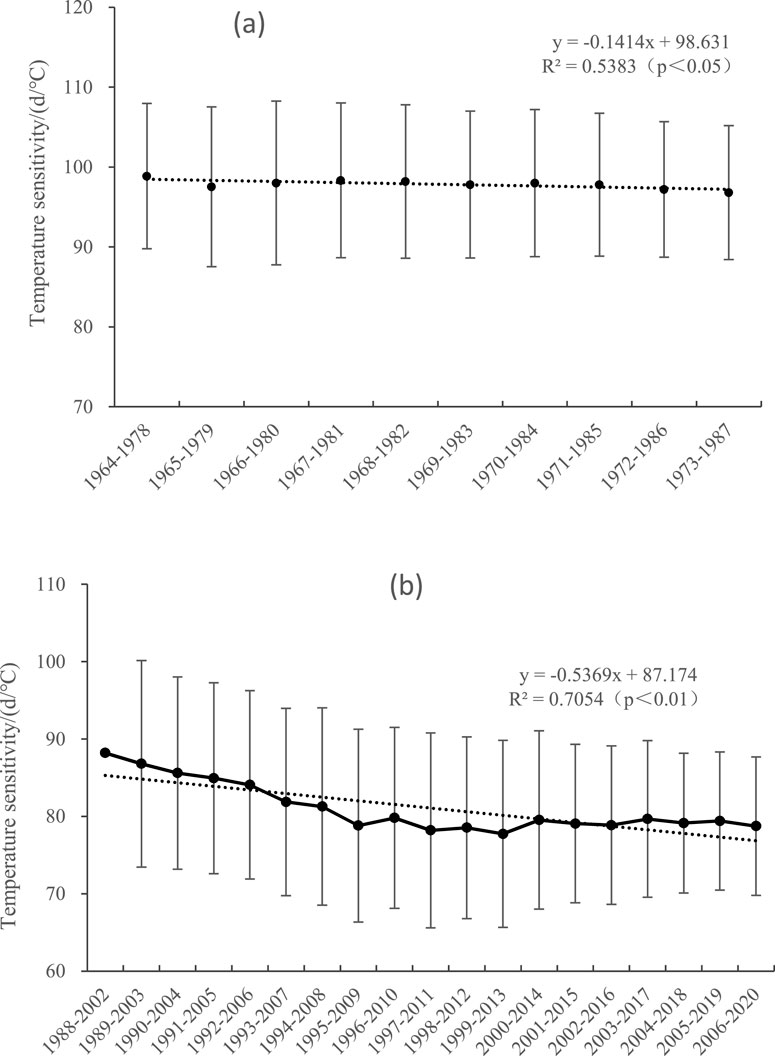
Figure 7. Changes in the number of cold shock days from 1964 to 1987 and from 1988 to 2020 (15-year sliding window). (a) Changes in the number of cold shock days before mutation of the spring phenology; (b) changes in the number of cold shock days after mutation of the spring phenology.
4.3.2 Impact of the rate of temperature change in spring
Generally, the large temperature variability in spring is prone to frost damage events (Vitasse et al., 2014), so the main reason for the significant decrease in temperature sensitivity of spring phenology is the change in spring temperature (Wang et al., 2014; Guralnick et al., 2024). Plants adopt an adaptation strategy of reducing temperature sensitivity to avoid frost damage (Vitasse et al., 2018). Figure 8 shows the standard deviation of the preseason spring temperature at the spring phenology from 1964 to 2020. As shown in Figure 8, the temperature in spring before the sudden change fluctuated greatly (Figure 8a), whereas the temperature in spring after the sudden change stabilized (Figure 8b). In other words, before the change, the temperature variation in spring was large, and the temperature sensitivity of spring phenology decreased. After the change, the temperature variation in spring was relatively small, and the temperature sensitivity of spring phenology increased. This finding indicates that the change in spring temperature is an important reason for the change in temperature sensitivity of spring phenology.
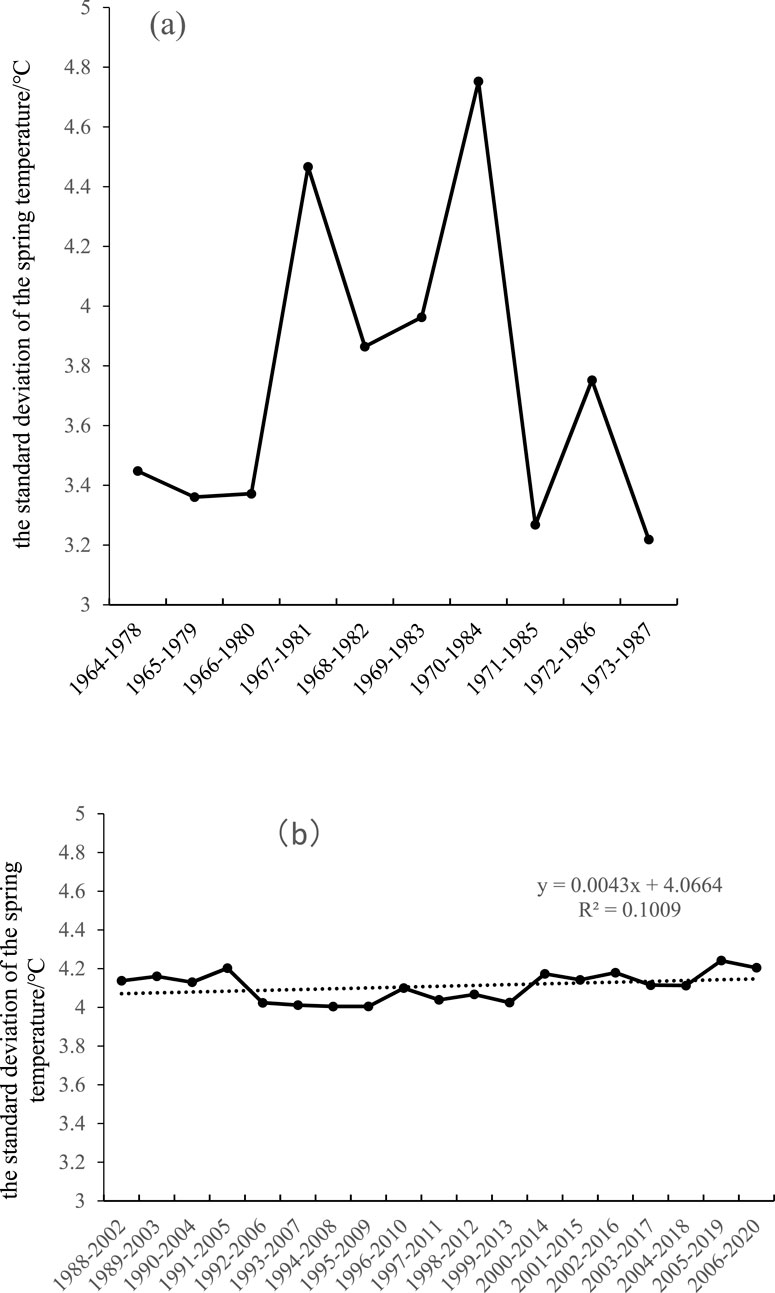
Figure 8. Changes in the standard deviation of the spring temperature before and after sudden temperature changes (15-year sliding window). (a) Changes in the standard deviation of the spring temperature before temperature changes; (b) changes in the standard deviation of the spring temperature after sudden temperature changes.
A comparison of the trends in the average preseason temperature and the rate of change in the preseason temperature (Figure 9) revealed that during periods of significant preseason temperature fluctuations, regardless of whether the temperature was increasing or decreasing, the temperature sensitivity of spring phenology tended to decrease. The preseason temperature increased, and the temperature change rate was small, which increased the temperature sensitivity of spring phenology. Therefore, the temperature variability in spring was high, the temperature sensitivity of spring phenology decreased, the temperature in spring increased steadily, and the temperature sensitivity of spring phenology increased. The impact of the rate of temperature change in spring on the sensitivity of the spring phenology reflects the adaptation of the spring phenologyof plants to local climatic conditions and the ability of plants to adapt to environmental changes over many years.
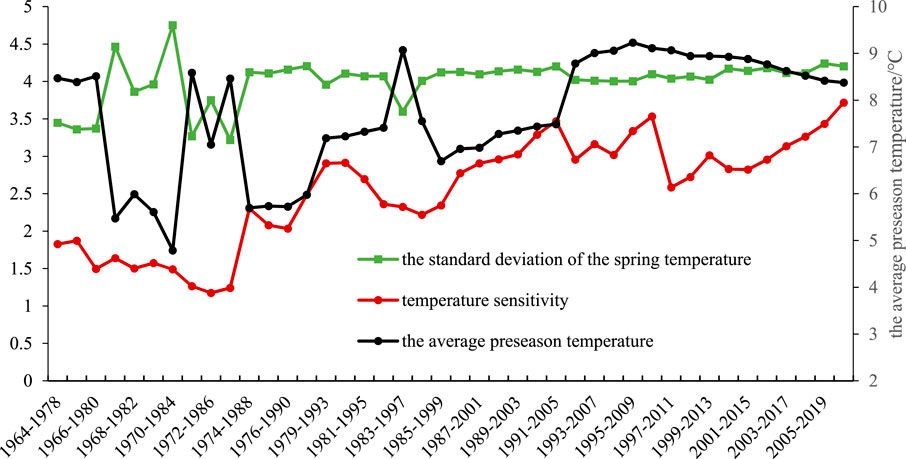
Figure 9. Trends in the standard deviation, average temperature, and temperature sensitivity of spring temperature from 1964 to 2020 (15-year sliding window).
4.3.3 Impact of temperature zone changes
Some scholars have reported that against the background of global warming, the temperature sensitivity of spring phenology of most plants in subtropical regions has not decreased but has increased as the number of cold shock days has decreased. In temperate regions, the temperature sensitivity of spring phenology has decreased as the number of cold shock days has decreased for most plants (Xu et al., 2019). These findings indicate that the internal mechanisms of the spring phenology of plants in response to temperature changes vary in subtropical and temperate regions and that the sensitivity of spring phenology to temperature is different. In other words, the amount of cold shock required during the early stages of plant phenology in subtropical regions is lower, and the amount of accumulated temperature required for strengthening is also lower.
Before the phenological mutation, the Xi’an area was classified as a warm temperate zone; after the mutation, the Xi’an area was classified as a northern subtropical transition zone (except for the average temperature less than 0°C in January, all other conditions reached northern subtropical conditions) (Zhang, 2022). Before the phenological mutation, the Xi’an region was in the warm temperate zone, with relatively low temperatures during this period, fewer cold shock days in winter, a delay in the spring phenology, and a decrease in sensitivity to the spring phenology. After the abrupt change in phenology, the Xi’an area is part of the northern subtropical transition zone. Although the number of cold shock days in winter has decreased, the plants in the northern subtropical transition zone have the characteristics of subtropical plants. The amount of cold shock required for the spring phenology of plants in the northern subtropical transition zone has been less than that in the warm temperate zone, and the temperature sensitivity of spring phenology has increased. This finding indicates that the change in temperature zones is an important reason for the change in temperature sensitivity of spring phenology in the Qinling Mountains.
Before the abrupt climate change, the temperature sensitivity of spring phenology decreased, and after the abrupt climate change, the temperature sensitivity of spring phenology increased. From the perspective of the change in the temperature sensitivity of spring phenology before and after the abrupt climate change, this change reflects the response of plant phenology in the Qinling region to climate change before the abrupt change and the adaptation of plant phenology in the Qinling region to climate change after the abrupt change. These findings indicate that the change in temperature zones in the Qinling Mountains has a significant effect on plant phenology and that the change in temperature sensitivity of spring phenology provides empirical support for the change in temperature zones in the Qinling Mountains.
5 Conclusion
(1) In the past 60 years, the spring phenology in the Qinling Mountains has shown a very significant trend of advancement, while the autumn phenology has shown a very significant trend of delay, and the growth period of phenology has been extended.
(2) In the past 60 years, there has been a significant change in plant phenology in the Qinling Mountains, with the year of the change in the spring phenology occurring in 1988 and the year of the change in the end of phenology occurring in 1984. The year of sudden change at the spring phenology and autumn phenology was basically the same as the year of sudden change in the climate, indicating consistency between sudden phenological and climatic changes.
(3) Changes in spring temperature are important reasons for changes in the temperature sensitivity of spring phenology in the Qinling Mountains. Before the abrupt climate change, the rate of temperature change in spring was high, and the temperature sensitivity of spring phenology decreased. After the abrupt climate change, the temperature in spring increased steadily, and the temperature sensitivity of spring phenology increased.
(4) Changes in the temperature zone are important causes of changes in temperature sensitivity of the spring phenology in Qinling Mountains. Before the abrupt climate change, the Xi’an region was in the warm temperate zone, with a decrease in the number of cold shock days in winter and a decrease in temperature sensitivity of spring phenology. After the abrupt climate change, the Xi’an region was located in the transition zone of the northern subtropical zone, with a significant reduction in the number of cold days in winter and an increase in sensitivity to the spring phenology.
Data availability statement
The raw data supporting the conclusions of this article will be made available by the authors, without undue reservation.
Author contributions
SZ: Investigation, Methodology, Writing – original draft. QnM: Conceptualization, Data curation, Software, Writing – review and editing. QaM: Data Curation, Formal analysis, Writing – review and editing. HB: Visualization, Writing – review and editing. SL: Writing – review and editing.
Funding
The author(s) declare that financial support was received for the research and/or publication of this article. Funding for this work was provided from Shaanxi Provincial Department of Education Project: Social Value Assessment of Ecosystem Services in Qinling South Foot Forest ParkBased on SolVES Model (23JP043); Research Project of “China Qinling Studies” at Shangluo University: Phenological Confirmation of North Subtropical Changes in Qinling Mountains (23QLX004); Project of Science and Technology Department of Shangluo University: Comprehensive Management Research on Typical Ecological Clean Small Watersheds in Shangluo Water Source Area (19SKY028).
Conflict of interest
The authors declare that the research was conducted in the absence of any commercial or financial relationships that could be construed as a potential conflict of interest.
Generative AI statement
The author(s) declare that no Generative AI was used in the creation of this manuscript.
Publisher’s note
All claims expressed in this article are solely those of the authors and do not necessarily represent those of their affiliated organizations, or those of the publisher, the editors and the reviewers. Any product that may be evaluated in this article, or claim that may be made by its manufacturer, is not guaranteed or endorsed by the publisher.
Supplementary material
The Supplementary Material for this article can be found online at: https://www.frontiersin.org/articles/10.3389/feart.2025.1579328/full#supplementary-material
References
Bai, H., Kang, L., Jun, W., and Li, S. (2019). Vegetation response and adaptation in Qinling Mountains under the background of climate change. Beijing: Science Press. (in Chinese).
Bechkit, M. A., Boufekane, A., Busico, G., Lama, G. F. C., Mouhoub, F. C., Aichaoui, M., et al. (2024). Seawater intrusion mapping using geophysical methods, piezometry, and hydrochemical data analysis: application in the coastal aquifer of nador wadi plain in tipaza (Algeria). Pure Appl. Geophys. 181 (9), 2823–2837. doi:10.1007/s00024-024-03565-2
Bhattacharjee, R., Gaur, S., Ohri, A., Das, N., Chaturvedi, S., and Kumar, R. (2024). Reconnaissance of spatio-temporal variability in ecological stability with local adaptability based on multi-temporal LANDSAT archive in ganga river basin. Phys. Chem. Earth, 135. doi:10.1016/j.pce.2024.103667
Chen, L., Huang, J. G., Ma, Q., Hänninen, H., Tremblay, F., and Bergeron, Y. (2019). Long-term changes in the impacts of global warming on leaf phenology of four temperate tree species. Glob. Change Biol. 25 (3), 997–1004. doi:10.1111/gcb.14496
Chow, D. H. C., and Levermore, G. J. (2007). New algorithm for generating hourly temperature values using daily maximum, minimum and average values from climate models. Build. Serv. Eng. Res. and Technol. 28 (3), 237–248. doi:10.1177/0143624407078642
Cong, N., Huang, K., and Zhang, Y. J. (2021). Unsynchronized driving mechanisms of spring and autumn phenology over Northern Hemisphere grasslands. Front. For. Glob. Change 3, 610612. doi:10.3389/ffgc.2020.610162
Cook, B. I., Wolkovich, E. M., Davies, T. J., Ault, T. R., Betancourt, J. L., Allen, J. M., et al. (2012). Sensitivity of spring phenology to warming across temporal and spatial climate gradients in two independent databases. Ecosystems 15 (8), 1283–1294. doi:10.1007/s10021-012-9584-5
Dai, J. H., Wang, H. J., and Ge, Q. S. (2013). Multiple phenological responses to climate change among 42 plant species in Xi'an,China. Int. J. Biometeorology 57 (5), 749–758. doi:10.1007/s00484-012-0602-2
Dai, W. J. (2020). Phenological changes of typical woody plants in Northeast China and their response to climate warming[D]. Harbin: Northeast Forestry University.
Deng, C. (2018). Phenological spatiotemporal changes and their responses in the Qinling Mountains under the background of climate change [D]. Xi'an: Northwest University.
Deng, C., Bai, H., Zhai, D., Gao, S., Huang, X., Meng, Q., et al. (2017). Phenological changes of plants in Qinling Mountains from 1964 to 2015 under the background of climate change. Acta Ecol. Sin. 37 (23), 7882–7893. doi:10.5846/stxb201702200277
Elinger, P. S. C., and Heimann, M. (1996). Global and hemispheric CO2 sinks deduced from changes in atmospheric O2 concentration. Nature 381, 218–221. doi:10.1038/381218a0
Fu, Y. H., Campioli, M., Vitasse, Y., De Boeck, H. J., Van den Berge, J., AbdElgawad, H., et al. (2014a). Variation in leaf flushing date influences autumnal senescence and next year’s flushing date in two temperate tree species. Proc. Natl. Acad. ences 111 (20), 7355–7360. doi:10.1073/pnas.1321727111
Fu, Y. H., Piao, S., Zhao, H., Jeong, S., Wang, X., Vitasse, Y., et al. (2014b). Unexpected role of winter precipitation in determining heat requirement for spring vegetation green-up at northern middle and high latitudes. Glob. Change Biol. 20, 3743–3755. doi:10.1111/gcb.12610
Fu, Y. H., Zhao, H. F., Piao, S. L., Peaucelle, M., Peng, S., Zhou, G., et al. (2015). Declining global warming effects on the phenology of spring leaf unfolding. Nature 526 (7571), 104–107. doi:10.1038/nature15402
Ge, Q. S., Wang, H. J., Rutishauser, T., and Dai, J. (2015). Phenological response to climate change in China: a meta-analysis. Glob. Change Biol. 21 (1), 265–274. doi:10.1111/gcb.12648
Giovannini, M. R. M., Lama, G. F. C., Scopetani, L., Francalanci, S., Signorile, A., Saracino, R., et al. (2025). Evaluating the impacts of riparian plants on flood hazard Within Vegetated Rivers. J. Flood Risk Manag. 18, e70063. doi:10.1111/jfr3.70063
Guralnick, R., Crimmins, T., Grady, E., and Campbell, L. (2024). Phenological response to climatic change depends on spring warming velocity. Commun. Earth and Environ. 5 (1), 634–10. doi:10.1038/s43247-024-01807-8
Jeong, S. J., Ho, C. H., Gim, H. J., and Brown, M. E. (2011). Phenology shifts at start vs. end of growing season in temperate vegetation over the northern hemisphere for the period 1982-2008. Glob. Change Biol. 17 (7), 2385–2399. doi:10.1111/j.1365-2486.2011.02397.x
Lama, G. F. C., and Crimaldi, M. (2022). “On the estimation of real-scale hydrodynamic features of vegetated channels through UAV-based Thermography,” in Proceedings of the 39th IAHR world congress-from snow to sea (Spain: Granada), 94–100.
Linderholm, H. W., Walther, A., and Chen, D. (2008). Twentieth-century trends in the thermal growing season in the Greater Baltic Area. Clim. Change 87 (3-4), 405–419. doi:10.1007/s10584-007-9327-3
Lu, F. Z., and Lu, H. Y. (2019). Establishment of high-resolution temperature and precipitation grid data set in Qinling Daba Mountains and its indication of regional climate. J. Geogr. 74 (05), 875–888.
Matsumoto, K., Ohta, T., Irasawa, M., and Nakamura, T. (2003). Climate change and extension of the Ginkgo biloba L. growing season in Japan. Glob. Change Biol. 9 (11), 1634–1642. doi:10.1046/j.1365-2486.2003.00688.x
Menzel, A., Sparks, T. H., Estrella, N., Koch, E., Aasa, A., Ahas, R., et al. (2006). European phenological response to climate change matches the warming pattern. Glob. Change Biol. 12 (10), 1969–1976. doi:10.1111/j.1365-2486.2006.01193.x
Pasquino, V., Lama, G. F. C., Peruzzi, C., Chirico, G. B., and Aberle, J. (2025). Assessing bed shear stress effects on flow resistance of vegetated channel beds through Leaf Area Index (LAI). J. Hydrology 653, 132518. doi:10.1016/j.jhydrol.2024.132518
Pirone, D., Cimorelli, L., and Pianese, D. (2024). The effect of flood-mitigation reservoir configuration on peak-discharge reduction during preliminary design. J. Hydrology:Regional Stud. 52, 101676. doi:10.1016/j.ejrh.2024.101676
Pope, K. S., Dose, V., Silva, D. D., Brown, P. H., Leslie, C. A., and DeJong, T. M. (2013). Detecting nonlinear response of spring phenology to climate change by Bayesian analysis. Glob. Change Biol. 19 (5), 1518–1525. doi:10.1111/gcb.12130
Root, T. L., Price, J. T., Hall, K. R., Schneider, S. H., Rosenzweig, C., and Pounds, J. A. (2003). Fingerprints of global warming on wild animals and plants. Nature 421 (6918), 57–60. doi:10.1038/nature01333
Schwartz, M. D. (1994). Monitoring global change with phenology: the case of the spring green wave. Int. J. Biometeorology 38 (1), 18–22. doi:10.1007/bf01241799
Song, Y. L., Linderholm, H. W., Chen, D. L., and Walther, A. (2010). Trends of the thermal growing season in China, 1951-2007. Int. J. Climatol. 30 (1), 33–43. doi:10.1002/joc.1868
Tao, Z. X., Ge, Q. S., Dai, J. H., and Wang, H. J. (2020a). Changes in the temperature-relevant period for the leaf unfolding date of main woody plants in eastern China during 1980-2018. J. Ecol. 40 (21), 7777–7789. doi:10.5846/stxb202004070821
Tao, Z. X., Ge, Q. S., and Wang, H. J. (2020b). Spatio-temporal variations in the thermal requirement of the first flowering dates of Salix babylonica and Ulmus pumila in China during 1963-2018. Acta Geogr. Sin. 75 (7), 1451–1464. doi:10.11821/dlxb202007009
Vitasse, Y., Lenz, A., Hoch, G., and Korner, C. (2014). Earlier leaf-out rather than difference in freezing resistance puts juvenile trees at greater risk of damage than adult trees. J. Ecol. 102 (4), 981–988. doi:10.1111/1365-2745.12251
Vitasse, Y., Schneider, L., Rixten, C., Christen, D., and Rebetez, M. (2018). Increase in the risk of exposure of forest and fruit trees to spring frosts at higher elevations in Switzerland over the last four decades. Agric. For. Meteorology 248, 60–69. doi:10.1016/j.agrformet.2017.09.005
Walther, G. (2004). Plants in a warmer world. Perspect. Plant Ecol. 6 (3), 169–185. doi:10.1078/1433-8319-00076
Wang, H., Rutishauser, T., Tao, Z., Zhong, S., Ge, Q., and Dai, J. (2017). Impacts of global warming on phenology of spring leaf unfolding remain stable in the long run. Int. J. Biometeorology 61, 287–292. doi:10.1007/s00484-016-1210-3
Wang, H. J., Tao, Z. X., and Ge, Q. S. (2019). Effects of climate variation on the first leaf dates of 39 woody species and their thermal requirements in Xi’an, China. Chin. J. Plant Ecol. 43 (10), 877–888. doi:10.17521/cjpe.2019.0178
Wang, T., Ottlé, C., Peng, S., Janssens, I. A., Lin, X., Poulter, B., et al. (2014). The influence of local spring temperature variance on temperature sensitivity of spring phenology. Glob. Change Biol. 20 (5), 1473–1480. doi:10.1111/gcb.12509
Wu, C., Gonsamo, A., Gough, C. M., Chen, J. M., and Xu, S. (2014). Modeling growing season phenology in North American forests using seasonal mean vegetation indices from MODIS. Remote Sens. Environ. 147 (18), 79–88. doi:10.1016/j.rse.2014.03.001
Xu, Y. J., Ge, Q. S., Dai, J. H., and Wang, H. J. (2019). Variations in temperature sensitivity of leaf unfolding date and their influencing factors for typical woody plants in China over the past 50 years. Acta Ecol. Sin. 39 (21), 8135–8143. doi:10.5846/stxb201809302131
Yu, H. Y., Luedeling, E., and Xu, J. C. (2010). Winter and spring warming result in delayed spring phenology on the Tibetan Plateau. Proc. Natl. Acad. Sci. U. S. A. 107 (51), 22151–22156. doi:10.1073/pnas.1012490107
Zhang, H. C., Yuan, W. P., Liu, S. G., Dong, W., and Fu, Y. (2015). Sensitivity of flowering phenology to changing temperature in China. J. Geophys. Res. Biogeosciences 120 (8), 1658–1665. doi:10.1002/2015jg003112
Zhang, S. H. (2022). Variation in the Qinling Mountains temperature zone in the past 60 years [D]. Xi’an:Northwest University.
Zhang, S. H., Bai, H., Qi, G., Liang, J., Zhao, T., and Meng, Q. (2021). Changes of climate zone boundary of the Qinling Mountains from 1960 to 2019. J. Nat. Resour. 36 (10), 2491–2506. doi:10.31497/zrzyxb.20211004
Keywords: spring phenology, temperature sensitivity, temperature zone, comprehensive impact, qinling mountains region
Citation: Zhang S, Meng Q, Ma Q, Bai H and Li S (2025) Study on the changes in the temperature sensitivity of spring phenology of typical woody plants in the Qinling Mountains region. Front. Earth Sci. 13:1579328. doi: 10.3389/feart.2025.1579328
Received: 19 February 2025; Accepted: 18 June 2025;
Published: 04 August 2025.
Edited by:
Giuseppe Francesco Cesare Lama, University of Naples Federico II, ItalyReviewed by:
Mariano Crimaldi, University of Naples Federico II, ItalySadashiv Chaturvedi, Nanjing University of Information Science and Technology, China
Reeja Bashir, University of Naples Federico II, Italy
Copyright © 2025 Zhang, Meng, Ma, Bai and Li. This is an open-access article distributed under the terms of the Creative Commons Attribution License (CC BY). The use, distribution or reproduction in other forums is permitted, provided the original author(s) and the copyright owner(s) are credited and that the original publication in this journal is cited, in accordance with accepted academic practice. No use, distribution or reproduction is permitted which does not comply with these terms.
*Correspondence: Shujuan Li, bGlzaHVqdWFueGJnQDE2My5jb20=