 Chunmei Zhou
 Zihan Qin
 Guangbo Li
- School of Civil Engineering and Architecture, Wuhan Institute of Technology, Wuhan, China
Anti-slide piles are widely used for landslide mitigation, providing an effective engineering solution for slope protection. A critical factor in the design and performance of these structures is the soil arching effect, which arises from the interaction between anti-slide piles and the surrounding soil. This study explores the factors influencing the development of the soil arching effect, using both a mechanical equilibrium model and finite element numerical simulations. Specifically, the study examines the impact of landslide thrust magnitude, pile embedment depth, and the number of wet-dry soil cycles on the soil arching effect. The results show that there is an optimal range of landslide thrust within which the soil arching effect develops fully. The degree of the soil arching effect initially decreases but then increases as the pile embedment depth increases. Furthermore, under the influence of wetting-drying cycles, the soil arching effect undergoes an initial weakening phase, followed by a subsequent strengthening stage, and ultimately culminates in failure at a specific depth. The study proposes a composite evaluation framework utilizing the thrust-to-cohesion ratio and stress homogenization index within arching zones as robust discriminators for quantifying arching development stages. These findings provide important insights for the design of anti-slide piles and the long-term stability of landslide mitigation efforts.
1 Introduction
As a pivotal technology for landslide mitigation, the bearing characteristics of anti-slide piles are intrinsically linked to the soil arching effect (Li, 2009; Li et al., 2013). The formation mechanism and evolutionary patterns of soil arching hold significant engineering implications, yet exhibit notable domain-specific variations in influencing factors: In foundation pit engineering, excavation depth and width predominantly govern the evolution of arch zone height (positively correlated with height) (Wu et al., 2024), while in slope stabilization systems, pile spacing emerges as the core control parameter directly affecting arch structure stability (Yue et al., 2011; Xiang et al., 2011). Notably, increased pile spacing-to-width ratio induces progressive attenuation of ultimate arch bearing capacity (Xiang et al., 2011), with additional regulatory influences from soil particle characteristics (granular size, porosity, friction coefficient) (Han et al., 2013), pile-soil interface properties (Liu et al., 2011), and dynamic loading conditions (trapdoor displacement, cyclic frequency) (Bi et al., 2020). Furthermore, groundwater variations weaken arching effects through altered soil friction characteristics, where water table elevation increases arch height while reducing structural strength (An et al., 2024; Song et al., 2018).
Substantial consensus has been reached regarding arch morphology evolution in pile-supported embankments: Fill height acts as the key control variable driving arch morphology transformation from initial triangular configurations to semicircular or trapezoidal forms (Fang et al., 2015), with recent studies confirming the prevalence of semi-elliptical arch patterns (Yang et al., 2014; Yang et al., 2019). From evolutionary dynamics perspective, three characteristic development modes have been identified - triangular expansion mode, tower-shaped evolution mode, and equal settlement mode (Rui et al., 2016), all subject to dual regulation by fill compaction degree: Enhanced compaction not only improves arch bearing capacity (Ye et al., 2022; Zhang et al., 2021) but also modifies earth pressure distribution and surface settlement characteristics at critical states (Liu, 2022). Numerical simulations reveal threshold effects of pile stiffness on arch stability, where low-stiffness support systems exhibit arch degradation while moderate stiffness maintains stable development (Rui et al., 2022). Crucially, arch failure mechanisms demonstrate pronounced three-dimensional characteristics, with excessive sliding forces causing diverse arch model failures (Liu et al., 2021). The progressive failure process is collectively determined by pile cross-sectional geometry (trapezoidal outperforming rectangular) (Su et al., 2023), pile-soil differential settlement (Fei et al., 2013), and dynamic strengthening of slide mass strength (Zhong et al., 2022), with shallow arches being more susceptible to premature failure due to inherent strength deficiencies (Han et al., 2016).
Current evaluation systems for soil arching effects employ multi-parameter criteria: Arch ring thickness serves as a strength indicator (Fu, 2017; Shen et al., 2015), its evolution analyzable through coupled relative displacement and principal stress field analysis (Wang et al., 2019), while macroscopic collapse features (Zhan et al., 2013) and embankment height-to-pile-spacing ratio (Zhuang et al., 2013) respectively function as failure criteria and effect development indices. Although existing research has elucidated fundamental principles of soil arching, critical knowledge gaps persist regarding evolutionary patterns, characteristic influence mechanisms, and quantitative discrimination criteria for arching effect development in reservoir bank landslide anti-slide piles. This study systematically investigates the evolutionary characteristics of soil arching ef-fects in such systems through mechanical modeling and numerical simulation approaches.
2 Characteristics of the soil arching effect
2.1 Soil arching effect
The concept of the soil arching effect was first introduced by British physicist Coulomb during his investigation of pressure distribution at the bottom of grain silos. He observed that the pressure at the silo base was not directly proportional to the weight of the grain, as part of the pressure was absorbed by the silo walls. This observation was later corroborated by the renowned soil mechanic Terzaghi, who conducted trapdoor experiments to validate the phenomenon. The soil arching effect refers to the formation of an arch-like load-bearing structure within the soil during the redistribution of internal stresses. This occurs due to the interlocking of soil particles and their mutual compression. As a result, the soil can bear greater landslide thrust forces than it would otherwise be capable of.
For the soil arching effect to develop, three conditions must be met: (1) there must be sufficient friction and cohesion between soil particles to facilitate the transfer of stress; (2) a rigid support structure, such as anti-slide piles, must be in place to serve as the abut-ments for the arch; and (3) uneven or relative displacements within the soil must occur, triggering the redistribution of soil particles.
2.2 Evolutionary characteristics and influencing factors of soil arching
Current research indicates that the soil arching effect reaches its ultimate state when the arch ring thickness, load-bearing ratio, and triangular compaction zone all reach their maximum values. As demonstrated in Figure 1, progressive development of the arching effect induces three interdependent morphological transformations: vertical amplification of the principal arch height, structural thickening of the arch ring, and lateral expansion of overlapping triangular compression zones at adjacent arch footing interfaces. However, the failure of the soil arching effect is characterised by the collapse of the direct soil arch, leaving only the frictional soil arch between the piles. Once this occurs, the load-bearing capacity of the frictional soil arch decreases significantly, eventually reaching a negligible level. This marks the complete failure of the soil arching effect.
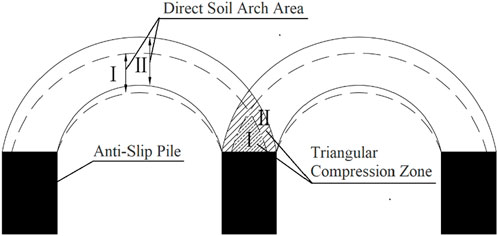
Figure 1. Evolution of the triangular compaction zone with the development of soil arching.
The development and effectiveness of the soil arching effect are influenced by various factors, with pile spacing and landslide thrust being the most prominent. The soil arching effect typically extends up to four times the pile width. Beyond this range, the effect becomes ineffective, and the soil arch collapses (Li et al., 2013). When the pile spacing is between three and eight times the pile diameter, a distinct soil arching effect is observed between anti-slide piles. However, as pile spacing increases beyond this range, the effectiveness of the arching effect decreases (Fu, 2017).
The shear strength parameters of the soil also play a role in the development of the soil arching effect. Within certain limits, these parameters enhance the effect, but once the shear strength exceeds a specific threshold, their impact becomes negligible (Fu, 2017). The compressive strength of the soil is influenced by its elastic modulus. Soils with a higher elastic modulus exhibit greater resistance to deformation, which results in a more pronounced soil arching effect.
2.3 Mechanical model of soil arching
Based on the mechanical analysis framework of soil arching proposed in Reference (Fu, 2017), this study systematically investigates the governing factors influencing the evolutionary degree of soil arching effects, and accordingly establishes the following fundamental assumptions for the computational model:
1. The soil is considered a homogeneous and isotropic material.
2. The landslide thrust is modelled as a uniformly distributed horizontal load acting on the soil.
3. To simplify the calculations, the self-weight of the soil is neglected, and the soil arch is treated as a two-dimensional plane stress problem.
4. The landslide thrust is assumed to remain constant throughout the soil, ensuring equilibrium conditions are met.
5. For the purpose of simplification, the cross-section of the soil arch is assumed to have a uniform thickness.
A simplified calculation model for the soil arch axis is illustrated in Figure 2.
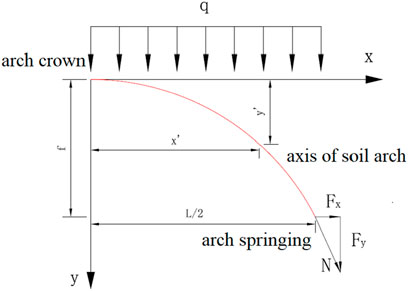
Figure 2. Force model of the soil arch axis (symmetric model).
The optimal arch axis of the soil arch represents the stress distribution curve that forms as the soil adjusts to its maximum shear strength in order to resist the applied pressure. In this model, the soil arch axis is approximated by a quadratic parabolic equation, assuming symmetry. The equation for the soil arch axis can be expressed as follows:
Where L represents the net span of the soil arch, f denotes the net height loss of the soil arch, and a, b, and c are unknown constants.
As shown in Figure 2 and Equation 1:
The equation of the soil arch axis can thus be expressed as:
Since the shear force and bending moment at any point on the soil arch axis are zero, the following condition holds:
The vertical thrust at the arch foot of the soil arch axis is given by:
From Equations 3, 4, for any cross-section, the bending moment is zero, leading to the following condition:
By combining Equations 2, 5, the horizontal thrust at the arch foot of the soil arch axis is obtained as:
The resultant force N at the arch foot is given by:
Based on the relationship between the soil arch axis and the optimal arch axis, the resultant force at the arch foot is greatest, with the base carrying the heaviest load. As the axis approaches the arch crown, the axial pressure gradually decreases. Therefore, the cross-section at the arch foot is considered the critical section, where strength must be carefully controlled to ensure the structural safety and stability of the system, preventing failure or damage.
In pile groups, a triangular compression zone typically forms behind adjacent anti-slide piles, with the arch foot being the most vulnerable region within the compression zone. Figure 3A illustrates the force distribution of the end-bearing soil arch behind the piles.
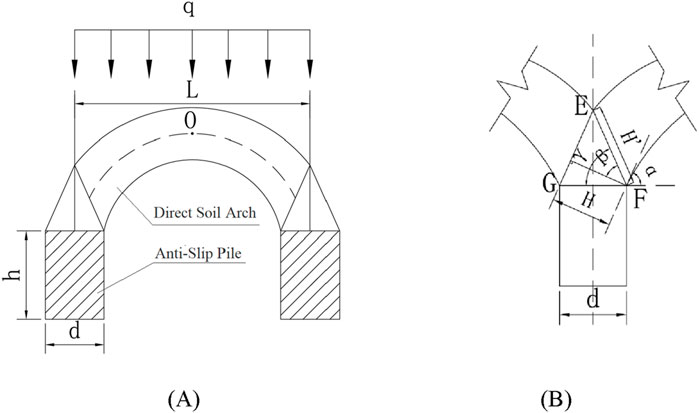
Figure 3. Force diagram of the soil arching zone behind the pile (A) overall force diagram of the soil arch; (B) force diagram of the triangular compaction zone.
From Figure 3B, the following observations can be made:
In the above equation: H′ represents the width of the failure surface of the end-bearing soil arch; H denotes the thickness of the end-bearing soil arch; α is the angle between the horizontal plane at point F and the tangent at the arch foot; β is the angle between the vertical line passing through point F and the failure surface EF; γ is the angle between the failure surface EF and the back of the pile.
As shown in Figure 3B and Equation 8, EFG forms an isosceles triangle, with the line segment passing through point F being perpendicular to, EG. Consequently, the following relationship holds:
When the soil arch experiences shear failure, the Mohr-Coulomb strength criterion governs. Within the triangular compression zone, the angle between the maximum principal stress and the failure surface is φ/2 + 45°. Therefore, according to Equation 9 the following relationships apply:
According to Equation 10 at the critical state, the stress condition of the soil arch satisfies the Mohr-Coulomb criterion:
Where: σ1 and σ3 represent the major and minor principal stresses, respectively - c and φ represent the cohesion and internal friction angle of the soil, respectively.
Based on Equation 11, the following relationship holds when considering plane strain conditions while disregarding the principal stress effects at point O:
Substituting Equation 7 into Equation 12, we obtain:
At the limit equilibrium state, the arch foot is in static equilibrium. Therefore, the maximum frictional force on the pile body behind the pile must be greater than or equal to the landslide thrust shared by the soil arch. For simplicity, it is assumed that the frictional force equals the landslide thrust shared by the soil arch. Thus, the following relationship is assumed:
Substituting Equation 6 into Equation 14:
Combining Equations 13, 15, the following system of equations is established:
Solving this system of Equation 16, the load q borne by the direct soil arch behind the pile is:
Rearranging Equation 13:
Given the pile spacing L, cohesion c, and internal friction angle φ, it can be deduced from Equation 17 that within the range where the landslide thrust does not induce soil instability, the larger the landslide thrust, the greater the load q borne by the soil arch, the wider the failure surface H′ of the end-bearing soil arch, and the larger the extent of the triangular compression zone. Furthermore, the net height loss f of the soil arch is positively correlated with the load q borne by the soil arch. This implies that, within a certain range, as the landslide thrust increases, the net height loss of the soil arch also increases, leading to a more pronounced development of the soil arching effect.
Equation 18 shows that, under constant landslide thrust (i.e., fixed q) and a given pile spacing L, the net height loss f of the soil arch is negatively correlated with the shear strength parameters. A reduction in shear strength parameters increases the relative displacement of soil particles within the soil mass. Within a specific range, as the shear strength parameters decrease, the net height loss f increases, further enhancing the development of the soil arching effect. These conclusions hold true provided that the landslide thrust ensures the existence of the end-bearing soil arch and that the soil arch has not yet reached failure.
3 Finite element analysis model
In this study, a numerical model was developed using PLAXIS 3D to simulate and analyze the system under the designed working conditions. PLAXIS 3D is a widely used three-dimensional finite element software that excels in performing deformation and stability analyses in geotechnical engineering. Its advanced capabilities are particularly suited for modelling complex structures and construction processes, while its core analytical algorithms are both robust and reliable.
For the purpose of this analysis, the model was simplified. The lower section of the model represented the bedrock layer, while the upper section consisted of a clay layer interbedded with gravel. Both layers were modelled using the Mohr-Coulomb constitutive model, which accurately simulates the elasto-plastic behaviour of geotechnical materials under stress. Groundwater seepage conditions were excluded from the model for simplicity. The anti-slide piles were represented by “plate” elements in PLAXIS 3D, which enabled the monitoring of forces acting on the pile body. The thrust force of a landslide has a rather complex effect on the slope body, and in the process of the landslide body sliding down, it is actually a dynamic loading process (Rizvi et al., 2020). A uniformly distributed load was applied to the soil mass behind the piles to simulate the landslide thrust. The model was discretised using triangular mesh elements, consisting of 32,309 elements and 50,822 nodes. The model setup and dimensions are illustrated in Figure 4. To ensure numerical stability and replicate realistic boundary conditions in the finite element model, normal displacement restraints were imposed on the lateral boundaries while full fixity constraints were applied to the basal boundary, with the ground surface remaining unconstrained. This boundary configuration scheme, as recommended in the PLAXIS 3D Reference Manual, was implemented to achieve proper kinematic restraint conditions that closely approximate the in situ stress state of localized soil masses under practical geotechnical conditions. The adopted constraint strategy effectively prevents unrealistic rigid body motions while maintaining appropriate deformation characteristics consistent with actual subsurface material behavior. Based on the typical ranges of physical and mechanical property parameters for common geotechnical materials, the numerical simulation parameters were determined and are explicitly presented in Table 1.
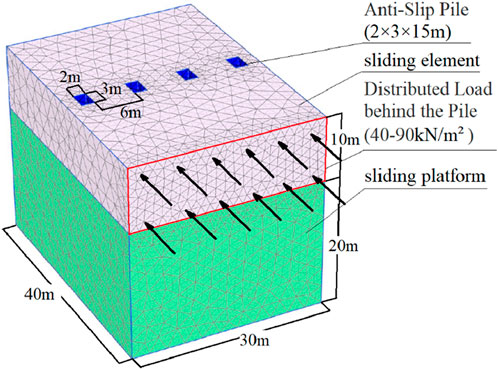
Figure 4. Simplified model diagram.
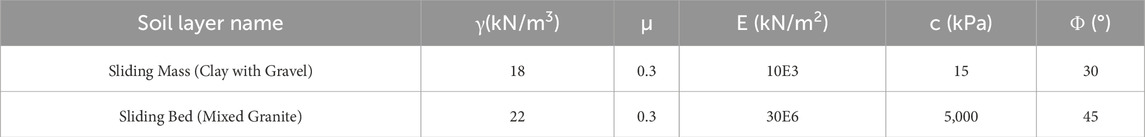
Table 1. Physical and mechanical properties of soil layers.
4 Factors affecting the soil arching effect
4.1 Impact of landslide thrust
To explore the relationship between the development of the soil arching effect and landslide thrust, and to validate the findings from Section 2.3, the magnitude of the land-slide thrust was varied while keeping all other conditions constant. Uniformly distributed loads, ranging from 40 to 90 kN/m2, were applied to the landslide mass to simulate different levels of landslide thrust. Figure 5 presents the stress contour plots along the thrust direction at a consistent depth under varying landslide thrust conditions.
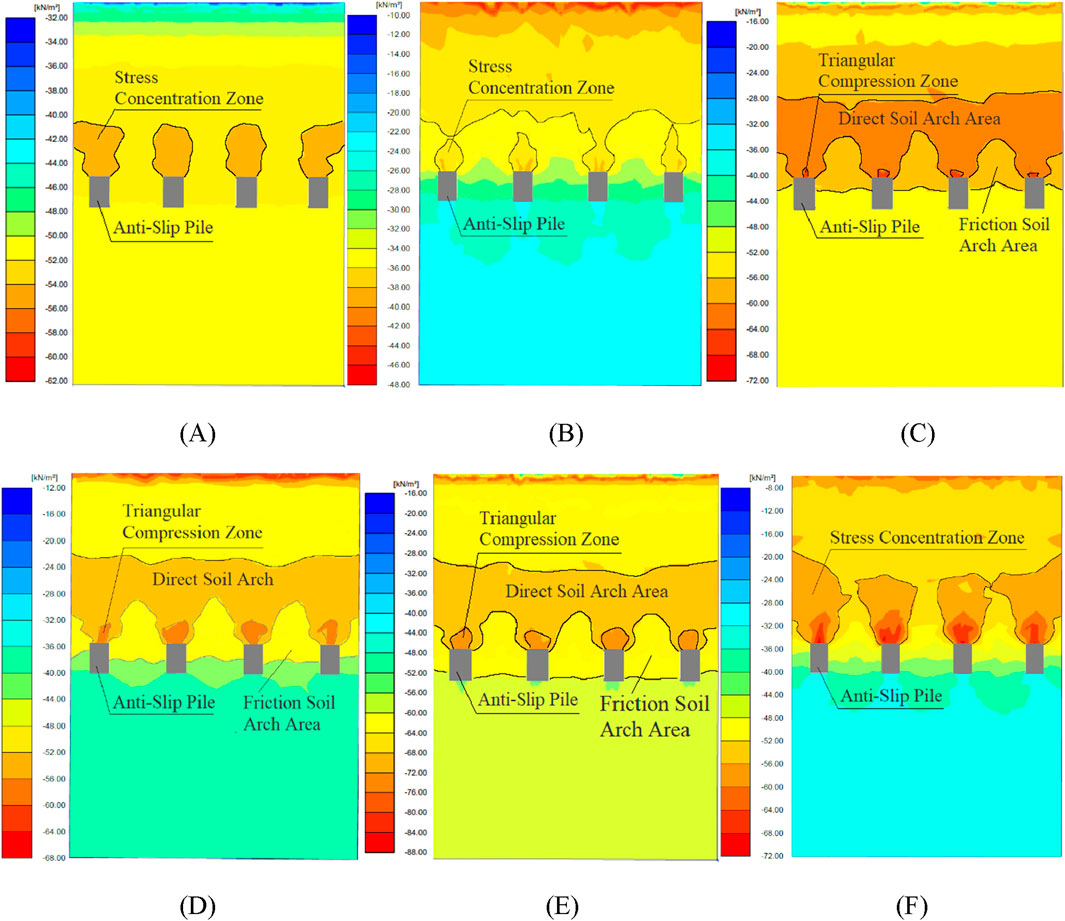
Figure 5. Stress Contour Maps Under Different Landslide Thrust Conditions. (A) Stress contour plot under landslide thrust of 40 KN/m2; (B) Stress contour plot under landslide thrust of 50 KN/m2; (C) Stress contour plot under landslide thrust of 60 KN/m2; (D) Stress contour plot under landslide thrust of 70 KN/m2; (E) Stress contour plot under landslide thrust of 80 KN/m2; (F) Stress contour plot under landslide thrust of 90 KN/m2.
Table 2 systematically elucidates the evolutionary characteristics of interpile frictional soil arches, triangular compression zones behind piles, and direct soil arches under varying landslide thrust magnitudes. Given that landslide thrust represents the destabilizing capacity of disturbed soil masses, while cohesion characterizes the inherent shear resistance of soil, the ratio of landslide thrust to soil cohesion (Rqc = q/c) is proposed as a diagnostic index for preliminarily evaluating the developmental stage of soil arching effects. This ratio quantitatively reflects the equilibrium relationship between soil strength and external loading conditions.
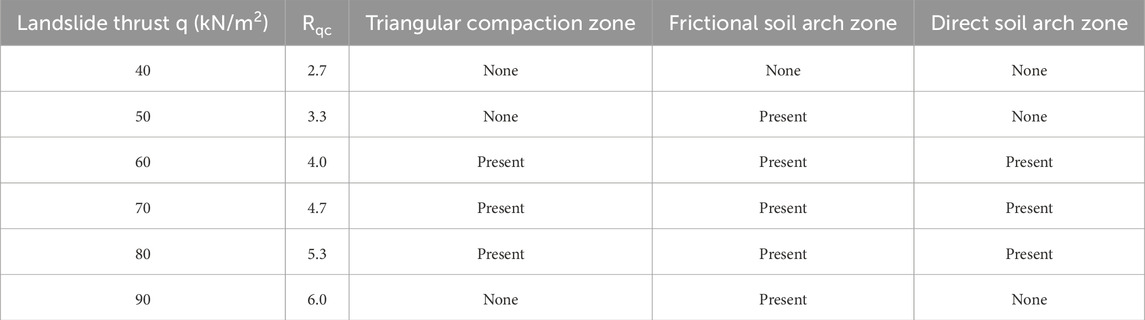
Table 2. Variation characteristics of soil arching with landslide thrust.
Numerical analysis of Figure 4; Table 2 demonstrates that the thrust-to-cohesion ratio (Rqc) exerts a threshold-dominated control on the evolutionary behavior of soil arching. When Rqc = 2.7, localized stress concentration zones form behind the piles without generating functional soil arch structures. As Rqc increases to 3.3, discontinuous direct soil arches emerge with incomplete spatial connectivity. Within the Rqc range of 4.0–5.3, progressive synergistic development occurs between direct soil arches and triangular compression zones, achieving peak arching efficacy at Rqc = 5.3. However, structural collapse of direct soil arches is triggered when Rqc ≥ 6.0, resulting in residual frictional arching with complete functional degradation.
The study identifies a dual-threshold mechanism governing arch formation: the lower threshold (Rqc = 3.3) defines the initiation boundary for arch development, while the upper threshold (Rqc = 6.0) marks the ultimate bearing capacity limit. Three distinct evolutionary phases are characterized: (1) an incubation phase (2.7 ≤ Rqc < 3.3) featuring pre-arching stress redistribution, (2) a reinforcement phase (4.0 ≤ Rqc ≤ 5.3) exhibiting strainhardening arch progression, and (3) a degradation phase (Rqc ≥ 6.0) culminating in catastrophic arch collapse. These threshold dynamics reveal that controlled landslide thrust increments (Rqc < 6.0) facilitate self-organized arch evolution through stress redis-tribution, whereas surpassing the critical threshold induces systemic instability and structural reconfiguration of the arching system.
4.2 Effect of depth variation along the pile body
Building on the findings from the previous section, where the maximum development of the soil arching effect was observed at a thrust-to- cohesion ratio of 5.3, we set the landslide thrust to 80 kN/m2 for this study. With all other conditions held constant, we varied the depth along the pile body to examine how this influences the degree of development of the soil arching effect. Figure 6 presents the stress contour maps along the thrust direction at various depths.
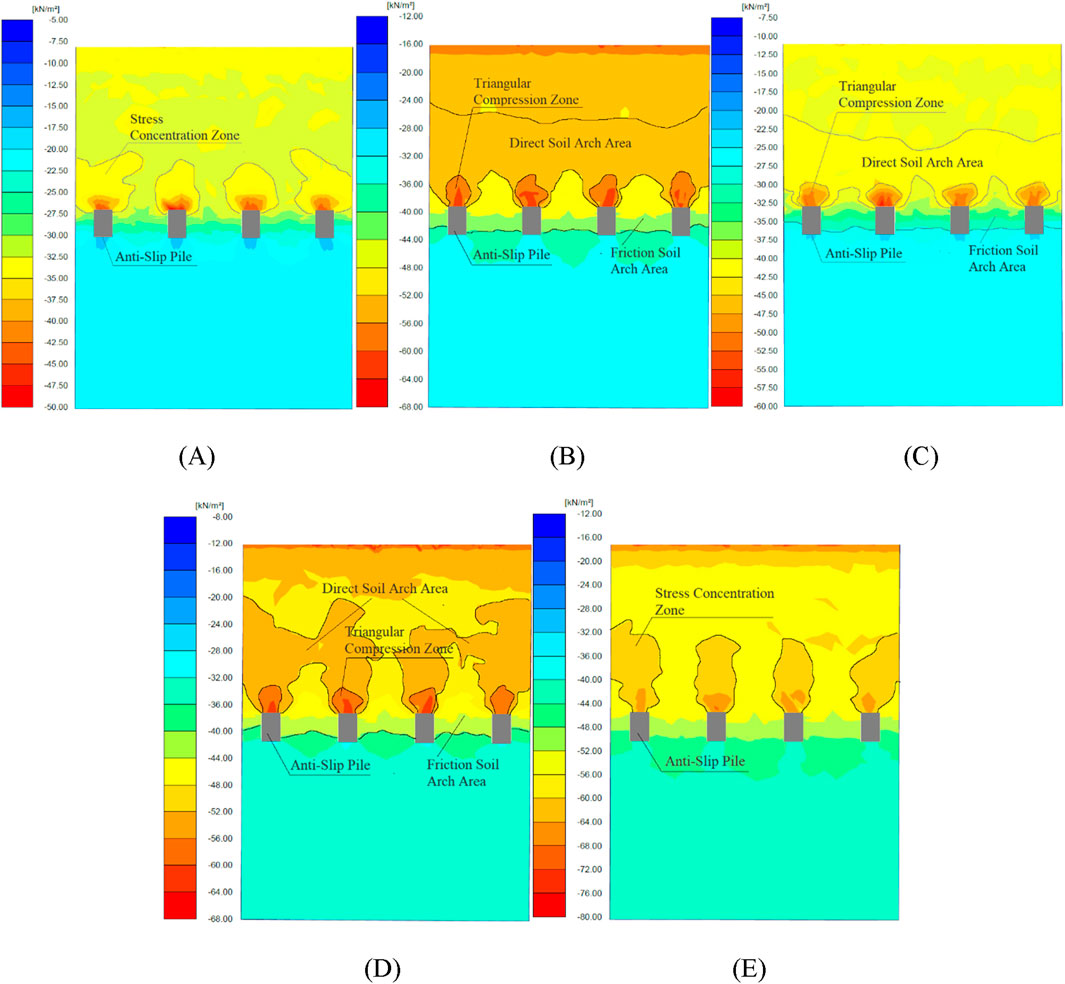
Figure 6. Stress Contour Maps at Different Depth Profiles Along the Pile Body. (A) Stress distribution characteristics across a cross-sectional profile at 2 m depth; (B) Stress distribution characteristics across a cross-sectional profile at 4 m depth; (C) Stress distribution characteristics across a cross-sectional profile at 6 m depth; (D) Stress distribution characteristics across a cross-sectional profile at 8 m depth; (E) Stress distribution characteristics across a cross-sectional profile at 10 m depth.
Since the soil arching effect in shallow layers is either weak or prone to failure due to excessive landslide thrust, we begin by considering the stress profile at a depth of 2 m along the pile body. Additional profiles were extracted at 2-m intervals, with the deepest profile at 10 m, corresponding to the free end of the anti-slide pile.
As demonstrated by Figures 6A–E, the following observations can be made: At a depth of 2 m, only a stress concentration zone and a frictional soil arch zone exist behind the pile, indicating that the soil arching effect at this depth has failed. At a depth of 4 m, the soil arch ring is relatively well-formed, and the base of the triangular compaction zone is equal to the pile width, which suggests that the soil arching effect has reached its maximum development at this depth. At a depth of 6 m, as shown in Figure 6C, the thickness of the soil arch ring is significantly reduced, and the arch height becomes smaller compared to the depth of 4 m, signifying a decline in the development of the soil arching effect at this depth. Figure 7 further confirms that the average stress in the direct soil arch and frictional soil arch zones at 6 m is considerably lower than at depths of 4 m and 8 m, indicating a redistribution of stress. At a depth of 8 m, the direct soil arch zone behind the pile is no longer continuous, suggesting that the soil arching effect has failed at this depth. At a depth of 10 m, only the stress concentration zone and frictional soil arch zone remain, indicating complete failure of the soil arching effect.
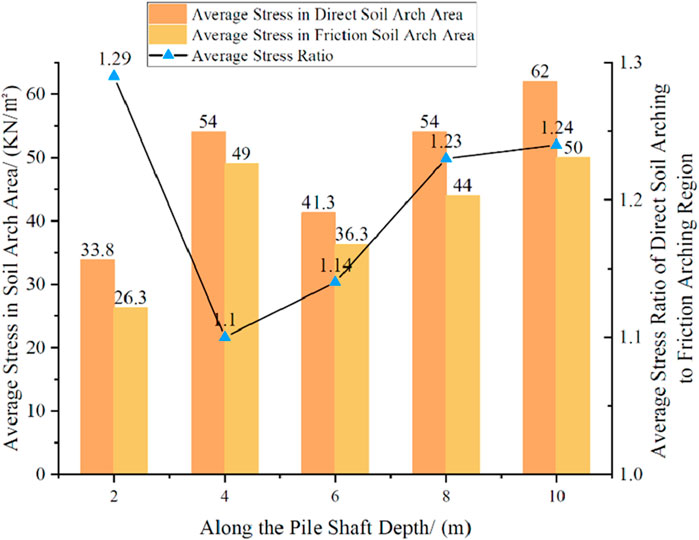
Figure 7. Average stress and stress ratio in the soil arching zone.
To evaluate the development of the soil arching effect, we used the thickness of the soil arch ring as an indicator, which is appropriate when there is a noticeable difference in thickness. However, this approach becomes less effective when such differences are minimal. The soil arching mechanism fundamentally operates through shear-induced interlocking and frictional interactions among soil particles, enabling external load transfer to rigid structures such as stabilizing piles. The mechanical response characteristics are fundamentally governed by the synergistic load-transfer efficiency between direct and frictional soil arch zones. By defining the stress ratio (Rσ = σd/σf) of mean stresses in direct versus frictional arch regions as a diagnostic index, this parameter quantitatively evaluates the load distribution ratio between these critical zones, thereby reflecting the global load-bearing integrity of the arching system. This ratio not only serves as a metric for assessing the developmental stage of soil arching effects but also provides mechanistic insights into stress redistribution patterns governing arch sustainability.
From Figure 7, it is evident that the average stress ratio initially decreases and then increases as pile depth increases, following a trend similar to the development degree of the soil arching effect. When the ratio is between 1.1 and 1.14, the soil arching effect is active, with the highest development degree observed at a depth of 4 m, where the ratio reaches 1.1. When the ratio exceeds 1.23, the soil arching effect fails. Within the depth range of 2–6 m, the ratio reaches its minimum at 4 m, where the soil arch ring is the thickest, and the soil arching effect is fully developed. In this depth range, the soil arch resembles a circular arch shape along the pile depth. The soil arching effect attains peak intensity within specific intermediate depths of stabilizing piles, diminishing progressively in shallow and deep zones. This stratification stems from depth-dependent confinement effects and evolving soil-pile interaction mechanisms. Shallow zones exhibit inadequate arch development due to low confinement and weak particle interlocking, while excessive deep-layer confinement induces soil rigidity that restricts stress redistribution. Optimal arch formation occurs at intermediate depths where moderate confinement balances soil deformability and interparticle stress transfer, enabling dynamic equilibrium between pile displacement and soil constraints. Here, controlled deformation maintains arch geometry through particle reorganization, contrasting with shallow zones where excessive displacement disrupts arch integrity and deep strata where insufficient shear mobilization prevents effective stress transfer.
4.3 Impact of soil strength weakening
The fluctuation of reservoir water levels, rainfall and changes in the temperature field (Ahmad et al., 2021; Ahmad et al., 2025) significantly affect the stability of slopes, as they affect the physical and mechanical properties of the soil through weting-drying cycles. These changes in soil properties, in turn, influence the overall stability of the slope. In particular, prolonged exposure of landslide soil to these weting-drying cycles can lead to the weakening of soil shear strength, which impacts the soil arching phenomenon. In reference (Zhou et al., 2022), the variation patterns of shear strength parameters in landslide soils from Wanzhou District, Chongqing under wet-dry cycles were systemati-cally investigated, with key findings summarized in Table 3. Drawing on their findings, we investigate how different numbers of wet-dry cycles impact the weakening of soil shear strength and its subsequent effect on the soil arching effect. For consistency with the previous sections, we set the landslide thrust to 80 kN/m2, fixed the calculation profile at a depth of 4 m, and varied the shear strength parameters of the sliding soil for each calculation.
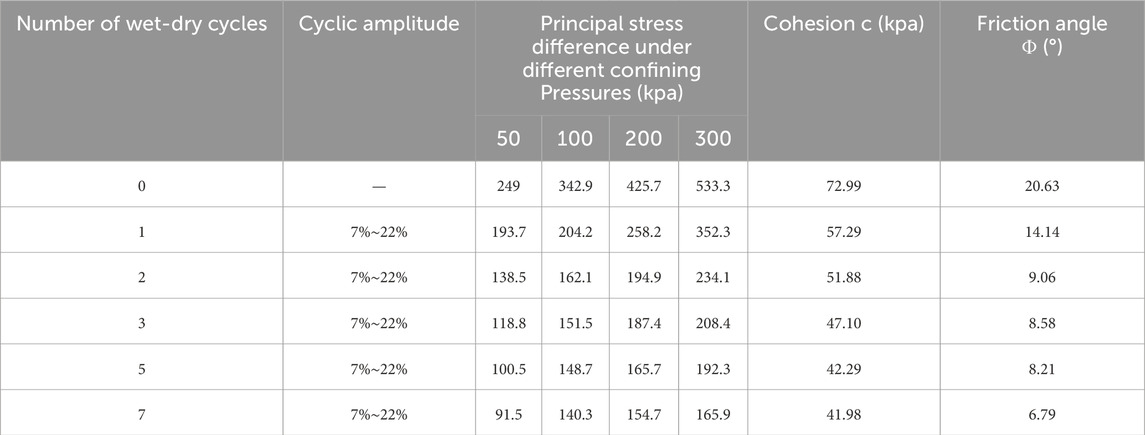
Table 3. Variation characteristics of soil arching with landslide thrust.
In Figure 8, the thickness of the soil arch ring shows no significant changes during the first 0 to 5 wet-dry cycles. However, after 7 cycles, only a stress concentration zone remains behind the pile, indicating the failure of the soil arching effect. Figure 9 illustrates that the number of wet-dry cycles leads to an increase in stress in the direct soil arch zone behind the pile, thereby influencing the development of the soil arching effect. The average stress ratio in the soil arching zone follows a pattern of initially decreasing and then increasing as the number of wet-dry cycles increases. Under natural conditions, the average stress ratio (Rσ) at this depth is 1.1, representing the maximum development of the soil arching effect. After two wet-dry cycles, the effect weakens, but with more than two cycles, the effect is enhanced. However, when the number of cycles reaches seven, the soil arching effect fails. Therefore, under the influence of wet-dry cycling, the development degree of the soil arching effect at this depth experiences a phase of initial weakening, followed by enhancement, and ultimately failure.
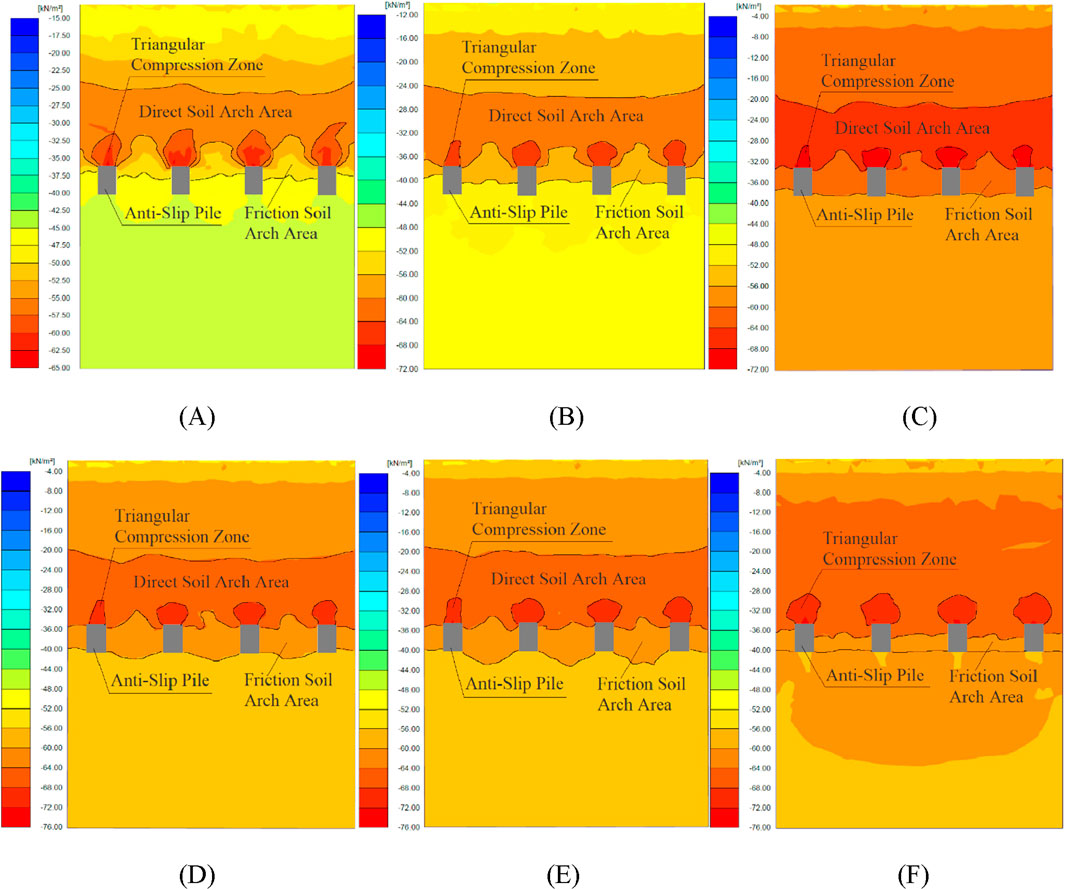
Figure 8. Stress Cloud Diagram at the Same Depth in the Slide Body for Different Wet-Dry Cycle Durations. (A) Progressive stress redistribution characteristics during cyclic saturation stage (0 wet-dry cycles); (B) Stress redistribution characteristics under initial wet-dry cycle conditioning; (C) Progressive stress redistribution characteristics during cyclic saturation stage (2 wet-dry cycles); (D) Progressive stress redistribution characteristics during cyclic saturation stage (3 wet-dry cycles); (E) Progressive stress redistribution characteristics during cyclic saturation stage (5 wet-dry cycles); (F) Progressive stress redistribution characteristics during cyclic saturation stage (7 wet-dry cycles).
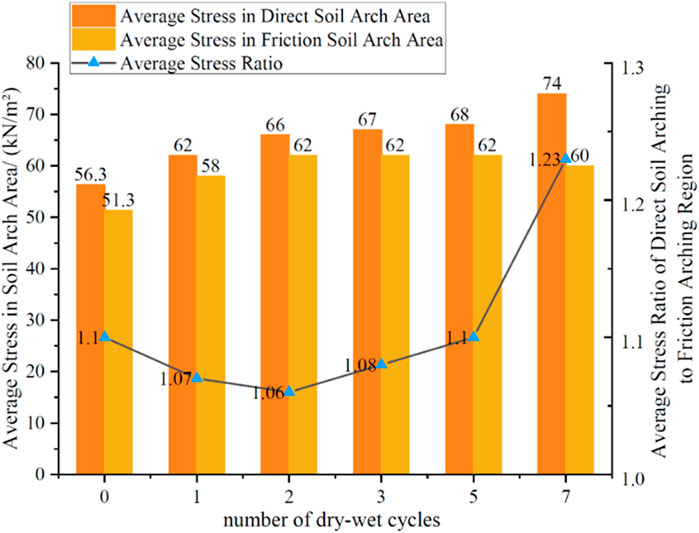
Figure 9. Average stress and stress ratio in the soil arching zone.
5 Discussions
This study establishes an analytical linkage between thrust variation and soil arching evolution in pile-soil systems, proposing the thrust-to-cohesion ratio as a discriminative index for preliminary assessment of arching development. Fundamentally, both shear strength parameters (c and Φ) intrinsically govern arching mechanisms, though the proposed index specifically simplifies the equilibrium analysis between soil strength and external loading. Notably, this dimensionless parameter demonstrates limited applicability in cohesionless soils due to the absence of cohesive components.
To streamline the analytical framework, groundwater seepage effects were not incorporated into the current investigation, which may impose potential limitations. Hydraulic interactions critically influence arching behavior through two primary pathways: (1) pore pressure fluctuations altering effective stress distribution patterns that dictate arch formation mechanics and load-bearing capacity; (2) directional coupling between seepage forces and principal stress trajectories potentially modifying soil failure modes. Future investigations should implement coupled fluid-solid interaction simulations to quantify arching evolution under varying permeability coefficients and hydraulic gradients, complemented by physical modeling with dye tracer techniques and pore pressure transducers for synergistic monitoring of seepage-stress field interactions.
6 Conclusion
The key factors influencing the development of soil arching effect were analytically derived through mechanical modeling and subsequently validated through numerical simulations. This study demonstrates the feasibility of establishing dual evaluation criteria: using the thrust-to-cohesion ratio to delineate threshold boundaries for arching effect initiation, and employing the stress mean ratio within the arching zone to assess the degree of arching development. The principal findings can be summarized as follows:
6.1 Impact of landslide thrust on the soil arching effect
Variations in landslide thrust significantly influence the soil arching effect within the soil mass. Within a specific range, changes in landslide thrust can enhance the soil arching effect; however, if the thrust exceeds this range, the effect is compromised. The thrust-to-cohesion ratio (Rqc) exhibits a threshold-dominated control effect on the evolution of soil arching. Specifically, the lower threshold (Rqc = 3.3) governs the initial formation conditions of soil arches, while the upper threshold (Rqc = 6.0) signifies the load-bearing capacity limit of arch structures. Three characteristic regimes are identified: (1) an embryonic stage (Rqc = 2.7–3.3) corresponding to arch nucleation, (2) a strengthening and development stage (Rqc = 4.0–5.3) marked by progressive structural consolidation, and (3) a degradation regime (Rqc >6.0) characterized by progressive arch failure beyond the critical threshold.
6.2 Impact of pile depth on the soil arching
The development of the soil arching effect varies with pile depth, initially decreasing and then increasing, peaking at a depth of 4 m. Within a certain depth range along the pile, the soil arching effect approximates a circular arch shape, suggesting a deeper, more sta-ble soil arch configuration.
6.3 Effect of wet-dry cycles on the soil arching effect
The number of wet-dry cycles significantly impacts both the stress distribution in the direct soil arch zone behind the pile and the overall development of the soil arching effect. After two cycles, the soil arching effect begins to weaken, but further cycles enhance it. However, when the number of wet-dry cycles reaches seven, the soil arching effect fails. Thus, the development of the soil arching effect under wet-dry cycling follows a pattern of initial weakening, subsequent strengthening, and eventual failure.
6.4 Use of average stress ratio to assess soil arching effect
Using the average stress ratio in the soil arching zone as a criterion for evaluating the development of the soil arching effect has been shown to be effective. When the average stress ratio (Rσ) is between 1 and 1.14, the soil arching effect is present, with the stress in the direct soil arch zone exceeding that in the frictional soil arch zone. The maximum development of the soil arching effect occurs when the ratio is 1.1. Ratios between 1 and 1.1 correspond to the development stage, while ratios from 1.1 to 1.14 indicate a process of stress redistribution and reformation of the soil arch. When the ratio exceeds 1.23, the di-rect soil arch fails, leading to the collapse of the soil arching effect.
Data availability statement
The original contributions presented in the study are included in the article/supplementary material, further inquiries can be directed to the corresponding author.
Author contributions
CZ: Funding acquisition, Methodology, Writing – review and editing, Supervision. ZQ: Methodology, Software, Writing – original draft, Data curation. GL: Validation, Writing – original draft. HX: Validation, Writing – original draft.
Funding
The author(s) declare that financial support was received for the research and/or publication of this article. This research was funded by the Youth Program of the National Natural Science Foundation of China (Grant No. 41002112).
Conflict of interest
The authors declare that the research was conducted in the absence of any commercial or financial relationships that could be construed as a potential conflict of interest.
Generative AI statement
The author(s) declare that no Generative AI was used in the creation of this manuscript.
Publisher’s note
All claims expressed in this article are solely those of the authors and do not necessarily represent those of their affiliated organizations, or those of the publisher, the editors and the reviewers. Any product that may be evaluated in this article, or claim that may be made by its manufacturer, is not guaranteed or endorsed by the publisher.
References
Ahmad, S., Rizvi, Z. H., Arp, J. C. C., Wuttke, F., Tirth, V., and Islam, S. (2021). Evolution of temperature field around underground power cable for static and cyclic heating. Energies 14, 8191. doi:10.3390/en14238191
Ahmad, S., Rizvi, Z. H., and Wuttke, F. (2025). Unveiling soil thermal behavior under ultra-high voltage power cable operations. Sci. Rep. 15, 7315. doi:10.1038/s41598-025-91831-1
An, L., Xu, M. X., and Li, J. (2024). The stability analyses of tunnel faces in saturated soils with soil arching effect. Geofluids, 2871926. doi:10.1155/2024/2871926
Bi, Z., Gong, Q., Guo, P., and Cheng, Q. (2020). Experimental study of the evolution of soil arching effect under cyclic loading based on trapdoor test and particle image velocimetry. Can. Geotech. J. 57, 903–920. doi:10.1139/cgj-2019-0205
Fang, Y. G., Hou, M. X., and Gu, R. G. (2015). Visual analysis of initiation of soil arching effect in piled embankments. Chin. J. Geotech. Eng. 37, 1678–1684. doi:10.11779/CJGE201509016
Fei, K., Chen, Y., and Wang, J. J. (2013). Study of development of soil arching effect in piled embankment. Rock Soil Mech. 34, 1367–1374. doi:10.16285/j.rsm.2013.05.025
Fu, Y. W. (2017). Analysis of anti slide pile arch development mechanism and parameter influence. Master’s thesis. Chongqing, China: Chongqing Jiaotong University.
Han, G. X., Gong, Q. M., and Zhou, S. H. (2013). Analysis of microcosmic mechanism of soil arching in frictional geotechnical material by particle flow simulating. Rock Soil Mech. Eng. 34, 1791–1798. doi:10.16285/j.rsm.2013.06.024
Han, T. C., Qiu, Z. Y., and Dou, H. Q. (2016). Soil arching effect between anti-slide piles based on YADE discrete element method. J. Cent. South Univ. Sci. Technol. 47, 2715–2722. Accessed Available online at: http://zkxb.csu.edu.cn/thesisDetails?columnId=22766038&Fpath=home&index=0&lang=zh.
Li, C. D. (2009). Study on interaction mechanism between anti-slide pile and landslide mass and pile optimization. Wuhan, China: China University of Geosciences. PhD dissertation.
Li, C. D., Tang, H., Hu, X., and Wang, L. (2013). Numerical modelling study of the load sharing law of anti-sliding piles based on the soil arching effect for Erliban landslide, China. KSCE J. Civ. Eng. 17, 1251–1262. doi:10.1007/s12205-013-0074-x
Liu, Q., Li, D. Y., and Liu, Z. X. (2011). Numerical analysis of influence factors on soil arching effect between anti-sliding piles under horizontal pushing loads. J. Cent. South Univ. Sci. Technol. 142, 2071–2077. Accessed Available online at: https://en.cnki.com.cn/Article_en/CJFDTOTAL-ZNGD201107040.htm.
Liu, Q. W. (2022). Evolution law and theoretical model of soil arching in sand. PhD dissertation. Changsha, China: Hunan University.
Liu, Z., Yan, Z., Wang, X., Li, J., and Qiu, Z. (2021). Effect of the inclined pile-soil arch in a soil landslide reinforced with anti-sliding piles. Nat. Hazards. 106, 2227–2249. doi:10.1007/s11069-021-04541-y
Rizvi, Z. H., Mustafa, S. H., Sattari, A. S., Ahmad, S., Furtner, P., and Wuttke, F. (2020). “Dynamic lattice element modelling of cemented geomaterials,”. Advances in computer methods and geomechanics. Lecture notes in civil engineering. Editors A. Prashant, A. Sachan, and C. Desai (Singapore: Springer), 55, 655–665. doi:10.1007/978-981-15-0886-8_53
Rui, R., van Tol, F., Xia, X. L., van Eekelen, S., Hu, G., and Xia, Y. y. (2016). Evolution of soil arching; 2D DEM simulations. Comput. Geotech. 73, 199–209. doi:10.1016/j.compgeo.2015.12.006
Rui, R., Ye, Y., Han, J., Zhai, Y. x., Wan, Y., Chen, C., et al. (2022). Two-dimensional soil arching evolution in geosynthetic-reinforced pile-supported embankments over voids. Geotext. Geomembr. 50, 82–98. doi:10.1016/j.geotexmem.2021.09.003
Shen, Y. J., Yang, M., Cui, H. H., Xiang, Z. L., Li, Y. Z., and Wen, K. (2015). Distribution characteristics and influence factors of soil arching ring behind stabilizing piles. Appl. Mech. Mater. 744, 474–478. doi:10.4028/www.scientific.net/amm.744-746.474
Song, J., Chen, K., Li, P., Zhang, Y., and Sun, C. (2018). Soil arching in unsaturated soil with different water table. Granul. Matter 20, 78–11. doi:10.1007/s10035-018-0849-3
Su, P. D., Zhang, H. C., and Qi, Z. K. (2023). Comparative study on soil arching effect of anti-slide piles with different sections. J. Disaster Prev. Mitig. Eng. 43, 405–412. doi:10.13409/j.cnki.jdpme.20210808001
Wang, G. L., Ran, L. B., and Zhang, L. (2019). Discrete element simulation and evolution pattern of three-dimensional soil arching between anti-slide piles. J. Civ. Environ. Eng. 41, 1–8. doi:10.11835/j.issn.2096-6717.2019.088
Wu, K., Chen, R. P., and Meng, F. Y. (2024). Centrifuge modeling of excavation and numerical analyses of soil arching below excavation base. Chin. J. Geotech. Eng. 46, 1236–1944. doi:10.11779/CJGE20230427
Xiang, X. C., Zhang, H., and Jiang, G. S. (2011). Soil arching effect of anti-slide piles based on particle flow method. Chin. J. Geotech. Eng. 33, 386–391. Accessed Available online at: http://www.cgejournal.com/article/id/13952.
Yang, T., Lu, Z., Ni, J., and Wang, G. (2019). 3D finite-element modelling of soil arch shape in a piled embankment. Proc. Inst. Civ. Eng. Geotech. Eng. 172, 255–262. doi:10.1680/jgeen.17.00185
Yang, T., Wang, G. G., and Yan, Y. Q. (2014). Shape of soil arching and development of its effect in a piled embankment. Chin. J. Geotech. Eng. 36, 731–735. doi:10.11779/CJGE201404018
Ye, G. B., Li, L. X., and Zhang, Z. (2022). Model tests on influences of fill density on soil arching effects using transparent soil. Chin. J. Geotech. Eng. 44, 20–24. doi:10.11779/CJGE2022S2005
Yue, G., Feng, F., and Jia, H. (2011). Numerical simulation of soil arching effect in deep foundation pit with different influencing factors. 2011 International Conference on Electrical and Control Engineering. China: Yichang, 2393–2397. doi:10.1109/ICECENG.2011.6058163
Zhan, Y. X., Yao, H. L., and Dong, Q. P. (2013). Soil arching effect analysis of anti-slide piles in loose media landslide. J. Shanghai Jiaot. Univ. 47, 1372–1376+1389. doi:10.16183/j.cnki.jsjtu.2013.09.008
Zhang, S., Li, C., Qi, H., Chen, X., and Ma, S. (2021). Soil arch evolution characteristics and parametric analysis of slope anchored anti-slide pile. KSCE J. Civ. Eng. 25, 14121–14132. doi:10.1007/s12205-021-1612-6
Zhong, W., Zhang, S., and He, N. (2022). Experimental study on soil arch behind anti-slide pile based on relative deformation method. Rock Soil Mech. 43, 315–326. doi:10.16285/j.rsm.2021.1028
Zhou, C. M., Zhu, R., and He, Q. (2022). Study on the variation law of sliding soil strength under different dry-wet cycles. J. Disaster Prev. Reduct. 38, 1–8. doi:10.13693/j.cnki.cn21-1573.2022.02.001
Zhuang, Y., Cui, X. Y., and Liu, H. L. (2013). 3D FE analysis of arching in a piled embankment. Chin. J. Geotech. Eng. 35, 118–123. Accessed. Available online at: http://www.cgejournal.com/article/id/15177.
Keywords: landslide, anti-slide pile, soil arching effect, development level, numerical simulation
Citation: Zhou C, Qin Z, Li G and Xing H (2025) Analysis of influencing factors on the soil arching effect of anti-slide piles in reservoir bank landslides. Front. Earth Sci. 13:1581491. doi: 10.3389/feart.2025.1581491
Received: 22 February 2025; Accepted: 18 April 2025;
Published: 29 April 2025.
Edited by:
Wenling Tian, China University of Mining and Technology, ChinaReviewed by:
Zarghaam Rizvi, GeoAnalysis Engineering GmbH, GermanyLei Zhang, China University of Geosciences, China
Copyright © 2025 Zhou, Qin, Li and Xing. This is an open-access article distributed under the terms of the Creative Commons Attribution License (CC BY). The use, distribution or reproduction in other forums is permitted, provided the original author(s) and the copyright owner(s) are credited and that the original publication in this journal is cited, in accordance with accepted academic practice. No use, distribution or reproduction is permitted which does not comply with these terms.
*Correspondence: Zihan Qin, ODc2MDAzODM2QHFxLmNvbQ==