 Limin Wang
 Shaoqiang Chai
- Seventh Engineering Bureau, CCCC Frist Highway Engineering Group Co., Ltd., Zhengzhou, China
The settlement behavior of high-filled road embankments and slopes in loess regions poses significant challenges to the safety and stability of engineering. The Interferometric Synthetic Aperture Radar (InSAR) technique was used to process the Sentinel-1A satellite data from 8 April 2021, to 9 May 2022. The spatiotemporal distribution characteristics of surface settlement were analyzed. The accuracy and reliability of the InSAR technology results were validated through comparison with actual measurement data, and the settlement behavior of the high-filled road after the completion of the pavement was further investigated. Results indicate that the most severe settlement occurred during the early post-construction phase, with maximum settlement rates reaching 32 mm/year and cumulative settlement peaking at 57 mm. These critical settlement zones located at the intersection of the road and the embankment slope and the south side of the embankment slope. Following the completion of the pavement, surface settlement stabilized to within 3 mm, indicating the structural safety and stability of the road. The results of finite element numerical simulation showed that the stability safety factor of the high-filled road embankment slope was 1.39, satisfying the safety limit requirements for slopes. The study demonstrated that InSAR technology can provide an effective technical means for the early identification of engineering hazard risks in loess regions, offering a basis for further monitoring, early warning, and scientific prevention.
1 Introduction
With the deep implementation of China’s transportation power strategy and the acceleration of urbanization, the construction of transportation infrastructure continues to advance at a high pace (Xiong et al., 2021). In recent years, the demand for highway construction in the loess regions of Northwest China has been continuously increasing (Mao et al., 2019; Luo et al., 2020). However, the geological conditions in the loess regions are complex, characterized by undulating hills and crisscrossing gullies. During construction, it is often necessary to carry out “mountain cutting, gully filling, and land creation” activities on the loess sites, resulting in a large number of high-fill road engineering projects have emerged (Chen et al., 2018; Li et al., 2019). During the construction of high-fill road engineering projects, the significant height of the fill soil layers results in prominent settlement issues. Severe uneven settlement and the sliding of embankment slopes can easily lead to road deformation and damage (Sidle et al., 2014; Zhao et al., 2022; Huang et al., 2018), posing a serious threat to the safe operation and lifespan of the road projects. The settlement and slope instability issues of high-filled embankment roads have become one of the main challenges in the construction of transportation infrastructure in loess areas (Gao et al., 2016; Zhang et al., 2019a). Therefore, it is highly necessary to conduct real-time monitoring and stability analysis of high-fill roads and slopes. This can provide scientific guidance for the safety evaluation of road engineering and disaster prevention, offering technical support and assurance for transportation infrastructure construction in loess regions. This holds significant engineering importance.
Due to the characteristics of settlement and slope deformation in high-filled embankment road projects, traditional monitoring methods have certain limitations. Ground leveling measurement method and GNSS measurement method require a significant investment of manpower and resources, have a large workload, and high costs. Additionally, these methods are based on observations at specific points, with limited monitoring range and density (Abidin et al., 2015; Zhou et al., 2022; Zhang et al., 2022), making it unable to comprehensively reflect the settlement and deformation of roads and slopes. In comparison to traditional monitoring methods, Interferometric Synthetic Aperture Radar (InSAR) technology, based on microwave remote sensing, measures the phase difference of the ground to obtain surface deformation information. It offers advantages of high precision, all-weather capability, and continuous monitoring, providing high spatiotemporal resolution data for large-scale and long-term surface deformation monitoring (Hooper et al., 2004; Singleton et al., 2014; Casagli et al., 2010; Huang et al., 2024; Hu et al., 2014). InSAR technology has been widely applied in surface deformation monitoring (Zhou et al., 2023; Zhu et al., 2022; Chen et al., 2020; Shi et al., 2019a; Zhu et al., 2019), landslide monitoring (Fang et al., 2024; Zhao et al., 2018; Wei et al., 2024;Shi et al., 2019b; Zhang J. et al., 2021), and early identification and warning of geological hazards (Dong et al., 2021; Ge et al., 2019). For example, Zhou et al. (2017) used InSAR technology to study the characteristics of surface settlement in Wuhan, China, revealing highly uneven surface settlement with four significant subsidence areas identified. Surface settlement in Wuhan is primarily influenced by human activities, soil compression, carbonate rock dissolution, and excessive groundwater extraction. Zhang L. et al. (2021) utilized InSAR technology to monitor the surface along the Lin-zhi-Ya’an section of the Sichuan-Tibet Railway in China, accurately identifying the distribution and quantity of landslides along the route and analyzing the main controlling factors causing landslides. Zhou et al. (2022) used the InSAR method to monitor and analyze ground settlement in the Yan’an New District of the Loess Plateau in China. Their study found a strong linear relationship between settlement and topographic elevation changes. The primary cause of settlement in the fill areas was identified as the compaction of remolded loess. Zhang et al. (2022) monitored the ground deformation of Ankang Airport in China from its construction to the initial operation using interferogram phase optimization and PS-InSAR technology. The study analyzed the spatiotemporal distribution characteristics of overall ground deformation after the completion of Ankang Airport, showing that the excavation area of Ankang Airport is relatively stable, while the surface deformation in the filling area is significant and uneven, and the deformation characteristics of high filling slopes with expansive soils are closely related to slope gradient, rainfall, and filling depth. In summary, InSAR technology has been proven to effectively monitor surface settlement and has been widely applied. However, there is still relatively little research on the application of InSAR technology in the settlement of high-filled embankment roads and the stability of slopes in loess areas. It is necessary to further carry out related studies in this field.
In view of this, this paper utilizes InSAR technology to monitor the settlement of a high-filled embankment road and its slopes in the loess area. The ascending track Sentinel-1A satellite data from 8 April 2021, to 9 May 2022, is processed to obtain the annual average deformation rate and time series results of the high-filled embankment road and slope area, and to extract the spatial distribution characteristics of post-construction settlement. By comparing with actual ground leveling measurement data, the reliability of InSAR technology in monitoring the results of the high-filled embankment road project is verified, and the actual settlement situation of the high-filled embankment road after construction is further investigated. Finally, a numerical model of the high-filled embankment road and slopes is established using the finite element software ABAQUS to study the slope stability based on the finite element strength reduction method and the dynamic response characteristics of the slopes under seismic actions, aiming to provid technical guidance for subsequent deformation management in high-filled road areas and similar high-filled engineering projects.
2 Overview of the study area
2.1 Background of the study area
The study area belongs to the Yellow River III-level terrace, characterized by a relatively flat and open terrain with abundant vegetation cover and well-developed surface plant roots. The soil layers mainly consist of loess-like silt and silty clay, with some areas containing fine sand. The loess-like soil exhibits collapsibility and has a uniform texture, appearing yellowish-brown in color. The upper surface soil layer is often loose due to human disturbance and has low bearing capacity.
The specific location of the study area is shown in Figure 1. It is located in the mid-latitude inland region, mostly characterized by a warm temperate continental monsoon climate with cold winters and hot summers, and distinct four seasons. The average annual temperature is 13.8°C, with extreme minimum temperatures reaching −16.5°C and extreme maximum temperatures reaching 43.2°C. The average annual sunshine duration is 2,261.7 h, with a frost-free period of 216 days. The dominant wind direction is southeast, with an average wind speed of 2.9 m/s and a maximum wind speed of 17 m/s. Due to the complex geomorphological features, the area exhibits a diverse climate, including warm temperate, temperate, and cold temperate climates. Within the embankment construction area, no groundwater was found during the survey. The main water source is from atmospheric precipitation and surface water infiltration, following the natural dynamics of infiltration-runoff-evaporation.
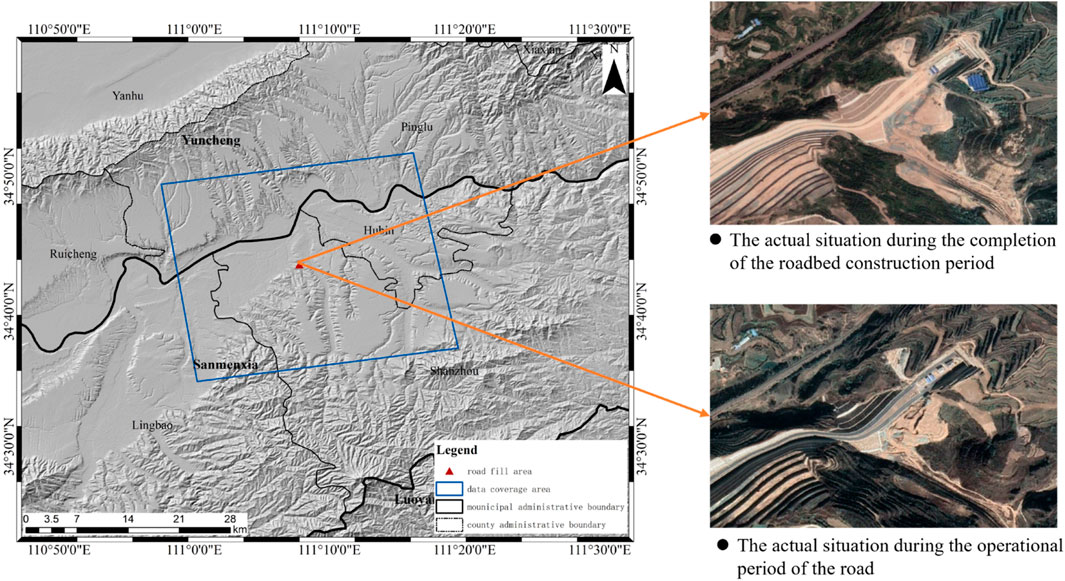
Figure 1. Location of the study area and Sentinel-1A data coverage.
The road project is designed as a dual six-lane carriageway, and the maximum height of the high-filled road embankment slope is 48.5 m. Figure 2 illustrates the cross-section of the high-filled road embankment and the on-site construction drawing. To ensure the compaction of the road embankment and reduce post-construction settlement, the road embankment is treated with dynamic compaction to eliminate the collapsibility of the road embankment. Dynamic compaction is performed every 4 m of filling to provide additional compaction. To prevent the shrinkage failure of the loess due to water infiltration into the foundation, the base is treated with dynamic compaction to eliminate the collapsibility. After the construction of the high-filled road embankment, a natural settlement period of more than 1 year is designed to eliminate 60%–70% of the consolidation settlement. This can effectively reduce the settlement during the operation period of the road and improve the stability of the road embankment.
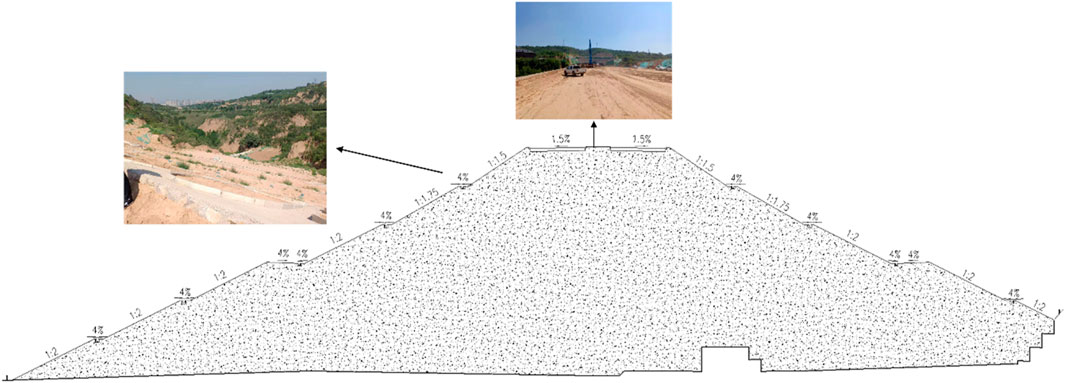
Figure 2. High-filled road embankment filling section diagram and on-site construction drawing.
2.2 Experimental data
The experiment collected a total of 31 scenes of Sentinel-1A SAR data from the European Space Agency (ESA) covering the research area from April 2021 to December 2023, along with Precise Orbit Ephemerides (POD) and 30 m resolution SRTM DEM data. The coverage of Sentinel-1A data is shown in Figure 1, and the parameters of the SAR data are listed in Table 1.

Table 1. Main parameters of Sentinel-1A data set.
3 Overview of the study area
3.1 D-InSAR technique
Synthetic Aperture Radar Differential Interferometry (InSAR) technology refers to the use of two SAR images from the same region, one of which is a pre deformation image and the other is a post deformation image, to obtain monitoring technology for surface deformation through differential interferometry processing. The phase in D-InSAR measurements contains the information on the difference in propagation path lengths between the radar antenna and the target for two radar images. Factors such as satellite measurement conditions, measurement time, atmospheric conditions, etc., affect the length of the radar wave propagation path. After removing the atmospheric effects and employing specific algorithms to eliminate the interferometric phase caused by the satellite’s position changes, the interferometric phase of ground deformation can be obtained. This process enables the monitoring of ground deformation in the study area. Methods to eliminate the topographic interferometric phase include the two-track method, three-track method, and four-track method. Due to the noise introduced in phase unwrapping in the three-track method and the large data volume and complex data processing required in the four-track method, the two-track method is chosen. This method involves processing several sets of data taken at similar times using D-InSAR, ultimately providing ground deformation data for the area of interest.
The two-track method utilizes two SAR images, one before deformation and one after deformation, as a deformation pair. By using a DEM, the topographic phase is calculated and then interferometric processing is applied to the deformation pair. Subsequently, based on the imaging geometry of the two images and the DEM, the topographic phase is simulated. Finally, the deformation phase is obtained by subtracting the topographic phase from the deformation pair phase. The interferogram removes the interference of the topographic phase, reduces the density of interference fringes, and improves the phase unwrapping accuracy. The two-track method has two major advantages: firstly, it requires the least amount of SAR data, making it possible to monitor areas with limited data availability. Moreover, it involves fewer processing steps, thus reducing the risk of errors due to improper data processing. Secondly, by using an external DEM to eliminate the topographic phase, the method significantly reduces the effects of atmospheric delays caused by the ionosphere, humidity, temperature, troposphere, etc., thereby enhancing monitoring accuracy.
3.2 SBAS-InSAR technique
SBAS-InSAR (Small Baseline Subset InSAR) is a short baseline differential interferometry method proposed by Berardino in 2002, based on earlier D-InSAR principles for efficiently capturing continuous deformation (Berardino et al., 2002). The fundamental idea involves dividing all SAR images into different short baseline subsets based on certain spatiotemporal baselines, processing each subset through interferometry, utilizing a minimum cost flow unwrapping method for phase unwrapping, and finally use singular value decomposition (SVD) to obtain the minimum norm solution to obtain the time series deformation (Hu et al., 2016). This method combines data into several subsets with small baselines within each set and larger baseline distances between subsets. It is an InSAR time series analysis method for estimating surface deformation by using small spatiotemporal baseline interference pairs, overcoming the decorrelation issues caused by long spatiotemporal baselines in conventional D-InSAR techniques. This approach reduces the requirements for SAR image data, enhances the spatial density of observation points, and finds wide application in monitoring surface subsidence at low resolutions and large scales.
For N+1 SAR images covering the same area acquired in a certain time sequence, one image is selected as the master image for registration. Subsequently, appropriate time and spatial baseline thresholds are set for interferogram combination and network construction. The combined image pairs are differentially interfered to generate M interferograms, where M satisfies the following Equation 1:
Assuming two sets of SAR images acquired at different times tA、tB (tB > tA), with the SAR image at time tB chosen as the master image for differential interferometry, the interferometric phase obtained for a specific pixel in the jth interferogram can be expressed as:
In the equation,
Equation 2 can be further expressed as Equations 3–5:
In the equation,
Considering that the SRTM elevation data was acquired in 2000 and can no longer reflect the topographic undulations after the construction of the high - filled road, the topographic phase error is the main component of the differential interferometric phase. Therefore, the correction of the DEM error was given special consideration during the InSAR data processing. Firstly, the interferometric pairs with long spatial baselines and short temporal baselines were selected to calculate the DEM error. Then, the calculated DEM error was iteratively updated into the original DEM for DEM refinement. Finally, differential interferometry was carried out again, and the interferometric pairs with shorter spatiotemporal baselines were selected for time-series InSAR processing, so as to obtain the surface deformation results of the high-filled road.
The specific processing workflow for monitoring settlement using InSAR technology is shown in Figure 3: First, obtain (N+1) Sentinel-1 remote sensing images covering the study area. Select one of these images as the master image and register the remaining (N) images to the chosen master image. Next, perform precise orbit determination on the SAR images using orbital data, and align the master image with external DEM data to remove the topographic phase from the SAR images. Subsequently, appropriate spatiotemporal thresholds are set according to the quality of the SAR images. In the experiment, the selected time - baseline threshold is 49 days, and the spatial - baseline threshold is ±200 m to generate a sufficient number of high - quality interferometric pairs. The differential interferogram is filtered by the method of adaptive filtering. The selection of the filter size is of great importance. If the filter size is too small, the noise cannot be removed effectively. On the contrary, if the filter size is too large, it will cause the loss of ground object information and prolong the data processing time. In this experiment, two - stage filtering is carried out, with the filter windows being 64 × 64 and 32 × 32 respectively. Select a point with good coherence as the reference point for phase unwrapping, and perform phase unwrapping on all differential interferograms. Finally, estimate linear deformation, DEM errors, and residual topographic phases based on the interferometric phases and spatiotemporal baselines. Apply spatial high-pass filtering and temporal low-pass filtering sequentially to the decomposed results to separate atmospheric phases and nonlinear deformation phases. The linear deformation and nonlinear deformation components are then combined to obtain the final time-series results and the LOS (Line-of-Sight) deformation rate results.
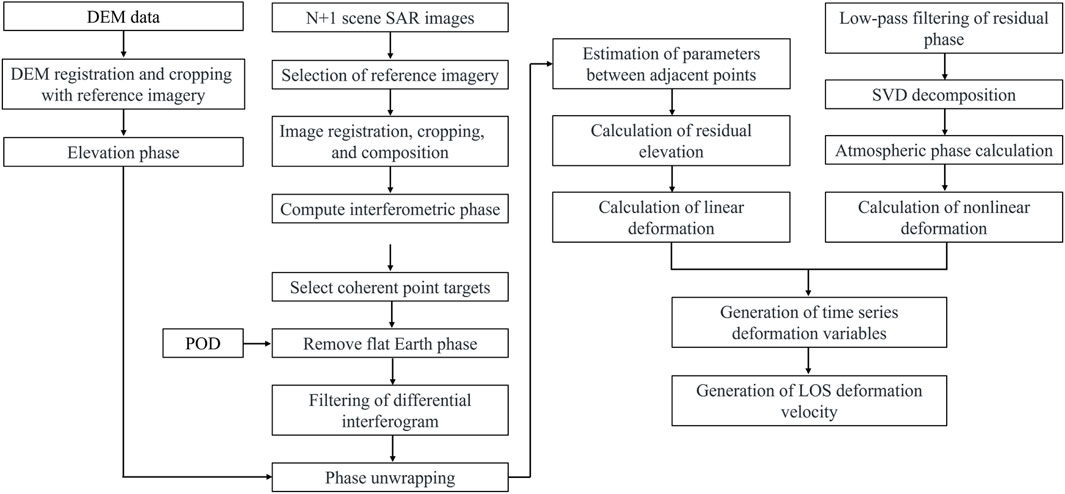
Figure 3. The flow chart of SBAS-InSAR technology.
4 Result analysis
4.1 Analysis of post-construction surface settlement
The embankment construction for the high-filled road in the study area took place from March 2020 to March 2021. In order to assess the actual post-construction surface subsidence of the high-filled road, the SBAS-InSAR technique was employed to obtain the average deformation rate results and time series deformation results from 8 April 2021, to 9 May 2022. To further investigate the surface deformation characteristics of the high-filled embankment over a specific time interval, the D-InSAR technique was employed to obtain and analyze surface deformation measurements at different time periods. This approach enables a comprehensive understanding of the post-construction settlement behavior of the high-filled embankment, providing valuable reference data for subsequent stability analyses and safety evaluations.
4.1.1 SBAS-InSAR results
Using SBAS-InSAR technology to extract surface deformation characteristics information from Sentinel-1 A radar data covering the study area, the average annual surface deformation rate in the Line-of-Sight (LOS) direction of the high-filled road and the slopes on both sides of the road embankment area was obtained (refer to Figure 4).
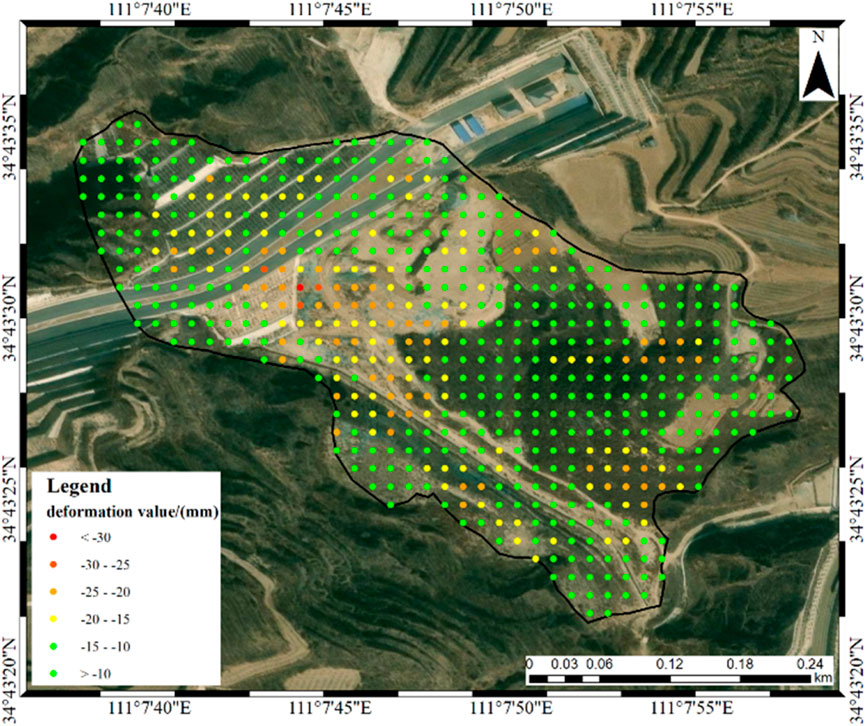
Figure 4. Annual average surface deformation rate map of high-filled road embankment.
In Figure 4, red color in the deformation rate indicates the surface moving away from the satellite motion along the radar line of sight (indicating surface subsidence). It can be observed from Figure 4 that during the period from 8 April 2021, to 9 May 2022, most areas of the high-filled road did not show significant surface deformation. However, localized regions and the slopes on both sides of the road embankment experienced varying degrees of surface subsidence, with the maximum settlement area is located at the intersection of the middle of the road and the embankment slope, as well as the location of the embankment slope on the south side, with a maximum subsidence rate of 32 mm/year. In order to reveal the deformation characteristics and evolution laws of the settlement of high-filled road and embankment slopes on both sides at the spatial scale, the time-series deformation results in the LOS direction covering the high-filled area were obtained, as shown in Figure 5. The deformation spatial evolution for different time periods is referenced to 8 April 2021, assuming zero surface deformation in the high-filled area at that time. From Figure 5, it can be observed that subsidence initially occurred at the foot of the southern embankment slope of the high-filled road, with a subsidence of approximately 15 mm. Subsequently, subsidence gradually appeared on the surface of the embankment slope, with a rapid increase in the magnitude of subsidence. Simultaneously, the area of surface subsidence continued to expand towards the direction of the road and radiated towards the embankment slope on the north side of the road. Over time, the degree of surface subsidence in the high-filled road and the slopes on both sides of the road embankment area continued to worsen, with the most severe subsidence occurring in the central part of the road and the southern embankment slope, reaching a maximum subsidence of 57 mm. Considering the actual embankment construction conditions, it was found that the excessive subsidence in this area was due to the maximum thickness of the embankment fill soil, which leads to an increase in the load on the fill soil particles, causing more particles to rearrange and compress, ultimately resulting in an increase in the subsidence of the fill soil. The following measures can be adopted for reinforcement in engineering: geogrids or geotextiles can be laid internally at the intersection of the road and the embankment slope to enhance the overall stability of the soil and reduce uneven settlement. Cement grouting can be injected at the intersection of the road and the embankment slope to improve deformation resistance. Additionally, a drainage system should be established, including drainage ditches and impermeable membranes installed at the top of the embankment slope to quickly remove surface water, thereby preventing rainwater infiltration into the subgrade, which could cause excessive settlement.
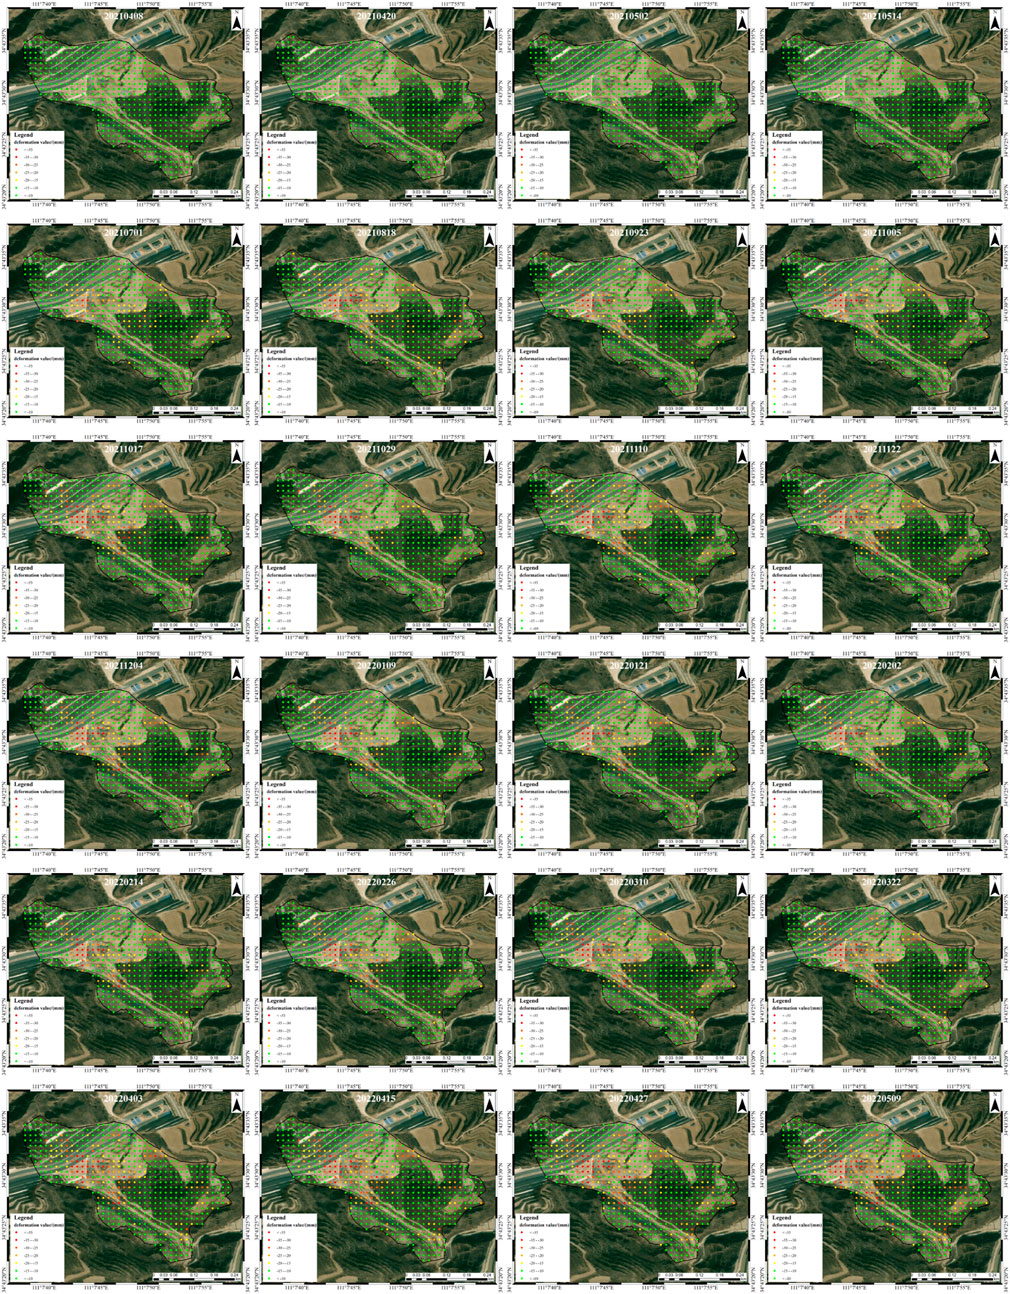
Figure 5. Time series deformation map of high-filled road embankment.
To study the temporal evolution characteristics of surface subsidence in the high-filled road and the slopes on both sides of the road embankment, two representative profile lines were extracted along the centerline of the road and the embankment slope, as shown in Figure 6. Figure 7a shows the time series subsidence curve along profile lines A-B, while Figure 7b shows the time series subsidence curve along profile lines C-D. In Figure 7a, the horizontal axis represents the horizontal distance between each point on the A-B section line and point A, and the vertical axis represents the surface deformation. It can be observed from Figure 7a that with the passage of time, the amount of surface subsidence along the road centerline continuously increases, with the maximum subsidence point located approximately 165 m from point A. By 9 May 2022, the maximum subsidence at this point reached 30 mm. In Figure 7b, the horizontal axis represents the distance from point C along profile lines C-D, and the vertical axis represents the surface deformation. Similar to profile lines A-B, the amount of surface subsidence along the embankment slope line continuously increases over time. The maximum subsidence point is located approximately 150 m from point C. By 9 May 2022, the maximum subsidence at this point reached 48 mm.
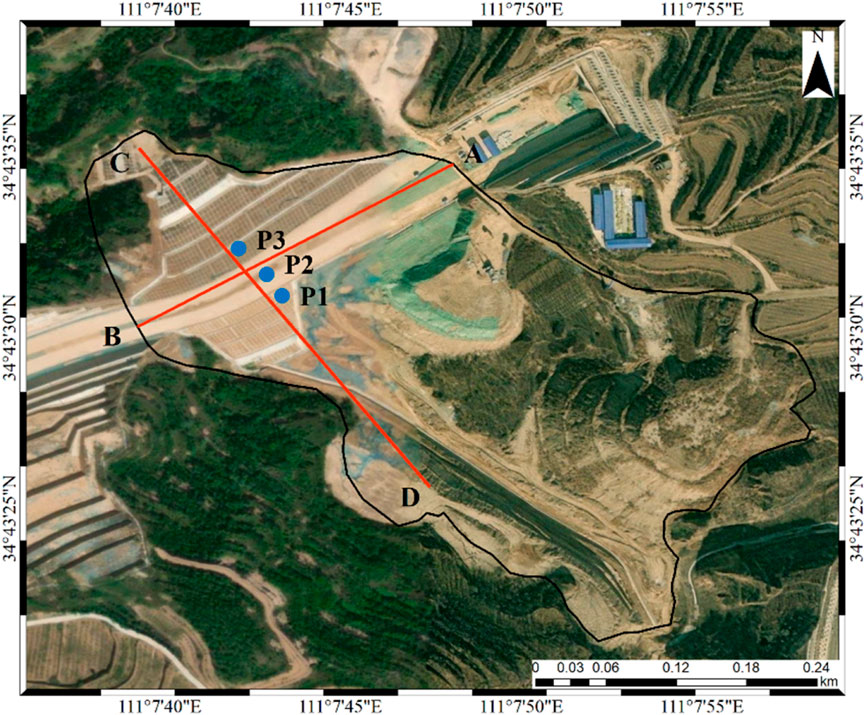
Figure 6. Profile position map.
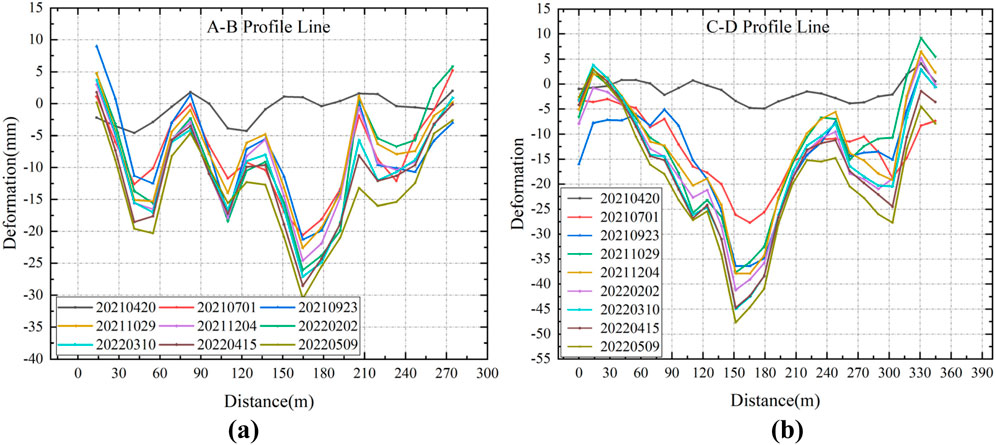
Figure 7. Time series settlement curve: (a) Road centerline; (b) Road embankment.
To further investigate the temporal evolution characteristics of points on the high-filled road and the slopes on both sides of the road embankment, three feature points, P1, P2, and P3, were extracted in the fill soil area. The time series subsidence curves of these three feature points are shown in Figure 8, and the specific positions of these points can be seen in Figure 6. Points P1 and P3 are in the embankment slope area, while point P2 is in the road area. From Figure 8, it can be observed that points P1, P2, and P3 all exhibit nonlinear subsidence at different rates. The evolution of surface subsidence over time experienced two subsidence deformation stages: rapid subsidence followed by deceleration. Initially after construction, there was a rapid subsidence stage with a high subsidence rate. As time passed, the subsidence gradually slowed down, and the subsidence rate decreased. This is because after the construction of the loess fill, consolidation settlement and secondary consolidation settlement occur. Consolidation settlement deformation is fast and significant, while secondary consolidation deformation is slower and smaller. Furthermore, as of 9 May 2022, it can be observed that point P1 had the highest cumulative subsidence of 46 mm, followed by point P2 with a subsidence of 25 mm, and point P3 with the lowest cumulative subsidence of 22 mm. This indicates that the subsidence situation is more severe in the southern embankment slope.
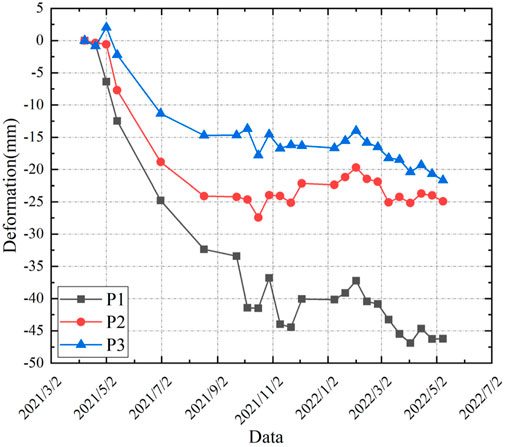
Figure 8. Time series subsidence curves of feature points.
4.1.2 D- InSAR results
To further analyze the spatial surface deformation characteristics of high-filled roads and embankment slopes over a specific time interval. D-InSAR processing was conducted on 25 scenes of Sentinel-1 data from 8 April 2021, to 9 May 2022. The deformation maps for some time periods are shown in Figure 9. As depicted in Figure 9, except for the periods from 22 November 2021, to 21 January 2022, and from 21 January 2022, to 22 March 2022, where surface subsidence mainly occurred in the original unconstructed area on the south side of the road, in the remaining time periods, surface subsidence predominantly took place on the road and the embankment slopes. During the period from 14 May 2021, to 1 July 2021, which corresponds to the initial stage after the completion of the high-filled road embankment construction, the largest area of surface subsidence was observed, with a maximum subsidence of 37 mm.
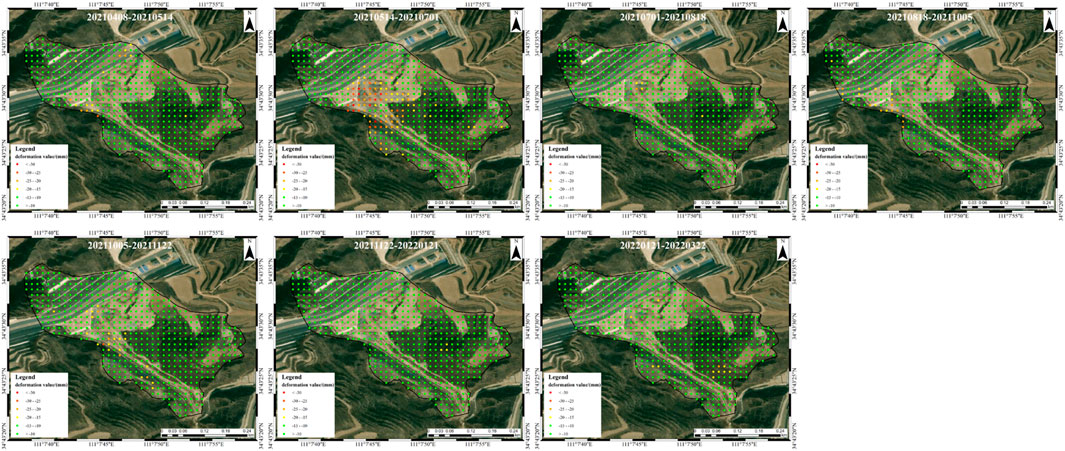
Figure 9. D-InSAR result of high fill road embankment.
4.2 Accuracy verification
To verify the reliability of applying InSAR technology in monitoring the subsidence and deformation of the high-filled road and slopes, four benchmark points within the study area shown in Figure 10 were selected for comparative analysis.
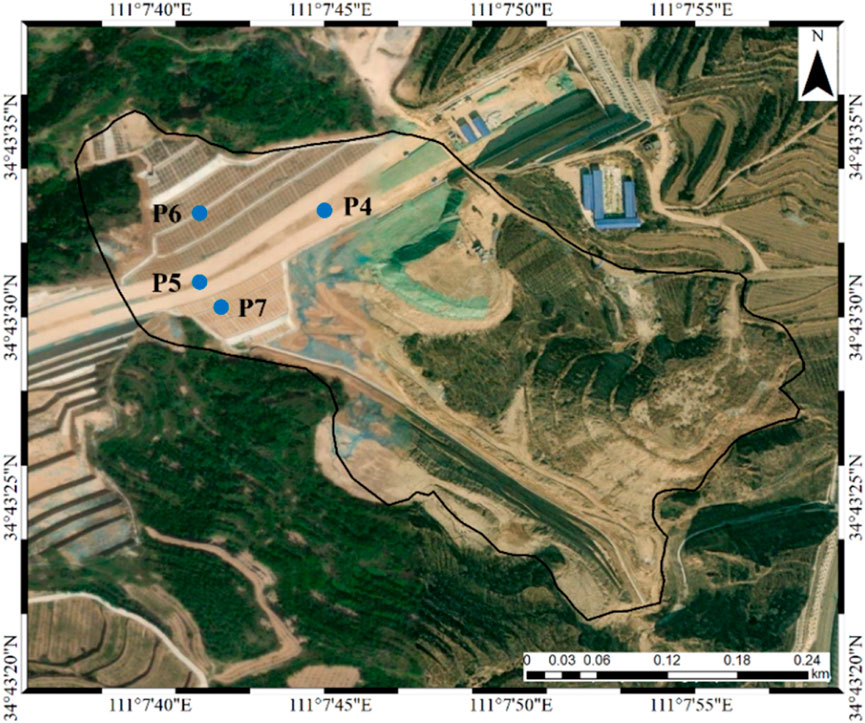
Figure 10. Layout of on-site subsidence monitoring points.
Points P4 and P5 are located on the road centerline, while points P6 and P7 are situated on the high-filled slope. As ground leveling measurements and InSAR measurements are two independent measurement systems, it is necessary to unify them in spatial and temporal reference frames before comparison. Since the deformation in the high-filled area is vertical, the deformation results obtained in the radar LOS direction need to be converted to the vertical direction using Equation 6 to ensure alignment with the direction of ground leveling measurements. Subsequently, the leveling results are projected onto the WGS-84 coordinate system, with the benchmark points serving as references to select corresponding InSAR monitoring points using natural neighbor interpolation. Finally, with the InSAR monitoring time as the reference, the leveling measurement results corresponding to that time are chosen to achieve temporal alignment.
In the equation,
The time series displacement changes of the deformation monitoring results from InSAR and leveling are shown in Figure 11, demonstrating a consistent deformation trend, which strongly confirms the reliability of InSAR technology.
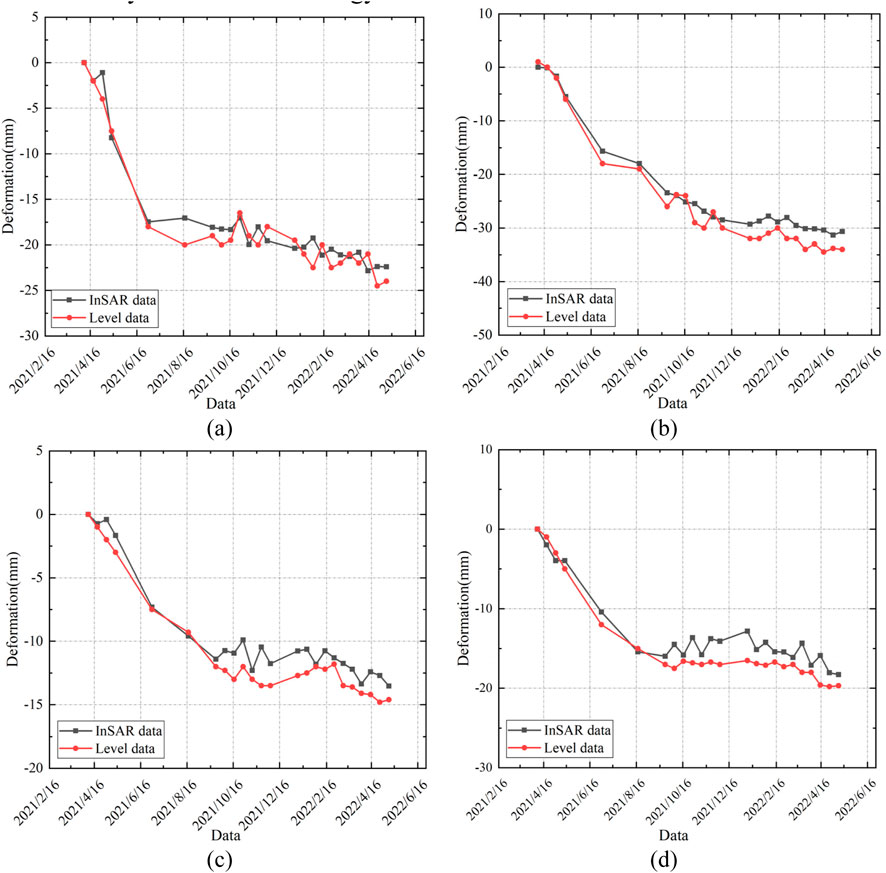
Figure 11. Comparison between InSAR monitoring results and leveling results: (a) P4 point; (b) P5 point; (c) P6 point; (d) P7 point.
To further quantitatively analyze the reliability of InSAR deformation monitoring results, the Root Mean Square Error (RMSE) was used to evaluate the consistency between the InSAR monitoring results and ground leveling measurement results. The RMSE is an index that measures the degree of deviation between the observed values and the true values as shown in Equation 7.
In the equation,
The comparison results of deformation between the leveling points and InSAR points are shown in Table 2. From Table 2, it can be observed that the RMSE values for the selected four points are all less than ±3 mm, with the maximum being 2.50 mm; the maximum difference between the two measurement results is 4.11 mm. The high consistency in deformation trend and magnitude between the two methods indicates the reliability of InSAR technology in monitoring the subsidence of high-filled roads.
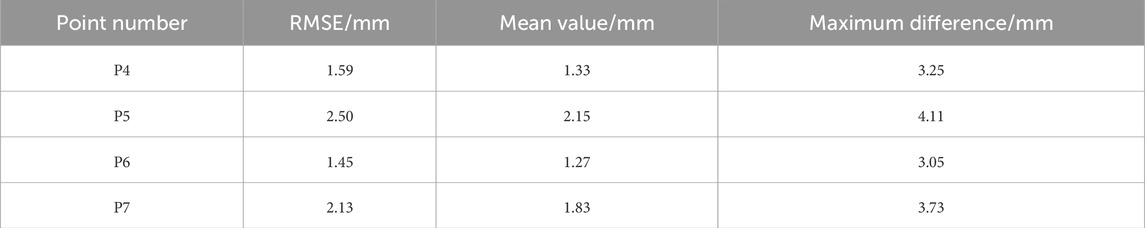
Table 2. Comparison of leveling results and InSAR results.
4.3 Analysis of surface subsidence after the pavement engineering construction
The construction of the high-filled pavement engineering was completed in May 2023. To determine whether the surface of the high-filled area was in a stable state after the pavement construction, Sentinel-1A remote sensing data covering the high-filled road base during the period from 21 June 2023, to 18 December 2023, was monitored using InSAR technology to track the actual subsidence. Figure 12 shows the surface deformation results of time series of the high-filled road after construction. The figure shows that during the period from 21 June 2023 to 18 December 2023, there was basically no surface settlement on the high-filled road and the slopes of the embankments on both sides. Figure 13 shows the time series results of points P1, P2, and P3 on the high-filled road and the slopes of the two sides during the same period, indicating that the cumulative surface settlement during the monitoring period did not exceed 3 mm. These findings indicate that the surface settlement of the high-filled embankment has reached a stable state at this time.
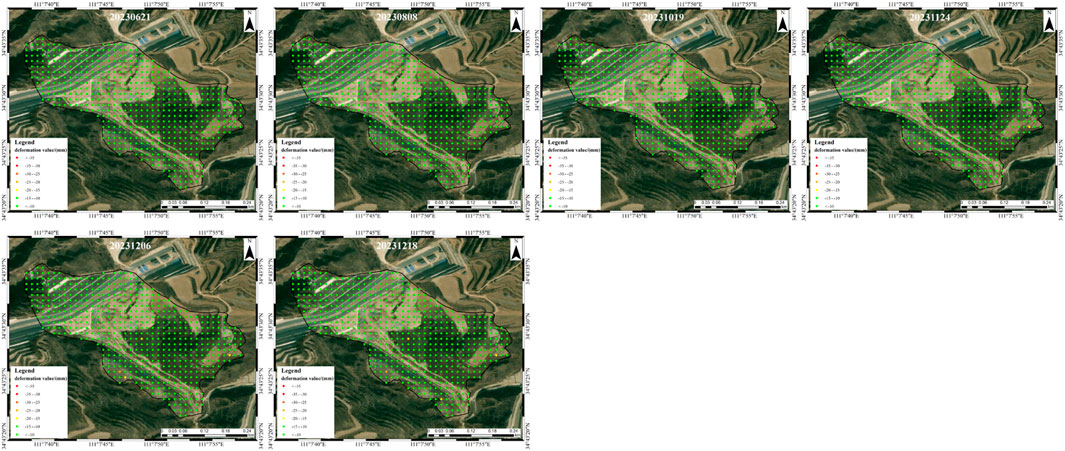
Figure 12. SBAS-InSAR results after pavement construction.

Figure 13. Subsidence curve after pavement construction.
5 Numerical simulation of the stability of high-filled road embankment slopes
The stability of high-fill embankment slopes is crucial to the safe operation of roads, and slope stability analysis has always been an important research focus during the engineering construction process (Zhang et al., 2019b; Liu et al., 2020; Nanehkaran et al., 2023; Ahangari Nanehkaran et al., 2022; Hu et al., 2023). In addition, seismic actions often induce slope instability and failure. The seismic stability issues of slopes have become increasingly prominent, and studying the deformation characteristics of slopes under seismic actions is also necessary. In recent years, with the continuous development of computer technology, numerical simulation methods have become an important research tool for analyzing slope stability. This study employed ABAQUS software for two-dimensional finite element numerical simulation. The numerical model established includes the high-filled road embankment and the original subgrade soil of the site. A binding constraint was applied between the high-filled road embankment and the original subgrade soil. At the bottom of the original subgrade soil, horizontal and vertical displacement constraints were imposed, while horizontal displacement constraints were applied on the side. The Mohr-Coulomb constitutive model was used for both the high-filled road embankment and the original subgrade soil. The CPE4 element was chosen for the mesh type, and a total of 22,444 element meshes were generated in the numerical model. The numerical model of this study is shown in Figure 14, and the physical parameters of the soil were referenced from the local geological survey report. The detailed parameters of the numerical model are presented in Table 3.

Figure 14. The finite element numerical model.
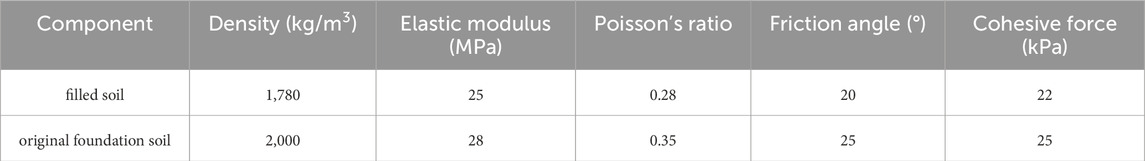
Table 3. Material parameters of the numerical model.
The finite element strength reduction method has been widely used in the field of slope stability research and has been proven to be feasible and accurate (Schneider-Muntau et al., 2018; Shooshpasha and Amirdehi, 2014; Arvin et al., 2018). Based on the finite element strength reduction method, the stability of the high-filled road embankment slope in this project was studied. Three instability evaluation criteria were adopted in the finite element strength reduction method, namely, non-convergence of the finite element calculation results, sudden displacement change at the vertex of the slope, and the formation of a continuous failure zone within the soil mass. In this study, the formation of a continuous failure zone within the soil mass is adopted as the criterion for judging the instability of the slope. For the non-convergence criterion, it relies on artificially specified iteration counts or convergence standards, where the non-convergence of calculations is used as the criterion for slope instability. However, since the iteration count and convergence standards are determined by the analyst, this criterion involves significant subjectivity, making the safety factor less reliable and prone to certain limitations. Regarding criteria for the sudden displacement change at the vertex of the slope, studies have shown that the safety factor obtained varies depending on the location of the selected characteristic point. This indicates that the stability safety factor changes with the choice of characteristic point, and currently, there is no unified standard for determining these points. From the perspective of actual engineering slope failure, the hallmark of slope instability is the formation of a continuous failure zone within the soil mass. Therefore, adopting the formation of a continuous failure zone as the instability criterion is more reasonable. Furthermore, in cases where the soil quality is poor, using the formation of a continuous failure zone as the criterion for slope instability is more conservative and ensures greater safety. Figure 15 shows the strain cloud map of the plastic strain zone in the slope. From Figure 15, it can be observed that a certain range of plastic strain zone appears at the toe position of the left side of the slope. However, due to the small slope gradient in this project, the plastic strain zone at this location does not connect and traction progressive failure will not occur. In addition, due to special treatment at the interface between the original subgrade and the filled area, no plastic strain zone appears at the toe position on the right side of the slope. The main plastic zones are concentrated within the high-filled road embankment, and clearly visible plastic failure surfaces can be observed, indicating that the unstable failure surface of this project is located within the high-filled road embankment. Finally, the numerical simulation analysis results indicate that the overall stability safety factor of the high-filled road embankment slope is 1.39, which satisfies the safety limit requirements for slopes, indicating that the slope in this project is in a safe and stable state.
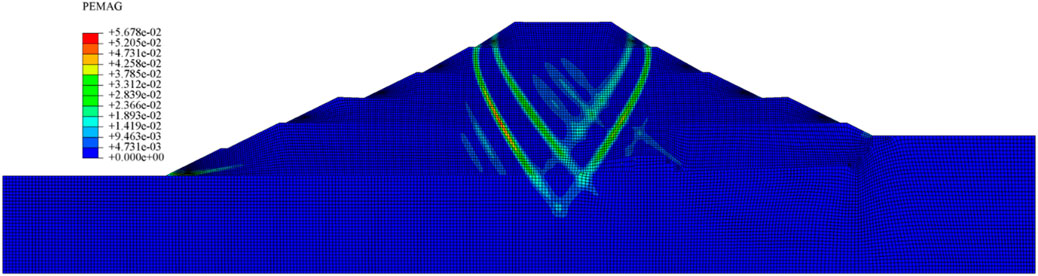
Figure 15. The strain cloud map of the plastic strain zone.
To study the dynamic response characteristics of the slope of high-filled road embankment and predict the deformation of the slope under seismic action, physical modeling Fang et al. (2022), (2023) and numerical simulation methods can be adopted. This paper uses the numerical simulation method for research. During the time-history analysis, synthetic acceleration time-history curves were used to simulate the seismic waves, considering the building site category and design seismic grouping. The seismic action duration was set to 20 s, with a peak acceleration of 0.2 g. The acceleration time-history curve of the seismic wave and the Fourier spectrum are shown in Figure 16 below. During the numerical simulation, the seismic loading was applied using a dynamic implicit analysis step. To ensure the accuracy and reliability of the ABAQUS finite element simulation software, a viscoelastic artificial boundary was used for the soil boundaries. Figures 17, 18 show the maximum vertical displacement cloud map and the maximum horizontal displacement cloud map of the high-filled road embankment slope under seismic actions. It can be observed that the maximum vertical displacement under seismic actions is approximately 44 mm, mainly concentrated in the top region of the embankment. The maximum horizontal displacement under seismic actions is approximately 410 mm, mainly concentrated in the top region of the embankment and the left slope area. The horizontal displacement increases continuously with the increase in elevation, indicating that the top position of the embankment slope is the most vulnerable area under seismic actions. The time history curves of the vertical and horizontal displacements at a specific point at the top of the slope under seismic actions are shown in Figure 19. It can be observed that as the duration of the seismic action increases, the values of the vertical and horizontal displacements vary continuously. The dynamic response of the horizontal displacement under seismic actions is much greater than that of the vertical displacement, indicating that there is the possibility of horizontal slip instability of slope under earthquake action. The above research indicates the need to focus on the deformation of the slope after seismic actions, monitor it in a timely manner, and take reinforcement measures to prevent large-scale instability. A lattice slope protection structure can be implemented which is a structure that combines reinforced concrete frames with the slope soil. Green building materials can be filled within the lattice framework, and support anchor rods can be installed, the sliding of the surface soil on the slope can be effectively restrained, thereby enhancing the slope’s anti-sliding capacity and overall seismic resistance, and reducing the risk of earthquake-induced landslides. In addition, vegetation can be planted within the lattice framework to improve the erosion resistance of the surface soil on the slope while enhancing the ecological environment. This measure can effectively mitigate horizontal displacement and sliding forces caused by seismic action, preventing slope instability and failure.
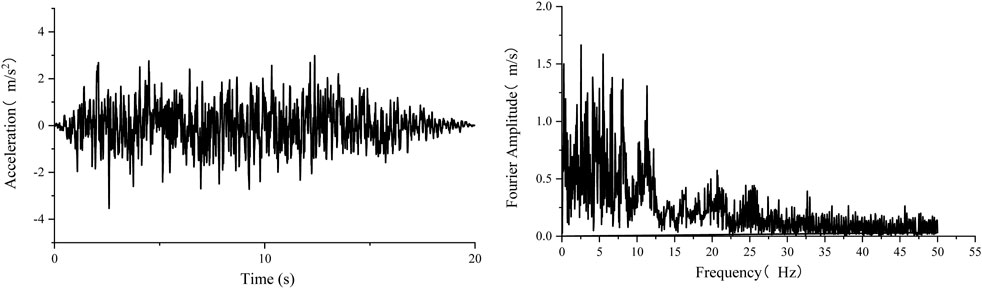
Figure 16. Acceleration time-history curve of the seismic wave and the Fourier spectrum.
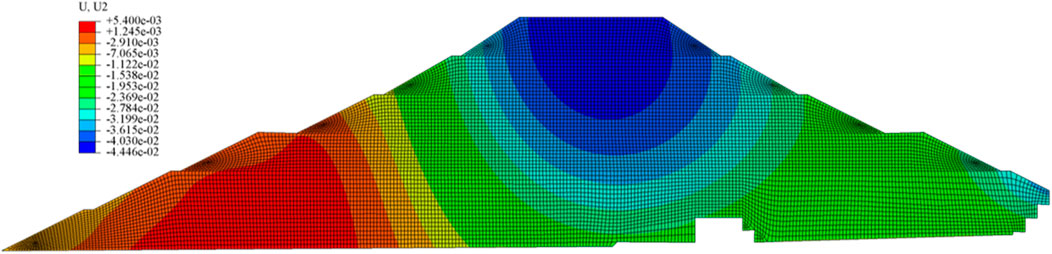
Figure 17. The maximum vertical displacement cloud map of the high-filled road embankment slope under seismic actions.
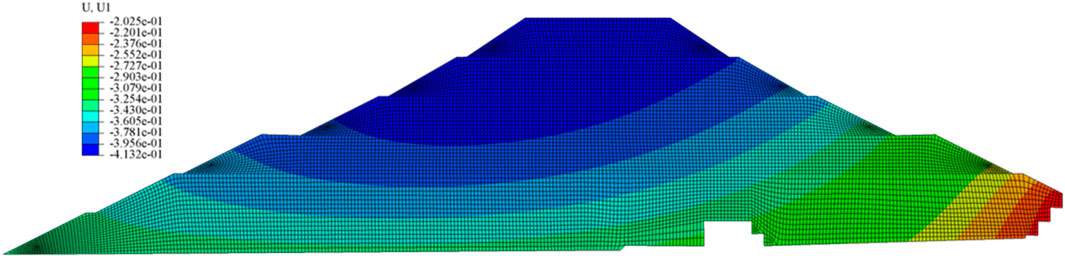
Figure 18. The maximum horizontal displacement cloud map of the high-filled road embankment slope under seismic actions.
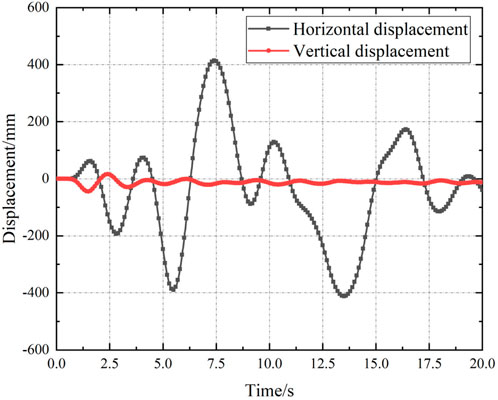
Figure 19. The time history curves of the vertical and horizontal displacements at a specific point under seismic actions.
6 Conclusion
This study is an applied research project in engineering technology. This article uses InSAR technology to monitor the subsidence of a high-filled road and its slopes in a loess area. It processes ascending Sentinel-1A satellite data from 8 April 2021, to 9 May 2022, and from 21 June 2023, to 18 December 2023. The study analyzes the post-construction subsidence and subsidence characteristics after road completion, and employs finite element numerical simulation methods to investigate the stability of the high-filled road embankment slopes. The main research conclusions are as follows.
(1) The high-filled road embankment and slope positions experienced varying degrees of post-construction subsidence. Initially after construction, the surface subsidence was most severe, with the maximum settlement area is located at the intersection of the middle of the road and the embankment slope, as well as the location of the embankment slope on the south side. The maximum subsidence rate reached 32 mm/year, with a maximum subsidence of 57 mm. By extracting the time series subsidence curves of the road centerline and embankment slope line, it was observed that the surface subsidence increased over time. Analysis of the subsidence time history curves of key points revealed that the surface subsidence went through two deformation stages: rapid subsidence followed by a slower subsidence phase.
(2) By comparing with actual leveling measurement data, it was shown that the RMSE values of the selected four points were all less than ±3 mm, with the maximum being 2.50 mm. The maximum difference between actual leveling measurements and InSAR monitoring results was 4.11 mm. Both methods exhibited high consistency in deformation trends and values, indicating the reliability of InSAR technology in monitoring the subsidence of high-filled roads.
(3) By analyzing the InSAR monitoring results, it was found that there was basically no surface settlement on the high-filled road and the slopes of the embankments on both sides after the pavement construction. The time series results of extracted key points indicated that the cumulative subsidence of the surface did not exceed 3 mm during the monitoring period, suggesting that the surface subsidence of the high-filled road had stabilized after the pavement construction.
(4) Numerical simulations were conducted using the finite element software ABAQUS, and the study based on the finite element strength reduction method revealed that the unstable failure surface is located within the high-filled road embankment. The overall stability safety factor of the high-filled road embankment slope was calculated to be 1.39, satisfying the safety limit requirements for slopes and indicating that the slope in this project is in a safe and stable state. Analysis and prediction of the deformation of the slope under seismic loads showed that the top position of the embankment slope is the most vulnerable area. The dynamic response of the horizontal displacement under seismic actions was significantly greater than that of the vertical displacement, indicating the possibility of horizontal sliding instability of the slope under seismic actions.
In this paper, only one type of seismic wave waveform was selected for the seismic dynamic analysis of the high-filled embankment. However, the dynamic response characteristics of the high-filled embankment will vary under different types of seismic waves. In the subsequent research, the seismic dynamic response analysis of the high-filled embankment under different types of seismic waves (such as the San Fernando wave and the Friuli wave) will be continuously carried out.
Data availability statement
The original contributions presented in the study are included in the article/supplementary material, further inquiries can be directed to the corresponding author.
Author contributions
LW: Conceptualization, Data curation, Investigation, Methodology, Resources, Writing – original draft. SC: Conceptualization, Methodology, Supervision, Validation, Writing – original draft. LS: Data curation, Software, Validation, Visualization, Writing – review and editing. LL: Formal Analysis, Funding acquisition, Investigation, Project administration, Writing – review and editing. WD: Formal Analysis, Software, Visualization, Writing – original draft.
Funding
The author(s) declare that financial support was received for the research and/or publication of this article. The work described in this paper was supported by the Science-Technology project of China First Highway En-gineering Co., LTD. (grant number KJYF-2023-7GS-CG08).
Conflict of interest
Authors LW, SC, LS, LL, and WD were employed by CCCC Frist Highway Engineering Group Co., Ltd.
Generative AI statement
The author(s) declare that no Generative AI was used in the creation of this manuscript.
Publisher’s note
All claims expressed in this article are solely those of the authors and do not necessarily represent those of their affiliated organizations, or those of the publisher, the editors and the reviewers. Any product that may be evaluated in this article, or claim that may be made by its manufacturer, is not guaranteed or endorsed by the publisher.
References
Abidin, H. Z., Andreas, H., Gumilar, I., Yuwono, B. D., Murdohardono, D., and Supriyadi, S. (2015). On integration of geodetic observation results for assessment of land subsidence hazard risk in urban areas of Indonesia. In: International association of geodesy symposia: IAG 150 years. Cham, Switzerland: Springer. 435–442. doi:10.1007/1345_2015_82
Ahangari Nanehkaran, Y., Pusatli, T., Chengyong, J., Chen, J., Cemiloglu, A., Azarafza, M., et al. (2022). Application of machine learning techniques for the estimation of the safety factor in slope stability analysis. Water 14 (22), 3743. doi:10.3390/w14223743
Arvin, M. R., Zakeri, A., and Bahmani Shoorijeh, M. (2018). Using finite element strength reduction method for stability analysis of Geocell-Reinforced slopes. Geotech. Geol. Eng. 37 (3), 1453–1467. doi:10.1007/s10706-018-0699-0
Berardino, P., Fornaro, G., Lanari, R., and Sansosti, E. (2002). A new algorithm for surface deformation monitoring based on small baseline differential SAR interferograms. IEEE T Geosci. Remote 40 (11), 2375–2383. doi:10.1109/TGRS.2002.803792
Casagli, N., Catani, F., Del Ventisette, C., and Luzi, G. (2010). Monitoring, prediction, and early warning using ground-based radar interferometry. Landslides 7, 291–301. doi:10.1007/s10346-010-0215-y
Chen, B., Li, Z., Yu, C., Fairbairn, D., Kang, J., Hu, J., et al. (2020). Three-dimensional time-varying large surface displacements in coal exploiting areas revealed through integration of SAR pixel offset measurements and mining subsidence model. Remote Sens. Environ. 240, 111663. doi:10.1016/j.rse.2020.111663
Chen, G., Zhang, Y., Zeng, R. Q., Yang, Z. K., Chen, X., Zhao, F. M., et al. (2018). Detection of land subsidence associated with land creation and rapid urbanization in the Chinese Loess Plateau using time series InSAR: a case study of Lanzhou New District. Remote Sens. 10 (2), 270. doi:10.3390/rs10020270
Dong, J., Lai, S., Wang, N., Wang, Y., Zhang, L., and Liao, M. (2021). Multi-scale deformation monitoring with Sentinel-1 InSAR analyses along the middle route of the south-north water diversion project in China. Int. J. Appl. Earth Obs. 100, 102324. doi:10.1016/j.jag.2021.102324
Fang, K., Dong, A., Tang, H., An, P., Wang, Q., Jia, S., et al. (2024). Development of an easy-assembly and low-cost multismartphone photogrammetric monitoring system for rock slope hazards. Int. J. Rock Mech. Min. Sci. 174, 105655. doi:10.1016/j.ijrmms.2024.105655
Fang, K., Miao, M., Tang, H., Jia, S., Dong, A., An, P., et al. (2022). Insights into the deformation and failure characteristic of a slope due to excavation through multi-field monitoring: a model test. Acta Geotech. 18 (2), 1001–1024. doi:10.1007/s11440-022-01627-0
Fang, K., Tang, H. M., Li, C. D., Su, X. X., An, P. J., and Sun, S. X. (2023). Centrifuge modelling of landslides and landslide hazard mitigation: a review. Geosci. Front. 14, 101493. doi:10.1016/j.gsf.2022.101493
Gao, W., Wang, X., Dai, S., and Chen, D. L. (2016). Study on stability of high embankment slope based on black hole algorithm. Environ. Earth Sci. 75, 1381. doi:10.1007/s12665-016-6208-y
Ge, D., Dai, K., Guo, Z., and Li, Z. (2019). Early identification of serious geological hazards with integrated remote sensing technologies: thoughts and recommendations. Geomatics Inf. Sci. Wuhan Univ. 44 (7), 949–956. doi:10.13203/j.whugis20190094
Hooper, A. J., Zebker, H. A., Segall, P., and Kampes, B. M. (2004). A new method for measuring deformation on volcanoes and other natural terrains using InSAR persistent scatterers. Geophys Res. Lett. 31, 23611. doi:10.1029/2004GL021737
Hu, J., Li, Z., Ding, X., Zhu, J., Zhang, L., and Sun, Q. (2014). Resolving three-dimensional surface displacements from InSAR measurements: a review. Earth-Sci Rev. 133, 1–17. doi:10.1016/j.earscirev.2014.02.005
Hu, J., Yuan, W., Fu, X., Zhang, Z., Zhou, Y., Chai, S., et al. (2023). The deformation evolution law and stability evaluation of the high-filled slope in the cutting hills to backfill ditches project. Front. Earth Sci. 11, 1158216. doi:10.3389/feart.2023.1158216
Hu, X., Wang, T., Pierson, T. C., Lu, Z., Kim, J., and Cecere, T. H. (2016). Detecting seasonal landslide movement within the Cascade landslide complex (Washington) using time-series SAR imagery. Remote Sens. Environ. 187, 49–61. doi:10.1016/j.rse.2016.10.006
Huang, D., Gu, D. M., Song, Y. X., Cen, D. F., and Zeng, B. (2018). Towards a complete understanding of the triggering mechanism of a large reactivated landslide in the Three Gorges Reservoir. Eng. Geol. 238, 36–51. doi:10.1016/j.enggeo.2018.03.008
Huang, G., Dong, J., Xi, W., Zhao, Z., Li, S., Kuang, Z., et al. (2024). Study on surface deformation pattern in mine closure area of complex karst mountainous region based on SBAS-InSAR technology. Front. Earth Sci. 11, 1353593. doi:10.3389/feart.2023.1353593
Li, X. A., Li, L. C., Song, Y. X., Hong, B., Wang, L., and Sun, J. Q. (2019). Characterization of the mechanisms underlying loess collapsibility for land-creation project in Shaanxi Province, China—a study from a micro perspective. Eng. Geol. 249, 77–88. doi:10.1016/j.enggeo.2018.12.024
Liu, S., Wang, H., Xu, W., Cheng, Z., Xiang, Z., and Xie, W. (2020). Numerical investigation of the influence of rock characteristics on the Soil-Rock mixture (SRM) slopes stability. KSCE J. Civ. Eng. 24 (11), 3247–3256. doi:10.1007/s12205-020-0034-1
Luo, Y. B., Chen, J. X., Shi, Z., Li, J. Z., and Liu, W. W. (2020). Mechanical characteristics of primary support of large span loess highway tunnel: a case study in Shaanxi Province, Loess Plateau, NW China primary. Tunn. Undergr. Sp. Tech. 104, 103532. doi:10.1016/j.tust.2020.103532
Mao, Z. J., Wang, X., An, N., Li, X. J., and Wei, R. Y. (2019). Water disaster susceptible areas in loess multi-arch tunnel construction under the lateral recharge condition. KSCE J. Civ. Eng. 23, 4564–4577. doi:10.1007/s12205-019-0951-z
Nanehkaran, Y. A., Licai, Z., Chengyong, J., Chen, J., Anwar, S., Azarafza, M., et al. (2023). Comparative analysis for slope stability by using machine learning methods. Appl. Sci-Basel 13 (3), 1555. doi:10.3390/app13031555
Schneider-Muntau, B., Medicus, G., and Fellin, W. (2018). Strength reduction method in Barodesy. Comput. Geotech. 95, 57–67. doi:10.1016/j.compgeo.2017.09.010
Shi, X., Xu, Q., Zhang, L., Zhao, K., Dong, J., Jiang, H., et al. (2019a). Surface displacements of the Heifangtai terrace in Northwest China measured by X and C-band InSAR observations. Eng. Geol. 259, 105181. doi:10.1016/j.enggeo.2019.105181
Shi, X., Yang, C., Zhang, L., Jiang, H., Liao, M., Zhang, L., et al. (2019b). Mapping and characterizing displacements of active loess slopes along the upstream Yellow River with multi-temporal InSAR datasets. Sci. Total Environ. 674, 200–210. doi:10.1016/j.scitotenv.2019.04.140
Shooshpasha, I., and Amirdehi, H. A. (2014). Evaluating the stability of slope reinforced with one row of free head piles. Arab. J. Geosci. 8 (4), 2131–2141. doi:10.1007/s12517-014-1272-7
Sidle, R. C., Ghestem, M., and Stokes, A. (2014). Epic landslide erosion from mountain roads in Yunnan, China—challenges for sustainable development. Nat. Hazard Earth Sys. 14 (11), 3093–3104. doi:10.5194/nhess-14-3093-2014
Singleton, A., Li, Z., Li, Z., Hoey, T., and Muller, J. (2014). Evaluating sub-pixel offset techniques as an alternative to D-InSAR for monitoring episodic landslide movements in vegetated terrain. Remote Sens. Environ. 147, 133–144. doi:10.1016/j.rse.2014.03.003
Wei, Z., Li, Y., Dong, J., Cao, S., Ma, W., Wang, X., et al. (2024). The identification and influence factor analysis of landslides using SBAS-InSAR technique: a case study of Hongya Village, China. Appl. Sci. 14, 8413. doi:10.3390/app14188413
Xiong, J. Y., and Shen, Z. Y. (2021). Rise and future development of Chinese high-speed railway. J. Traffic Transp. Eng. 21 (5), 6–29. doi:10.19818/j.cnki.1671-1637.2021.05.002
Zhang, J., Zhu, W., Cheng, Y., and Li, Z. (2021). Landslide detection in the Linzhi-Ya’an section along the Sichuan--Tibet railway based on InSAR and hot spot analysis methods. Remote Sens. 13, 3566. doi:10.3390/rs13183566
Zhang, L., Dai, K., Deng, J., Ge, D., Liang, R., Li, W., et al. (2021). Identifying potential landslides by stacking-InSAR in Southwestern China and its performance comparison with SBAS-InSAR. Remote Sens. 13, 3662. doi:10.3390/rs13183662
Zhang, S., Pei, X. J., Huang, R. Q., Zhang, X. C., Chang, Z. L., and Zhang, Z. D. (2019a). Model test on seepage characteristics and deformation failure modes of loess fill slope under rainfall. China J. Highw. Transp. 32 (9), 32–41. doi:10.19721/j.cnki.1001-7372.2019.09.003
Zhang, S., Si, J., Niu, Y., Zhu, W., Fan, Q., Hu, X., et al. (2022). Surface deformation of expansive soil at Ankang airport, China, revealed by InSAR observations. Remote Sens. 14 (9), 2217. doi:10.3390/rs14092217
Zhang, S., Zhang, X., Pei, X., Wang, S., Huang, R., Xu, Q., et al. (2019b). Model test study on the hydrological mechanisms and early warning thresholds for loess fill slope failure induced by rainfall. Eng. Geol. 258, 105135. doi:10.1016/j.enggeo.2019.05.012
Zhao, C., Kang, Y., Zhang, Q., Lu, Z., and Li, B. (2018). Landslide identification and monitoring along the Jinsha river Catchment (Wudongde Reservoir area), China, using the InSAR method. Remote Sens. 10, 993. doi:10.3390/rs10070993
Zhao, S. Y., Zheng, J. T., and Yang, J. (2022). Stability analysis of embankment slope considering water absorption and softening of subgrade expansive soil. Water 14, 3528. doi:10.3390/w14213528
Zhou, C., Lan, H., Bürgmann, R., Warner, T. A., Clague, J. J., Li, L., et al. (2022). Application of an improved multi-temporal InSAR method and forward geophysical model to document subsidence and rebound of the Chinese Loess Plateau following land reclamation in the Yan’an New district. Remote Sens. Environ. 279, 113102. doi:10.1016/j.rse.2022.113102
Zhou, L., Guo, J., Hu, J., Li, J., Xu, Y., Pan, Y., et al. (2017). Wuhan surface subsidence analysis in 2015-2016 based on Sentinel-1A data by SBAS-InSAR. Remote Sens. 9, 982. doi:10.3390/rs9100982
Zhou, S., Wang, H., Shan, C., Liu, H., Li, Y., Li, G., et al. (2023). Dynamic monitoring and analysis of mining land subsidence in Multiple coal Seams in the Ehuobulake coal mine based on FLAC3D and SBAS-InSAR technology. Appl. Sci. 13, 8804. doi:10.3390/app13158804
Zhu, S., Zuo, X., Shi, K., Li, Y., Guo, S., and Li, C. (2022). Surface subsidence monitoring in Kunming City with time-series InSAR and GNSS. Appl. Sci. 12 (24), 12752. doi:10.3390/app122412752
Keywords: insar technique, high-filled road, settlement monitoring, slope stability, finite element numerical simulation
Citation: Wang L, Chai S, Sun L, Liu L and Ding W (2025) InSAR-based monitoring and analysis of settlement in high-filled road embankment and slope in loess region. Front. Earth Sci. 13:1581761. doi: 10.3389/feart.2025.1581761
Received: 23 February 2025; Accepted: 14 April 2025;
Published: 28 April 2025.
Edited by:
Manoj Khandelwal, Federation University Australia, AustraliaReviewed by:
Kun Fang, Hong Kong University of Science and Technology, Hong Kong, SAR ChinaZiyadin Cakir, Istanbul Technical University, Türkiye
Copyright © 2025 Wang, Chai, Sun, Liu and Ding. This is an open-access article distributed under the terms of the Creative Commons Attribution License (CC BY). The use, distribution or reproduction in other forums is permitted, provided the original author(s) and the copyright owner(s) are credited and that the original publication in this journal is cited, in accordance with accepted academic practice. No use, distribution or reproduction is permitted which does not comply with these terms.
*Correspondence: Shaoqiang Chai, Y2hhaXNxaWFuZ0AxNjMuY29t