 Ali Al Janabi1
 Camelia C. Knapp
 Ziyad Albesher
- 1Boon Pickens School of Geology at Oklahoma State University, Stillwater, OK, United States
- 2King Abdulaziz City for Science and Technology, KACST, Riyadh, Saudi Arabia
Exploration in the northern Norwegian North Sea is limited by complex Paleogene stratigraphy and underexplored stratigraphic traps in the Sele and Lista formations due to ambiguous well logs and scarce core data. This study addresses the critical scientific challenge of accurately characterizing these formations to assess their hydrocarbon potential. To resolve this problem, the study integrates gamma-ray log motifs, high-resolution core imagery, and lithofacies analysis from thirty-nine wells across quadrants 31, 32, 35, 36, and 6204. Eleven stratigraphic cross-sections were constructed in both dip and strike directions to analyze vertical stacking patterns, depositional environments, and key stratigraphic surfaces such as sequence boundary and maximum flooding surface. Thirteen distinct lithofacies were identified and grouped into four depositional types: low-energy mudstones, turbidites, sandy debris flows, and muddy debris flows. These facies were further assessed for reservoir quality attributes, including porosity, permeability, and net-to-gross ratio. The findings reveal that the Lista Formation contains laterally extensive, sand-rich turbidites and debris flows with significant reservoir potential, while the Sele Formation is predominantly mud-rich, serving as a regional seal. A key contribution of this study is the development of a 3D structural depth model that enhances the spatial understanding of lithofacies distribution and reservoir connectivity. The integrated methodology presented here improves geological interpretation and supports exploration in deep-water environments. As stratigraphic traps become increasingly critical exploration targets, especially in mature basins, this integrated approach supports reservoir characterization on a global scale. This study enhances the geoscientific understanding of post-rift basin evolution and stratigraphy in the Norwegian North Sea and provides a methodological framework that can be applied to similar deep-marine offshore systems around the world.
1 Introduction
Understanding sedimentary processes in deep-marine environments remains one of the key challenges in geology, particularly due to their inherent complexity and importance in subsurface resource evaluation. Deep-water depositional systems, shaped by gravity-driven flows such as turbidity currents and debris flows, are central to the formation of stratigraphic architectures that influence the distribution of hydrocarbons, critical minerals, and other subsurface fluids (Mutti and Ricci Lucchi, 1978; Reading and Richards, 1994). Despite decades of study, evaluating the spatial distribution, quality, and continuity of potential reservoir sandstones in these environments continues to be a significant scientific and industrial hurdle (Clark and Cartwright, 2009; Prélat et al., 2009).
This challenge is particularly evident in the northern Norwegian North Sea, where Paleogene deep-water formations have emerged as promising yet underexplored targets for hydrocarbon exploration (Norwegian Offshore Directorate (NOD), 2021). In contrast to the better-understood structural traps of earlier plays, these post-rift systems are increasingly associated with stratigraphic trap reservoirs whose potential depends on subtle lithological variations and depositional geometries (Stoker et al., 2006; Galloway, 1998). However, uncertainties surrounding sediment transport pathways, facies organization, and seal-reservoir relationships have hampered predictive modeling and risk assessment in the region.
To address these knowledge gaps, our study undertakes an integrated geological investigation focused on two key Paleogene units in the northern North Sea. The problem associated with the Sele and Lista formations in the northern Norwegian North Sea lies in the difficulty of accurately characterizing their stratigraphy and depositional architecture, which hampers reliable hydrocarbon exploration. These Paleogene deep-marine formations are part of a complex post-rift basin system shaped by gravity-driven flows, sea-level fluctuations, and tectonic influences. While the Lista Formation contains laterally extensive sand-rich turbidites and debris flows with potential reservoir quality, the Sele Formation is predominantly composed of fine-grained mudstones, serving mainly as a regional seal. However, limited core data, particularly for the Sele Formation, and ambiguous well-log signatures obscure the identification of stratigraphic traps, making it challenging to differentiate between reservoir and non-reservoir facies. Traditional exploration has focused on structural traps, leaving stratigraphic traps poorly understood and underexplored. The subtle lithological variations that define these traps are difficult to resolve without integrating high-resolution core analysis, gamma-ray log motifs, and sequence stratigraphy.
Structural inheritance from Jurassic highs also influenced basin morphology and sediment routing, while syn-depositional tectonism contributed to subsidence and localized accommodation space (Johnson, 1987). These factors collectively shaped the stratigraphic framework, promoting the development of laterally continuous sand-rich lobes in more proximal areas and heterolithic mud-rich facies in distal settings. Given this complex interplay of tectonics, sedimentation, and sea-level changes, the northern Norwegian North Sea presents a compelling yet challenging frontier for hydrocarbon exploration. The region’s stratigraphic architecture holds both reservoir and seal potential, making it crucial to improve interpretations of deep-marine systems for effective resource evaluation (Norwegian Offshore Directorate (NOD), 2021).
By synthesizing data from core observations, gamma-ray log interpretations, and stratigraphic cross-sections, we aim to enhance our understanding of lithofacies variability and depositional environments within this complex marine system. This approach not only refines the sedimentological framework of the study area but also supports broader efforts to explore deep-water stratigraphic environments. This work contributes to the advancement of subsurface modeling techniques that are essential for future resource development in the North Sea and similar basins worldwide.
2 Geological setting
The study area is located in the northern Norwegian North Sea, primarily within quadrants 31, 35, and 36, encompassing key blocks situated across the North Viking and Sogn Grabens (Figure 1). This region lies within a post-rift basin system that evolved following the Late Cretaceous and is characterized by thick accumulations of Paleocene Eocene sediments deposited in a deep-marine environment. These sediments, reaching depths of up to 3,000 m and thicknesses approaching 1,000 m, represent a transition from carbonate-dominated to siliciclastic systems triggered by regional tectonic and volcanic events (Ahmadi et al., 2003; Liu and Byrne, 1995; Kothe et al., 2010). During the Paleocene, tectonic uplift associated with the Iceland hotspot caused regional elevation in the East Shetland Platform and Scottish Highlands, enhancing sediment supply into the basin from western sources. In contrast, the Norwegian mainland contributed limited clastic input due to relatively minor uplift (Figure 2) (Morton et al., 1993). This tectonic configuration led to the cessation of calcareous sedimentation dominant in the Late Cretaceous and marked the onset of siliciclastic deposition (Ahmadi et al., 2003).
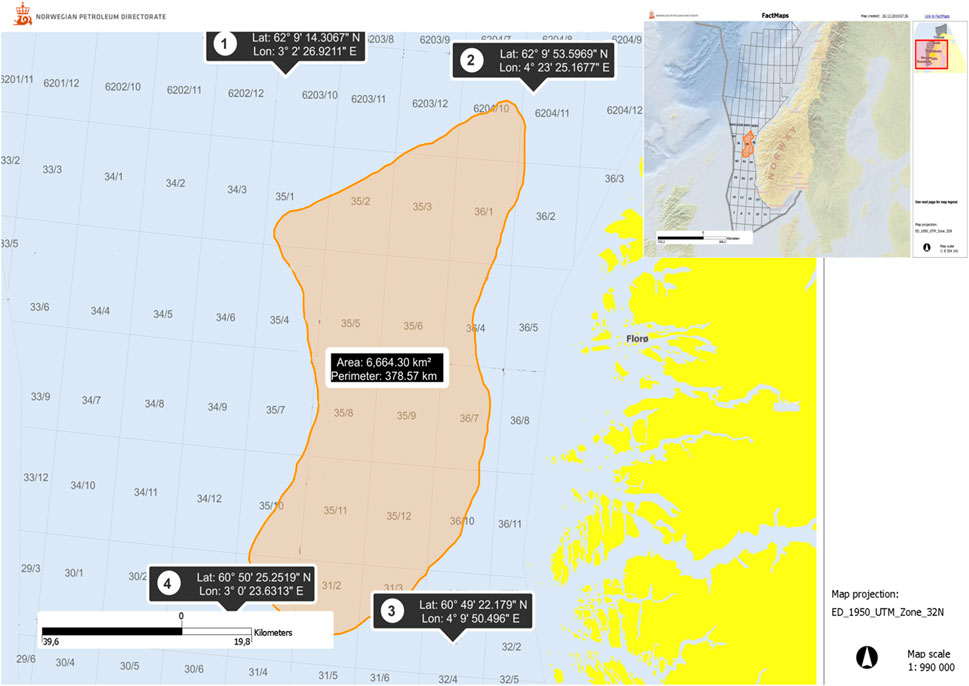
Figure 1. The location of the study area (orange color) in the northern Norwegian North Sea. The quadrants of the study area are 6203, 6204, 35, 36, 3, and 32. Each quadrant is divided into 12 blocks. The black text box in the center shows an approximate area calculation. The other black boxes show the coordinates of a visionary rectangular around the study area (after Norwegian Offshore Directorate (NOD), 2021).
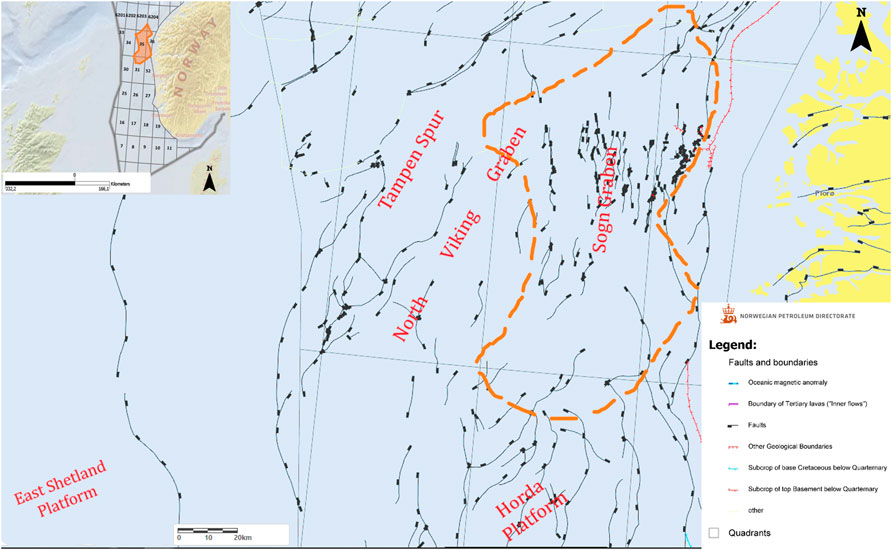
Figure 2. The fault network in the study area. Faults are tilted to the east. Faults are tilted to the west in the west Fact map (after Norwegian Offshore Directorate (NOD), 2021). The map also shows the structural elements of the Norwegian North Sea, including the study area, at the Base Cretaceous level (modified after Gradstein et al., 2010).
Deposition occurred through a variety of sediment gravity flow processes, including turbidity currents, debris flows, and slumps. These processes operated in both confined and unconfined settings, generating a spectrum of deep-water depositional features such as channels, lobes, and mass transport complexes (Harold et al., 1994; Mutti et al., 1996). Sediment distribution patterns reflect this dynamic system, with high-density flows dominating proximal settings and low-density flows characterizing more distal areas (Reading and Richards, 1994). Superimposed on these sedimentary processes were sea-level fluctuations associated with second- and third-order transgressive-regressive cycles during the Paleocene and early Eocene (Haq et al., 1988; Neal, 1996). These cycles controlled the timing and nature of sedimentation, with regressive phases favoring sand-rich deposits and transgressive phases associated with fine-grained sedimentation along basin margins (Ahmadi et al., 2003).
3 Materials and methods
This study integrates multiple geological datasets and analytical approaches to investigate the lithofacies distribution and depositional environments of the Sele and Lista formations in the northern Norwegian North Sea. The methods employed emphasize the correlation of well logs with core observations and stratigraphic data to interpret deep-water sedimentary systems and evaluate their reservoir potential.
Interpreting well logs requires careful consideration, as log motifs alone may not always provide a definitive or unique signal of depositional environments. Similar log facies such as blocky motifs can be generated by markedly different geological processes. For instance, both sharp-based forced regressive shorefaces and channel-filling sandstones may produce similar blocky log signatures, thereby introducing interpretational ambiguity (Posamentier and Walker, 2006). To address these ambiguities, it is crucial to integrate multiple datasets that offer a broader geological context. Core samples, seismic profiles, and sedimentological analyses provide essential complementary information, helping to clarify facies relationships and depositional architecture (Catuneanu et al., 2009). These datasets assist in identifying vertical stacking patterns, grading trends, and depositional elements that are otherwise difficult to distinguish from logs alone.
When integrated with these additional data sources, well logs become powerful tools for reconstructing the sequence stratigraphic framework. They allow geologists to delineate vertical facies arrangements, track sediment dispersal trends, and correlate key depositional features across the basin (Catuneanu, 2006; Catuneanu et al., 2011). Accurate interpretation depends on a robust understanding of the geological context, as each depositional element generates a characteristic log response. This understanding is fundamental when dealing with log motifs that are ambiguous or susceptible to multiple interpretations (Galloway, 1998). A key aspect of this approach is the identification of critical sequence stratigraphic surfaces within the well logs. These surfaces include the transgressive surface (TS), the maximum flooding surface (MFS), the maximum regressive surface (MRS), and the sequence boundary (SB). Each surface marks a significant change in relative sea level and depositional regime, playing a vital role in reconstructing the stratigraphic evolution of the basin. Figure 3 illustrates the flowchart outlining the methodologies employed in this study.
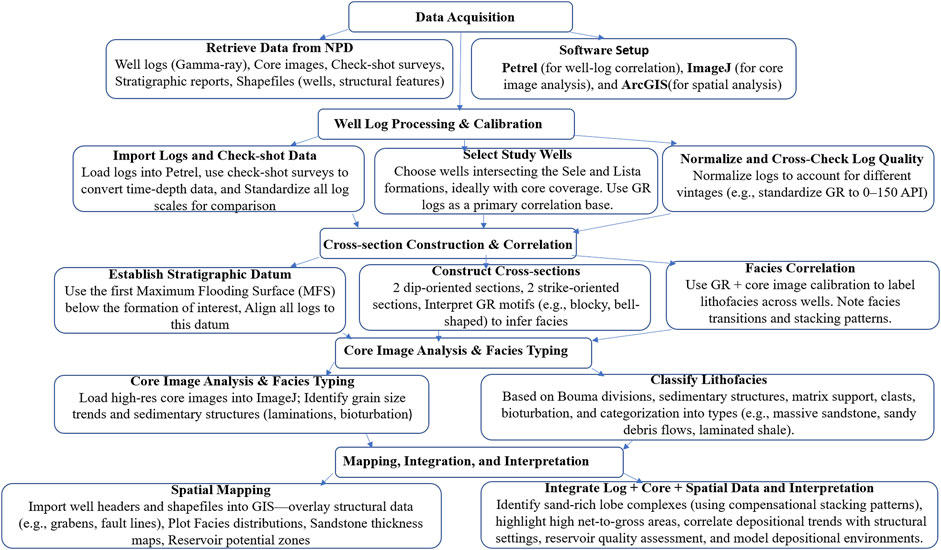
Figure 3. Flowchart demonstrating the methodologies employed in this study.
3.1 Data sources
The main data for this study were obtained from the Norwegian Offshore Directorate (NOD). These include:
• Well-log data from thirty-nine wells located within quadrants 31, 32, 35, 36, and 6204. The logs consist of gamma-ray (GR), resistivity (RDEEP), neutron (NEU), density (DEN), and sonic (AC) measurements.
• Check-shot surveys for most wells, used for depth calibration and enhancing the accuracy of stratigraphic correlations.
• High-resolution core images from seven key wells. These images, with resolutions averaging 2370 × 3417 pixels, enabled detailed visualization of lithological textures, sedimentary structures, and hydrocarbon staining.
• Stratigraphic and completion reports, as well as additional geological documentation and shapefiles (e.g., well locations and structural features), which provided contextual and spatial information.
3.2 Core and lithofacies analysis
Lithofacies characterization was based on a combination of core image interpretation and well-log correlation. Core intervals were assessed for sedimentary structures, grain size, bedforms, bioturbation, and evidence of hydrocarbon staining. Thirteen distinct lithofacies were identified and categorized into four primary depositional types: low-energy mudstones, turbidites, sandy debris flows, and muddy debris flows. Only one core was available from the Sele Formation (well 35/10-2) as provided by the Norwegian Offshore Directorate (NOD), while multiple core intervals from the Lista Formation were analyzed across the seven selected wells (Table 1; Figure 4). The limited core availability in some wells was accounted for by integrating log responses and using analog data where applicable.
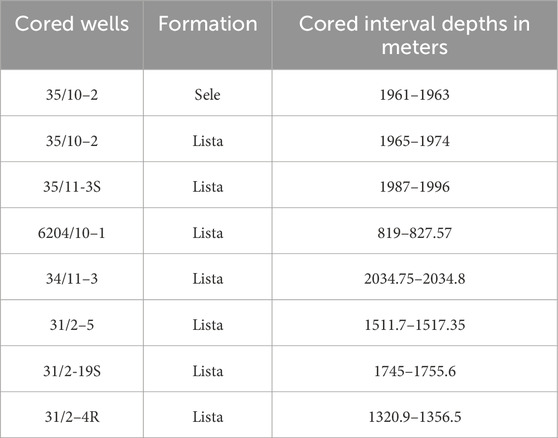
Table 1. Core samples depths for Sele and Lista formations in 8 wells located in and around the Study area.
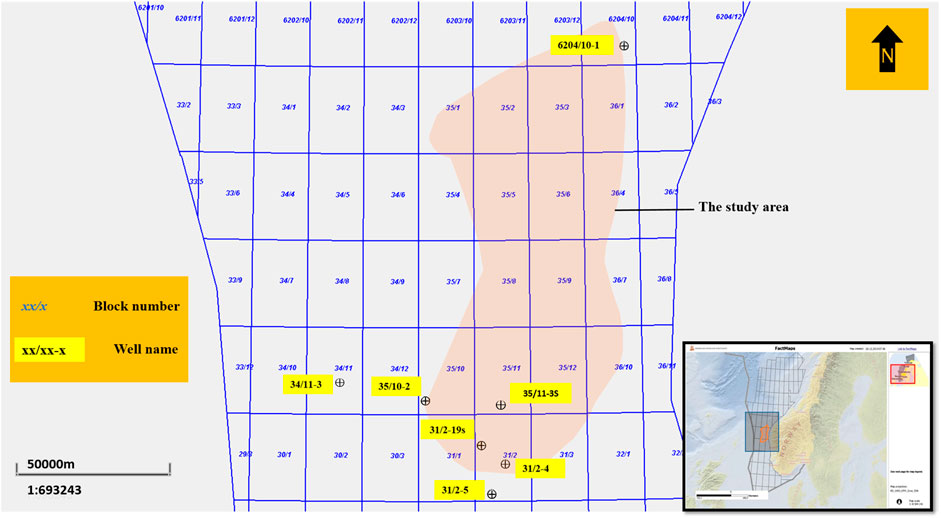
Figure 4. Locations of the cored wells used in this study area.
3.3 Well-log correlation and cross-section construction
Eleven well-log-based cross-sections were constructed to visualize the vertical and lateral distribution of lithofacies and to interpret depositional trends (Figure 5). These cross-sections were designed to cover both dip and strike directions, capturing the three-dimensional variability of the stratigraphic framework. The gamma-ray log was the primary tool for well correlation, given its consistency and reliability in distinguishing lithological contrasts between sandstone and shale. Other logs, such as resistivity, density, and neutron, were used to support interpretations where appropriate. Each cross-section was anchored using a stratigraphic datum, typically the first maximum flooding surface (MFS) below the formation of interest. Aligning logs to this datum allowed for consistent stratigraphic correlation across wells with varying data vintages and measurement standards.
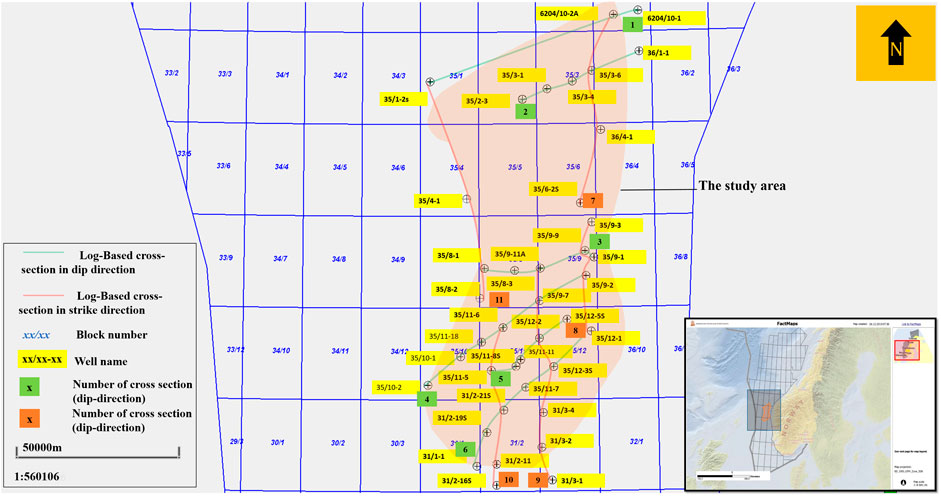
Figure 5. Showing the orientation and distribution of dip- and strike-aligned cross-sections used to analyze lithofacies in the Sele and Lista formations. These cross-sections capture key geological transitions, including shifts from mud-dominated to sand-rich facies, and identify important depositional boundaries such as maximum flooding surface and amalgamated sand bodies. The figure highlights variations in depositional energy and environment, providing critical insights into reservoir continuity and hydrocarbon potential across the study area.
The cross-sections also served to identify key stratigraphic surfaces, including sequence boundary, transgressive surface, and maximum regressive surfaces. These surfaces were essential for defining depositional cycles and interpreting stacking patterns within a sequence stratigraphic framework.
3.4 Mapping and spatial analysis
Geospatial data, including shapefiles from the NPD, were integrated into an interactive mapping platform. This facilitated the spatial visualization of well locations, lithofacies distributions, and structural features across the study area. The mapping tool was used to contextualize cross-section locations and to analyze the extent and connectivity of sand-rich units and sealing facies.
4 Results
4.1 Interpretation of well logs in deep marine settings based on cross-sections
In this study, eleven well-log cross-sections were constructed to assess the spatial distribution and stratigraphic framework of lithofacies in both dip and strike directions. Due to space constraints, only four representative cross-sections numbers 4, 6, 9, and 10, are presented in detail (Figure 5). These illustrate the vertical and lateral variability in lithofacies, key stratigraphic surfaces, and depositional systems, offering insights into reservoir potential and overall basin architecture. The selected cross-sections exemplify the utility of well-log interpretation when grounded in a multidisciplinary framework that integrates geological, geophysical, and sedimentological data.
4.1.1 Cross-section No.4
This log-based cross-section is oriented SW-NE and spans 58,613 km (Figure 6). This cross-section includes six wells: 35/10-2, 35/10-1, 35/11-18, 35/11-6, 35/9-7, and 35/9-2. Analysis of the gamma-ray (GR) log responses across these wells reveals substantial lithological variation and indicates a complex stratigraphic framework. The overall trend in the GR logs suggests deposition from a range of sedimentary processes, reflecting alternating inputs of sand, silt, and mud. These variations are consistent with the dynamics of deep-water depositional systems influenced by shifting sediment supply and transport mechanisms. The depositional environment changes progressively along the cross-section, transitioning from an upper bathyal setting at well 35/9-2 (Statoil, 1992) to deeper marine conditions in wells 35/10-1 and 35/10-2 (Statoil, 1992; Isaksen and Tonstad, 1989). This spatial variation is supported by GR trends, which show an increase in fine-grained sediments toward the northeast, suggesting deeper and lower-energy depositional environments.
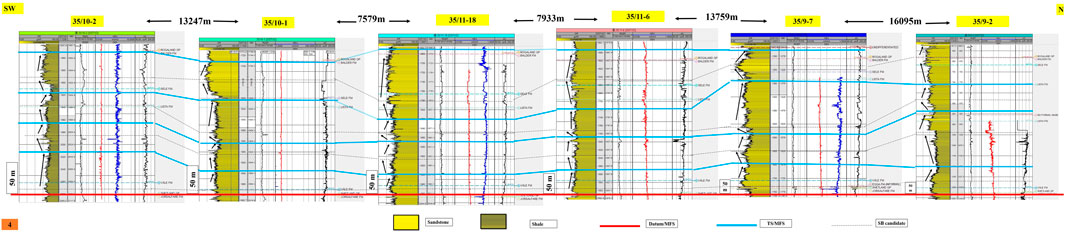
Figure 6. Cross-section 4 with the NW-SE direction and length of 58,613 km (or 36,420.42 miles). The depositional environment is a mix of sand, silt, and mud. The sandstone deposits vary from sheet-like to amalgamated sandstone. The black arrows clarify the upward thickening/cleaning or fining/dirtying of the cyclic parasequences. The white rectangles at the left side of each well log represent the vertical scale for that log. The solid red line represents a maximum flooding surface, which was taken as a datum for the correlation. The solid blue lines represent the maximum transgressive surface or the maximum flooding surface (MFS). The dashed black line represents a sequence boundary candidate (SB).
The Balder Formation, which is distinguished by a characteristic bell-shaped gamma-ray motif, is consistently recognized across all wells (Isaksen and Tonstad, 1989). This motif reflects a depositional sequence controlled by relative sea-level fluctuations and sediment supply variations, highlighting the formation’s utility as a regional stratigraphic marker. Further analysis of log signatures reveals diverse depositional architectures. In wells 35/9-2 and 35/11-6, GR logs display signatures indicative of laterally extensive, sheet-like sandstone bodies, implying deposition under high-energy conditions. By contrast, wells 35/9-7, 35/11-18, and 35/10-1 show amalgamated sandstone and siltstone units, reflecting episodes of sediment remobilization and stacking of multiple sand bodies. These are interpreted as deposits from submarine channels, lobes, or splay systems typical of deep-water turbidite environments.
In several sections, distinctive cylindrical GR motifs with low readings signal the presence of well-sorted, clean sandstone bodies, likely formed within channels or terminal fan systems (Rider, 1996). These features are consistent with deposition by turbidity currents, which transported sediment downslope in confined or unconfined settings. Conversely, well 35/10-2 is dominated by high GR values, indicating thick intervals of deep marine shale. This reflects a low-energy environment characterized by fine-grained hemipelagic or distal turbiditic sedimentation. Together, these observations underscore a dynamic depositional system shaped by relative sea-level changes, sediment supply variations, and basin morphology. The gamma-ray log trends, lithofacies distributions, and inferred depositional environments provide essential insights into the stratigraphic architecture and reservoir potential of the interval under investigation.
4.1.2 Cross-section No.6
This cross-section is oriented in the dip direction and extends 41,758 km. It includes six wells: 31/1–1, 31/2-19S, 31/2-21S, 35/11-7, 35/12-3S, and 35/12-1 (Figure 7). The lithological analysis across Cross-section No. 6 reveals pronounced variations in the sand-to-mud ratio, reflecting dynamic changes in depositional environments along the section. The northeastern part of the cross-section exhibits higher sand content, indicating more proximal, sand-dominated conditions. Moving southwestward, the sand content decreases, culminating in a peak of clay-rich sediments at wells 31/2-21S and 31/2-19S. Beyond this point, at well 31/1-1, the sand content increases again. This pattern suggests a transition from proximal to more distal depositional settings, consistent with a shift from higher-energy environments to deeper, low-energy, mud-dominated basinal conditions (Reading and Richards, 1994).
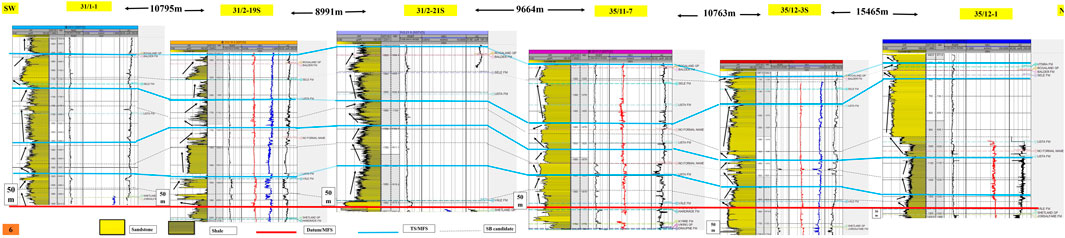
Figure 7. Cross-section 6 with the SW-NE direction and length of 41,758 km (or 25,947.21 miles). The amalgamated sandstone beds have high thickness values at the northeastern part of this section, especially in well 35/2-1. They could represent turbidities that were deposited in forced regression deposits. The black arrows are clarifying the upward thickening/cleaning or fining/dirtying of the cyclic parasequences. The white rectangles at the left side of each well log represent the vertical scale for that log. The solid red line represents a maximum flooding surface, which was taken as a datum for the correlation. The solid blue lines represent the maximum transgressive surface or the maximum flooding surface (MFS). The dashed black line represents a sequence boundary candidate (SB).
The overall depositional setting of this interval is interpreted as basinal or deep marine, supported by both sedimentological observations and gamma-ray log responses (Knox et al., 2010). A consistent feature across the wells is a bell-shaped gamma-ray motif near the top of each profile, representing the Balder Formation. This formation serves as a key stratigraphic marker, aiding correlation across the cross-section due to its distinctive log signature and depositional characteristics. Notably, amalgamated sandstone beds are observed across several wells, exhibiting considerable thickness variation. In well 35/12-1, sandstone units reach up to 250 m, while in well 35/12-3S, they are approximately 100 m thick. Further southwest, in well 35/11-7, the beds thin to less than 50 m. These sandstone packages are characterized by sharp basal and upper contacts, which may correspond to important stratigraphic surfaces or correlative conformities (Posamentier and Allen, 1999; Hunt and Tucker, 1992; Posamentier et al., 1988). Such surfaces are often interpreted as erosional boundaries or maximum regressive surfaces and are critical for regional stratigraphic correlation.
The sharp-based, blocky log motifs and thicknesses of these sand bodies indicate deposition by high-energy turbidity currents, characteristic of submarine fan or frontal-splay systems (Galloway, 1998; Posamentier and Kolla, 2003). These currents likely transported sediment from shelfal or slope settings into deeper parts of the basin, depositing thick sand-rich intervals in basin-floor environments. The distribution and variable thickness of these sandstone beds provide key insights into sediment supply, flow dynamics, and depositional processes operating in this post-rift marine basin. Their geometry and stratigraphic position also enhance our understanding of reservoir potential and connectivity in deep-water depositional systems.
4.1.3 Cross-section No.9
Cross-section No. 9 is oriented in the strike direction, extending from south to north over a total length of approximately 66 km (Figure 8). It includes seven wells arranged sequentially from south to north: 31/3–1, 31/3–2, 31/3–4, 35/12-3S, 35/12–2, 35/9-7, and 35/9-11A. Gamma-ray log analysis across these wells reveals important insights into lithological variations and depositional patterns within a predominantly deep-marine environment. The gamma-ray log responses indicate a depositional system marked by significant variation in clay, siltstone, and sandstone content. At both ends of the cross-section well 35/9-11A in the north and well 31/3-4 in the south high gamma-ray values suggest clay-dominated intervals, consistent with fine-grained, low-energy deposition typical of distal basin-floor environments. In contrast, wells 31/3-2 and 31/3-1, located in the southern part of the section, exhibit intermediate gamma-ray values reflecting a mixed lithology of siltstone and mudstone. These conditions imply a transitional depositional zone, where sediment input and basin energy fluctuated, allowing occasional influxes of coarser material.
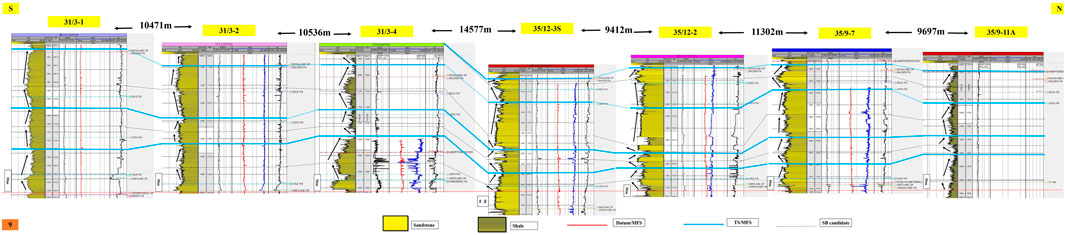
Figure 8. Cross-section 9 with N-S direction and length of 65,995 km (or 41,007.39 miles). The amalgamated sandstone beds could be seen at the middle of the section, representing basin fan or frontal splay deposits. The black arrows clarify the upward thickening/cleaning or fining/dirtying of the cyclic parasequences. The white rectangles at the left side of each well log represent the vertical scale for that log. The solid red line represents a maximum flooding surface, which was taken as a datum for the correlation. The solid blue lines represent the maximum transgressive surface or the maximum flooding surface (MFS). The dashed black line represents a sequence boundary candidate (SB).
The central portion of the cross-section encompassing wells 35/12-3S, 35/12-2, and 35/9-7 is characterized by a notable increase in the sand-to-mud ratio, indicating a shift toward more sand-rich deposition. In this area, amalgamated sandstone beds are evident, marked by cylindrical gamma-ray log motifs that suggest clean, well-sorted sandstone bodies. The thickest sandstone accumulation occurs at well 35/12-2, where these beds reach approximately 100 m in thickness. Moving north to well 35/9-7 and south to well 35/12-3S, the sandstone thickness gradually decreases, indicating lateral thinning of the sand bodies. This thinning trend implies variability in sediment supply, transport mechanisms, and depositional energy, likely influenced by changes in basin morphology, slope gradients, and the dynamics of turbidity currents and gravity-driven flows. The presence of thicker sands in the central zone suggests a more proximal depositional setting, possibly related to the lobe axis of a submarine fan or channel-levee complex, while the thinning toward the flanks indicates distal lobe or fringe settings.
4.1.4 Cross-section No.10
Cross-section No. 10 is located to the west of Cross-section No. Three and intersects with Cross-sections 4, 5, and 6, offering valuable opportunities for stratigraphic correlation across the study area (Figure 9). The primary objective of this cross-section is to assess the lateral continuity of sandstone beds and their potential extension into the deeper parts of the basin. It spans approximately 48.3 km and includes five wells, arranged from south to north: 31/2-16S, 31/2-11, 31/2-21S, 35/11-5, and 35/11-6.
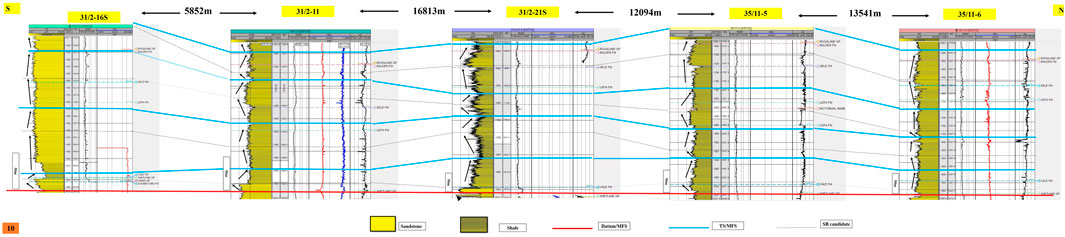
Figure 9. Cross-section 10 with N-S direction and length of 48,273 km (or 29,995.45 miles). The mud and silt are the dominant deposits in this section except for well 31/2-16S, where there are low gamma rays related to sandstone deposits. Black arrows clarify the upward thickening/cleaning or fining/dirtying of the cyclic parasequences. The white rectangles at the left side of each well log represent the vertical scale for that log. The solid red line represents a maximum flooding surface which was taken as a datum for the correlation. The solid blue lines represent the maximum transgressive surface or the maximum flooding surface (MFS). The dashed black line represents a sequence boundary candidate (SB).
Analysis of gamma-ray (GR) log responses reveals that the majority of this section is dominated by fine-grained lithologies, including mudstone and siltstone, which are indicative of a low-energy, deep-marine depositional environment. The elevated GR values across most wells suggest that sedimentation was primarily driven by hemipelagic settling and distal turbiditic flows, consistent with background sedimentation in basinal settings.
A significant anomaly, however, is observed at the southernmost well, 31/2-16S, where GR values are markedly lower than those in the other wells. This suggests a distinct lithological unit, potentially representing coarser-grained or non-siliciclastic material. The interpretation of this anomaly is debated. According to Norsk Shell (1982), the low GR values correspond to limestone stringers, implying localized carbonate deposition within an otherwise siliciclastic-dominated basin. Conversely, Ahmadi et al. (2003) suggest that the area is primarily characterized by basinward-prograding sandstone beds, and that the low GR interval may instead represent channelized or lobe-related turbidite sandstones extending from more proximal settings into the basin.
This contrast in interpretations highlights the complexity of the depositional system and underscores the importance of integrated facies analysis. If the low GR interval in well 31/2-16S indeed corresponds to deep-water sandstone, it may indicate the presence of a submarine channel or fan system, with sediments transported from shallower zones into the basin through gravity-driven flows. Such deposits could represent localized, high-quality reservoir bodies embedded within an otherwise mud-rich stratigraphic interval. The observed variation in lithology across this cross-section reflects the influence of basin morphology, sediment supply, and transport mechanisms on depositional patterns. The presence of localized sandstone units amid widespread fine-grained sediments emphasizes the potential for heterogeneous reservoir development in deep-marine settings. Overall, Cross-section No. 10 contributes to a more nuanced understanding of the basin’s stratigraphic architecture and depositional evolution, with important implications for predicting reservoir distribution and identifying exploration targets in this post-rift deep-water system.
4.2 Lithofacies and depositional environments
Thirteen distinct lithofacies were identified through analysis of lithology, bedforms, sedimentary structures, and hydrocarbon staining. Among these are massive sandstones, ripple-laminated sandstones, normally graded beds, and planar-laminated sandstones, which correspond to the Ta, Tb, and Tc divisions of the Bouma sequence. These facies are indicative of deposition by high-density turbidity currents, commonly associated with deep-marine gravity flow processes. The predominance of fine-grained and thinly bedded facies suggests that the cored wells most likely intersected the lateral fringes of submarine lobes, rather than the more sand-prone lobe axis, where thicker, amalgamated sandstones would typically be expected. This interpretation has important implications for understanding sediment dispersal patterns and reservoir distribution within the deep-water depositional system.
4.2.1 Facies No.1: interlaminated sandy mudstone–hemipelagic and turbidite hybrid deposition
Facies 1 is identified in well 35/10-2 within both the Sele and Lista formations. It first appears in the Sele Formation between 1961 m and 1963 m (2 m thick), and reoccurs in the Lista Formation from 1965 m to 1971 m (6 m thick) (Table 2; Figure 4). This facies is composed of non-variegated, interlaminated sandy mudstone, featuring centimeter-scale layers of fine sand and silt, often separated by thin shale partings. The laminations display both normal and inverse grading, reflecting variable depositional energy. Such grading is characteristic of alternating sedimentation mechanisms: normal grading suggests waning energy typical of low-density turbidity currents, while inverse grading is associated with hyperpycnal flows driven by river plumes entering marine settings (Wilson and Schieber, 2014; Spychala et al., 2017).
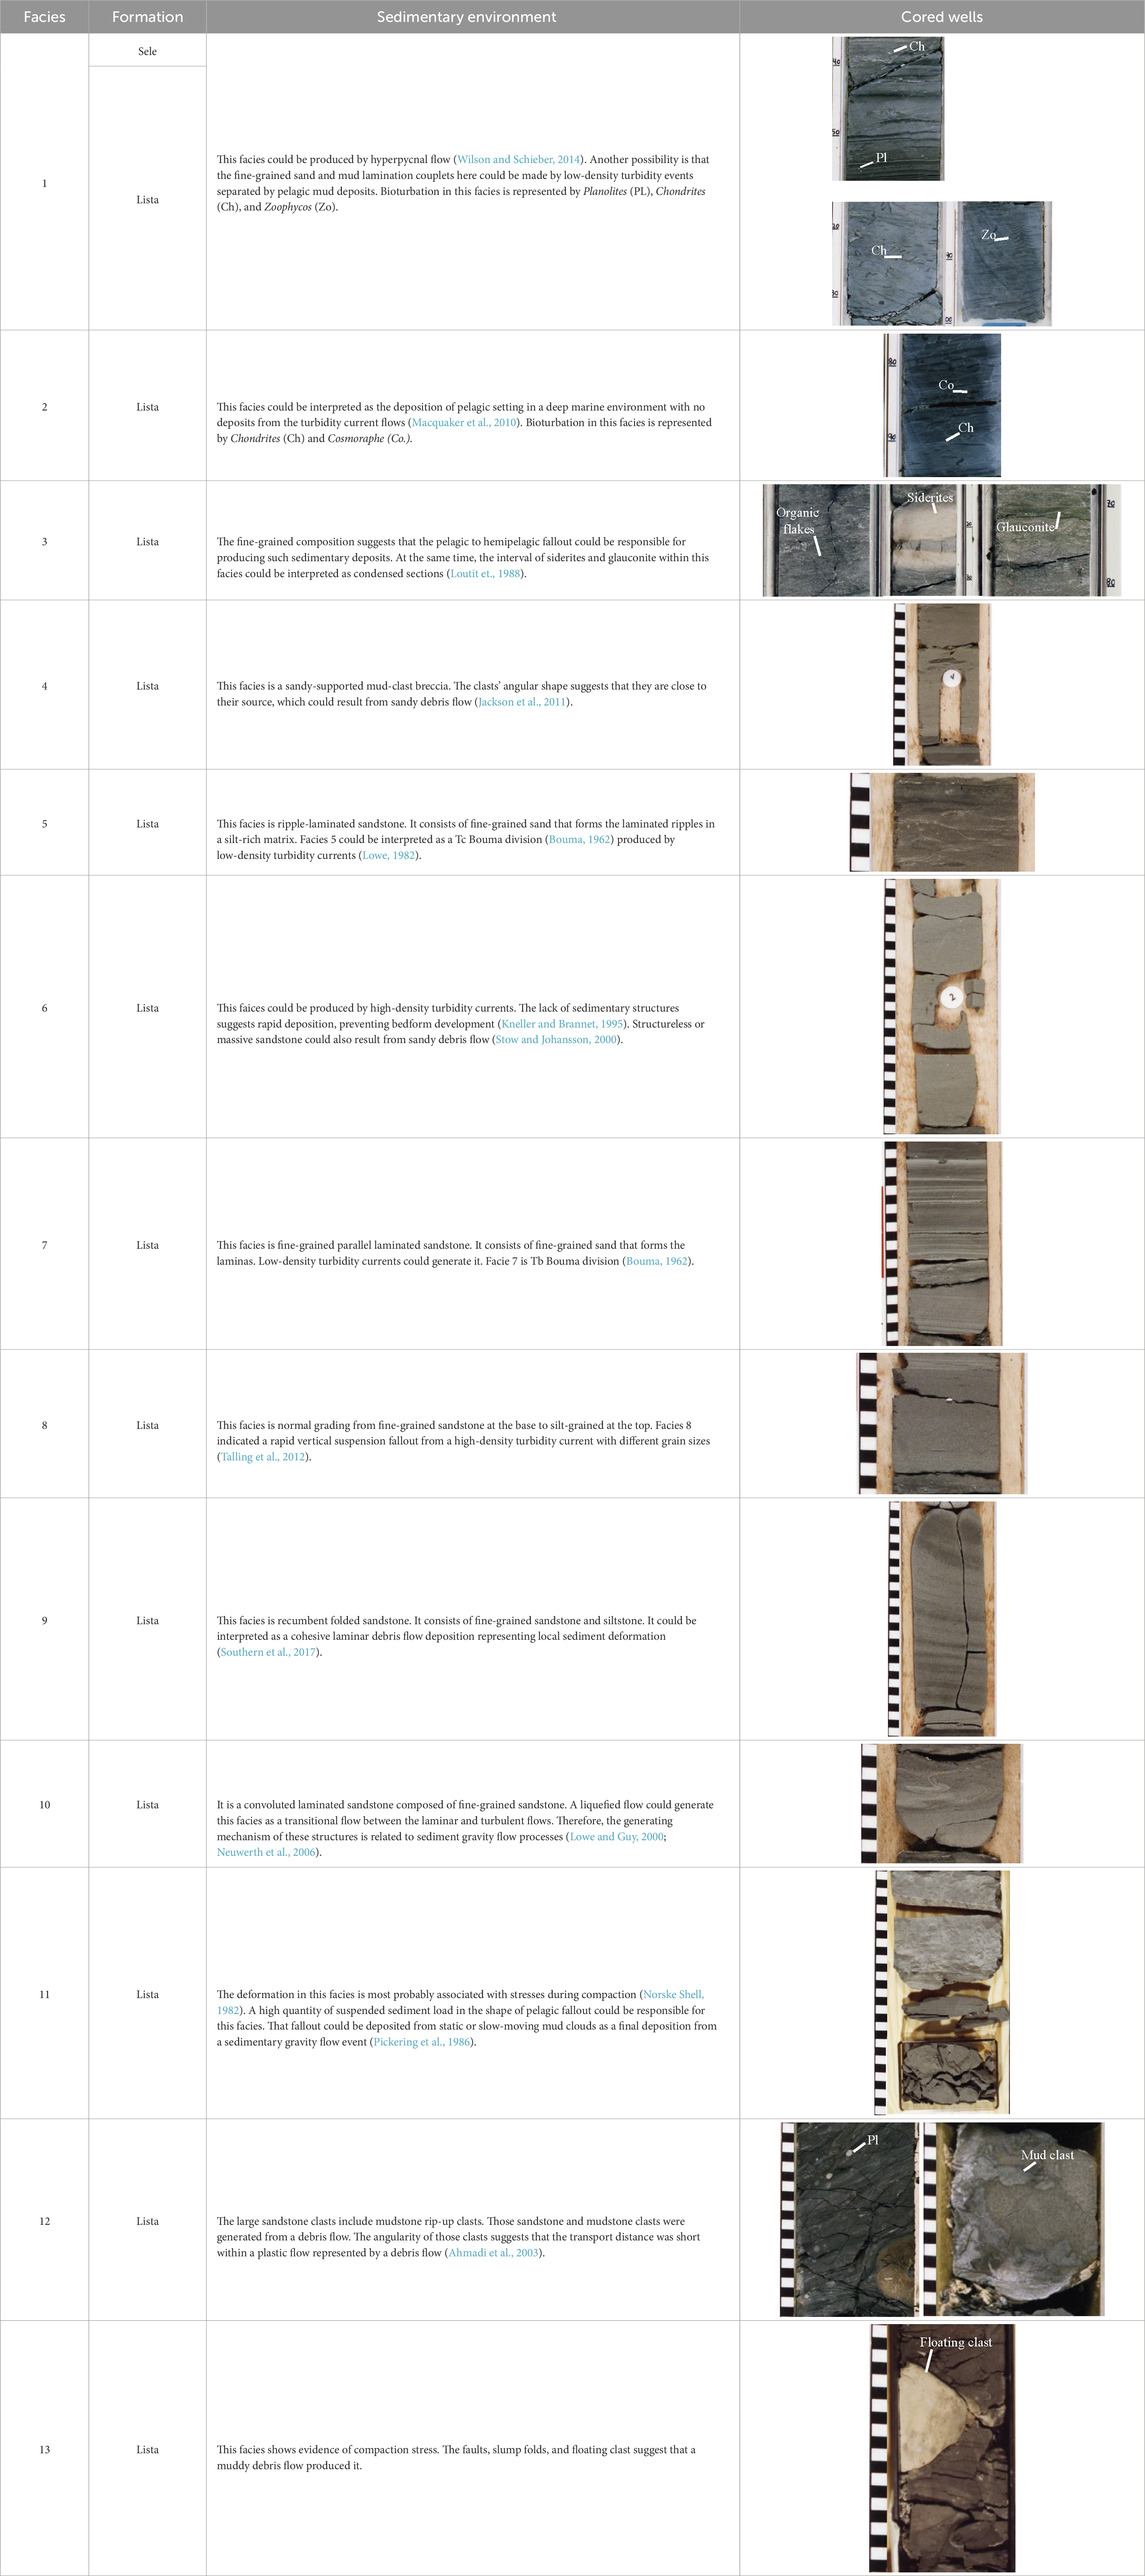
Table 2. The identified lithofacies in the study area are associated with the sedimentary environment responsible for their formation.
Bioturbation is present and includes trace fossils such as Planolites, Chondrites, and Zoophycos. The latter, particularly noted in the Lista Formation, exhibits a distinct “Christmas tree” morphology. These ichnofossils indicate a dysoxic to oxic depositional environment, with intervals of relative environmental stability that allowed colonization by benthic organisms. Sections of this facies also show whitening due to cementation, suggesting post-depositional diagenetic alteration. The dark shale-rich portions within this facies, especially those associated with limited Zoophycos, may reflect periods of rapid sedimentation or reduced oxygen levels (Richiano, 2015). The thinly laminated character and fine grain size indicate low-energy, deep-marine deposition, punctuated by episodic influxes of sand and silt, likely delivered by gravity-driven flows and hemipelagic settling.
4.2.2 Facies No.2: variegated bioturbated mudstone
Facies 2 is identified in well 35/10-2, within the Lista Formation, and extends from 1971 m to 1974 m, with a total thickness of 3 m (Table 2; Figure 5). This facies consists of variegated mudstone, featuring a mix of dark grey, light grey, pink, and red tones. These color variations are interpreted as products of diagenetic alteration driven by changes in redox conditions, mineral composition, and burial history (Macquaker et al., 2010). The visual heterogeneity suggests slow and sustained sedimentation, allowing geochemical gradients to develop over time and promote mineral transformations such as oxidation and reduction of iron-bearing phases. A defining feature of Facies 2 is the presence of intense bioturbation, as evidenced by trace fossils including Cosmorhaphe and Chondrites. These ichnofossils are commonly associated with well-oxygenated, low-energy marine environments, where benthic organisms were active in reworking soft sediments (Wetzel, 1991). Their abundance indicates that the seafloor remained stable and habitable over extended periods, with limited episodic sediment influx or disturbance from turbidity currents.
The structureless, fine-grained nature of the mudstone and the absence of sedimentary features indicative of traction transport suggest that deposition occurred primarily through hemipelagic settling the gradual accumulation of clay and silt from suspension in a deep-marine, low-energy setting (Macquaker et al., 2010). The lack of grading or coarse-grained interbeds reinforces the interpretation that this facies represents a background sedimentation regime, rather than a product of event-driven processes like turbidity or debris flows.
4.2.3 Facies No.3: dark shale with diagenetic and biogenic features
Facies 3 is identified in well 6204/10-1 within the Lista Formation, spanning from 819 m to 827.57 m, for a total thickness of 8.57 m (Figure 5; Table 2). This facies is primarily composed of dark shale, exhibiting significant color and mineralogical variation. Portions of the shale are interspersed with white areas, resulting from the replacement of shale by siderite nodules an iron carbonate mineral formed during diagenesis. Additionally, greenish tones are observed in zones with high glauconite concentrations, another mineral commonly associated with condensed marine sections. These color and mineral variations are indicative of changing geochemical conditions during sedimentation and early diagenesis, reflecting fluctuations in oxygen levels, iron availability, and sedimentation rates.
Bioturbation is a key characteristic of this facies. The presence of trace fossils such as Planolites and Zoophycos suggests colonization by benthic organisms, pointing to a relatively low-energy environment where sediment reworking by organisms was possible. These trace fossils are typically associated with oxygenated conditions and slow sediment accumulation, where organic matter remained available for benthic feeders. In some sections, the shale is heavily cemented, particularly in the areas with siderite nodules, resulting in lighter-colored, lithified zones. The core samples also reveal abundant organic flakes, which contribute to the formation of fine-grained, dark matrix sediments, supporting the interpretation of an organic-rich depositional environment. The depositional environment of Facies 3 is interpreted as deep-marine, with sedimentation dominated by pelagic and hemipelagic processes. The fine-grained composition and absence of coarse sediment or current structures indicate deposition through slow settling of particles from the water column, likely in a distal, low-energy basin setting. The presence of glauconite and siderite suggests condensed sections, formed during periods of reduced sediment supply and prolonged chemical reworking, often associated with transgressive systems tracts (Loutit et al., 1988).
4.2.4 Facies No.4: sandy-supported mud-clast breccia–Indicative of sandy debris flow
Facies 4 is observed in well 34/11-3, within the Lista Formation, and spans a narrow interval from 2034.75 m to 2034.88 m, giving it a thickness of 0.13 m (Table 2). This facies is composed of a sandy-supported breccia, containing angular, poorly sorted mud clasts distributed on a centimeter scale. The angularity and lack of sorting suggest that these clasts experienced minimal transport, pointing to proximity to their source and deposition by rapid sedimentation. Angular clasts retain their form and lack significant rounding, indicating they were not subjected to prolonged reworking. The matrix of the breccia consists of fine-grained sand to silt, which fills the voids between the larger mud clasts. This matrix likely settled concurrently or immediately after the clasts, reflecting a single depositional event with mixed sediment grain sizes. The presence of finer material surrounding coarser clasts suggests a deposition mechanism with declining energy, allowing coarser clasts to settle first, followed by finer particles.
The basal contact of the facies is sharp, demarcating a clear boundary with the underlying mudstone. This feature implies an abrupt shift in depositional energy, consistent with the onset of a debris flow or other high-energy mass transport event. In contrast, the upper contact is gradational, transitioning gradually into finer overlying sediments, indicating waning energy and a return to low-energy sedimentation following the event. These features sharp base, poor sorting, angular clasts, and sandy matrix strongly suggest deposition by a sandy debris flow. Sandy debris flows are high-density gravity flows capable of transporting both coarse clasts and finer sediment in a cohesive mass. They typically occur in steep-slope or tectonically active environments and result in deposits with internal heterogeneity but rapid emplacement. This facies provides important evidence of episodic, high-energy sediment transport interrupting otherwise low-energy background deposition in the basin. Its occurrence within the Lista Formation enhances the understanding of gravity flow dynamics, sediment supply variability, and the potential for localized reservoir development in deep-marine settings.
4.2.5 Facies No.5: ripple-laminated sandstone–low-density turbidity flow deposit
Facies 5 is identified in well 34/11-3, within the Lista Formation, over a narrow interval from 2034.75 m to 2034.88 m, with a total thickness of 0.08 m (Table 2). This facies is composed of fine-grained ripple-laminated sandstone set within a silt-rich matrix. The presence of small-scale ripple laminations, some reaching up to 1 cm in height, indicates deposition under oscillatory flow conditions likely formed by alternating current or wave activity. In certain sections, these ripple structures evolve into climbing ripple laminations, suggesting an increase in sedimentation rate or fluctuating flow strength during deposition.
The gradational contacts at both the base and top of the facies reflect a continuous sedimentation process, without abrupt shifts in depositional energy. This implies deposition occurred under relatively stable conditions, possibly in a shallow marine or distal lobe fringe environment, where fine-grained sediments were slowly transported and settled. From a sedimentological perspective, Facies 5 corresponds to the Tc division of the Bouma sequence (Bouma, 1962), indicative of low-density turbidity currents. These flows carry fine sand and silt in suspension, depositing them gradually as the energy of the current dissipates. The rhythmic nature of the laminations and the fine grain size suggest the sediment was deposited from waning, dilute flows in a deep-marine setting, likely in the outer fan or distal lobe areas of a submarine fan system.
4.2.6 Facies No.6: massive sandstone–high-density turbidity flow deposit
Facies 6 is composed of massive, fine-to medium-grained sandstone and is observed in the Lista Formation in wells 35/11-3S and 34/11-3. In well 35/11-3S, it extends from 1987 m to 1996 m with a thickness of 9 m, while in well 34/11-3, it appears as a thinner unit measuring 0.26 m between 2034.16 m and 2034.42 m (Table 2). This facies is characterized by a sharp basal contact and a gradational upper contact, indicating rapid deposition followed by waning flow energy. The absence of sedimentary structures suggests that the sand was deposited by high-density turbidity currents, capable of transporting and rapidly laying down large volumes of sediment without forming internal bedding. Alternatively, this facies may also reflect deposition from sandy debris flows triggered by slope failure or storm-induced sediment remobilization. Its sedimentological features massiveness, sharp contacts, and considerable thickness support interpretation as a lobe-axis deposit within a submarine fan system. Due to its high net-to-gross ratio and lateral continuity, Facies 6 is considered a key reservoir facies within the Lista Formation, especially when overlain by sealing mudstone units.
4.2.7 Facies No.7: fine-grained parallel-laminated sandstone–Tb bouma division
Facies 7 is identified in well 34/11-3 within the Lista Formation, extending from 2032.67 m to 2032.86 m with a thickness of 0.19 m. It consists of fine-grained, parallel-laminated sandstone with millimeter-scale laminae, occasionally interbedded with muddy sandstone layers. These characteristics indicate deposition from low-density turbidity currents in a deep-marine environment, such as a continental slope or distal fan setting. The well-developed parallel lamination reflects steady, sustained flow conditions, while the interbedding of fine sand and mud suggests intermittent fluctuations in flow energy. Some laminae likely represent traction carpets, formed under the influence of persistent bottom shear stress (Starek and Fuksi, 2017). Facies 7 corresponds to the Tb division of the Bouma sequence (Bouma, 1962), typically associated with outer fan turbidite systems. The lack of erosional surfaces, consistent lamination, and fine grain size support interpretation as a product of stable, low-energy sediment gravity flows, contributing to the lateral and vertical heterogeneity of the deep-marine depositional system.
4.2.8 Facies No.8: normally graded fine-grained turbidite–rapid suspension fallout
Facies 8 is identified in well 34/11-3 within the Lista Formation, spanning a thickness of 0.08 m from 2032.17 m to 2032.24 m (Table 2). This facies exhibits a normal grading pattern, with a transition from fine-grained sandstone at the base to silt-grade material at the top, and is bounded by sharp basal and upper contacts. The grading and stratification observed in this facies suggest deposition from a high-density turbidity current, where denser and coarser sediments settled rapidly from suspension, followed by finer grains as the flow decelerated. This process of vertical suspension fallout is typical of turbiditic sedimentation, where sediment-laden flows traveling downslope lose energy, depositing their load in a graded sequence (Talling et al., 2012). The sharp boundaries mark a sudden shift in depositional regimes, supporting an interpretation of episodic sediment input under energetic but short-lived conditions.
Immediately above Facies 8, the presence of planar-laminated beds corresponds with the Ta and Tb divisions of the Bouma sequence (Bouma, 1962; Fjellanger et al., 2005). These overlying units reinforce the interpretation that this facies is part of a classic turbidite succession deposited by gravity-driven sediment flows originating from more energetic, deeper water columns.
4.2.9 Facies No.9: recumbent folded sandstone–synsedimentary deformation by debris flows
Facies 9 is observed in well 34/11-3, within the Lista Formation, and spans a thickness of 0.24 m, from 2031.18 m to 2031.42 m (Table 2). It is composed of fine-grained sandstone and siltstone, distinguished by recumbent folding a clear indicator of post-depositional deformation. Both the base and top contacts of the facies are sharp, denoting abrupt transitions between sedimentary events and suggesting that this sandstone bed was emplaced suddenly and under high energy conditions. The recumbent folds seen within the sandstone layers indicate that the deposit experienced synsedimentary deformation, likely while the sediment was still unconsolidated or only partially compacted. This deformation could have resulted from gravitational forces, such as those generated by a cohesive laminar debris flow. These types of flows carry a mixture of sediments in a cohesive mass, and their sudden deceleration or impact against basin slopes can cause the underlying sediments to slump, fold, or buckle (Liu et al., 2017). The resulting deformation structures are typically observed in high-slope or unstable depositional environments, consistent with mass transport processes in submarine fan systems.
The folding may also reflect reworking or erosion by subsequent gravity-driven flows, powerful enough to disrupt and remobilize pre-existing beds, further contributing to the development of soft-sediment deformation structures. This supports an interpretation of Facies 9 as a product of dynamic depositional processes, with rapid sediment delivery and localized structural instability influencing the final architecture of the deposit.
4.2.10 Facies No.10: convoluted laminated sandstone–liquefied gravity flow deposit
Facies 10 is observed in well 34/11-3 within the Lista Formation, extending from 2029.57 m to 2029.65 m, with a thickness of 0.05 m (Table 2). This facies consists of fine-grained, convoluted laminated sandstone, with laminations that are subtle yet become distinguishable when contrasted with adjacent mud-rich intervals. The convoluted structure of the laminations forms intricate patterns, indicative of deformation during or shortly after deposition. A defining feature of this facies is the absence of water escape structures, such as dewatering pipes, which are commonly associated with compaction. This absence suggests that the sediment was likely liquefied during deposition, rather than being compacted afterward. Liquefaction occurs when pore water pressure within the sediment increases due to rapid loading or gravitational disturbance, temporarily converting the sediment into a fluid-like state. In this fluidized condition, laminae become unstable and deform, resulting in the characteristic convoluted bedding.
The convoluted laminations are interpreted as the product of a transitional flow regime neither entirely laminar nor fully turbulent possibly driven by a gravity-induced sediment flow. As energy fluctuated within the flow, the sediment settled in a semi-stable state, allowing deformation of individual laminae without full structural collapse. This scenario reflects gravity flow mechanisms, such as debris or liquefied flows, capable of mobilizing and depositing fine-grained material under conditions of rapid stress and pore pressure buildup (Lowe and Guy, 2000; Neuwerth et al., 2006).
4.2.11 Facies No.11: thinly interbedded sandstone and mudstone–alternating energy regimes
Facies 11 is identified in well 34/11-3, within the Lista Formation, from 2028.15 m to 2028.30 m, with a total thickness of 0.15 m (Table 2). It consists of alternating, thin layers of very fine-grained sandstone and mudstone, typically ranging from millimeter to centimeter scale. The sandstone beds exhibit ripple lamination, while the mudstones are massive and darker, possibly indicating anoxic or organic-rich conditions during low-energy periods. The facies is bounded by a sharp basal contact, marking the initiation of a depositional pulse, and a gradational upper contact, indicating the waning of flow and transition into background hemipelagic sedimentation. The alternation between sand and mud layers reflects episodic sedimentation controlled by fluctuations in flow energy sand deposited during low-density turbidity currents, and mud during intervening quiet-water conditions (Bouma, 1962; Mutti et al., 1996).
This facies is typical of lobe-fringe or interlobe settings within submarine fan systems, where sediment supply is intermittent and distal, and the energy of transporting flows diminishes across the basin floor (Reading and Richards, 1994). The presence of ripple lamination within the sandstone layers points to traction transport under decelerating flow conditions, while the overlying mudstone signals pelagic fallout or hemipelagic deposition (Stow and Johansson, 2000).
4.2.12 Facies No.12: matrix-supported sand-clast breccia–muddy debris flow deposit
Facies 12 is identified in well 31/2-19S within the Lista Formation, spanning from 1745 m to 1755.6 m, with a total thickness of 10.6 m (Table 2). This facies is characterized by a matrix-supported, mud-rich breccia, composed of large sand and mud clasts embedded in a finer-grained matrix. These clasts include notable mudstone rip-up fragments, indicative of intense erosion during transport and sudden depositional events. A significant feature of this facies is the evidence of bioturbation, including Zoophycos and cemented Planolites, which reflect post-depositional biological activity that reworked the sediment (Shanmugam, 2018). Additionally, a darkened interval between 1754.10 m and 1754.33 m exhibits black coloration, likely linked to migrated hydrocarbons that seeped into the sediment, suggesting proximity to or connectivity with deeper hydrocarbon sources (Norsk Hydro et al., 1997).
The angularity and poor sorting of the sand and mudstone clasts suggest minimal transport, implying that they were deposited close to their source. This supports interpretation as a product of a plastic, gravity-driven debris flow, where sediment moved rapidly downslope under the influence of gravity (Ahmadi et al., 2003). Such flows are capable of transporting coarse, cohesive materials in a turbulent and chaotic fashion, depositing them abruptly and creating thick, matrix-rich deposits like those observed in this facies.
4.2.13 Facies No.13: homogeneous claystone and calcareous mudstone–deep-marine debris flow deposit
Facies 13 is observed in well 31/2-4R, within the Lista Formation, spanning a substantial thickness of 101 m, from 1256 m to 1357 m. This facies is predominantly composed of homogeneous claystone interbedded with intervals of calcareous mudstone, including marl and dolomitic mudstone (Table 2). These alternating lithologies reflect varied mineralogical compositions and depositional conditions. The claystone represents fine-grained, stable marine deposition, while the calcareous and dolomitic intervals suggest episodic carbonate input and alkaline marine environments, likely under low-energy conditions. One of the most prominent features of this facies is the evidence of significant compaction stress, suggesting burial under considerable overburden pressure. This compaction points to deep sediment accumulation, likely associated with long-term tectonic subsidence or structural loading. Additionally, gas traces within the facies indicate the potential for hydrocarbon generation, implying that buried organic matter has undergone thermal maturation, producing hydrocarbons in situ (Norske Shell, 1982).
Several structural features, including faults, slump folds, and floating clasts, further support the notion of a dynamic depositional environment. These characteristics indicate that a muddy debris flow deposited Facies 13 in a deep-marine setting, where mass-wasting processes played a key role. Slump folds and faults are typically associated with synsedimentary deformation, driven by slope instability and gravity-driven sediment movement. The floating clasts, or large rock fragments suspended in the muddy matrix, imply the transport and deposition of cohesive blocks within a highly turbulent, gravity-driven flow system (Prélat et al., 2009; Prélat et., 2009).
5 Discussion and conclusion
This study presents an integrated geological interpretation of deep-water sandstones within the Sele and Lista formations of the northern Norwegian North Sea. By combining gamma-ray log analysis, high-resolution core imagery, stratigraphic correlation, and 3D structural modeling across a network of thirty-nine wells, we have significantly advanced the understanding of lithofacies distribution in the Sele and Lista formations (Figures 10, 11), depositional environments, and reservoir potential in this underexplored post-rift basin.
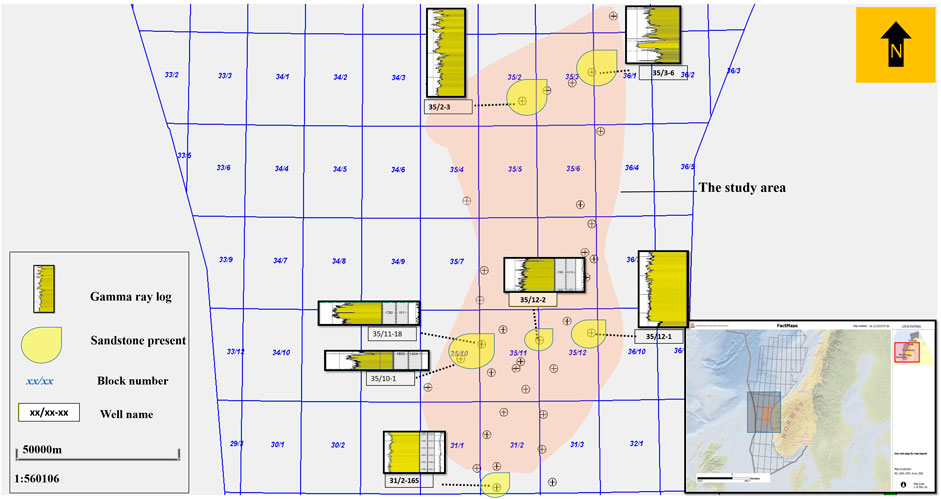
Figure 10. Distribution of sandstone lithology of Sele Formation in the study area. This map is based on eleven log-based cross-sections. Only the wells with sandstone lithology were displayed in this figure. The gamma-ray log of the Sele formation is displayed next to each of those wells.
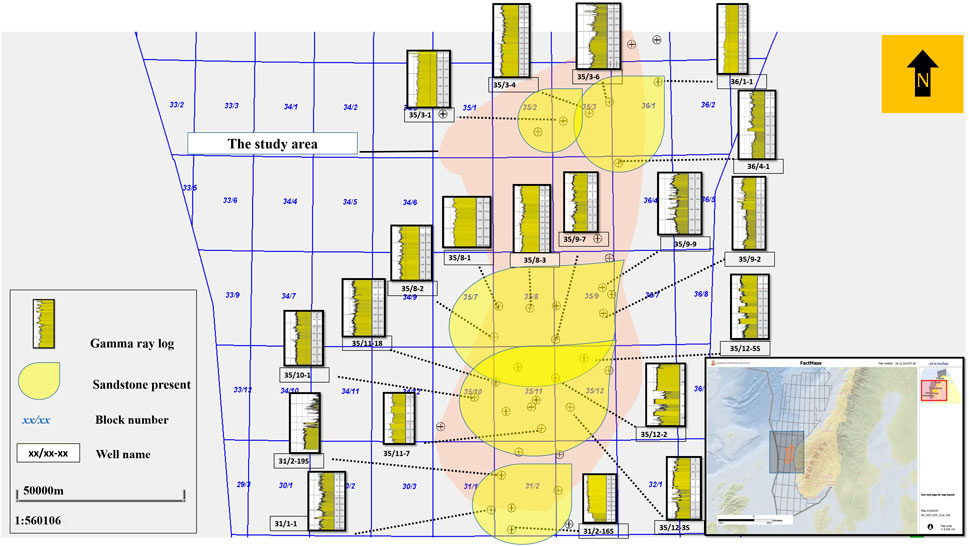
Figure 11. Distribution of sandstone lithology of the Lista Formation in the study area. This map is based on eleven log-based cross-sections. Only the wells with sandstone lithology were displayed in this figure. The gamma-ray logs of the Lista Formation were displayed next to each of these wells.
The findings reveal a complex and dynamic deep-marine depositional system shaped by the interplay of sediment gravity flows, sea-level fluctuations, and basin morphology. Gamma-ray log patterns, supported by core observations, highlight significant vertical and lateral facies variability across the basin (Figures 6–9). These variations reflect deposition by a range of sediment gravity flows, including high- and low-density turbidity currents, debris flows, and hemipelagic settling (Mutti et al., 1996; Reading and Richards, 1994).
Core-based lithofacies analysis identified thirteen distinct lithofacies, grouped into four main depositional types:
• Low-energy mudstone facies (Type 1), including variegated and laminated pelagic mudstones (Facies 1, 2, 3, 11, 13);
• Turbidite facies (Type 2), characterized by ripple-laminated sandstones, massive sandstones, and parallel-laminated sandstones (Facies 5, 6, 7, 8);
• Sandy debris flow facies (Type 3), such as matrix-supported mud-clast breccia and recumbent folded sandstones (Facies 4, 9); and
• Muddy debris flow facies (Type 4), represented by deformed and unconsolidated shale or large sand-clast breccia with slickensides and signs of compaction (Facies 10, 12, 13) (Figures 5, 6; Table 2).
The Lista Formation, in particular, contains thick, laterally extensive sandstones associated with turbidites (e.g., Facies 6 and 7) and sandy debris flows (e.g., Facies 4 and 9), which demonstrate good reservoir characteristics due to their high net-to-gross ratios, sharp basal contacts, and structureless or laminated textures (Catuneanu et al., 2009; Galloway, 1998). These sand-rich lobes are predominantly found in wells such as 35/11-3S and 34/11-3, suggesting deposition in lobe-axis and off-axis settings within a submarine fan system (Prélat et al., 2009). In contrast, the Sele Formation is dominated by fine-grained, mud-rich facies (e.g., Facies 1 and 2) indicative of low-energy environments and distal deposition, suggesting its role as an effective regional seal (Davis et al., 2009).
The eleven log-based cross-sections (Figure 5), oriented in both dip and strike directions, provide a three-dimensional perspective of lithofacies architecture and help trace key stratigraphic surfaces, including maximum flooding surface (MFS), sequence boundary (SB), and transgressive surface (TS). These surfaces mark shifts in relative sea level and are critical for reconstructing the depositional evolution and stratigraphic organization of the basin (Catuneanu, 2006; Catuneanu et al., 2011).
To further enhance the spatial interpretation, 3D structural depth models were constructed for the Sele and Lista formations (Figures 12–14). These models integrate well-log data and stratigraphic markers to map the depth, geometry, and distribution of key lithological units across the study area. The depth model for the Sele Formation (Figure 12) highlights its regional extent and relative continuity as a potential seal, while the Lista Formation models (Figures 13, 14) delineate sand-rich lobes and depositional geometries that are critical for assessing reservoir compartmentalization, connectivity, and trapping mechanisms; Norwegian Offshore Directorate (NOD), 2021).
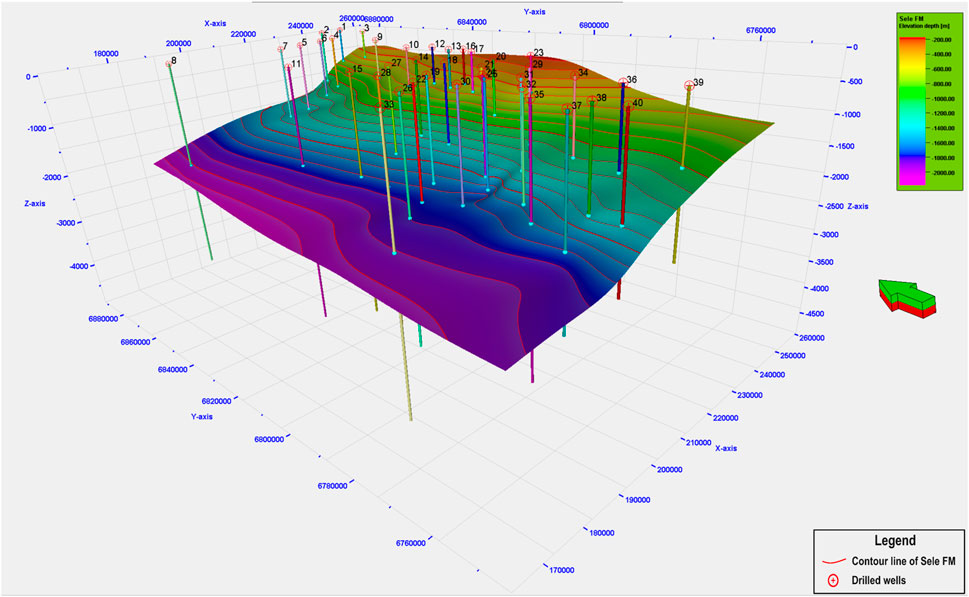
Figure 12. The three-dimensional depth model of the Sele Formation displays depth contour lines and well penetrations for subsurface hydrocarbon mapping based on formation tops from 40 wells (the original well names are listed in Figure 4).
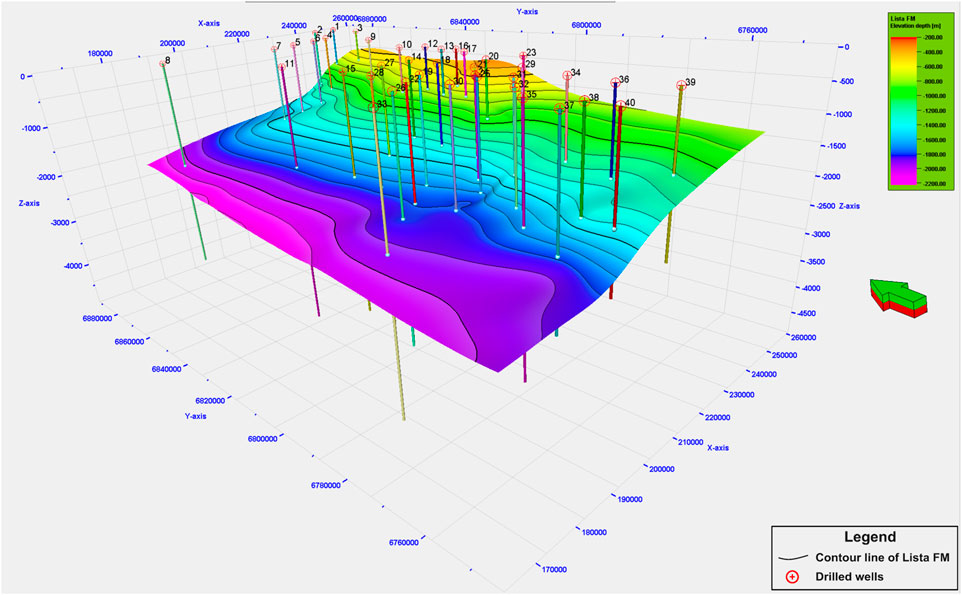
Figure 13. The three-dimensional depth model of the Lista Formation illustrates depth contour lines and well penetrations for subsurface hydrocarbon mapping based on the formation tops of 40 wells (the original well names are listed in Figure 4).
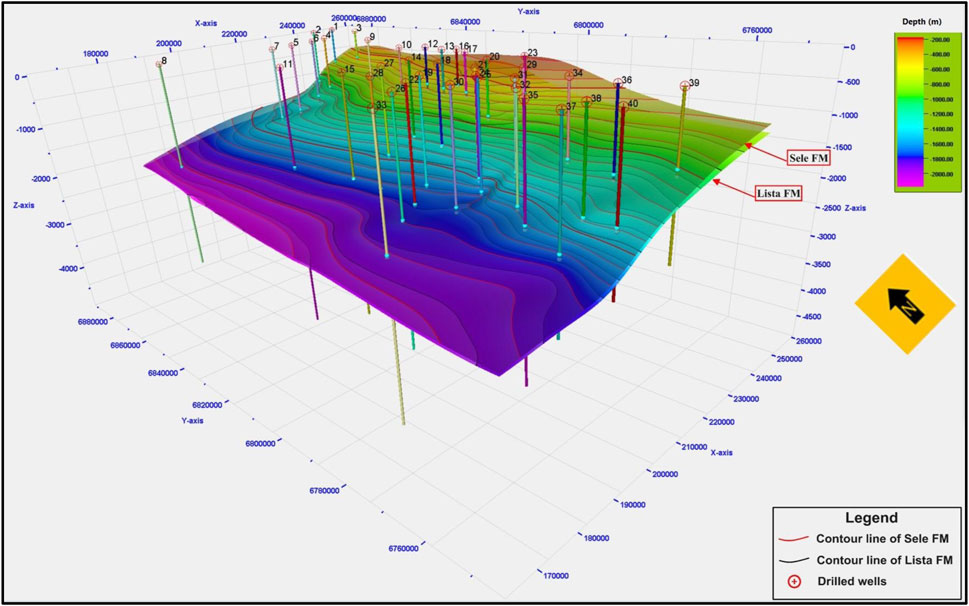
Figure 14. Three-dimensional depth model of both the Sele and Lista formations depicting depth contour lines and well penetrations for subsurface hydrocarbon mapping based on the formation tops of 40 wells (the original well names appear in Figure 4).
From a broader geoscientific and energy exploration perspective, this study demonstrates the value of integrating core-scale lithofacies analysis, well-log interpretation, and 3D modeling in resolving geological uncertainties in deep-water environments. The approach adopted here enhances the ability to evaluate reservoir presence, continuity, and quality in stratigraphically complex offshore basins.
It can be concluded that the integration of well logs, core-derived lithofacies, sequence stratigraphy, and 3D depth modeling has significantly advanced the geological understanding of the Sele and Lista formations. The Lista Formation, with its sand-rich turbidite and debris flow facies, shows strong potential as a deep-water reservoir, while the Sele Formation offers regional sealing capacity. Together, they form a promising stratigraphic trap system, reinforcing the petroleum prospectivity of the northern Norwegian North Sea.
These findings are not only relevant to exploration efforts in the Norwegian North Sea but also offer transferable insights for other passive-margin and post-rift basins worldwide, such as the Gulf of Mexico, offshore Brazil, and the West African margin. In these regions, hydrocarbon exploration increasingly targets deep-water stratigraphic traps formed by turbidites, debris flows, and hemipelagic deposits, often within structurally complex or tectonically quiescent settings (Posamentier and Kolla, 2003; Prélat et al., 2009; Shanmugam, 2018; Reading and Richards, 1994). Similar to the Sele and Lista formations, the challenge lies in predicting the distribution and quality of reservoir and seal facies in the absence of extensive core or seismic data. For example, the deep-water sand-rich lobes of the Karoo Basin in South Africa have been studied in high-resolution outcrops to understand hierarchical turbidite systems (Prélat et al., 2009), offering analogs for subsurface evaluation. In the Gulf of Mexico, seismic geomorphology and log integration have proven essential in identifying bypassed stratigraphic plays (Posamentier and Kolla, 2003). The methodology employed in the present study, combining gamma-ray log motifs, lithofacies analysis, and 3D depth modeling, provides a scalable framework that can be adapted to these and other offshore basins where deep-marine processes dominate reservoir architecture.
The limitations of the employed methods and future prospective directions
The research has a few notable limitations. First, core data coverage is limited, particularly for the Sele Formation, which directly constrains the ability to calibrate lithofacies interpretations across the entire study area. Another key limitation is the lack of seismic data integration, which restricts the study’s ability to interpret structural and stratigraphic features across larger spatial scales entirely. Finally, the analysis is focused exclusively on the Sele and Lista formations, potentially overlooking other intervals with hydrocarbon potential.
Future research should focus on expanding core sampling to a broader range of wells and formations, thereby addressing these limitations and facilitating a more comprehensive characterization of lithofacies. Integrating well logs with 3D seismic data would significantly improve the spatial understanding of depositional architectures and stratigraphic traps. Additional petrophysical analyses such as porosity, permeability, and fluid saturation studies are vital for evaluating the economic feasibility of the reservoirs. Moreover, developing dynamic reservoir models could assist in predicting fluid flow and informing development strategies. Finally, a more comprehensive investigation of stratigraphic traps is recommended, as these are increasingly recognized as critical regional exploration targets. Table 3 presents the glossary of key scientific terms and their definitions.
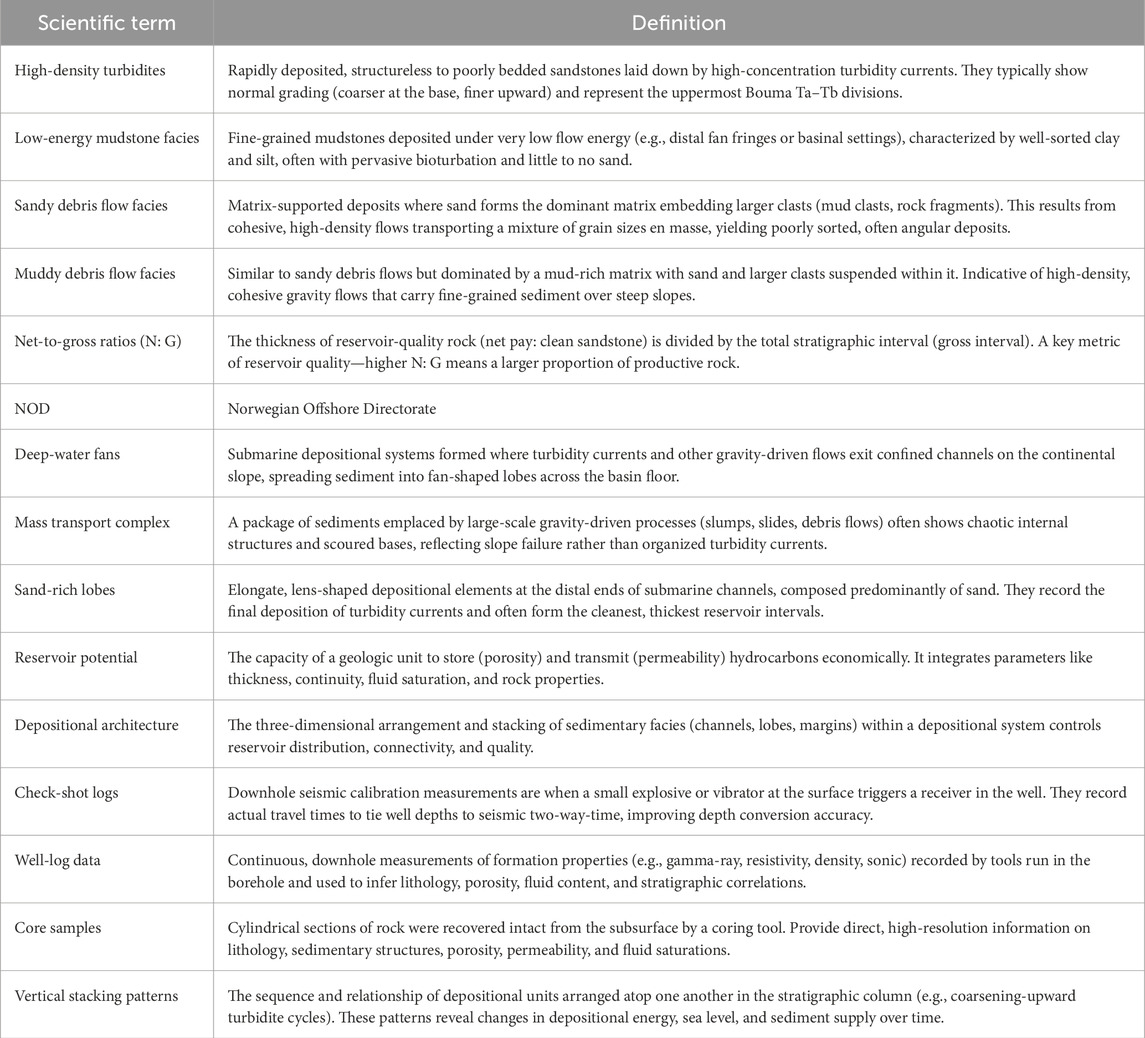
Table 3. Glossary of scientific terms utilized in this study with their definitions.
Data availability statement
The original contributions presented in the study are included in the article/supplementary material, further inquiries can be directed to the corresponding author.
Author contributions
AA: Conceptualization, Data curation, Formal Analysis, Investigation, Methodology, Validation, Writing – original draft. CK: Supervision, Formal Analysis, Writing – review and editing. ZA: Visualization, Validation, Writing – review and editing.
Funding
The author(s) declare that financial support was received for the research and/or publication of this article. This work would not have been possible without the generous support of the Geophysical Exploration Lab at the Boone Pickens School of Geology. I am also thankful to Oklahoma State University for the financial assistance provided through graduate teaching and research assistantships, as well as institutional grants. Additional support was generously offered by a scholarship from the West Texas Geological Society and a fellowship from the Oklahoma Geological Foundation.
Acknowledgments
The Norwegian Offshore Directorate (NOD) provided the necessary data for this study.
Conflict of interest
The authors declare that the research was conducted in the absence of any commercial or financial relationships that could be construed as a potential conflict of interest.
Generative AI statement
The author(s) declare that no Generative AI was used in the creation of this manuscript.
Publisher’s note
All claims expressed in this article are solely those of the authors and do not necessarily represent those of their affiliated organizations, or those of the publisher, the editors and the reviewers. Any product that may be evaluated in this article, or claim that may be made by its manufacturer, is not guaranteed or endorsed by the publisher.
References
Ahmadi, H., Johansen, S. E., and Nyberg, K. (2003). Depositional processes and reservoir quality in Paleocene deep marine sandstones, Norwegian North Sea. Nor. J. Geol. 83 (3), 159–176.
Bouma, A. H. (1962). Sedimentology of some flysch deposits: a graphic approach to facies interpretation. Amsterdam: Elsevier.
Catuneanu, O., Abreu, V., Bhattacharya, J. P., Blum, M. D., Dalrymple, R. W., Eriksson, P. G., et al. (2009). Towards the standardization of sequence stratigraphy. Earth-Science Rev. 92 (1-2), 1–33. doi:10.1016/j.earscirev.2008.10.003
Catuneanu, O., Galloway, W. E., Kendall, C. G.St. C., Miall, A. D., Posamentier, H. W., Strasser, A., et al. (2011). Sequence stratigraphy: methodology and nomenclature. Newsletters Stratigr. 44 (3), 173–245. doi:10.1127/0078-0421/2011/0011
Clark, I. R., and Cartwright, J. A. (2009). Interactions between submarine channel systems and deformation in deepwater fold belts: examples from the Levant Basin, Eastern Mediterranean sea. Mar. Pet. Geol. 26 (8), 1465–1482.
Davis, R. A., Dalrymple, R. W., and Boyd, R. (2009). Principles of sedimentology and stratigraphy. 5th ed. Pearson Prentice Hall.
Fjellanger, E., Surlyk, F., Wamsteeker, L. C., and Midtun, T. (2005). Upper cretaceous basin-floor fans in the Vøring Basin, Mid Norway shelf. Spec. Publ. NPF, 135–164. doi:10.1016/s0928-8937(05)80047-5
Galloway, W. E. (1998). Siliciclastic slope and base-of-slope depositional systems: component facies, stratigraphic architecture, and classification. AAPG Bull. 82 (4), 569–595. doi:10.1306/1D9BC5BB-172D-11D7-8645000102C1865D
Gradstein, F. M., Ogg, J. G., Schmitz, M., and Ogg, G. (2010). The geologic time scale 2012. Elsevier.
Haq, B. U., Hardenbol, J., and Vail, P. R. (1988). “Mesozoic and Cenozoic chronostratigraphy and cycles of sea-level change,”, 42. SEPM Special Publication, 71–108. doi:10.2110/pec.88.01.0071
Harold, R. T., Kross, W., and Newman, R. B. (1994). Turbidite and debris-flow facies in the North sea Paleocene. Mar. Petroleum Geol. 11 (3), 316–328. doi:10.1306/A25FE3BF-171B-11D7-8645000102C1865D
Hunt, D., and Tucker, M. E. (1992). Stranded parasequences and the forced regressive wedge systems tract: deposition during base-level fall. Sediment. Geol. 81 (1–2), 1–9. doi:10.1016/0037-0738(92)90052-s
Isaksen, D., and Tonstad, K. (1989). A synthesis of stratigraphic and sedimentological data for the Paleocene formations, Norwegian North Sea. Nor. Geol. Tidsskr. 69, 179–200. doi:10.17850/njgsp1
Jackson, C. A.-L., Gawthorpe, R. L., and Sharp, I. R. (2011). Growth faults and syn-depositional deformation in deep-marine sediments. Basin Res. 23, 399–411. doi:10.1306/01031110037
Johnson, H. D. (1987). Sedimentology of offshore sand lobes in the North Sea: analogues for hydrocarbon reservoirs. Sedimentology 34 (4), 489–509.
Kneller, B., and Brannet, M. (1995). Channelized turbidite systems: process and architecture. J. Sediment. Res. 65 (3), 281–293. doi:10.1111/j.1365-3091.1995.tb00395.x
Knox, R. W. O. ’B., Corfield, R. M., and Dunay, R. E. (2010). Sequence stratigraphy and facies architecture of Paleocene successions in the North Sea, 183. Geological Society Special Publications, 73–100.
Kothe, M., Hampson, G. J., and Storms, J. E. A. (2010). Stratigraphic architecture and sediment distribution in slope systems. Mar. Petroleum Geol. 27, 1200–1222.
Liu, J., Xian, B., Wang, J., Ji, Y., Lu, Z., and Liu, S. (2017). Sedimentary architecture of a sub-lacustrine debris fan: Eocene Dongying Depression, Bohai Bay Basin, East China. Sediment. Geol. 362, 66–82. doi:10.1016/j.sedgeo.2017.09.014
Liu, X., and Byrne, R. H. (1995). Comparative carbonate complexation of yttrium and gadolinium at 25°C and 0.7 mol dm− 3 ionic strength. Mar. Chem. 51 (3), 213–221.
Loutit, T. S., Hardenbol, J., Vail, P. R., and Baum, G. R. (1988). “Condensed sections: the key to age dating and correlation of continental margin sequences,”, Sea-Level Changes Integr. Approach 42. SEPM Special Publication, 183–213. doi:10.2110/PEC.88.01.0183
Lowe, D. R. (1982). Sediment gravity flows: II depositional models with special reference to the deposits of high-density turbidity currents. J. Sediment. Res. 52. doi:10.1306/212f7f31-2b24-11d7-8648000102c1865d
Lowe, D. R., and Guy, M. (2000). Slurry-flow deposits in the Britannia Formation (Lower Cretaceous), North Sea: a new perspective on the turbidity current and debris flow problem. Sedimentology 47 (1), 31–70. doi:10.1046/j.1365-3091.2000.00276.x
Macquaker, J. H. S., Keller, M. A., and Davies, S. J. (2010). Chemostratigraphy of marine mudstones: interpreting geochemical signatures in fine-grained rocks. Sedimentology 57 (4), 1058–1082. doi:10.1130/g31093.1
Morton, A. C., Hallsworth, C. R., and Chalton, J. (1993). Provenance of Paleocene sandstones in the central North Sea: implications for source area tectonics. J. Geol. Soc. 150 (3), 489–502. doi:10.1144/0040073
Mutti, E., and Ricci Lucchi, F. (1978). Turbidites of the northern Apennines: introduction to facies analysis. Int. Geol. Rev. 20 (2), 125–166. doi:10.1080/00206817809471524
Mutti, E., Tinterri, R., Remacha, E., Mavilla, N., Angella, S., and Fava, L. (1996). Turbidite facies associations and sequences: examples from Tertiary foredeep turbidite systems in the Apennines, 15. APAT Special Publication, 1–92.
Neal, J. E. (1996). Sequence stratigraphy and sea-level change: a North Sea perspective, 103. Geological Society Special Publication, 245–267.
Neuwerth, R., Genser, J., Baumgartner, P. O., and Krahenbuhl, R. A. (2006). Synsedimentary tectonics and soft-sediment deformation in a gravity-flow dominated submarine fan. Sediment. Geol. 186 (3-4), 67–88. doi:10.1016/j.sedgeo.2005.10.009
Norsk Hydro, , Statoil, , Mobil and Neste, , Gahlla, S. S., Nyby, R., Bang, N., et al. (1997). Final well report of well 31/2-19S (R-076446). Available online at: https://factpages.npd.no/pbl/wellbore_documents/2798_31_2_19_S_COMPLETION_REPORT_AND_COMPLETION_LOG.pdf.
Norwegian Offshore Directorate (NOD) (2021). North Sea stratigraphic and structural databases. Available online at: https://www.npd.no.
Pickering, K. T., Hiscott, R. N., and Hein, F. J. (1986). Deep-marine environments: clastic sedimentation and tectonics. Unwin Hyman.
Posamentier, H. W., and Allen, G. P. (1999). Siliciclastic sequence stratigraphy: concepts and applications. SEPM Concepts Sedimentology Paleontology 7. doi:10.2110/csp.99.07
Posamentier, H. W., Jervey, M. T., and Vail, P. R. (1988). “Eustatic controls on clastic deposition: II. Sequence and systems tract models,”Sea-Level Changes Integr. Approach, 42. 125–154. doi:10.2110/pec.88.01.0125
Posamentier, H. W., and Kolla, V. (2003). Seismic geomorphology and stratigraphy of depositional elements in deep-water settings. J. Sediment. Res. 73 (3), 367–388. doi:10.1306/111302730367
Posamentier, H. W., and Walker, R. G. (2006). Facies models revisited. SEPM (Society for Sedimentary Geology).
Prélat, A., Hodgson, D. M., and Flint, S. S. (2009). Evolution, architecture, and hierarchy of distributary deep-water deposits: a high-resolution outcrop investigation from the Permian Karoo Basin, South Africa. Sedimentology 56 (7), 2132–2154. doi:10.1111/j.1365-3091.2009.01073.x
Reading, H. G., and Richards, M. (1994). Turbidite systems in deep-water basin margins classified by grain size and feeder system. AAPG Bull. 78 (5), 792–822. doi:10.1306/a25fe3bf-171b-11d7-8645000102c1865d
Richiano, S. (2015). Environmental factors affecting the development of the Zoophycos ichnofacies in the Lower Cretaceous Río Mayer Formation (Austral Basin, Patagonia) Palaeogeogr. Palaeoclimatol. Palaeoecol. 439, 17–26. doi:10.1016/j.palaeo.2015.03.029
Southern, S. J., Hodgson, D. M., and Flint, S. S. (2017). A hierarchical approach to the analysis of sedimentary architecture: examples from deep-marine basin-floor deposits. J. Sediment. Res. 87, 1–14. doi:10.1111/sed.12323
Spychala, Y. T., Hodgson, D. M., Prélat, A., Kane, I. A., Flint, S. S., and Mountney, N. P. (2017). Frontal and lateral submarine lobe fringes: comparing sedimentary facies, architecture and flow processes. J. Sediment. Res. 87 (1), 75–96. doi:10.2110/jsr.2017.2
Starek, D., and Fuksi, T. (2017). Distal turbidite fan/lobe succession of the Late Oligocene Zuberec Fm. – architecture and hierarchy (Central Western Carpathians, Orava–Podhale basin). Open Geosci. 9 (1). doi:10.1515/geo-2017-0030
Statoil. (1992). Well completion reports for wells 35/9-2 and 35/10-1. Norwegian petroleum directorate archive.
Stoker, S. J., Gray, J. C., Haile, P., Andrews, I. J., and Cameron, T. D. J. (2006). The importance of stratigraphic plays in the undiscovered resources of the UK Continental Shelf. Geol. Soc. Lond. Spec. Publ. 254 (1), 153–167. doi:10.1144/gsl.sp.2006.254.01.08
Stow, D. A. V., and Johansson, M. (2000). Deep-water massive sands: nature, origin and hydrocarbon implications. Mar. Petroleum Geol. 17 (2), 145–174. doi:10.1016/s0264-8172(99)00051-3
Talling, P. J., Masson, D. G., Sumner, E. J., and Malgesini, G. (2012). Subaqueous sediment density flows: depositional processes and deposit types. Sedimentology 59 (7), 1937–2003. doi:10.1111/j.1365-3091.2012.01353.x
Wetzel, A. (1991). Ecologic interpretation of deep-sea trace fossil communities. Palaeogeogr. Palaeoclimatol. Palaeoecol. 85 (1-2), 47–69.
Keywords: lithofacies, depositional environments, reservoir potential, deep-water sandstone, Norwegian North Sea
Citation: Al Janabi A, Knapp CC and Albesher Z (2025) Advanced methods for geological interpretation of depositional environments and lithofacies: insights into hydrocarbon potential in the northern Norwegian North Sea. Front. Earth Sci. 13:1582071. doi: 10.3389/feart.2025.1582071
Received: 23 February 2025; Accepted: 03 June 2025;
Published: 25 July 2025.
Edited by:
Ahmed M. Eldosouky, Suez University, EgyptReviewed by:
Mostapha Bouzekraoui, Mohammed V University, MoroccoWalid Farhi, University of Science and Technology Houari Boumediene, Algeria
Copyright © 2025 Al Janabi, Knapp and Albesher. This is an open-access article distributed under the terms of the Creative Commons Attribution License (CC BY). The use, distribution or reproduction in other forums is permitted, provided the original author(s) and the copyright owner(s) are credited and that the original publication in this journal is cited, in accordance with accepted academic practice. No use, distribution or reproduction is permitted which does not comply with these terms.
*Correspondence: Ziyad I. Albesher, emFsYmVzaGVyQGthY3N0Lmdvdi5zYQ==