 Dayou Chen
 Huanhuan Zhao2
 Feifei Zheng
- 1Bailie School of Petroleum Engineering, Lanzhou City University, Lanzhou, China
- 2Northwest Institute of Eco-Environment and Resources, Chinese Academy of Sciences, Lanzhou, China
- 3School of Earth Sciences, Key Laboratory of Mineral Resources in Western China (Gansu Province), Lanzhou University, Lanzhou, China
Introduction: Microporous structures of tight sandstones show diverse fractal features in different diagenetic facies.
Methods: Experimental tests such as cast thin sections, scanning electron microscopy, high-pressure mercury pressure, and low-temperature nitrogen adsorption were applied to clarify the pore fractal differences between various diagenetic facies. The diagenesis, pore types, and pore distribution characteristics of typical tight sandstone samples from the Chang 6 reservoir of the Triassic Yanchang Formation in the Ordos Basin, China, are systematically analyzed. Furthermore, fractal theory is applied to investigate the differences in pore fractal characteristics among various diagenetic facies, as well as the controlling factors influencing these differences.
Results: The results show that within the study area, we have meticulously divided the diagenetic facies into four main categories: strong compaction facies, carbonate cementation facies, clay mineral cementation facies, weak cementation, and strong dissolution facies. Samples from different diagenetic facies exhibit significant variability in pore size distribution, and the microscopic pores structure is multifractal, with different fractal dimensions for different aperture ranges. The highest fractal dimension of different pores in strong compaction facies indicates strong compaction facies pore surface roughness. The pores are not regular enough and are unfavorable to the storage and infiltration of natural gas in the pores, followed by the carbonate cementation facies and the clay mineral cementation facies. The weak cementation and strong dissolution facies have a low fractal dimension. The pores are relatively more regular, which is more favorable to the storage and infiltration of the pores. Mineral compositions, reservoir properties, and sedimentary facies influence the pore fractal of the tight sandstone in the study area.
Discussion: This study reveals the relationship between diagenetic facies and pore fractals in tight sandstone reservoirs. The study is significant for exploring and developing tight oil in the study area.
1 Introduction
Because of the continuous growth of energy demand, the industry has generally called for accelerating the discovery process of new oil and gas resources, and the focus of exploration has gradually shifted from traditional conventional oil and gas resources to unconventional oil and gas resources with unlimited potential (Shu et al., 2025; He et al., 2025; Sohail et al., 2022; Liu et al., 2025). Among these unconventional resources, tight oil and gas have attracted much attention due to their vast development potential and have become the top priority of current research (Wang et al., 2023; Deng et al., 2022; Marghani et al., 2023; Liu et al., 2023). As the primary carrier of tight hydrocarbon, the internal pore structure of tight sandstone reservoirs is intricate and complex, with significant non-homogeneity, which is directly associated with their reservoir performance and seepage efficiency, and thus has a crucial effect on the capacity distribution and reservoir development effects (Wang et al., 2018; Chen et al., 2024).
Due to the highly complex and variable lithology and diagenesis, tight reservoirs have a crucial effect on the microporous throat structure, storage properties, and reservoir permeability, resulting in tight pores and complex flow of reservoir fluids, which in turn makes it difficult to characterize the microscopic pores, and have always been an oil and gas exploration research focus and difficulty. Therefore, in developing oil and gas exploration in onshore basins for many years, the exploration status of tight reservoirs has become more and more prominent, and relatively abundant research results have been accumulated (Zhou et al., 2021; Wang et al., 2019; Yang et al., 2016). After undergoing complex diagenetic processes, the reservoirs form distinctive diagenetic facies, which serve as key indicators for identifying the formation causes of the reservoirs. By conducting in-depth analysis and identifying the dominant diagenetic facies, it is possible to further select the efficient reservoirs (Lai et al., 2016). Consequently, it is essential to study the reservoir diagenetic facies (Xu et al., 2024). Further study of diagenetic facies can help to elucidate the characteristics of movable fluid accumulation in different microporous structures. Although some progress has been made in the study of diagenetic facies, there is still a lack of standardized criteria for naming and classifying diagenetic facies, which is usually based on a comprehensive consideration of the influence of each single factor on the physical properties of reservoirs, and then superimposed and integrated consideration of each single factor to make a more detailed and scientific classification of diagenetic facies. Its nomenclature is mainly based on the specific types of diagenetic processes, cementation characteristics, and the comprehensive combination of pore types (Yang et al., 2013; Xu et al., 2020; Zhang et al., 2020a). Taking the study as an example (Li et al., 2016), a large number of physical parameters, thin sections observations, and experimental data were analyzed in depth, and through systematic comparative studies, a scientific quantitative classification system was established for the diagenetic facies from the perspectives of diagenesis intensity and pore-structure complexity. The distinctive features and differences between the four diagenetic facies were analyzed in depth.
Therefore, it is imperative to conduct in-depth and detailed profiling of the microscopic pore characteristics of different diagenetic facies types at the microscopic level (Qiao et al., 2020a; Qiao et al., 2020b). Conventional methods such as thin-section data studies, HPMI test analyses, and low-temperature nitrogen adsorption experiments have limitations in revealing the complex characteristics of microscopic pore throats and their distribution patterns within reservoirs. Therefore, there is an urgent need for new methods to provide a more accurate and comprehensive quantitative characterization of various evaluation parameters of tight reservoirs (Chalmers et al., 2012; Curtis et al., 2012; Loucks et al., 2012; Lei et al., 2015). In the continuous deepening research process, HPMI test analyses, low-temperature nitrogen adsorption method, and micro-nano CT scanning technology have become the key technical means to accurately reveal the structural characteristics of micropore channels in tight reservoirs. Tight sandstone reservoirs are significantly different from conventional reservoirs, tight sandstone reservoirs have strong pore non-homogeneity and complex pore structure, and fractal dimension has gradually become a key tool for quantitative analysis of reservoir pore structure characterization and non-homogeneity. The concept of fractal theory was proposed by the French mathematician Mandelbrot. It is a mathematical statistical theory method used to study the self-similarity of objects. At the same time, fractal theory is also a relatively accurate quantitative characterization, mainly used to reflect the uneven distribution of the properties of strata in three-dimensional space. After years of research and development, its theoretical system has become quite mature and has been widely applied in many fields, such as geology. Currently, fractal theory has become a widely employed approach in exploring the non-homogeneity of tight sandstone and shale reservoirs, using fractal dimensions to calculate or characterize some relevant physical parameters and to describe the complexity of pore structure quantitatively (Li et al., 2019; Tang et al., 2019; Zhang et al., 2020b).
In recent years, although many researchers have long been devoted to the study of the diagenesis and diagenetic process of chang 6 reservoirs of the Triassic Yanchang Formation in the western Ordos Basin, China, the exploration of different diagenetic facies is still weak, especially the lack of in-depth research on the difference of fractal characteristics of the micropore of the tight sandstone in different diagenetic facies types. Given this, based on a systematic analysis of the diagenetic role of the Chang 6 reservoirs in the western Ordos Basin, we now classify the diagenetic facies by combining the core observation and cast thin-sections analysis, etc., and use this as a guideline for quantitative analysis by combining the HPMI test analyses and LTNA test, etc., to clearly define the fractal characteristics of the reservoir, the pore structure and the control factors, and to clarify dominant diagenetic facies within the area from a new perspective and to gain new understanding of their distribution patterns. The latest knowledge of its distribution law is hoped to give a new way of thinking about the in-depth study of the Chang 6 reservoirs of the Yanchang Formation in the western Ordos Basin.
2 Geological setting
The Ordos Basin is a mid-Cenozoic hydrocarbon-bearing sedimentary basin developed based on the North China of Craton Massif, reaching the Yinshan Mountains in the north, the Helan-Liupan Mountains in the west, the Qinling Mountains in the south, and the Lvliang Mountains in the east, and spanning the five provinces of Mongolia, Ningxia, Gansu, Shanxi, and Jin, and is further divided into six primary tectonic units based on the nature of the basement, the present tectonic morphology, and the characteristics of the Yimeng uplift, and the Western Marginal Retroclinical Belt, the Weibei uplift, the Tianhuan Obliquity, North Shaanxi Slope, and West Jin Flexural Belt six primary tectonic units. The Upper Triassic Yanchang Formation is an important layer for the development of low-to-ultra-low permeability sandstone reservoirs in the basin, from the bottom to the top, can be meticulously delineated into ten oil groups from Chang 10 to Chang 1, which together witnessed the complete evolution history of the Ordos large inland lake basin from occurrence, development to extinction, among which the Chang 6 reservoirs is the key formation for hydrocarbon exploration, and is also the object in this paper.
The study area examined in this paper is specific to the western belt of the Ordos Basin, and the tectonic zoning begins in the southwestern part of the northern slope of Shaanxi Province (Figure 1). It is mainly a typical low-permeability sandstone reservoir with a complex pore structure, the geology of the area is relatively homogeneous and uncomplicated. The reservoir of the Chang 6 reservoirs Yanchang Formation is a set of thinly laminated sand bodies formed in the fore-edge of the shallow-water braided river delta at the macroscopic level, at the micro level, due to the differential distribution of sedimentary facies zones, the diversity of primitive rock structures and the complexity of stratigraphic fluid activities, a variety of microfacies types are formed, such as submerged diversion channels, leading-edge mat sands, submerged natural dykes, and diversion intervals. The bottom-up sequence can be divided into three sedimentary gyres, Chang 63, Chang 62, and Chang 61, each of which consists of sandstones, siltstones, and mudstones, with the thick sand body at the delta front of the Chang 61 delta being the most developed.
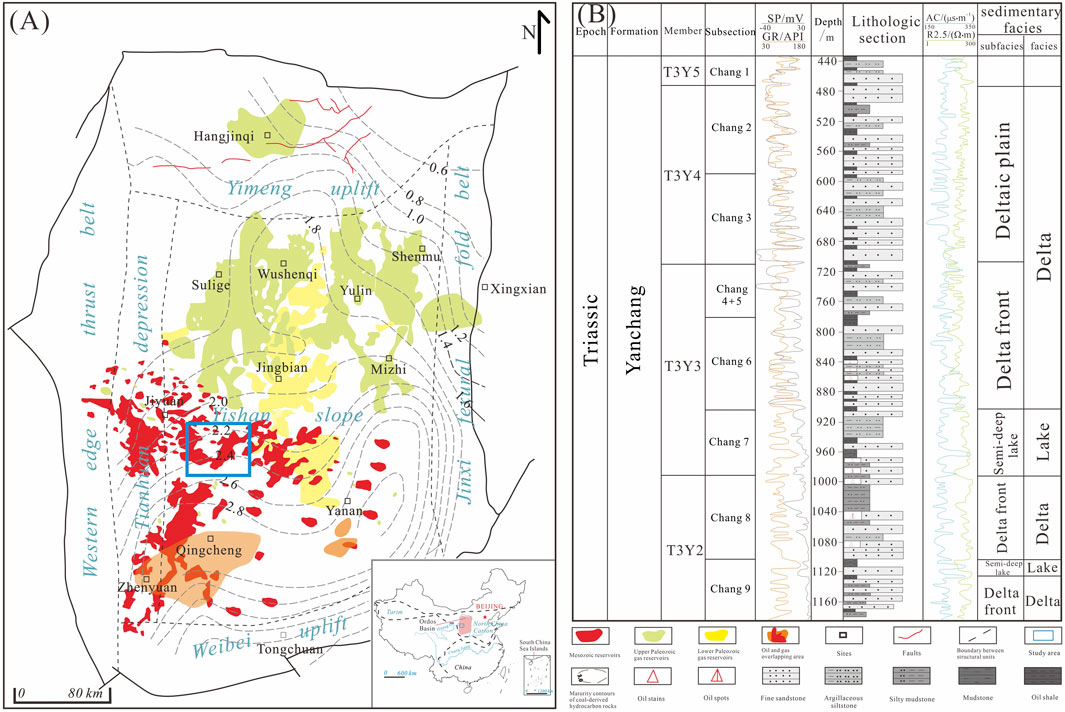
Figure 1. Geologic map (A) and stratigraphic development histogram (B) [quoted from literature (Zhang et al., 2023; Qin et al., 2025)].
3 Sampling and analytical test methods
The sampling methods in this paper are as follows: (1) Analyze the cast thin sections data of 100 rock samples to study their diagenesis and diagenetic facies, and combine with the previous understanding of the type of diagenesis of the reservoir, the preliminary identification and classification of the type of diagenetic facies; (2) Select the typical facies, and choose 3-4 samples for each type, and carry out scanning electron microscopy, HPMI test analyses, and LTNA method on tight sandstones with different diagenetic facies, the statistical table of sample information (Table 1).
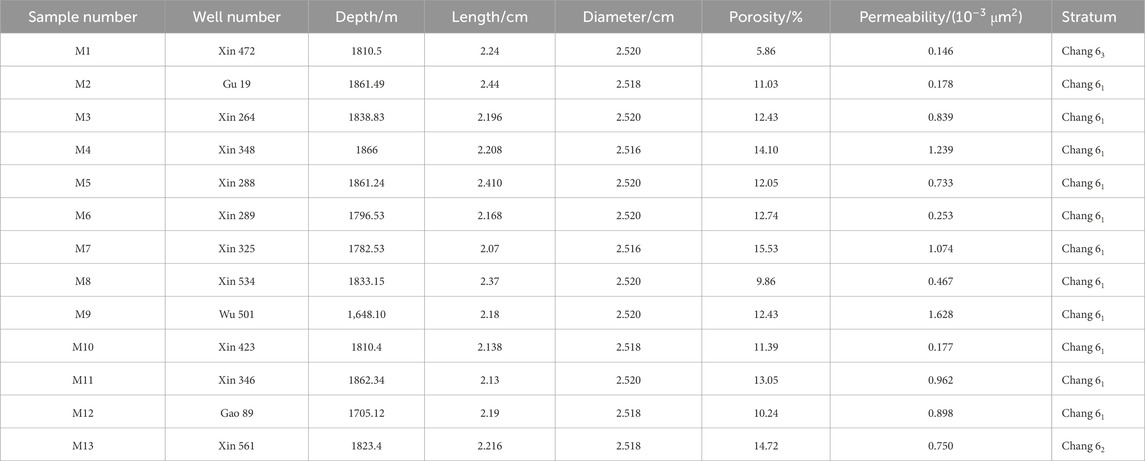
Table 1. The statistical table of sample information.
The analytical test methods include casting thin-section fractals, scanning electron microscope observation, HPMI test, and LTNA experiment.
Casting thin sections effectively studies the pore size, distribution, pore type, connectivity, and combination characteristics of rocks. The rocks were cut into square slices 25 mm, and the epoxy resin dyed red was injected into the pores of the stones to complete the production of cast slices after grinding and sticking the slices in a delicate process. After the samples were prepared, they were observed and characterized by polarized light microscopy. The scanning electron microscope can observe the micron-nanometer scale of rock pores and throat features. These samples were machined into small, uniformly sized 10 mm cubic blocks, polished with sandpaper, and then subjected to argon ion polishing treatment for observation (Winter et al., 2009; Kim et al., 2011). The prepared samples were placed into a Quanta 400 FEG type field emission scanning electron microscope for electron imaging observation. HPMI experiments can quantitatively research the pore size distribution of tight sandstones, as different pressure values tend to correspond to capillary resistance resulting from different pore sizes. In this study, the Auto Pore IV 9500 high-pressure mercury piezometer was used for the test, and the highest pressure was about 200 MPa. Low-temperature nitrogen adsorption (LTNA) experiments can analyze the nanoscale pore size distribution of the tight sandstone. At the same time, it can characterize the comparative area of the rock, and the adsorption and desorption curves can analyze the pore morphology, etc. The LTNA and HPMI tests can comprehensively and accurately characterize nanoscale-microscale pore size distribution. Based on the test data, the specific surface area of the samples was calculated using the BET (Multi-point Brunauer-Emmett-Teller) theoretical model (Brunauer et al., 1938), and the specific surface area of the samples was calculated based on the BJH (Barrett-Joyner-Halenda) (Barrett et al., 1951; He et al., 2021), theoretical models to estimate the pore size distribution of the samples.
4 Petrological characteristics, diagenesis, and diagenetic facies
4.1 Petrological characteristics
According to core observation and thin section identification data statistics, the lithology of the Chang 6 reservoir in the study area is mainly gray, dark gray medium grained, fine medium grained, medium fine grained, and fine-grained lithic feldspar sandstone.
Sandstone particles are well sorted and have a sub angular roundness; The particles are mainly in line contact, followed by point contact and embedded contact. The bonding methods are mostly thin film pore and pore enlarged bonding, and embedded contact can also be seen.
In sandstone composition, the content of detrital components is relatively high, distributed between 73% and 78.5%, with an average of 75.8%. Among them, feldspar has a higher content, followed by quartz, while rock debris has the lowest content. The content of feldspar ranges from 42.5% to 50.5%, with an average of 47.8%; The quartz content ranges from 24.0% to 32.0%, with an average of 27.9%; The main types of rock debris include igneous rock debris and metamorphic rock debris such as volcanic rock, phyllite, quartzite, schist, and slate, and a small amount of sedimentary rock debris can also be seen. The rock debris content ranges from 8.5% to 14.0%, with an average of 10.4%.
The main components of sandstone interstitial materials are clay minerals, carbonate minerals, and siliceous minerals, with locally visible feldspar and pyrite. The content of filler is distributed between 6.5% and 25.5%, with an average content of 15.2%. The average content of clay minerals is about 3.5%, mainly composed of 1.9% chlorite and 1.6% illite. The average content of carbonate minerals is 3.1%, with the highest content of iron calcite at an average of 2.9%, followed by iron dolomite at an average of 0.2%. The average content of silica is 1.1%.
4.2 Diagenesis
As the burial depth continues to deepen, diagenesis continuously modifies the reservoir, resulting in a more complex microporous structure of the reservoir, where dissolution plays a constructive role on the pore throat. In contrast, the pore throat structure suffers some damage due to compaction and cementation. Therefore, diagenetic modification greatly influences the reservoir, and the anatomy and interpretation of diagenesis are the basis for determining the delineation of diagenetic facies and are also conducive to the quantitative analysis of pore fractals. By comprehensively analyzing the cast thin sections with a scanning electron microscope, it is believed that compaction, cementation, and dissolution are dominant among the diagenetic effects experienced by the Chang 6 reservoirs in the western Ordos Basin.
4.2.1 Compaction
The study of cast thin sections found that the reservoir compaction in the study area is typically marked by the rearrangement of rigid components and the deformation of plastic components under the microscope. The plastic minerals such as mica and rock debris are prone to deformation and filling of pores under compaction (Li et al., 2021), which is manifested by the generation of microfractures on the surface of the quartz, feldspar, and other mineral particles and the extrusion of minerals such as black mica to fill the pore spaces (Figures 2A,B). Through microscopic observation and discoveries, the compaction made the clastic components in close contact, which was the main contributing factor to the reduction of intergranular pores and the densification of the reservoir. The direct result of compaction is to increase the rock density and significantly reduce the primary porosity. Overall, the low quartz content, high plasticity component, and fine grain size of sandstone in the reservoir sandstone of the Chang 6 reservoirs lead to the weak compaction resistance of the sandstone. As a result, the plastic deformation of sandstone fragments is particularly prominent in the zone, and the phenomenon of compaction dissolution also occurs at the contact between particles.
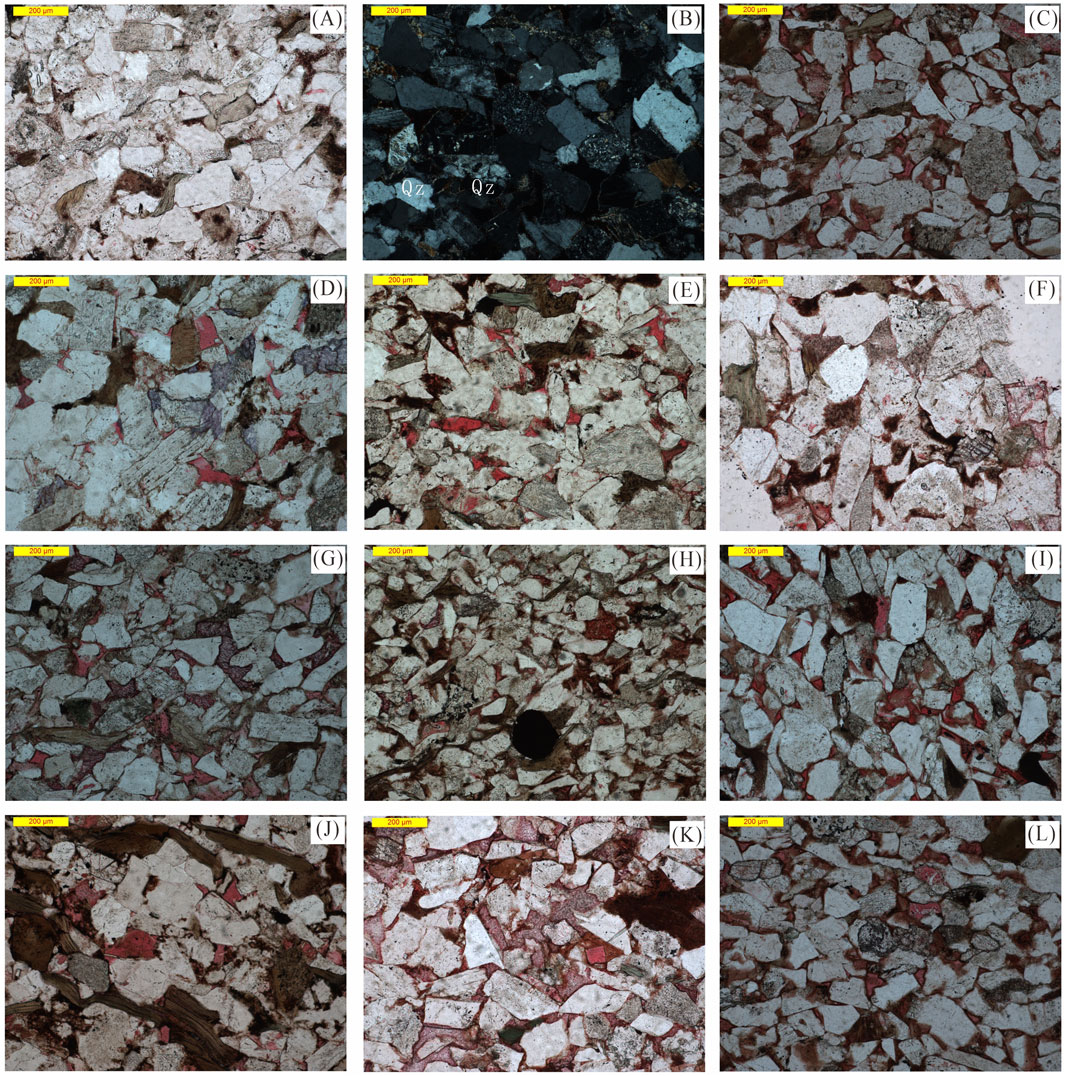
Figure 2. Microscopic photographic characterization of the diagenesis of tight sandstone (A,B) Compacted mosaic-like contact of grains (strong compaction facies, Xin 472 well, 1810.5 m); (C) Poor connectivity of intergranular pores (weak cementation and strong dissolution facies, Xin 561 well, 1823.4 m); (D) Secondary accretion of dolomite clasts and iron dolomite, with development of siliciclastic accretion (carbonate cementation facies, Xin 534 well, 1833.15 m); (E) Siliciciclastic accretion and intergranular pores, feldspar cast film pores (clay mineral cementation facies, Gao 89 well, 1705.12 m); (F) dolomite chips and illite with kaolinite pseudocrystals filling the pores (clay mineral cementation facies, well Xin 264, 1838.83 m); (G) intergranular pores and chlorite film, iron calcite filling the pores in a patchy manner (clay mineral cementation facies, Xin 288 well, 1861.24 m); (H) nodularly distributed pyrite and intergranular pores and feldspar-solution pores (strong compaction facies, Xin 423 well, 1810.4 m); (I) developed intergranular pores and feldspar-solution pores (weak cementation and strong dissolution facies, Xin 325 well, 1782.53 m); (J) feldspar-solution pores and intergranular pores (weak cementation and strong dissolution facies, Xin 346 well, 1862.34 m); (K) feldspar-cast pores and pore-filling ferruginous calcite (strong compaction facies, Gu 19 Well, 1861.49 m); (L) feldspar solution holes and dolomite clasts (weak cementation and strong dissolution facies, Xin 561 Well, 1823.4 m).
4.2.2 Cementation
The cementation is generally developed in the Chang 6 sandstone reservoirs. After continuous subsidence, the sediments react with the groundwater in the pore space and change from loose to solidified. Cementation is mainly affected by mineral alteration and magmatic-hydrothermal fluids, which are key factors in the loss of porosity. The study area is principally illite porphyritic filling with kaolinite pseudocrystals, followed by iron calcite porphyritic filling, and also visible chlorite, pyrite, albite, and other minerals filling, destroying the storage space, and the quartz secondary plus large margins formed in the earlier period have an inhibitory effect on compaction, thus playing a specific role in the protection of the primary pore space (Schmid et al., 2004). Combined with experimental analyses such as thin sections and scanning electron microscopy, types of cementation are mainly siliceous, and authigenic clay minerals, carbonates, and pore-type cementation are predominant. The cementation involves cracks, dissolution joints, and intergranular pores. Filling cementation reduces a large amount of reservoir space and seriously destroys the connectivity of reservoir fractures (Figure 2C), and the physical properties of the reservoir suffer significant damage.
4.2.2.1 Silica cementation
The main siliciclastic cementation mainly shows secondary enlarged, pore-filled cementation of dolomite clasts and iron dolomite. The phenomenon is relatively common in the study area, with a content of about 3%, mainly showing secondary enlarged cementation (Figure 2D) and intergranular pore-filling cementation (Figure 2E). Siliceous cementation is rooted primarily in the series of transformations that clay minerals undergo and the solvation to which silicate minerals are subjected. The size of the growable space also controls it.
4.2.2.2 Authigenic clay mineral cementation
In the study area, authigenic clay mineral species are dominated by chlorite and illite. Through the quantitative analysis of clay mineral X diffraction, it can be seen that chlorite is the highest content of clay mineral cement, 0.5%∼6%, an average of 2.5%; illite cement content of 0.5%∼50%, an average of 1.7%, illite is mainly in the form of filaments or needles (Figure 2F). Chlorite is divided into chlorite ring-edge cementation and chlorite pore-type cementation according to its morphology. Chlorite ring-edge cementation rows grow around quartz particles’ surface, outlining the detrital particles’ original boundaries so that they retain their intact morphology after undergoing dissolution (Grigsby, 2001).
4.2.2.3 Carbonate cementation
Carbonate cementation is more developed through observation, and it has been observed that the primary component of carbonate cementation in the type of microscopic cementation is iron calcite, followed by a small amount of iron dolomite and pyrite, which are primarily pore-type cementation (Figures 2G,H). The content of iron calcite fluctuates over a wide range, from 1% to 14%, but the average value is stable at 3.17%. The content of iron dolomite, on the other hand, is relatively small and ranges from 0% to 1%, with an average value of 0.62%. Carbonate cementation has a significant destructive influence on the reservoir. The increase in calcite collodion content leads directly to a significant decrease in porosity. Part of the calcite precipitation occurs after dissolution, from early precipitation to dissolution to late precipitation, reflecting the change of pore water properties from alkaline to acidic to alkaline (Bechtel et al., 2005).
4.2.3 Dissolution
Flowable fluids in the reservoir enter the sandstone through the pore space and react with their internal soluble particles, thus improving the internal environment of the pore space. Usually, dissolution can improve the reservoir’s physical properties. For example, calcite colluvium in sandstone undergoes dissolution on a particular scale (Rossi et al., 2002). Feldspar is the primary component that has been dissolved, and feldspar dissolution is common and more intense, followed by rock chip dissolution. The storage space consists primarily of intergranular pores, followed by feldspar lysimeters and rock debris lysimeters, with the content of feldspar lysimeters being stable, ranging from 0.2% to 1.1%, with an average value of 0.68%. In contrast, the content of feldspar pores is relatively low, ranging from 0% to 0.2%. The feldspar dissolution can occur both at the edge of the grains and inside the grains. The dissolution of feldspar primarily occurs at the detrital surface. Most of the feldspar intergranular dissolution is seen, with the development of intergranular holes (Figures 2I,J). Few cast holes (Figure 2K) and the feldspar grains encountered with dissolution can be seen as distinctly port-shaped at their edges under the microscope. The dissolution of feldspar can be seen in its interior as a honeycomb or sieve-like phenomenon at the detrital surface (Figure 2L). The dissolution of rock fragments is similar to that of feldspars, with the edges ported and the interior dissolved to form intergranular pores. Dissolution can increase reservoir porosity, improve physical properties, and provide favorable space for tight sandstone reservoirs.
4.3 Diagnostic facies
The effect of various diagenetic facies on the reservoir is related to the type and content of diagenetic minerals, pore type, facies porosity, pore structure, etc. Therefore, in evaluating and predicting reservoirs, delineating the kind of diagenetic facies and the quantitative study of the pore evolution characteristics of various diagenetic facies is one of its main research contents. The classification standard of diagenetic facies types has not been unified (Lai et al., 2020; Wu et al., 2000; Wang et al., 2017a). In this paper, we utilize the petrological characteristics and diagenetic types of the oil-bearing systems in the Chang 6, combined with the casting of thin sections, scanning electron microscope to research the pore evolution characteristics of various kinds of diagenetic facies and determine the destination layer. According to the petrological characteristics and type of diagenesis of the target layer in the study area, combined with the data on diagenetic effect, physical characteristics, and the relevant research results of the previous researchers (Wang et al., 2017b), the diagenetic facies of the target layer are delineated into four categories, which are strong compaction facies, carbonate cementation facies, clay mineral cementation facies and weak cementation and strong dissolution facies.
4.3.1 Strong compaction facies
The permeability ranges from 0.146 × 10⁻³ μm2 to 0.178 × 10⁻³ μm2, with low permeability and an average total facies porosity of 1.73%. The diagenetic facies are very fine-fine-grained lithic arkose and mica-rich splendid lithic arkose (Figure 3), with fine grains in the sediments, resulting in inferior compaction resistance of the rocks and severe destruction of the pores by mechanical compaction, which makes it the worst type of diagenetic phase in the study area in terms of physical properties.
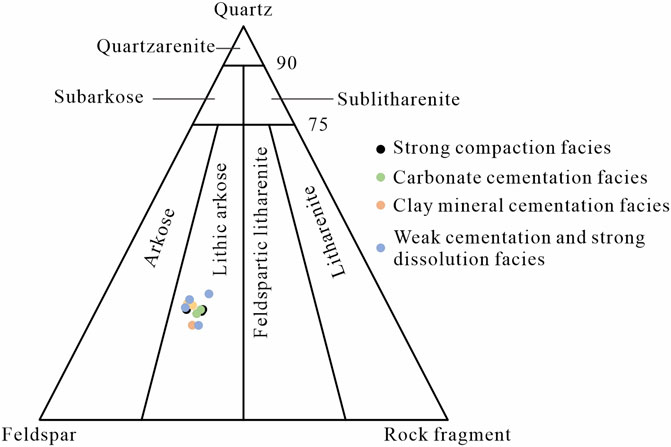
Figure 3. Sandstone classification triangle diagrams for different diagenetic facies.
4.3.2 Carbonate cementation facies
The permeability ranges from 0.253 × 10⁻³ μm2 to 1.628 × 10⁻³ μm2, with low permeability and an average total facies porosity of 3.63%. The diagenetic facies are very fine-fine-grained lithic arkose and mica-rich very fine-fine-grained lithic arkose (Figure 3), and the sediments’ chlorite film and siliceous content are low. The prominent feature of this diagenetic facies is the high content of iron calcite collodion, which is as high as 14%, and the content of iron dolomite, which is also high, and the formation of a large number of carbonate collodion inhibits compaction, and at the same time, makes the pore seepage condition of the reservoir extremely poor. These diagenetic facies easily constitute tight non-reservoir space, which is unfavorable to oil and gas aggregation and has no production capacity. This diagenetic facies is a diagenetic facies with poor physical properties in the study area.
4.3.3 Clay mineral cementation facies
The permeability ranges from 0.733 × 10⁻³ μm2 to 0.898 × 10⁻³ μm2, porosity ranges from 10.24% to 10.43%, and total facies porosity averages 4.01%. This diagenetic facies is very fine-fine-grained lithic arkose and mica-rich very fine-fine grained lithic arkose (Figure 3), with high illite and chlorite contents in the sediments, illite porosity-filled pores in patches and low content of both calcite collodion and siliceous collodion. The compaction of these diagenetic facies is relatively strong, further destroying the primary pore structure and making it difficult for acidic fluids to enter. The reservoir pores are almost filled by a clay heterogeneous base, which can easily constitute a relatively favorable reservoir space. This type of diagenetic facies is significant in oil and gas, but the production capacity is relatively poor.
4.3.4 Weak cementation and strong dissolution facies
The permeability ranges from 0.750 × 10⁻³ μm2 to 1.239 × 10⁻³ μm2, porosity ranges from 13.05% to 15.53%, and total facies porosity averages 4.5%. The diagenetic facies is very fine-fine-grained lithic arkose and mica-rich very fine-fine-grained lithic arkose (Figure 3), with low calcite cement and silica content in the sediments and high chlorite film content, averaging up to 3%. The feldspathic pores of this diagenetic facies account for 3.2%, effectively improving the physical properties of the reservoir. In contrast, most reservoir pores are wrapped by chlorite membranes, which can enhance the sandstone’s compaction resistance and further hinder the regrowth of quartz particles into the attachment body of authigenic quartz (Dou et al., 2017). Therefore, the pores in the reservoirs with chlorite ring margins are easily preserved, which is the dominant type of diagenetic facies in the study area.
5 Pore types and quantitative characterization
5.1 Pore types
Statistics of 13 cast thin sections samples of the Yanchang Formation were analyzed to show that in the reservoir structure of each formation group, intergranular pores and dissolution pores constitute the main categories of pores, of which the dissolution pores are dominated by feldspar dissolution pores, followed by rock debris dissolution pores. Observations for the 13 cores revealed a wide range of fluctuations in their total face porosity, ranging from a low of 0.9% to a high of 4.8%.
5.1.1 Intergranular pores
It was observed that the degree of development of intergranular pores is more significant. Multiple factors, such as the shape of the mineral particles, the mode of mutual contact between the particles, and the intensity of compaction, strongly influence the diversity of their morphology. The morphology of the intergranular pores is very rich, including linear, angular, and regular geometric cubic shapes.
Strong compaction facies samples are compacted out (Figure 4A), the rock filler is mainly seen as intergranularly filled bladed chlorite, authigenic minerals are seen as authigenic quartz and calcite, and intergranularly filled calcite cement is seen (Figure 4B), the pore space is underdeveloped and poorly connected; The carbonate cementation facies is affected by chemical precipitation in the alkali lake context, and the intergranular pores between rock particles are filled mainly by carbonates, further destroying the primary pore structure and making it difficult for acidic fluids to enter; Illite patchy filled pores in the clay mineral cementation facies, clay heterogeneous base deformed and filled intergranular volume under compaction, residual intergranular pores can be observed to exist in some samples (Figures 4C,D); Weak cementation and strong dissolution facies chlorite film content is higher, face porosity is as high as 3.4%, and residual intergranular pores in the reservoirs with chlorite annular rim development are easy to be preserved with better connectivity.
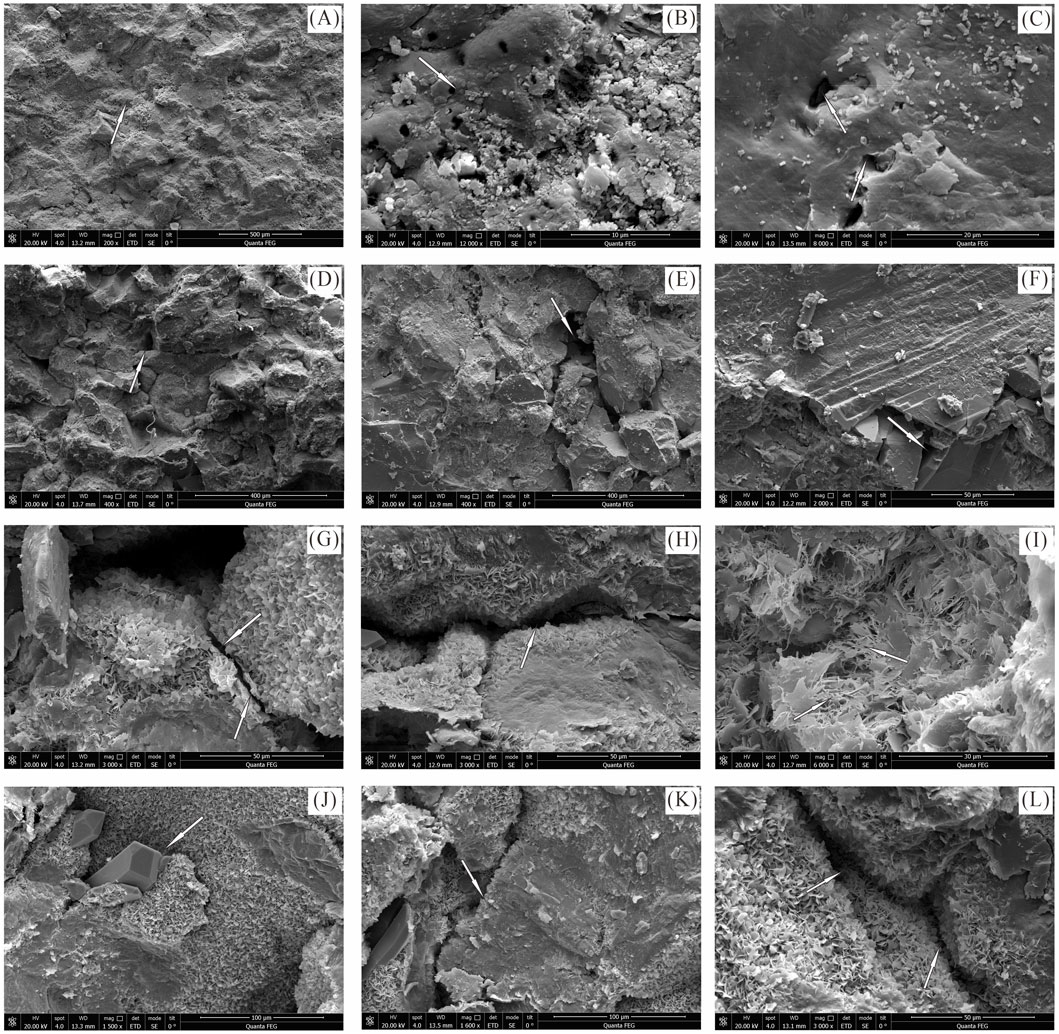
Figure 4. Pore characteristics of samples from different diagenetic facies (A) Intergranular pores, strongly compacted impact, compacted out (strong compaction facies, xin 472 well, 1810.5 m); (B) Intergranular pores, intergranular-filled calcite cement is seen (strong compaction facies, xin 423 well, 1810.4 m); (C) Intergranular pores, some samples can be observed with residual intergranular pores present (carbonate cementation facies, Wu 501 well, 1,648.1 m); (D) intergranular pores, residual intergranular pores are observed to exist in some samples (weakly cemented strongly dissolved phase, new 561 well, 1823.4 m); (E) intergranular dissolved pores with irregular shape and apparent marginal dissolution (carbonate cementation facies, Wu 501 well, 1,648.1 m); (F) irregular dissolved pores with apparent marginal dissolution (carbonate cementation facies, xin 534 well, 1833.15 m); (G) dissolution pores, dissolution pores are mostly intragranular lath-like dissolution pores (clay mineral cementation facies, xin 264 wells, 1838.83 m); (H) dissolution pores, dissolution pores are mostly intragranular lath-like dissolution pores (clay mineral cementation facies, xin 288 wells, 1861.24 m); (I) dissolution pores are mainly in the form of honeycomb (clay mineral cementation facies, xin 325 wells, 1782.53 m); (J) intergranular spreading dissolution pores and feldspar cast pores (clay mineral cementation facies, xin 264 wells, 1838.83 m); (K) strip pores formed by dissolution of feldspar with the edge of the rock debris (weak cementation and strong dissolution facies, xin 348 wells, 1866 m); (L) strip pores formed by dissolution of feldspar with the edge of the rock debris (weak cementation and strong dissolution facies, xin 346 wells, 1862.34 m).
5.1.2 Dissolution pores
The facies transition process of minerals causes the dissolution of pores under the combined effect of temperature and pressure changes and fluids of varying chemical properties. This endows siltstone with a unique pore system and profoundly affects its storage capacity. According to the specific distribution location of the dissolution pores in the samples, they can be further subdivided into intergranular and intragranular dissolution pores. Significant developmental features of dissolution porosity are observed in all the samples of this study, which reflect the inhomogeneity and complexity of fluid action during diagenesis. Feldspar, quartz, mica, and filler are perspectives in cast thin sections and scanning electron microscopy. The development of secondary growth margins of Fe dolomite is visible in the dolomite clasts.
Strong compaction facies samples are compacted, acidic fluid is complex to enter, dissolution is not developed and poor connectivity; The intergranular pores of the carbonate cementation facies rocks are filled mainly by carbonates, and intergranular dissolution pores can be observed in some samples, with irregular shapes and apparent dissolution at the edges (Figures 4E,F); The dissolution pores in the clay mineral cementation facies are mostly intragranular lath-like dissolution pores (Figures 4G,H) or honeycomb-like (Figure 4I) or intergranular spreading dissolution pores and feldspar cast pores (Figure 4J), which are more developed; Weak cementation and strong dissolution facies intragranular dissolution holes to feldspar and rock debris intragranular dissolution holes formed in the secondary pore is most developed, feldspar dissolution holes can be seen a Chang the joints dissolution, as well as due to the formation of substantial dissolution of honeycomb pore, can also be seen a Chang the edges of the dissolution of the feldspar and rock debris formed by the strips of pore (Figures 4K,L), the remaining intergranular pore in the reservoir is easy to be preserved.
5.2 Quantitative characterization of pores
Typical samples of sandstones from the Yanchang Formation were selected for HPMI and Low-temperature nitrogen adsorption tests. The combination of HPMI and LTNA tests can provide a more comprehensive and accurate characterization of the nanoscale-microscale pore size distribution of tight sandstones.
5.2.1 Pore morphology characteristics
The pore space mainly provides the storage space for oil and gas in rocks. Therefore, an in-depth analysis of pore structure is critical. We usually study micrometer-scale pore morphology in tight sandstones by cast thin-sections observation and scanning electron microscopy analysis, which has already been mentioned. However, we need to quantitatively analyze nanoscale pores with the help of more delicate LTNA experiments. The adsorption line depicts the curvilinear trend of adsorption as a function of relative pressure under constant temperature conditions; the different morphologies of isothermal adsorption lines provide a unique perspective for in-depth analysis of pore morphology and distribution characteristics, etc. Based on the experimental isothermal-adsorption data, we plotted each rock sample’s low-temperature liquid nitrogen adsorption and desorption curves and carried out the rock-core pore type identification.
Figure 5 shows that the adsorption curves of the samples are in an inverted S-shape. However, there are some differences in the morphology of the samples, but the overall difference is not significant, and there is good consistency. The curves of this study area’s 13 typical sandstone samples show varying degrees of “hysteresis,” similar to Type II adsorption isotherms according to the latest IUPAC classification (Thommes et al., 2015; Sing, 1985).
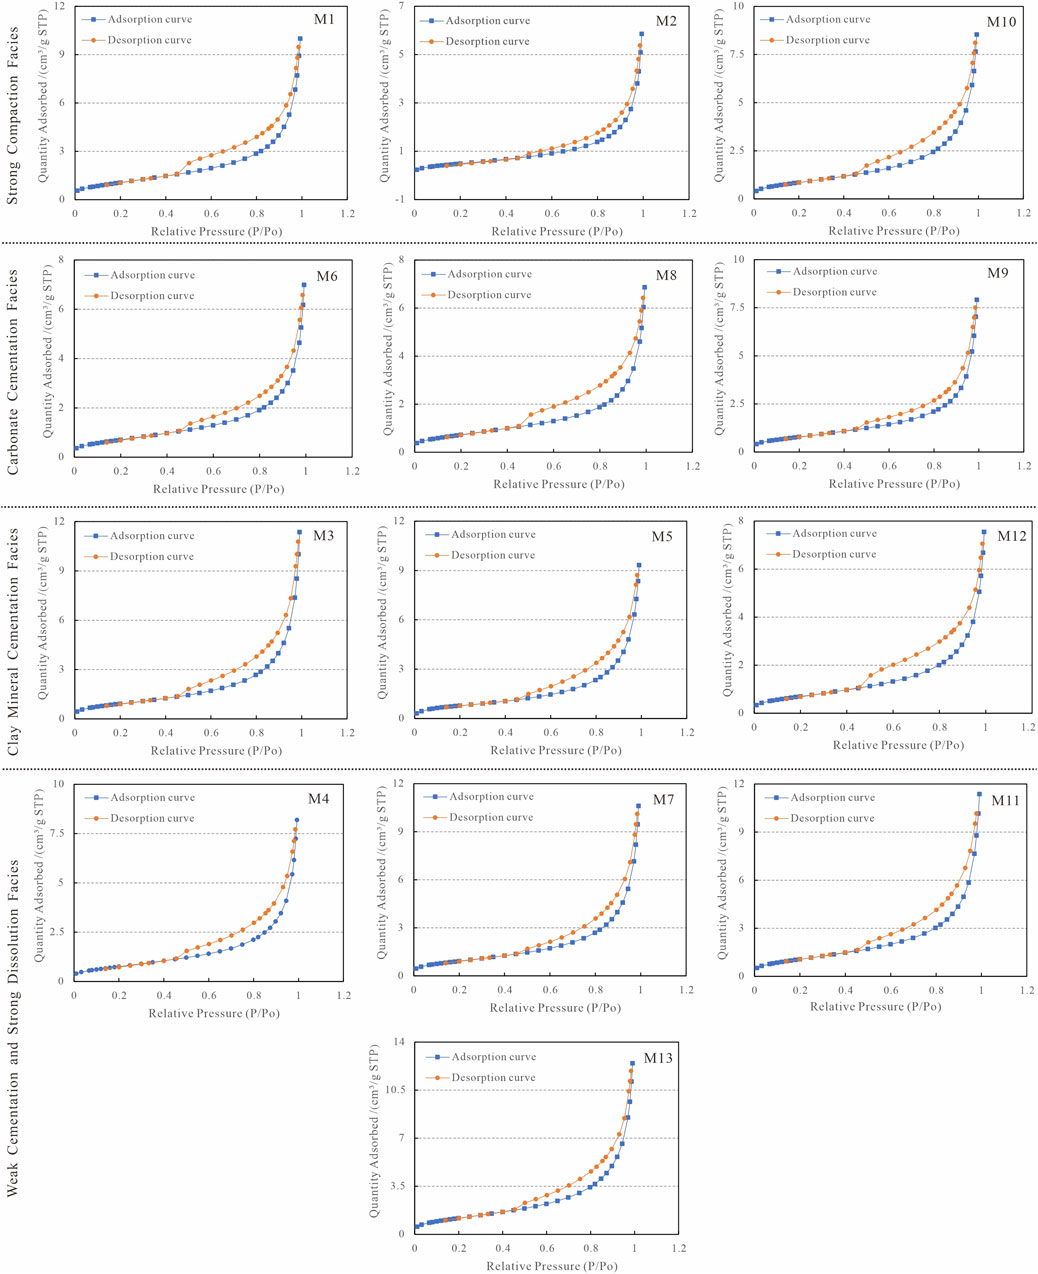
Figure 5. Adsorption-desorption curves for different diagenetic facies of tight sandstone.
The adsorption return range of the strong compaction facies is of small scale, and the adsorption curve is closer to the desorption curve, reflecting poor interporosity and indicating that the pores are dominated by impermeable pores closed at one end; the adsorption return range of the carbonate cementation facies as a whole is slightly larger than that of the strong compaction facies, reflecting that the pores in this phase are dominated by impermeable pores closed at one end; The range of the adsorption return line of the clay mineral cementation facies is significantly wider than that of the strong compaction facies and the carbonate cementation facies samples, which is more similar to the H3 type in the IUPAC classification, and the desorption curves all show a small inflection point at P/P0 = 0.5, reflecting the presence of a small number of open permeable pores; the weak cementation and strong dissolution facies has a similar adsorption return line to the clay mineral cementation facies, but the desorption curves have obvious inflection points at P/P0 = 0.5, reflecting that its pore type is identical to the clay mineral cementation facies, but the development of the pores is more complex, and the impermeable pores are dominantly closed at one end in the low-pressure phase, and the ink-hole and open permeable pores are dominantly closed at the high pressure phase.
5.2.2 Pore diameter distribution characteristics
An essential aspect of pore research in tight sandstone reservoirs is pore size distribution, which is directly related to porosity and fluid permeability properties. Among the methods for characterizing pore size, there are several to choose from; the distribution curve of differential pore volume (dV/dD) versus pore diameter (D) has a significant advantage in demonstrating nanoscale pores. In contrast, the distribution curve of logarithmic differential pore volume (dV/dlogD) versus pore diameter (D) performs even better in demonstrating larger pores. In the study, considering the wide range of pore distribution in tight sandstone, from nano-scale pores to micrometer-scale pores, the logarithmic differential pore volume (dV/dlogD) versus pore diameter (D) carefully analyze the characteristics of their pore size distribution.
The pore structure of the cores was characterized in detail with the help of LTNA and HPMI tests. Combining the pore size distribution to accurately characterize the full-diameter pore size distribution data obtained from these two tests is necessary. Ensuring that the two methods complement each other and that the data are accurately and seamlessly connected is essential. As mentioned before, when the pressure of HPMI tests is too high, it will destroy the rock skeleton and lead to changes in the pore space, which will cause significant errors in the measurement results, and the LTNA tests have greater accuracy for fewer pore measurements. There is a shortage of nitrogen intake as pore sizes get more prominent, which leads to small pore measurements (Job et al., 2006a; Job et al., 2006b; Li et al., 2015). Therefore, in this study, the pore size of less than 30 nm was characterized by LTNA tests (calculated based on the BJH method), while HPMI tests characterized the pore size larger than 30 nm in tight sandstone. The pore size data obtained from high-pressure mercury pressure experiments and low-temperature nitrogen adsorption experiments were skillfully spliced at 30 nm to achieve this goal. In this way, we have accurately and exhaustively characterized the pore size distribution of the tight sandstones in the region, and the full-diameter pore size distributions of the different types of samples are clearly shown in Figure 5.
DFT model pore size distribution interpretation results indicate that the pore sizes of tight sandstones in Chang 6 reservoirs are primarily distributed in 1.20 ∼ 22000 nm. When the pore size is located at 10∼1,000 nm, the samples from the various diagenetic phases do not exhibit significant variability in pore size distribution. Some of the samples show “double peaks,” and some of the samples show “triple peaks” The tight sandstone overall “multi-peak” pattern, with different pore sizes in different diagenetic facies samples and different sizes of pores, contributes to the total pore volume of the tight reservoir, indicating that the pore size distribution of the sandstone of the Yanchang Formation of the Chang 6 reservoirs is more complicated and has no apparent regularity.
The pore size less than 1,000 nm dominates in the strong compaction facies samples, and when the pore diameter exceeds 1,000 nm, the Changitudinal coordinates are all close to 0, and basically, there is no peak (Figure 6A), which indicates that in this interval, the strong compaction facies seldom has a pore size distribution; meanwhile, its pore size distribution curve with the transverse-axis envelope area is the smallest among the four different diagenetic facies, which also means that the minimum total porosity of the sample.
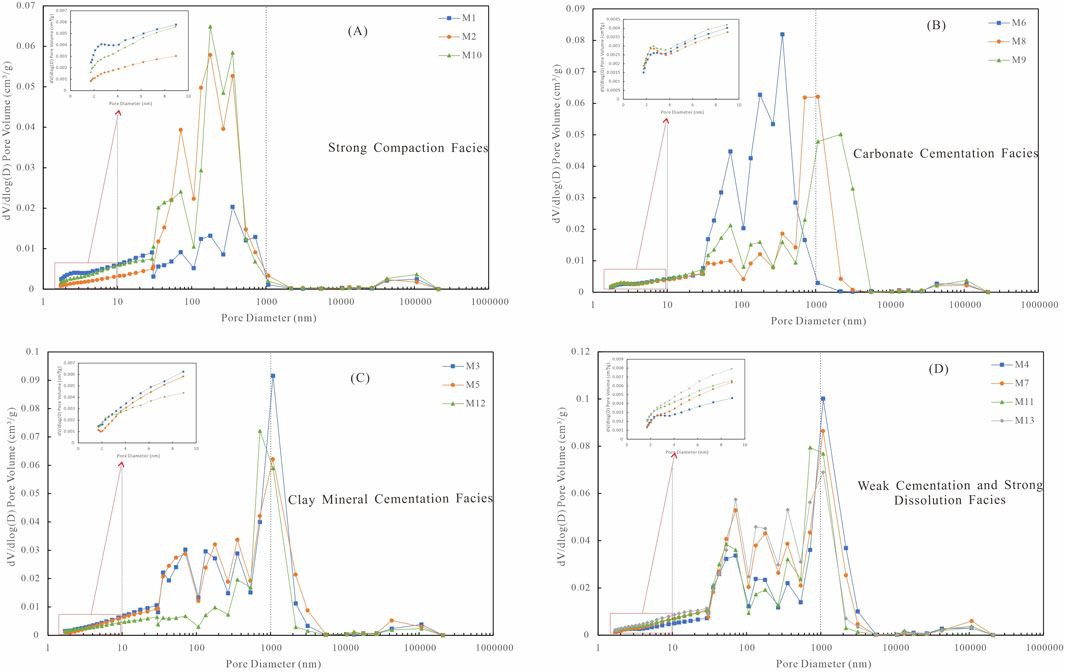
Figure 6. Pore size distribution diagram (A) Pore size distribution diagram of strong compaction facies; (B) Pore size distribution diagram of carbonate cementation facies; (C) Pore size distribution diagram of clay mineral cementation facies; (D) Pore size distribution diagram of weak cementation and strong dissolution facies.
Carbonate cementation facies in the pore size less than 10 nm all appear to peak, and the peak is about 2∼3 nm (Figure 6B). Weak cementation and strong dissolution facies also appear in this feature. Relatively speaking, the carbonate cementation facies peak is higher, and more samples with significant peaks, indicating that the permeability of the carbonate cementation facies with lower permeability in the region of the probability of pore occurrence is higher, and when the pore diameter exceeds 5,000 nm, the vertical coordinates are close to 0. Basically, there are no peaks, indicating that in this interval, the carbonate cementation facies have little pore distribution, suggesting that the pore volume consists mainly of 300 nm pores, followed by 50–350 nm mesopores.
When the pore size of clay mineral cementation facies is less than 10 nm, there is no peak; at 10∼1,000 nm, most of the samples show “four peaks,” and different sizes of pores contribute to the total pore volume of the tight reservoir; at around 1,000 nm, the peaks of all the samples reach the highest (Figure 6C), which indicates that the probability of pore space is higher at 1,000 nm, the largest contribution to the total pore volume of the reservoir; at a pore size greater than 5,000 nm, the vertical coordinates are close to 0, and there is no peak, which indicates that the clay mineral cementation facies has very few pore distributions in this interval. It suggests that the pore volume of this kind of sandstone mainly consists of 1,000 nm pores, followed by 50∼350 nm mesopores.
When the pore diameter of the weak cementation and strong dissolution facies is less than 10 nm, some samples show peaks at 2∼3 nm; at 10∼1,000 nm, the samples show “three peaks,” and different sizes of pores contribute to the total pore volume of the tight reservoir; around 1,500 nm, the samples show peaks and the peaks reach the highest (Figure 6D), indicating that in this pore area, the probability of the occurrence of pores is higher, and the samples have the largest number of pores, the largest contribution to the total pore volume of the reservoir. At pore diameters larger than 5,000 nm, the vertical coordinate is close to 0, and there is no peak, which indicates that in this interval, there are very few pores in the weak cementation and strong dissolution facies. The pore volume composition of such sandstones is dominated by pores of approximately 1,500 nm pore size, while mesopores with pore sizes in the range of 70–400 nm occupy a secondary position.
6 Pore fractal characteristics and influencing factors
6.1 Pore fractal characteristics
The microscopic pore structures of tight reservoirs have been challenging to describe in detail through conventional physical parameters, which poses a challenge to hydrocarbon exploration. The introduction of fractal theory can quantitatively characterize reservoirs’ microphysical properties and pore throat characteristics in many ways and provide a strong rationale for the subsequent hydrocarbon exploration. Therefore, since the creation of fractal geometry, many experts have used different techniques to study the fractal phenomenon, which revealed the geometrically intrinsic quality of the regular combination of the pore structure in the three-dimensional space (Hecht, 2000; Krohn, 1988; Thompson et al., 1987), which makes the fractal dimension a vital parameter to characterize the regular structure and combination of microscopic pores quantitatively.
Therefore, the fractal dimension is used to calculate or characterize some physical parameters and quantitatively describe the complexity of the pore structure. In three-dimensional Euclidean space, the fractal dimension is a fractal value between 2 and 3. When the fractal dimension tends to be close to 3, it means that the pore structure of the sandstone is extremely complex, the surface roughness increases significantly, and the inhomogeneity is particularly prominent; on the other hand, if the fractal dimension is close to 2, it indicates that the surface of the pore wall of the rock is relatively smooth, and the homogeneity of the reservoir is also enhanced accordingly (Giri et al., 2012; Mendhe et al., 2017; Yao et al., 2010). Different scholars have proposed various methods and models to calculate the fractal dimension, including image analysis, thermal calculation method (Jaroniec, 1995), HPMI method, FHH model (Rouquerol et al., 1994), BET fractal model (Dathe et al., 2001), etc. Due to the wide distribution of pore sizes in tight sandstones, different techniques are chosen for different pore size ranges for fractal dimension calculation.
6.1.1 Fractal dimensions of pores less than 30 nm
The low-temperature nitrogen adsorption technique is suitable for quantitatively characterizing shale mesopores (pore size of 2∼50 nm). Therefore, for pores less than 30 nm, the fractal dimension calculation applies the fractal FHH model with nitrogen adsorption data. Currently, in the study of low-temperature nitrogen adsorption experiments, the FHH model is the most widely used, and the coefficient K is calculated from the relative pressure of gas adsorption and the amount of adsorption (Avnir and Jaroniec, 1989), which is modeled as:
In this equation, V represents the volume of gas that can be adsorbed per gram of adsorbent, cm3/g; P stands for the pressure at which the adsorption reaches equilibrium, MPa; P0 is the vapor pressure of the adsorbed gas in the saturated state, Mpa; K is a constant closely related to the adsorption mechanism; and C is another constant.
The fractal dimension (D) is calculated as:
According to Equations 1, 2, the parameter K is obtained by fitting the slope of the straight line obtained by fitting LnV to Ln [Ln (p0/p)], which can then be utilized for fractal dimension calculation (Table 2).
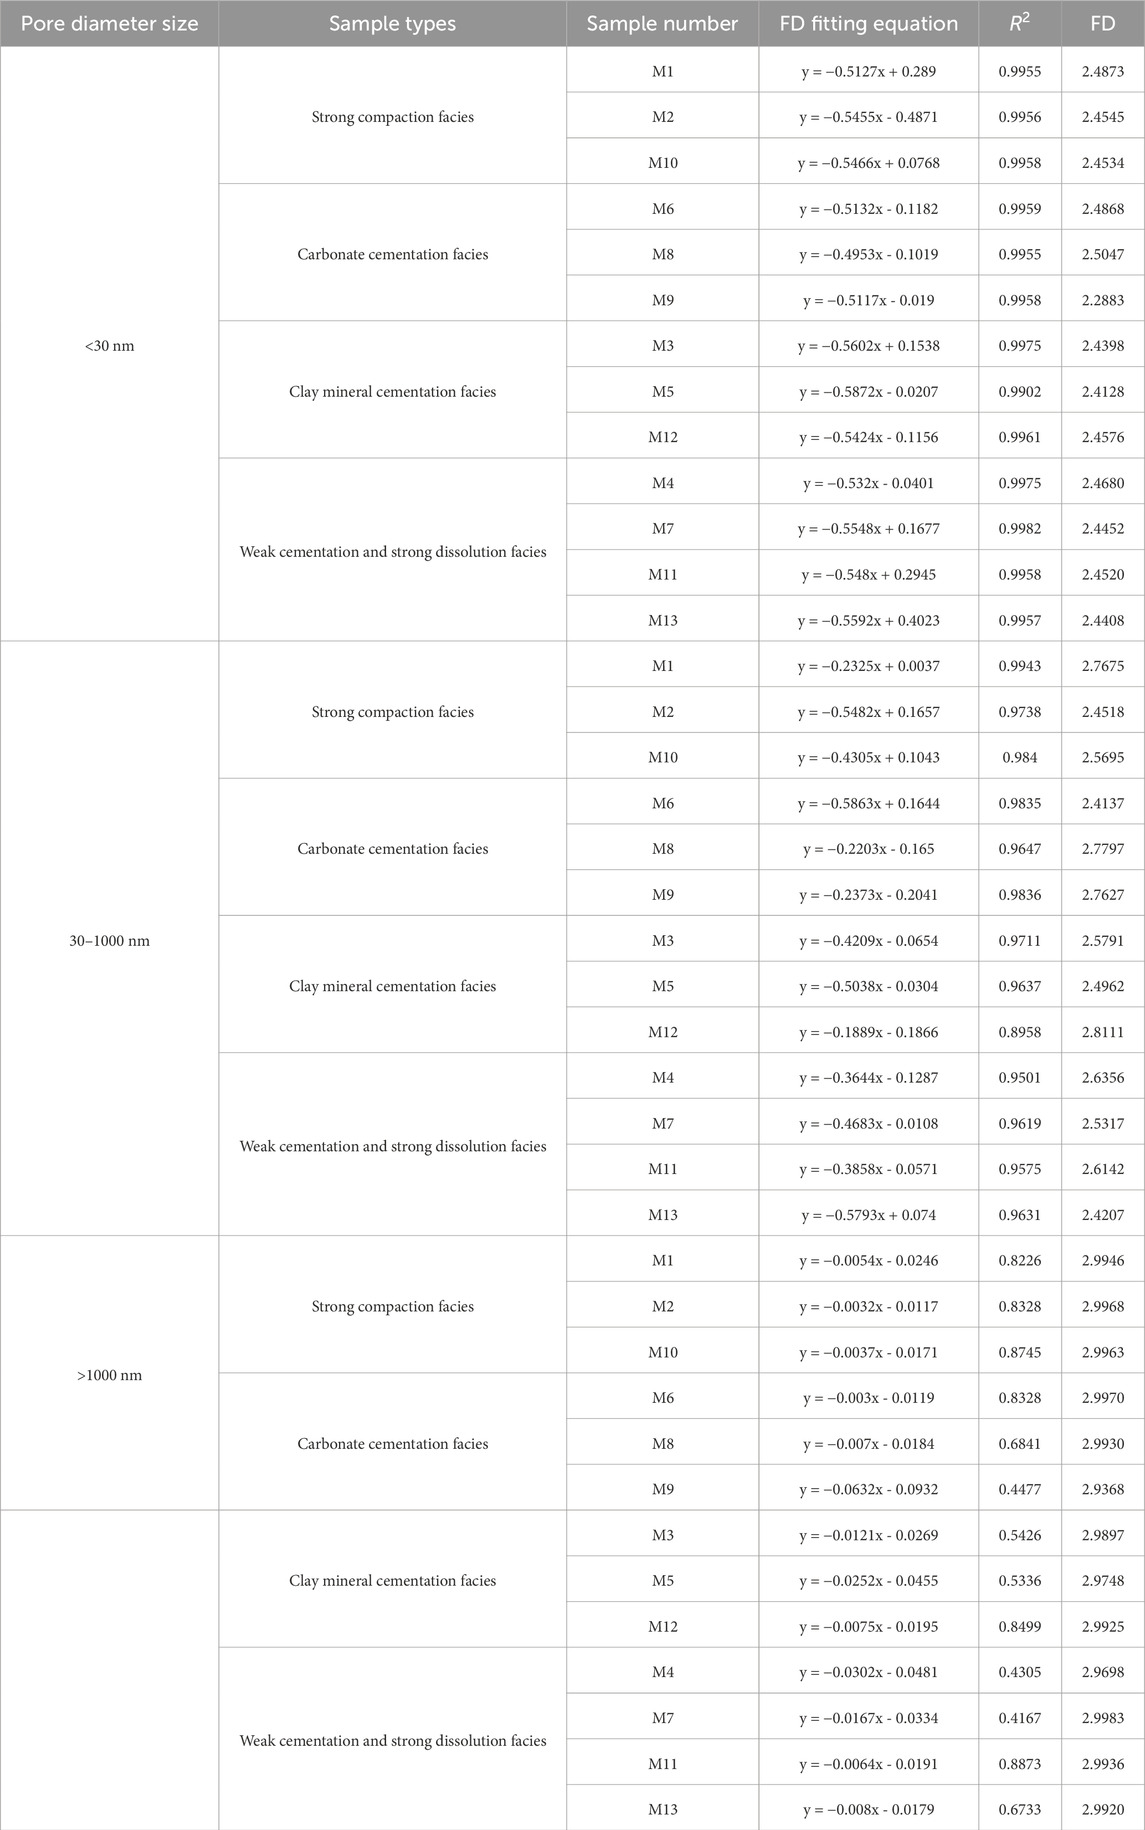
Table 2. Statistics of the fractal dimension (FD) of tight sandstone.
The fractal dimension values and various characteristic parameters of the pore structure of rocks were calculated based on the data from different sandstone samples (Table 2). The calculation results in Table 2 show that the LnV of the two types of samples has a significant linear relationship with Ln [Ln (p0/p)]. The correlation coefficients R2 of the fitting curves are all greater than 0.9900, indicating an extremely good correlation and a high degree of fitting. It can be seen that the pores smaller than 30 nm in tight sandstone have significant fractal characteristics.
Overall, the distribution range of the fractal dimensions of the pore structures of the 13 samples in the study area is 2.2883–2.5047 (Figure 7). Among them, the fractal dimensions of the strong compaction facies samples range from 2.4534 to 2.4873, with an average of 2.4651. The fractal dimensions of the carbonate cementation facies range from 2.2883 to 2.5047, with an average of 2.4266. The fractal dimensions of the clay mineral cementation facies samples range from 2.4128 to 2.4576, with an average of 2.4367. The fractal dimensions of the weak cementation and strong dissolution facies samples range from 2.4408 to 2.468, with an average of 2.4533. Thus, the strong compaction facies samples with lower permeability have a larger overall fractal dimension of pores, with complex pore morphology, rougher pore throat surfaces, and higher irregularity. In contrast, the carbonate cementation facies samples with higher permeability have a slightly smaller fractal dimension of pores of less than 30 nm, with lower irregularity of pore throats.
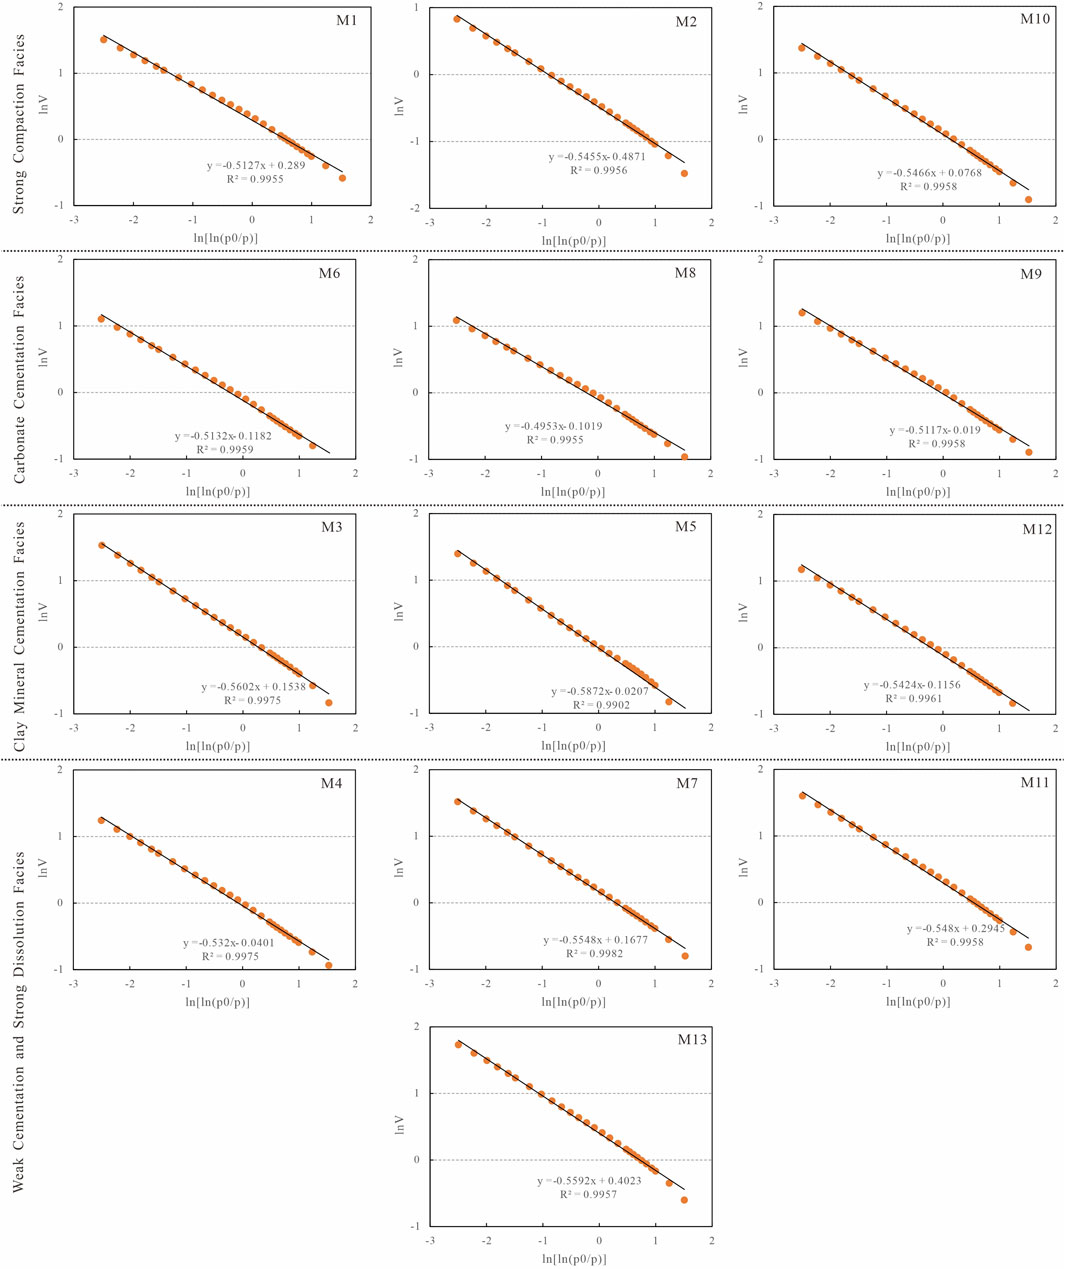
Figure 7. Fractal characterization of pores less than 30 nm in four different types of diagenetic facies.
6.1.2 Fractal dimensions of pores in the range of 30–1,000 nm
The pore throats detected by the HPMI tests have a wide range and high precision, so we typically use HPMI to accurately calculate fractal dimensions greater than 30 nm. Water and mercury saturation can be calculated in the fractal dimension (Wang et al., 2020; Li et al., 2018). In this study, the water saturation method was used to fit the fractal dimension. Based on the fractal theory, the following functional relationship exists between water saturation and pore radius: (Chen et al., 2024):
In this equation, pain represents the capillary pressure corresponding to the maximum pore size of the reservoir rock; Sw stands for the fluid saturation of the wetting facies of the rock when the capillary pressure reaches a particular value of pc; D is the fractal dimension. Taking logarithms at both ends of Equation 3 yields:
From Equation 4, Sw and pc are linear in double logarithmic coordinates, so the regression fitting method yields accurate fractal dimension and the minimum capillary pressure (Table 2).
Fractal characterization of pores in the 30–1,000 nm range was carried out using HPMI test data of 13 samples from this study. Figure 8 displays the results that the lgSw and lgpc fit is linear, most of the correlation coefficients R2 were greater than 0.95, and only one sample had R2 of 0.8958, which demonstrates that the pores of the tight sandstones of this study in the range of 30–1,000 nm exhibit favorable fractal characteristics. The fractal dimension of 30–1,000 nm pores of the vast majority of samples is in the range of 2.4137∼2.8111, of which four samples have a value of less than 2.500, and the rest of them are all greater than 2.5000, and the overall fractal dimension is larger, which indicates that this study is complex, poorly sorted, and with strong non-homogeneity of the reservoir. Among them, the average fractal dimension of the strong compaction facies is 2.5963, the average of the carbonate cementation facies is 2.6288, the average of the clay mineral cementation facies is 2.6520, and the average of the weak cementation and strong dissolution facies is 2.5506, which shows that the overall pore morphology of the 30–1,000 nm pore space is more complex and the degree of irregularity is high.
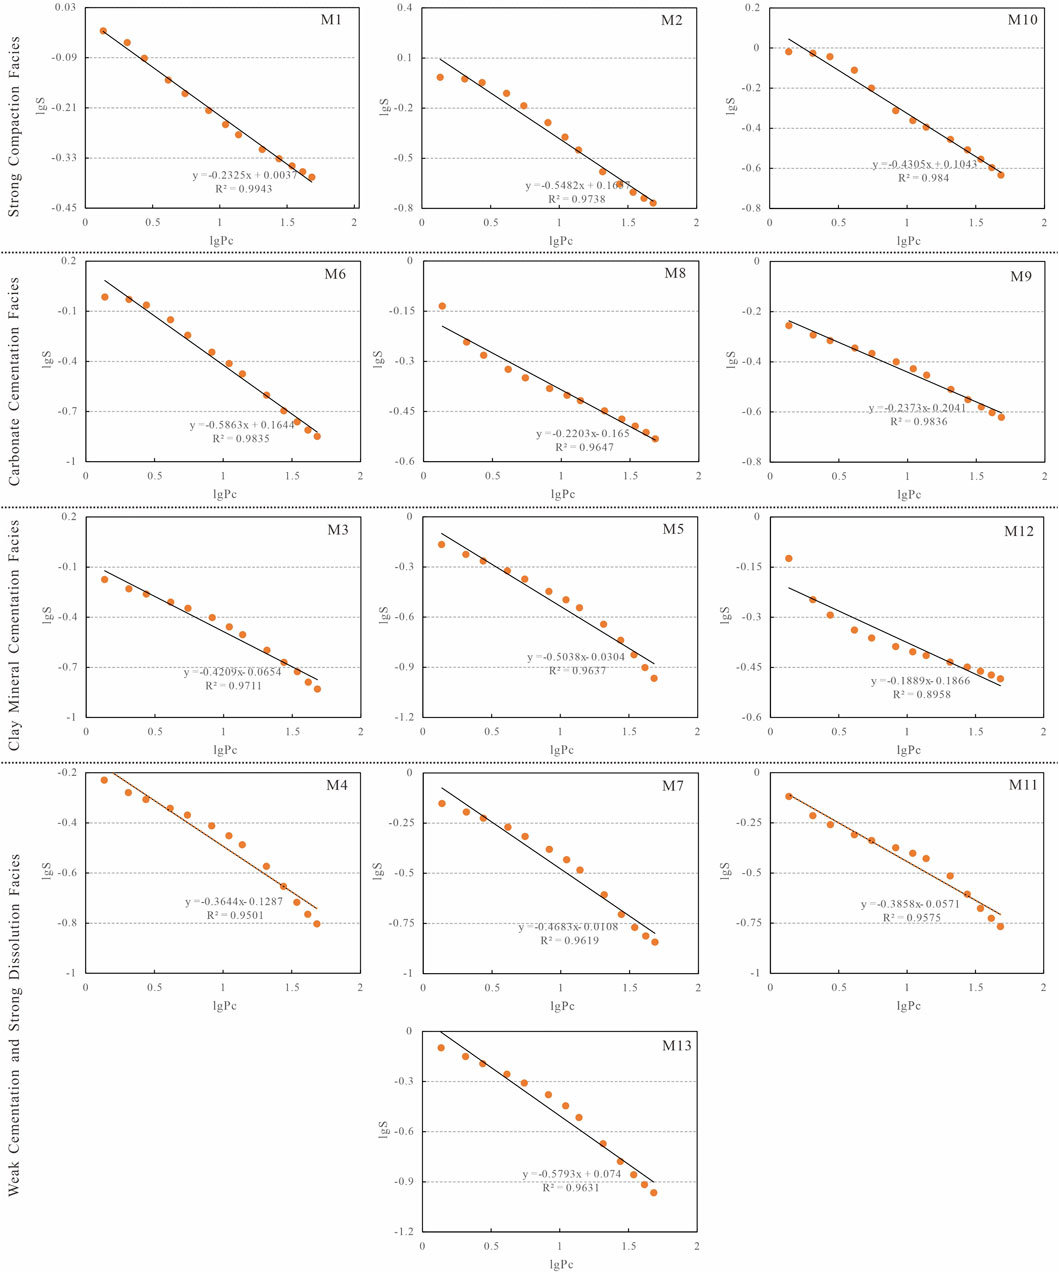
Figure 8. Fractal characterization of pores at 30–1,000 nm in four different types of diagenetic facies.
6.1.3 Fractal dimensions of pores larger than 1,000 nm
The fractal dimensions were fitted using HPMI test data, using the water saturation method of choice, calculated in the same way as in the previous Section (5.1.2).
The calculation results of this study’s 13 samples show a less apparent linear correlation, with R2 ranging from 0.4167 to 0.8873 (Table 2). The fractal dimension values are clustered in a range very close to 3, specifically 2.9368 to 2.9983, and the mean is even higher at 2.9866. This indicates that this study’s Chang 6 reservoir space is complex, poorly sorted, and has strong reservoir inhomogeneity (Figure 9).
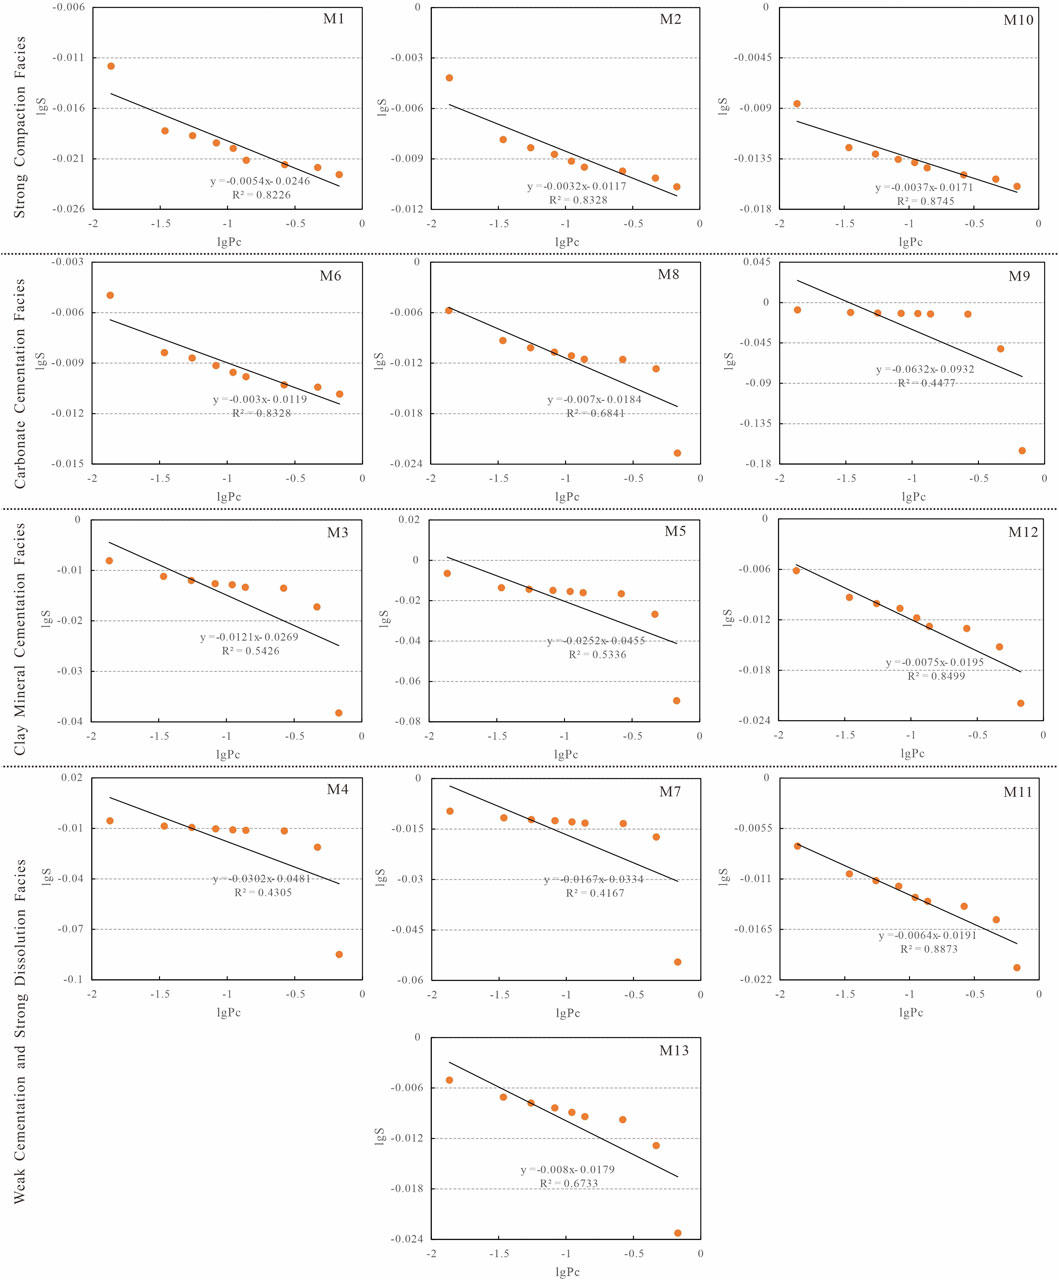
Figure 9. Fractal characterization of pores larger than 1,000 nm in four different types of diagenetic facies.
6.1.4 Comprehensive discussion of fractal features
Representative core samples were selected and linearly fitted to the fractal dimensions of pores smaller than 30 nm, 30–1,000 nm, and greater than 1,000 nm based on the FHH model and the HPMI tests, respectively.
The statistical results are shown in Table 3. The pores smaller than 30 nm and in the 30–1,000 nm range of the tight sandstone conform to the fractal characteristics, and the correlation of the pores larger than 1,000 nm is not very good, which concludes that the microscopic structure of the tight sandstone reservoir is multifractal. Different pore size ranges tend to exhibit varying fractal dimensions.
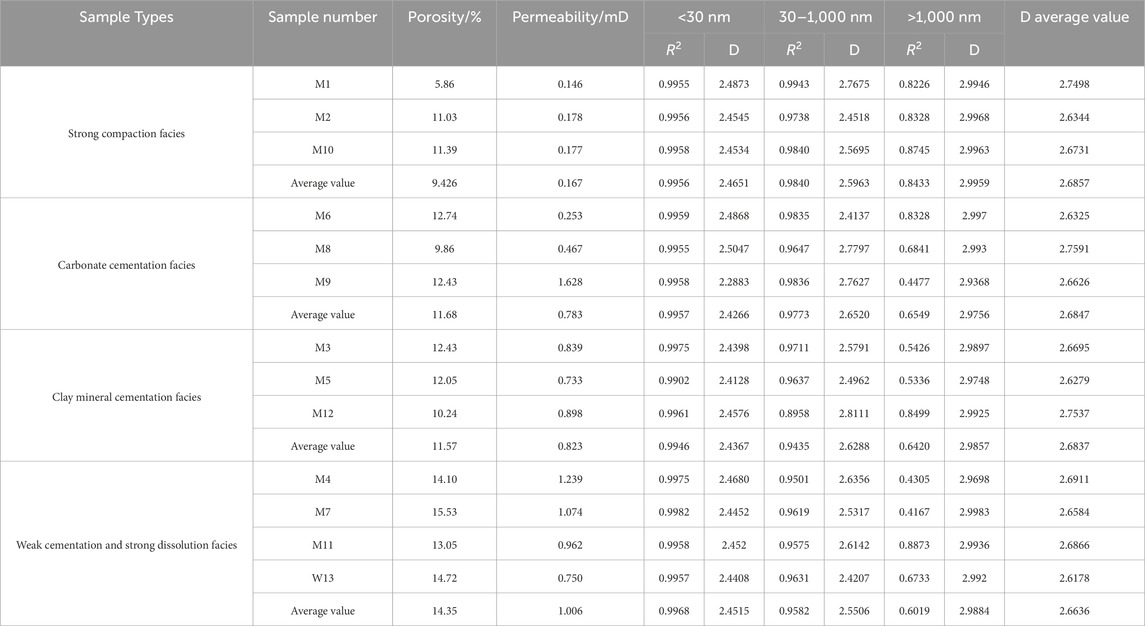
Table 3. Comprehensive analysis of pore fractal dimensions in tight sandstones of different diagenetic facies.
The fractal dimension of each segment is between 2 and 3, and all of them have high correlation coefficients, except for some large holes, and the R2 values are all greater than 0.8. Large holes (greater than 1,000 nm) have the highest fractal dimensions, which are 2.9368∼2.9983, with an average value of 2.9866; medium holes (30–1,000 nm) have fractal dimensions 2.4207∼2.7797, with an average value of 2.6028, and small holes (less than 30 nm) have the lowest fractal dimensions, which are 2.2883∼2.5047, with an average value of 2.4455. Compared to mesopores and small pores, macropores exhibit higher fractal dimension values. This feature reveals a high degree of inhomogeneity, significant irregularities in their pore structure, and irregular pore size with a discrete distribution. In contrast, the small pores have relatively uniform and regular pore distribution.
In small pores (Figure 10), the average fractal dimension of strong compaction facies, carbonate cementation facies, clay mineral cementation facies and weak cementation and strong dissolution facies are 2.4651, 2.4266, 2.4367 and 2.4515, indicating that the pore structure of the strong compaction facies and weak cementation and strong dissolution facies is more complex compared with the carbonate cementation facies together with clay mineral cementation facies; In medium pores, the average fractal dimension of strong compaction facies, carbonate cementation facies, clay mineral cementation facies and weak cementation and strong dissolution facies are 2.5963, 2.6520, 2.6288 and 2.5506, indicating that the pore structure in carbonate cementation facies and clay mineral cementation facies is more complex compared with that of the strong compaction facies and weak cementation and strong dissolution facies; In macroporous, the average fractal dimension of the average fractal dimension of strong compaction facies, carbonate cementation facies, clay mineral cementation facies and weak cementation and strong dissolution facies are 2.5963, 2.6520, 2.6288, and 2.5506, which indicate that the pore structure of the strong compaction facies and weak cementation and strong dissolution facies is more complex compared with the carbonate cementation facies and clay mineral cementation facies.
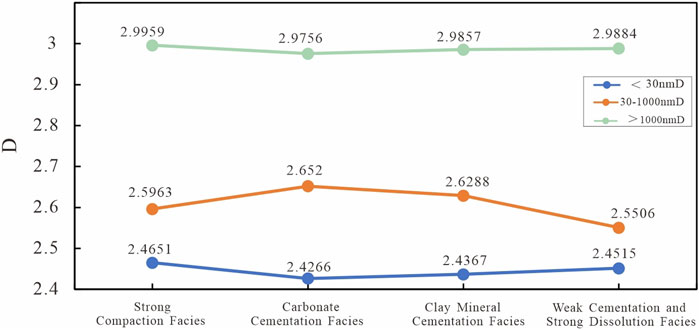
Figure 10. The relationship between the average fractal dimensions D in four different types of diagenetic facies.
The total fractal dimension data for the sample scope is 2.2883–2.9983, while the overall average stabilizes around 2.6783. The fractal dimension of the different pores of the strong compaction facies is high as a whole, and the D is 2.6857; compared to the other three categories, it has the largest value of the four, which indicates that the surface of pores in the strong compaction facies is rough, and the pores are more irregular, which is unfavorable to the storage and penetration of the natural gas in the pores, followed by carbonate cementation facies or clay mineral cementation facies, and the average values of fractal dimension are 2.6847 and 2.6837, whereas that of weakly cemented and strongly dissolved phase is low overall. The average values of the dimension are 2.6847 and 2.6837. In contrast, the overall fractal dimension in weak cementation and strong dissolution facies is low, and the pore space is relatively more regular, which is more favorable for storage and permeation in the pore space.
6.2 Influencing factors of pore fractal
Many factors influence reservoir fractal characteristics, including mineral composition, reservoir properties, tectonic and diagenetic effects, etc. In the discussion of pore development carried out for this study, the key factors affecting pore development in the tight sandstone area include the mineral component, physical properties of the reservoir, and sedimentary facies.
6.2.1 Mineral component
Scatter plots are drawn between them to investigate further systematically the factors influencing pore fractals and visualize the relationship between fractal dimension and mineral composition content (Figure 11).
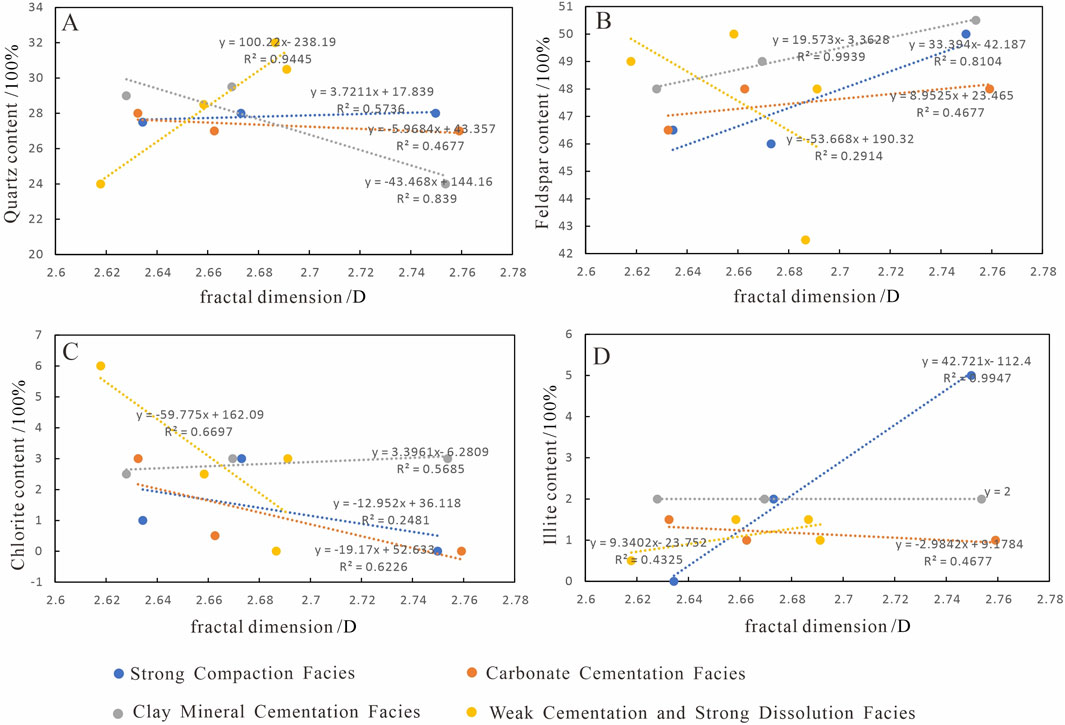
Figure 11. Relationship between fractal dimension and mineral composition content. (A) Relationship between fractal dimension and quartz content; (B) Relationship between fractal dimension and feldspar content; (C) Relationship between fractal dimension and chlorite content; (D) Relationship between fractal dimension and illite content.
It can be seen in the figure that there is a significant positive correlation between quartz content and fractal dimension in strong compaction and the weak cementation and strong dissolution facies (Figure 11A); the R2 was 0.4677 and 0.839, respectively. The fractal dimension gradually increases with increasing quartz content in these reservoir rocks. On the contrary, in the carbonate cementation facies and clay mineral cementation facies, there is a significant negative correlation between quartz content and fractal dimension; the R2 was 0.4677 and 0.839, respectively, and the higher the content of quartz in these reservoir rocks, the fractal dimension is subsequently smaller. Quartz mineral properties are very stable and not easy to weather; quartz cracks were not observed, only the formation of residual intergranular pores, not easy to dissolve the formation of dissolution holes, and the complexity of the pore space is high.
Analyzing the figure (Figure 11B), we find that the feldspar content and fractal dimension of the strong compaction facies, carbonate cementation facies, and clay mineral cementation facies show a positive correlation. In contrast, the passive correlation between the feldspar content and fractal dimension in weak cementation and strong dissolution facies samples is weaker, with an R2 of 0.2914, which indicates that the amount of feldspar content has a relatively weaker impact on the complexity of the pore structure in this type of reservoir. Feldspar is easily dissolved, thus forming dissolved pores, and the higher the feldspar content, the more feldspar dissolved pores will appear. These pores will further increase the pore space in the reservoir, thus enhancing the pore connectivity and seepage capacity, decreasing the reservoir’s inhomogeneity, and the fractal dimension closer to 2.
Observing the relations between chlorite content and fractal dimension (Figure 11C), it can be seen that, except for the clay mineral cementation facies, the chlorite content of the strong compaction facies, the carbonate cementation facies, the weak cementation and strong dissolution facies shows negative correlation with the fractal dimension, and R2 is 0.2481, 0.6226, and 0.6697, is a better correlation, and the fractal dimension decreases accordingly when the chlorite content increases. The formation of chlorite reduces the storage space of the reservoir, makes the reservoir connectivity worse, weakens the seepage ability, and increases the complexity of the pore structure. Still, at the same time, the surface of the rock particles also generates a layer of chlorite film, which can better resist compaction, further consolidate the rock skeleton, protect the pore space from being damaged again, and avoid the enhancement of non-homogeneousness of the reservoir. At the same time, the gradual increase of chlorite content leads to the formation of numerous tiny pores, which results in a more homogeneous pore size distribution and a further reduction of the fractal dimension.
The correlation between illite content and fractal dimension in the four types of samples shows a more complex correlation (Figure 11D). The carbonate cementation facies show a negative correlation, the clay mineral cementation facies have the same illite content, and the strong compaction facies show an apparent positive correlation, and the correlation is perfect, with an R2 of 0.9947. Due to the volatile nature of the illite minerals, the pore spaces and the throats in the reservoir are filled with illite to form a reticulation structure, which makes the seepage capacity weaker, the pore connectivity becomes poorer, and the non-homogeneity for this reservoir is enhanced, which ultimately leads to the increasing fractal dimension.
After an in-depth analysis, it is found that the complexity of the reservoir pore structure is a result of the synergistic effect of the content of multiple mineral components. When interacting with each other, these mineral components can intuitively reflect the reservoir’s physical properties. Therefore, the reservoir’s pore structure, connectivity, and inhomogeneity can be predicted by studying the contents of different mineral components in the reservoir.
6.2.2 Physical properties of the reservoir
To further clarify the geological significance of the fractal dimension of pore structure for the reservoirs of this study, the connection between orosity and the fractal dimension is analyzed in detail in the following (Figure 12). The physical conditions of reservoir development are mainly affected by the sedimentary phase and various diagenetic effects in the process of rock formation, and the later diagenetic effects also have an essential role in the physical characteristics of the reservoir rocks. The complexity of the pore structure and the non-homogeneity are closely related to the fractal dimension of this reservoir.
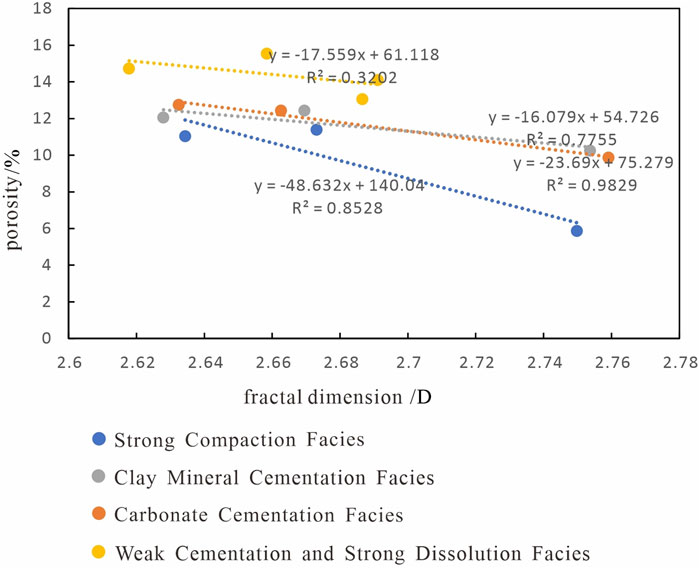
Figure 12. Relationship between porosity and fractal dimension.
To study the relationship between reservoir physical properties and fractal dimension, the porosity data and fractal dimension values of this study area were plotted on a scatter plot (Figure 12), and it was found that, in strong compaction facies, carbonate cementation facies, clay mineral cementation facies, and the weak cementation and strong dissolution facies, there was a favorable negative relation between porosity and fractal dimension, as the porosity decreases, the fractal dimension shows an increasing trend, the connectivity was weakened, the seepage capacity pores was weakened, this makes the physical properties of the destination layer bad, the pore structure more and more complex, and the more non-homogeneous it is.
6.2.3 Sedimentary facies
Changes in hydrodynamic conditions and depositional modes have resulted in differences in sediment grain size, filler content, mineral components, and rock structural characteristics (sorting, rounding, etc.) (Chen et al., 2024), in which features of the rock grain size distribution are a reflection of the depositional environment, and the grain size directly determines the type and nature of the rock, and the particle size is a good sign to discriminate the hydrodynamic conditions, so the particle size analysis is an essential basis for the study of sedimentary microphase. The tight sandstone reservoirs for this study are primarily fine-grained fine, with some visible, very fine-coarse chalk grains.
Most of the strong compaction facies are very fine-fine-grained sandstone, with a maximum grain size of about 0.25 mm, the primary grain size between 0.087 and 0.207, containing a small amount of intergranular pores and dissolution pores, with an average pore size of about 21.67 μm, and nanometer-sized pores are mostly blind pores, with poor connectivity. The carbonate cementation facies are all fine-grained to very fine-grained lithic arkose, with the maximum grain size of about 0.28 mm, the primary grain size between 0.1 and 0.233, the average pore size is about 50 μm, most of the nanoscale pores appear to be closed, and their connectivity is relatively weak. The clay mineral cementation facies are fine-grained to very fine-grained lithic arkose, with a maximum grain size of about 0.3 mm, a primary grain size between 0.1 and 0.25, samples showing intergranular pore and dissolution pore development, an average pore size of about 21.67 μm, and nanoscale pores development with good connectivity. The weak cementation and strong dissolution facies are very fine-coarse lithic arkose, the primary grain size between 0.12 and 0.3, and dissolved pores, meanwhile, some of the residual intergranular pores can be seen, and the content of heterozygous groups is small, with an average pore size of about 60 μm, as far as the pore size distribution is concerned, it is distributed in different size scales and the nanoscale pores are well connected. According to the results of grain size pore characterization from different diagenetic phases, the bigger the grain size, the better the physical properties and the stronger reservoir homogeneity.
The development of pore space in tight sandstone is subject to the constraints of the depositional environment, and changes in the depositional environment will lead to differences in hydrodynamic conditions and material compositions, especially the impact on the hydrodynamic conditions, which is particularly significant. The grain size characteristics of tight sandstones are strongly and directly influenced by hydrodynamic conditions, further affecting pore development. In coarser grain size sandstone in the deposition, the gap between the particles is relatively large to create favorable conditions for forming primary pore space. It is favorable for the flow of fluids and dissolution in the later stage. Strong compaction facies are mainly sand bodies formed in the divergent interbay or underwater natural dykes, being to the transition zone between the fan delta plain and the leading edge. Affected by the dilution of freshwater from land sources, the mineralization of stratum water is low, and the degree of cementation and alkaline dissolution and erosion is weak; at the same time, due to being far away from the center of the lake basin, the acidic fluids have been consumed continuously after Chang-distance transport, and the acidic dissolution is challenging to reach there, so the area has resulted in a predominantly compacted diagenetic character; Carbonate cementation facies is mainly formed for the underwater natural dike and underwater branch channel flanks of the sand body, dominated by silt, area located at the outer leading edge of the fan delta near the lake basin, primarily fine-grained sandy deposits are dominated by the intergranular holes in the assimilated stage of the intergranular hole is very easy to chemical precipitates cementation is exhausted, the formation of rock-forming period of the region of stratigraphic water seepage is not fluent, so as to form the formation of rock-forming facies dominated by the cementation; The clay mineral cementation facies is primarily controlled by the branch channel, the sand body is more developed, the sedimentary microphase is mainly the leading edge mat sand and the flanks of the diversion channel, the original intergranular pore size is comparatively small, and it is hard to form dissolution pore; Weak cementation and strong dissolution facies is a sand body formed by the scouring of the main river channel, the junction zone between the inner and outer front edges of the fan delta is the main development area, where the sorting and rounding of rock particles are enhanced through the transportation and screening process, which leads to a significant improvement in the initial physical properties of the reservoir. Under the high pore and seepage environment, it is favorable for the inflow of acidic fluid, and it also facilitates the outflow of mineral ions produced by acidic dissolution, resulting in the development of dissolution holes in this area and the formation of weak cementation and strong dissolution facies.
In general, the physical properties of this reservoir are primarily controlled by the sedimentary microphase, and the areas with better physical properties and lower fractal dimensions are primarily concentrated in the center of the delta’s main channel. In comparison, the physical properties of the interfluvial bays or the edges of the submerged natural dykes are generally worse and have higher fractal dimensions.
7 Conclusion
(1) The type of diagenesis in the study area is mainly compaction, cementation, and dissolution. The central pore types include residual intergranular pores as well as dissolution pores; quartz and feldspar dominate the mineral composition of the reservoir, while chlorite is most prominent in the clay minerals based on characteristics of casts as well as scanning electron microscopy, combined with the influence of diagenesis and physical characteristics, the diagenetic facies of the target layer are divided into four categories, namely, the strong compaction facies, the carbonate cementation facies, the clay mineral cementation facies and the weak cementation and strong dissolution facies, the storage performance and seepage capacity are sequentially enhanced, while the homogeneity of the pore structure is gradually strengthened.
(2) The pore types, pore morphology, and distribution characteristics of four samples with different diagenetic facies from this study area were statistically characterized. Strong compaction facies were compacted out, the pores were not developed, the range of adsorption return line was narrow, the adsorption curve was closer to the desorption curve with poor connectivity, the pore sizes smaller than 1,000 nm were dominant, and the total porosity of the samples was the most minor; Carbonate cementation facies rock intergranular pores are filled mainly by carbonate, destroying the native pore structure, its adsorption back to the line range is slightly larger than that of the strong compaction facies, in the pore diameter of less than 10 nm are peaked, the peak is about 2 ∼ 3 nm, the pore volume consists mainly of 300 nm pores; The presence of residual intergranular pores can be observed in some samples of clay mineral cementation facies, with more developed dissolution, and its adsorption backline range is significantly higher than that of the strong compaction facies and carbonate cementation facies samples, and the pore volume mainly consists of pores at 1,000 nm; Weak cementation and strong dissolution facies solvation development, connectivity is better, its adsorption back to the line and the clay mineral cementation facies is similar, but the desorption curve has a clear inflection point at P/P0 = 0.5, the pore development exhibits increased complexity and diversity, the sandstone pore volume consists mainly of 1,500 nm macropores, followed by 70∼400 nm mesopores.
(3) Pore sizes less than 30 nm and 30–1,000 nm in tight sandstone are consistent with the fractal characteristics, and the correlation of the pores bigger than 1,000 nm is not very good. The derived microscopic pore structure of the tight sandstone reservoir core exhibits multifractal characteristics, and the fractal dimension shows variability in different pore size ranges. The fractal dimension of different pores in the firmly compacted phase is high, with a D of 2.6857, the highest among different diagenetic facies, demonstrating that the pore surface of the strong compaction facies is non-smooth. The pore is more irregular, which is not conducive to natural gas storage and penetration in the pores, followed by the carbonate cementation facies and clay mineral cementation facies, with average fractal dimensions of 2.6847 and 2.683. In contrast, the fractal dimension of the weak cementation and strong dissolution facies is low, and the pores are relatively more regular. The pore space is relatively more regular, which is more favorable to the storage and infiltration of the pore.
(4) Mineral compositions, physical properties, and sedimentary facies affect the fractal characteristics, the pore characteristics of the destination layer, and the seepage capacity in these reservoir fluids. In four different diagenetic facies, the mineral compositions of quartz, feldspar, chlorite, and illite have different effects on pore fractal characteristics. The results show a good negative correlation between porosity and fractal dimension. Fractal dimension increases with the decrease of porosity, reservoir connectivity decreases, and reservoir pore seepage ability decreases. The fractal characteristics of pores are controlled by sedimentary microfacies, and areas with good physical properties or lower fractal dimensions are mainly concentrated in the central part of the main river channel of the delta. The physical properties of distributary bays or natural underwater embankment edges are generally poor, with higher fractal dimensions.
Data availability statement
The original contributions presented in the study are included in the article/supplementary material, further inquiries can be directed to the corresponding author.
Author contributions
DC: Conceptualization, Methodology, Writing – original draft, Writing – review and editing. HZ: Data curation, Software, Writing – original draft. FZ: Data curation, Software, Writing – review and editing. YW: Data curation, Investigation, Writing – review and editing. DM: Investigation, Software, Writing – review and editing. QJ: Investigation, Visualization, Writing – review and editing. FH: Data curation, Software, Writing – review and editing. WG: Investigation, Software, Writing – review and editing.
Funding
The author(s) declare that financial support was received for the research and/or publication of this article. This work was supported by the Science and Technology Program of Gansu Province (22JR5RA550), the Lanzhou Science and Technology Development Guiding Plan project (2024-9-295), and the Discipline Construction Project of Lanzhou City University.
Conflict of interest
The authors declare that the research was conducted in the absence of any commercial or financial relationships that could be construed as a potential conflict of interest.
Generative AI statement
The author(s) declare that no Generative AI was used in the creation of this manuscript.
Publisher’s note
All claims expressed in this article are solely those of the authors and do not necessarily represent those of their affiliated organizations, or those of the publisher, the editors and the reviewers. Any product that may be evaluated in this article, or claim that may be made by its manufacturer, is not guaranteed or endorsed by the publisher.
References
Avnir, D., and Jaroniec, M. (1989). An isotherm equation for adsorption on fractal surfaces of heterogeneous porous materials. Langmuir 5 (6), 1431–1433. doi:10.1021/la00090a032
Barrett, E. P., Joyner, L. G., and Halenda, P. P. (1951). The determination of pore volume and area distributions in porous substances. I. Computations from nitrogen isotherms. J. Am. Chem. Soc. 73 (1), 373–380. doi:10.1021/ja01145a126
Bechtel, A., Sachsenhofer, R. F., Zdravkov, A., Kostova, I., and Gratzer, R. (2005). Influence of floral assemblage, facies and diagenesis on petrography and organic geochemistry of the Eocene Bourgas coal and the Miocene Maritza-East lignite (Bulgaria). Org. Geochem. 36 (11), 1498–1522. doi:10.1016/j.orggeochem.2005.07.003
Brunauer, S., Emmett, P. H., and Teller, E. (1938). Adsorption of gases in multimolecular layers. J. Am. Chem. Soc. 60 (2), 309–319. doi:10.1021/ja01269a023
Chalmers, G., Bustin, R., and Power, I. (2012). Characterization of gas shale pore systems by porosimetry, pycnometry, surface area, and field emission scanning electron microscopy/transmission electron microscopy image analyses: examples from the Barnett, Woodford, Haynesville, Marcellus, and Doig units. AAPG Bull. 96, 1099–1119. doi:10.1306/10171111052
Chen, D., Zhu, Y., Wang, W., Zhang, L., Tang, J., Ren, J., et al. (2024). Pore structure of tight sandstones with differing permeability: the He 8 member of the middle permian lower shihezi formation, gaoqiao area, Ordos Basin. Energy Sci. Eng. 12 (1), 117–135. doi:10.1002/ese3.1621
Curtis, M., Sondergeld, C., Ambrose, R., and Rai, C. (2012). Microstructural investigation of gas shales in two and three dimensions using nanometer-scale resolution imaging. AAPG Bull. 96, 665–677. doi:10.1306/08151110188
Dathe, A., Eins, S., Niemeyer, J., and Gerold, G. (2001). The surface fractal dimension of the soil–pore interface as measured by image analysis. Geoderma 103 (1), 203–229. doi:10.1016/S0016-7061(01)00077-5
Deng, J., Liu, M., Ji, Y., Tang, D., Zeng, Q., Song, L., et al. (2022). Controlling factors of tight sandstone gas accumulation and enrichment in the slope zone of foreland basins: the Upper Triassic Xujiahe Formation in Western Sichuan Foreland Basin, China. J. Petroleum Sci. Eng. 214, 110474. doi:10.1016/j.petrol.2022.110474
Dou, W., Liu, L., Wu, K., Xu, Z., and Feng, X. (2017). Origin and significance of secondary porosity: a case study of upper Triassic tight sandstones of Yanchang Formation in Ordos basin, China. J. Petroleum Sci. Eng. 149, 485–496. doi:10.1016/j.petrol.2016.10.057
Giri, A., Tarafdar, S., Gouze, P., and Dutta, T. (2012). Fractal pore structure of sedimentary rocks: simulation in 2-d using a relaxed bidisperse ballistic deposition model. J. Appl. Geophys. 87, 40–45. doi:10.1016/j.jappgeo.2012.09.002
Grigsby, J. D. (2001). Origin and growth mechanism of authigenic chlorite in sandstones of the lower vicksburg formation, south Texas. J. Sediment. Res. 71 (1), 27–36. doi:10.1306/060100710027
He, X., Zhang, K., Jiang, S., Jiang, Z., Wang, X., Jiang, W., et al. (2025). Influencing factors and quantitative prediction of gas content of deep marine shale in Luzhou block. Sci. Rep. 15 (1), 1896. doi:10.1038/s41598-025-86095-8
He, Y., Chen, Q., Tian, Y., Yan, C., He, Y., and Li, K. (2021). Estimation of shale pore-size-distribution from N2 adsorption characteristics employing modified BJH algorithm. Petroleum Sci. Technol. 39 (19-20), 843–859. doi:10.1080/10916466.2021.1971716
Hecht, C. A. (2000). Appolonian packing and fractal shape of grains improving geomechanical properties in engineering geology. In: T. G. Blenkinsop, J. H. Kruhl, and M. Kupková, editors. Fractals and dynamic systems in geoscience. Basel, Switzerland: Birkhäuser. p. 487–504. doi:10.1007/978-3-0348-8430-3_1
Jaroniec, M. (1995). Evaluation of the fractal dimension from a single adsorption isotherm. Langmuir 11 (6), 2316–2317. doi:10.1021/la00006a076
Job, N., Léonard, A., Colomer, J., Pirard, R., Heinrìchs, B., Marien, J., et al. (2006a). Metal catalysts supported on texture-tailored carbon xerogels. Stud. Surf. Sci. Catal. 162, 111–118. doi:10.1016/S0167-2991(06)80897-9
Job, N., Panariello, F., Marien, J., Crine, M., Pirard, J., and Léonard, A. (2006b). Synthesis optimization of organic xerogels produced from convective air-drying of resorcinol–formaldehyde gels. J. Non. Cryst. Solids 352 (1), 24–34. doi:10.1016/j.jnoncrysol.2005.11.024
Kim, E., Yu, Q., and Deng, B. (2011). Plasma surface modification of nanofiltration (NF) thin-film composite (TFC) membranes to improve anti organic fouling. Appl. Surf. Sci. 257 (23), 9863–9871. doi:10.1016/j.apsusc.2011.06.059
Krohn, C. E. (1988). Sandstone fractal and Euclidean pore volume distributions. J. Geophys. Res. Solid Earth 93 (B4), 3286–3296. doi:10.1029/JB093iB04p03286
Lai, J., Fan, X., Liu, B., Pang, X., Zhu, S., Xie, W., et al. (2020). Qualitative and quantitative prediction of diagenetic facies via well logs. Mar. Petroleum Geol. 120, 104486. doi:10.1016/j.marpetgeo.2020.104486
Lai, J., Wang, G., Ran, Y., Zhou, Z., and Cui, Y. (2016). Impact of diagenesis on the reservoir quality of tight oil sandstones: the case of Upper Triassic Yanchang Formation Chang 7 oil layers in Ordos Basin, China. J. Petroleum Sci. Eng. 145, 54–65. doi:10.1016/j.petrol.2016.03.009
Lei, Y., Luo, X., Wang, X., Zhang, L., Jiang, C., Yang, W., et al. (2015). Characteristics of silty laminae in Zhangjiatan Shale of southeastern Ordos Basin, China: implications for shale gas formation. AAPG Bull. 99, 661–687. doi:10.1306/09301414059
Li, H., Zhang, Z., and Shi, Y. (2016). New characterization on the petrophysical characteristics of tight sandstone reservoirs in Yanchang Formation Ordos Basin China. Energy Explor. Exploitation 34 (6), 844–864. doi:10.1177/0144598716665038
Li, J., Yin, J., Zhang, Y., Lu, S., Wang, W., Li, J., et al. (2015). A comparison of experimental methods for describing shale pore features — a case study in the Bohai Bay Basin of eastern China. Int. J. Coal Geol. 152, 39–49. doi:10.1016/j.coal.2015.10.009
Li, J., Zhang, X., Tian, J., Liang, Q., and Cao, T. (2021). Effects of deposition and diagenesis on sandstone reservoir quality: a case study of Permian sandstones formed in a braided river sedimentary system, northern Ordos Basin, Northern China. J. Asian Earth Sci. 213, 104745. doi:10.1016/j.jseaes.2021.104745
Li, Z., Liang, Z., Jiang, Z., Gao, F., Zhang, Y., Yu, H., et al. (2019). The impacts of matrix compositions on nanopore structure and fractal characteristics of lacustrine shales from the changling fault depression, songliao basin, China. Minerals 9, 127. doi:10.3390/min9020127
Li, Z., Shen, X., Qi, Z., and Hu, R. (2018). Study on the pore structure and fractal characteristics of marine and continental shale based on mercury porosimetry, N2 adsorption and NMR methods. J. Nat. Gas Sci. Eng. 53, 12–21. doi:10.1016/j.jngse.2018.02.027
Liu, B., Ma, Y., Yasin, Q., Wood, D. A., Sun, M., Gao, S., et al. (2025). Characterization of lacustrine shale oil reservoirs based on a hybrid deep learning model: a data-driven approach to predict lithofacies, vitrinite reflectance, and TOC. Mar. Petroleum Geol. 174, 107309. doi:10.1016/j.marpetgeo.2025.107309
Liu, G., Wang, H., Tang, J., Liu, Z., and Yang, D. (2023). Effect of wettability on oil and water distribution and production performance in a tight sandstone reservoir. Fuel 341, 127680. doi:10.1016/j.fuel.2023.127680
Loucks, R., Reed, R., Ruppel, S., and Hammes, U. (2012). Spectrum of pore types and networks in mudrocks and a descriptive classification for matrix-related mudrock pores. AAPG Bull. 96, 1071–1098. doi:10.1306/08171111061
Marghani, M. M. A., Zairi, M., and Radwan, A. E. (2023). Facies analysis, diagenesis, and petrophysical controls on the reservoir quality of the low porosity fluvial sandstone of the Nubian formation, east Sirt Basin, Libya: insights into the role of fractures in fluid migration, fluid flow, and enhancing the permeability of low porous reservoirs. Mar. Petroleum Geol. 147, 105986. doi:10.1016/j.marpetgeo.2022.105986
Mendhe, V. A., Bannerjee, M., Varma, A. K., Kamble, A. D., Mishra, S., and Singh, B. D. (2017). Fractal and pore dispositions of coal seams with significance to coalbed methane plays of East Bokaro, Jharkhand, India. J. Nat. Gas Sci. Eng. 38, 412–433. doi:10.1016/j.jngse.2016.12.020
Qiao, J., Zeng, J., Jiang, S., Ma, Y., Feng, S., Xie, H., et al. (2020b). Role of pore structure in the percolation and storage capacities of deeply buried sandstone reservoirs: a case study of the Junggar Basin, China. Mar. Petroleum Geol. 113, 104129. doi:10.1016/j.marpetgeo.2019.104129
Qiao, J., Zeng, J., Ma, Y., Jiang, S., Feng, S., and Hu, H. (2020a). Effects of mineralogy on pore structure and fluid flow capacity of deeply buried sandstone reservoirs with a case study in the Junggar Basin. J. Petroleum Sci. Eng. 189, 106986. doi:10.1016/j.petrol.2020.106986
Qin, Y., Liu, C., Zhao, J., He, F., Zhang, W., Yang, L., et al. (2025). Unravelling the origin of gas in tight sandstones of the Hangjinqi gas field, Ordos Basin, China: new insights from natural gas geochemistry data. Org. Geochem. 206, 206105012–105012. doi:10.1016/j.orggeochem.2025.105012
Rossi, C., Kälin, O., Arribas, J., and Tortosa, A. (2002). Diagenesis, provenance and reservoir quality of triassic TAGI sandstones from ourhoud field, berkine (ghadames) basin, Algeria. Mar. Petroleum Geol. 19 (2), 117–142. doi:10.1016/S0264-8172(02)00004-1
Rouquerol, J., Avnir, D., Fairbridge, C. W., Everett, D. H., Haynes, J. M., Pernicone, N., et al. (1994). Recommendations for the characterization of porous solids (Technical Report). Tech. Rep. 66 (8), 1739–1758. doi:10.1351/pac199466081739
Schmid, S., Worden, R. H., and Fisher, Q. J. (2004). Diagenesis and reservoir quality of the sherwood sandstone (triassic), corrib field, slyne basin, west of Ireland. Mar. Petroleum Geol. 21 (3), 299–315. doi:10.1016/j.marpetgeo.2003.11.015
Shu, Y., Sang, S., Jin, Y., and Zheng, H. (2025). Multi-scale reservoir response characteristics of coalbed methane development through stress relief via horizontal well cavity completion in tectonically deformed coals. Fuel 381, 133600. doi:10.1016/j.fuel.2024.133600
Sing, K. S. W. (1985). Reporting physisorption data for gas/solid systems with special reference to the determination of surface area and porosity (Recommendations 1984). Pure. Appl. Chem. 57, (4), 603–619. doi:10.1351/pac198557040603
Sohail, G. M., Radwan, A. E., and Mahmoud, M. (2022). A review of Pakistani shales for shale gas exploration and comparison to North American shale plays. Energy Rep. 8, 6423–6442. doi:10.1016/j.egyr.2022.04.074
Tang, L., Song, Y., Jiang, Z., Jiang, S., and Li, Q. (2019). Pore structure and fractal characteristics of distinct thermally mature shales. Energy and Fuels 33 (6), 5116–5128. doi:10.1021/acs.energyfuels.9b00885
Thommes, M., Kaneko, K., Neimark, A. V., Olivier, J. P., Rodriguez-Reinoso, F., Rouquerol, J., et al. (2015). Physisorption of gases, with special reference to the evaluation of surface area and pore size distribution (IUPAC Technical Report). IUPAC Tech. Rep. 87 (9-10), 1051–1069. doi:10.1515/pac-2014-1117
Thompson, A. H., Katz, A. J., and Krohn, C. E. (1987). The microgeometry and transport properties of sedimentary rock. Adv. Phys. 36 (5), 625–694. doi:10.1080/00018738700101062
Wang, G., Chang, X., Yin, W., Li, Y., and Song, T. (2017b). Impact of diagenesis on reservoir quality and heterogeneity of the Upper Triassic Chang 8 tight oil sandstones in the Zhenjing area, Ordos Basin, China. Mar. Petroleum Geol. 83, 84–96. doi:10.1016/j.marpetgeo.2017.03.008
Wang, H., Ji, B., Lv, C., Zhang, L., Li, X., Cui, C., et al. (2019). The stress sensitivity of permeability in tight oil reservoirs. Energy Explor. Exploitation 37 (4), 1364–1376. doi:10.1177/0144598719855819
Wang, J., Cao, Y., Liu, K., Liu, J., and Kashif, M. (2017a). Identification of sedimentary-diagenetic facies and reservoir porosity and permeability prediction: an example from the Eocene beach-bar sandstone in the Dongying Depression, China. Mar. Petroleum Geol. 82, 69–84. doi:10.1016/j.marpetgeo.2017.02.004
Wang, J., Wu, S., Li, Q., and Guo, Q. (2020). An investigation into pore structure fractal characteristics in tight oil reservoirs: a case study of the Triassic tight sandstone with ultra-low permeability in the Ordos Basin, China. Arabian J. Geosciences 13 (18), 961. doi:10.1007/s12517-020-05928-0
Wang, R., Chi, Y., Zhang, L., He, R., Tang, Z., and Liu, Z. (2018). Comparative studies of microscopic pore throat characteristics of unconventional super-low permeability sandstone reservoirs: examples of Chang 6 and Chang 8 reservoirs of Yanchang Formation in Ordos Basin, China. J. Petroleum Sci. Eng. 160, 72–90. doi:10.1016/j.petrol.2017.10.030
Wang, Z., Zhou, N., Lu, S., Liu, Y., Lin, L., Liu, Y., et al. (2023). Generation, accumulation, and distribution of Upper Paleozoic tight sandstone gas in the northeastern margin of the Ordos Basin. Mar. Petroleum Geol. 156, 106463. doi:10.1016/j.marpetgeo.2023.106463
Winter, D. A. M. D., Schneijdenberg, C. T. W. M., Lebbink, M. N., Lich, B., Verkleij, A. J., Drury, M. R., et al. (2009). Tomography of insulating biological and geological materials using focused ion beam (FIB) sectioning and low-kV BSE imaging. J. Microsc. 233 (3), 372–383. doi:10.1111/j.1365-2818.2009.03139.x
Wu, D., Liu, S., Chen, H., Lin, L., Yu, Y., Xu, C., et al. (2020). Investigation and prediction of diagenetic facies using well logs in tight gas reservoirs: evidences from the Xu-2 member in the Xinchang structural belt of the western Sichuan Basin, western China. J. Petroleum Sci. Eng. 192, 107326. doi:10.1016/j.petrol.2020.107326
Xu, M., Jiang, Z., Liu, J., Xiao, H., Liu, X., and Tang, X. (2024). Research on the diagenetic facies division and pore structure characteristics of the chang 63 member in the huaqing oilfield, Ordos Basin. ACS Omega 9 (24), 26363–26379. doi:10.1021/acsomega.4c02550
Xu, S., Gou, Q., Hao, F., Zhang, B., Shu, Z., Lu, Y., et al. (2020). Shale pore structure characteristics of the high and low productivity wells, Jiaoshiba shale gas field, Sichuan Basin, China: dominated by lithofacies or preservation condition? Mar. Petroleum Geol. 114, 104211. doi:10.1016/j.marpetgeo.2019.104211
Yang, P., Guo, H., and Yang, D. (2013). Determination of residual oil distribution during waterflooding in tight oil formations with NMR relaxometry measurements. Energy and Fuels 27 (10), 5750–5756. doi:10.1021/ef400631h
Yang, Y., Yang, J., Yang, G., Tao, S., Ni, C., Zhang, B., et al. (2016). New research progress of Jurassic tight oil in central Sichuan Basin, SW China. Petroleum Explor. Dev. 43 (6), 954–964. doi:10.1016/S1876-3804(16)30113-6
Yao, Y., Liu, D., Che, Y., Tang, D., Tang, S., and Huang, W. (2010). Petrophysical characterization of coals by low-field nuclear magnetic resonance (NMR). Fuel 89 (7), 1371–1380. doi:10.1016/j.fuel.2009.11.005
Zhang, F., Jiang, Z., Sun, W., Zhang, X., Zhu, L., Li, X., et al. (2020b). Effect of microscopic pore-throat heterogeneity on gas-phase percolation capacity of tight sandstone reservoirs. Energy and Fuels 34 (10), 12399–12416. doi:10.1021/acs.energyfuels.0c02393
Zhang, J., Wei, C., Ju, W., Qin, Z., Ji, Y., Quan, F., et al. (2020a). Microscopic distribution and dynamic variation of water under stress in middle and high rank coal samples. J. Nat. Gas Sci. Eng. 79, 103369. doi:10.1016/j.jngse.2020.103369
Zhang, J., Zhang, F., Liu, Y., Wu, F., Yan, F., Xie, C., et al. (2023). Causes of reservoir diagenesis and porestructure differences of the Yanchang Formation in the WL area of the Ordos Basin. Bull. Geol. Sci. Technol. 42 (6), 162–173. doi:10.19509/j.cnki.dzkq.tb20220607
Keywords: diagenetic facies, microscopic pores, fractal features, tight sandstone, Yanchang formation, western Ordos Basin
Citation: Chen D, Zhao H, Zheng F, Wang Y, Ma D, Jia Q, Han F and Gao W (2025) Differences in microporous fractal characteristics of tight sandstones of different diagenetic facies: Chang 6 reservoirs of the Triassic Yanchang Formation in the western Ordos Basin, China. Front. Earth Sci. 13:1583053. doi: 10.3389/feart.2025.1583053
Received: 25 February 2025; Accepted: 18 June 2025;
Published: 03 July 2025.
Edited by:
François Fournier, Aix-Marseille Université, FranceReviewed by:
Francisco Tognoli, Rio de Janeiro Federal University, BrazilIvica Pavičić, University of Zagreb, Croatia
Copyright © 2025 Chen, Zhao, Zheng, Wang, Ma, Jia, Han and Gao. This is an open-access article distributed under the terms of the Creative Commons Attribution License (CC BY). The use, distribution or reproduction in other forums is permitted, provided the original author(s) and the copyright owner(s) are credited and that the original publication in this journal is cited, in accordance with accepted academic practice. No use, distribution or reproduction is permitted which does not comply with these terms.
*Correspondence: Dayou Chen, ZHljaGVuaG5AMTI2LmNvbQ==