Abstract
This study investigates four severe aircraft icing cases in Southwest China during the winter of 2023, focusing on their circulation patterns and cloud macro-characteristics. The results indicate that the meridional Yunnan-Guizhou quasi-stationary front (YGQSF) drives these severe icing. The synergistic interaction between the cold Mongolian high and Northeast China Cold Vortex intensified East Asian meridional circulation, triggering strong convergence of warm-moist and dry-cold air over Southwest China. The terrain-forced updraft near the front continuously transports moisture to 700 hPa, where the airflow shifts to westerlies, inducing the formation of convergent cloud clusters and horizontal cloud expansion. Meanwhile, a persistently maintained closed vertical circulation cell on the cold side may play a vital role in sustaining cold air masses and frontal cloud clusters over Southwest China. Furthermore, the temperature inversion layer (within 850–700 hPa) east of YGQSF maintained supercooled liquid water reservoirs and limited ice-phase particles via stable “warm-over-cold” stratification and suppressed convection. Besides, analysis of cloud macro-characteristics showed that the frontal icing-related cloud coverage reached 100%, with all cases occurring in supercooled clouds oriented from southwest to northeast. The cloud top temperatures ranged from −25°C to −10°C, and the cloud top heights exhibited a “higher in the north, lower in the south” distribution, generally between 5 and 7 km. These results provide a thermodynamic framework for forecasting severe winter aircraft icing in Southwest China.
1 Introduction
Aircraft icing refers to the phenomenon where ice accumulates on the surface of an aircraft as it passes through clouds, fog, rain, or snow (Peng et al., 2023; Sun et al., 2023). This not only affects the aircraft’s performance and increases flight risks but also poses a significant challenge to the safety of air traffic.
Previous research has extensively studied the occurrence patterns and formation conditions of aircraft icing (Casqueiro et al., 2023). It has indicated that aircraft icing primarily occurs during the winter and spring seasons, with virtually no icing zones in China during the summer (Wang et al., 2022). Existing studies generally agree that aircraft icing typically occurs within a temperature range of −20°C–0°C and in areas with relative humidity over 55%. In particular, the highest frequency of icing occurs in the −10°C to −2°C temperature range, and severe icing mainly occurs in the supercooled water regions within the −8°C to −2°C temperature range and relative humidity exceeding 65% (Schultz and Politovich, 1992; Carrière et al., 1997; Wang et al., 2022). Other studies have suggested that moderate icing occurs within the temperature range of −4°C to −2°C, and light icing occurs within the temperature range of −1°C–0°C, with higher relative humidity favoring the formation of icing (Wang and Wu, 2018). Cober and Isaac. (2011) indicated that for North America, if the temperature is below −13°C, aircraft icing formation can be disregarded. In terms of altitude, aircraft primarily fly within the lower troposphere and stratosphere. The meteorological elements in the troposphere are unevenly distributed, with frequent and sometimes intense convection. Weather phenomena such as wind, clouds, rain, snow, and thunderstorms occur in this layer, and therefore, the associated aircraft icing phenomenon is mostly observed within the troposphere (Chen and Lu, 2006). Further statistical analysis has shown that aircraft icing generally occurs below the 400 hPa altitude, with the most frequent icing occurring between the 850 hPa and 700 hPa levels (Wang et al., 2020; Du et al., 2023). Aircraft icing in Western Europe and the northeastern Atlantic typically occurs in the middle troposphere, with 82.7% and 78.6% of moderate and severe icing, respectively, identified between FL100 and FL250, approximately 3 to 7.6 km (Casqueiro et al., 2023). Therefore, it is evident that the temperature-humidity ranges and levels conducive to aircraft icing vary significantly across different regions due to variations in terrain and climatic conditions, which may be associated with differences in dominant weather systems. Southwest China, with its complex topography and unique climatic characteristics, is highly likely to exhibit distinct patterns of aircraft icing occurrence compared to other regions—particularly regarding severe icing events. However, these patterns remain insufficiently studied and urgently require further exploration.
Aircraft icing in different regions is influenced by specific dominant weather systems (Politovich and Bernstein, 2002; Louka et al., 2024). The reflux inverted trough system formed by surface high pressure in North China and upper-level troughs in the Hetao region is the primary circulation pattern for icing near Taiyuan (Liu et al., 2005). Weather patterns conducive to icing in central Gansu, China, include northwest airflow, plateau low troughs, and southwestern airflow types (Pang and Zhang, 2008). Furthermore, the low-pressure troughs and the convergence of cold and warm air flows are the key circulation factors causing icing in Northwest China. Besides, the stationary front pattern triggers the highest frequency of icing, while the southwest trough pattern triggers the lowest frequency in Guizhou Province of China (Yang and Luo, 2024). Icing in the North China region often forms in areas such as ahead of low troughs, ahead of the ridge behind the trough, and in the reflux at the bottom of high-pressure systems combined with inverted trough (Liu et al., 2005). Low-pressure inverted troughs, southern cyclones, and cold front are the key weather systems for moderate aircraft icing in Shandong province of China (Chi, 2007). Research by the U.S. Air Force indicates that aircraft icing occurring near fronts accounts for 85% of cases, with the largest horizontal extent of icing being associated with warm fronts and the most severe icing related to cold fronts (Politovich and Bernstein, 2002). Thus, the dominant weather patterns leading to icing exhibit significant variations across different regions. Southwest China, due to its unique geographical and climatic characteristics, has become one of the regions where icing events occur frequently (Wang and Wu, 2018). Therefore, clarifying the weather patterns associated with icing in Southwest China during winter and investigating how dominant weather systems trigger such icing events will contribute to a better understanding of its formation mechanisms.
While understanding the dominant weather patterns that lead to icing is crucial, equally important is the examination of large-scale circulation and associated cloud macro-features that establish environments conducive to icing. In particular, the coupling between synoptic-scale systems (e.g., low-pressure troughs, frontal system) and regional cloud properties (e.g., cloud type, vertical structure, and thermodynamic structure) plays a pivotal role in sustaining supercooled liquid water layers (Curry and Liu, 1992; Politovich and Bernstein, 2002; Fernández-González et al., 2014). The icing is directly induced by supercooled water droplets present in convective clouds (Chen and Lu, 2006). Weak convection and the absence of ice-phase processes in convective clouds prolong supercooled water droplet lifetime, increasing icing severity (Wang and Ruan, 2002; Bolgiani et al., 2018). Previous studies indicate that the cloud systems ahead of westerly troughs exhibit extensive supercooled water regions with high liquid water content, whose peak values frequently occur above temperature inversion layers within the cloud (Yang et al., 2014). Aircraft observations reveal that supercooled liquid water (SLW) content in clouds over Urumqi, Xinjiang increases with altitude, with the maximum SLW concentration occurring near cloud top beneath a temperature inversion layer (Peng et al., 2023). The distribution features of SLW in clouds vary across regions due to differences in terrain and weather patterns (Wang and Ruan, 2002; Fernández-González et al., 2014; Peng et al., 2023).
While over Southwest China, the unique interaction between the Asian monsoon circulation and complex topography modifies cloud macro-characteristics in ways that differ markedly from other regions. For instance: Orographically forced clouds are generated by the thermal and dynamic effects of the Tibetan Plateau, leading to persistent stratiform clouds with elevated cloud bases (3–5 km ASL). These clouds retain enough moisture to sustain supercooled liquid water (Wang and Ruan, 2002; Xu et al., 2015). Moreover, the persistent moisture transport anomalies, primarily driven by low-level jets that advect warm and moist air masses into the Sichuan Basin, contribute to the formation of extensive cloud decks (>4 km vertical depth) with enhanced icing potential due to prolonged supercooled liquid water existence (Chen and Lu, 2006; Zhao et al., 2021). This study aims to analyze severe aircraft icing cases in Southwest China, investigating how synoptic-scale patterns (e.g., trough lines, shear lines) modulate the critical cloud macro-characteristics: cloud type, vertical cloud extent, and thermodynamic environment. By focusing on these observable macroscopic features, the present study seeks to identify recurring circulation patterns indicative of high icing risks, while bypassing microphysical complexities to maintain operational relevance for aviation forecasting.
This paper investigates four severe aircraft icing events in Southwest China during the winter of 2023, using pilot reports, ERA5 reanalysis data, and FY–4A satellite data, among other data sources. This study aims to elucidate the modulation mechanisms of synoptic-scale circulation pattern on cloud macro-characteristics (cloud type, vertical structure, and thermodynamic environment), thereby revealing the unique circulation-cloud field coupling patterns specific to icing events in this region.
2 Data and methods
2.1 Data
The data used in this study includes: (1) FY-4A geostationary satellite data from January 24th to 26th, 2024, which includes Cloud Fraction Ratio (CFR), Cloud Phase (CLP), Cloud Top Temperature (CTT), and Cloud Top Height (CTH), etc. (Peng et al., 2023), with a resolution of 4,000 m; (2) Pilot reports (Casqueiro et al., 2023), mainly providing information on the geographic coordinates (latitude and longitude) of aircraft icing events, the altitude at which icing occurred, and the intensity of icing (light, moderate, or severe); (3) ERA5 hourly reanalysis data from the European Centre for Medium-Range Weather Forecasts (ECMWF), with a resolution of 0.25 ° × 0.25 °, including physical quantities such as geopotential height (gpm), specific humidity (g·g-1), zonal and meridional wind (m·s-1), temperature (K), specific cloud liquid water content (kg·kg-1), and specific cloud ice water content (kg·kg-1), etc (Zhou et al., 2023; Wen et al., 2024).
2.2 Methods
This paper verifies that the selected cases are severe icing events by calculating the IC index, with the following formula:where RH is the relative humidity (%) and T is the air temperature (°C). The IC index method is an internationally recognized icing diagnostic approach recommended by the International Civil Aviation Organization (ICAO), which determines icing conditions based on temperature and humidity parameters in the flight environment (Chen and Lu, 2006). Moreover, this index provides quantitative discrimination between light, moderate, and severe icing cases (Liu et al., 2024). The interpretation of the IC values is as follows: IC < 0 indicates no icing; 0 < IC ≤ 4 indicates light icing; 4 < IC ≤ 7 indicates moderate icing; IC > 7 indicates heavy or severe icing (Zhou et al., 2023; Liu et al., 2024).
3 Results
3.1 Analysis of the circulation characteristics of severe aircraft icing in Southwest China during winter
3.1.1 Introduction to aircraft icing cases
Based on pilot report data, this paper selects four severe aircraft icing cases in the Southwest China during January of the winter season (Table 1) as the research subjects. Among these, case 1 and case 2 occurred over Chongqing City of China, case 3 appeared within Guizhou Province, and case 4 happened in the vicinity of Chengdu City, Sichuan Province. The reported altitudes of the four aircraft icing events differ. In this paper, the characteristics of these icing events are studied using pressure levels of 750 hPa, 700 hPa, 750 hPa, and 850 hPa as representatives.
TABLE 1
| Case Number | Date | Time (UTC) | Longitude | Latitude | Altitude | Intensity |
|---|---|---|---|---|---|---|
| Case 1 | 24 January 2024 | 10:05 | 103.78°E | 30.18°N | 1,500 m | Severe |
| Case 2 | 25 January 2024 | 02:00 | 106.80°E | 26.54°N | 2,300 m | Severe |
| Case 3 | 25 January 2024 | 11:21 | 106.96°E | 29.45°N | 3,000 m | Severe |
| Case 4 | 25 January 2024 | 16:09 | 106.79°E | 29.21°N | 2,400 m | Severe |
The occurrence time (universal time), longitude and latitude, altitude, and icing intensity of the four aircraft icing cases.
The article first verifies that the selected cases are typical aircraft icing events by calculating the IC index for four severe icing cases reported by pilots. As shown in Figure 1, all four aircraft icing cases occurred in regions with high IC index values. The IC index distribution indicates that Cases 1, 3, and 4 correspond to severe icing (Figures 1a,c,d), while Case 2 is located in the light icing region (Figure 1b), although it is very close to the moderate icing region. It also shows that the severe icing ranges derived from the IC index for the four cases are quite similar, with a height range between 850 hPa and 700 hPa, and a latitude range between 27.5°N and 32.5°N.
FIGURE 1

The latitude-altitude profile of the icing index (IC) calculated from the Equation 1 along the longitude where four severe icing cases occurred. The red plus signs indicate the location where icing occurred; (a) 2024-01-24 10:00 UTC; (b) 2024-01-25 02:00 UTC; (c) 2024-01-25 11:00 UTC; (d) 2024-01-25 16:00 UTC.
3.1.2 Circulation characteristics of severe icing events
Existing studies have pointed out that the weather patterns leading to aircraft icing mainly include frontal types, Pre-frontal low trough types, low vortex types, southwest inverted trough types, and stationary front types (Wang et al., 2020). The occurrence of the four severe icing events discussed in this paper is inevitably closely related to the specific circulation patterns in the Southwest China. Therefore, the following sections will elaborate on the large-scale circulation patterns during the occurrence of these four icing events.
Figure 2 shows the distribution of geopotential height field, air temperature, and vector wind field at 500 hPa for the events. All the four cases occurred in winter, and their circulation patterns are very similar to the winter circulation patterns in East Asia (Wang et al., 2022). In the middle troposphere, the subtropical high pressure is located south of 20°N for these four events. During the icing case 1 (Figure 2a), the subtropical high was located over the Pacific east of 140°E and gradually expanded westward over time. Notably, in Case 3 the subtropical high extended to approximately 115°E (Figure 2c). Especially in Cases 2 (Figure 2b) and 4 (Figure 2d), the subtropical high almost entirely influenced the entire South China Sea region, potentially supplying favorable warm and moist moisture to Southwest China. In the high-latitude region, a deep low-pressure center was situated slightly to the east of the Japan Island in the Pacific Ocean, accompanied by an intense and closed cold center resembling the Northeast China Cold Vortex (NCCV), which exerted influence over northeastern China. It has a central strength of 508-dagpm, which is significantly stronger than the climatological average. This cold vortex is expected to persist for an extended period while gradually shifting eastward, generating exceptionally favorable meridional circulation and thermal or moisture exchanges. Furthermore, affected by the Siberian High Ridge over the west of Lake Baikal, the Eurasian continent experiences a meridional circulation pattern at 500 hPa, where a weak closed low-pressure system is formed in northern China near 105°E, accompanied by a cold center with temperatures as low as −35°C. The pronounced meridional circulation creates favorable conditions for cold air from the high-latitude Mongolian Plateau to advance southward and influence Southwest China, creating latent air temperature conditions for severe icing formation.
FIGURE 2

The distribution of geopotential height field (blue solid lines; unit: dagpm), air temperature (red dashed lines; unit: °C), and vector wind field (wind barbs; unit: m·s-1) at 500 hPa for four severe icing events. The green plus sign indicates the location where icing occurred. The letters H and L represent high-pressure and low-pressure systems, respectively; (a) 2024-01-24 10:00 UTC; (b) 2024-01-25 02:00 UTC; (c) 2024-01-25 11:00 UTC; (d) 2024-01-25 16:00 UTC.
At 850 hPa, the cyclonic circulation is situated in the anterior part of the upper-level cold vortex, with its center exhibiting strong vertical coherence with the 500 hPa cold vortex center, indicating that the NCCV constitutes a deep barotropic low-pressure system (Figure 3). In the lower troposphere over the Eurasian continent, a strong cold high-pressure system develops over the east of Mongolian Plateau and Siberian regions north of China. This high-pressure system forms through the accumulation of dense cold air near the surface, indicating that the cold air has gathered here. For instance, during the Case 1, air temperatures across the Mongolian Plateau consistently remained below −10°C (Figure 3a). The synergistic interaction between this high pressure system and the NCCV enhances the meridional circulation over East Asia, driving the cold air controlled by the Mongolian High to move southward. During the occurrence of Cases 2, 3 and 4, the meridional circulations are also prevalent (Figures 3b–d).
FIGURE 3

The distribution of geopotential height field (blue solid lines; unit: dagpm), air temperature (red dashed lines; unit: °C), and vector wind field (wind barbs; unit: m·s-1) at 850 hPa for four severe icing events. The green plus signs indicate the locations where icing occurred. The letters H and L represent high-pressure and low-pressure systems, respectively; The green box represents the location of YGQSF; (a) 2024-01-24 10:00 UTC; (b) 2024-01-25 02:00 UTC; (c) 2024-01-25 11:00 UTC; (d) 2024-01-25 16:00 UTC.
The pronounced dry and cold air from the Siberian High moves from high latitudes to Southwest China, where it meets the warm moist air originating from the Bay of Bengal in the southwestern part of China, resulting in anomalously dense isotherm packing over the Yunnan-Guizhou Plateau region (Figure 3). This interaction is conducive to the development of the Yunnan-Guizhou quasi-stationary front (YGQSF), which can be illustrated by the dense isotherm. In particular, distinct isothermal dense zones are evident in Cases 1, 3, and 4 (Figures 3a,c,d). However, during Case 2, the intense convergence between warm-moist air and dry-cold air was also observed over the Yunnan-Guizhou Plateau, leading to the formation of an upper-level frontal zone (Figure 3b).
Simultaneously, Figure 3 reveals that all four severe icing events occurred in close proximity to the upper-level frontal zone. To elucidate the thermal features and vertical motion conditions at the icing altitudes, Figure 4 presents vertical cross-sections of air temperature, pseudo-equivalent potential temperature, and wind fields. During the severe icing Case 1, a pronounced temperature contrast was observed across the frontal zone (Figure 4a). It can be seen that the cold northeastern winds from the lower level of the Mongolian Plateau are located on the east side of the YGQSF. These winds are blocked by the highlands in the western part of the Yunnan-Guizhou Plateau, preventing the cold air at the surface from continuing to move westward. As a result, the cold air gradually accumulates and rises in the lower-lying areas in the eastern part of the Plateau (mainly in Guizhou province), carrying moisture upwards into the southern China (Suo et al., 2018; Cai et al., 2022). When the cold air accumulates to a certain thickness, it will climb onto the low-latitude plateau and meet with the southern branch westerly winds, forming the Yunnan-Guizhou quasi-stationary front (Suo et al., 2018). Besides, there is a significant descending motion over the western part of Yunnan Province of China, which rapidly transitions into an updraft between 103°E and 104°E, forming a warm tongue in the central and eastern parts of Yunnan Province. The ascending warm air strongly converges with the aforementioned uplifting cold air, triggering the formation of YGQSF (Cai et al., 2022). In all cases, severe icing occurred within the cold air mass on the eastern flank of the YGQSF. In Case 1, temperatures ranged from −10°C to −8°C (Figure 4a), while in Cases 2–4, temperatures were slightly higher, varying between −8°C and −4°C (Figures 4b–d). The cold air mass on the eastern flank of the YGQSF likely contained supercooled water droplets, which triggered the occurrence of severe icing cases.
FIGURE 4

Longitude–pressure cross section of the pseudo–equivalent potential temperature (shadings; unit: K), the wind field (the arrows represent the composite wind vectors of u and ω × 250) and air temperature (the green contours; unit: °C) along 28°N; The red plus signs indicate the location of aircraft icing; The red box represents the vertical location of YGQSF; (a) 2024-01-24 10:00 UTC; (b) 2024-01-25 02:00 UTC; (c) 2024-01-25 11:00 UTC; (d) 2024-01-25 16:00 UTC.
3.1.3 The role of the stationary front in icing formation
It is worth noting that a significant isotherm concentration zone exists above the Yunnan-Guizhou Plateau, indicating a high likelihood of the presence of a typical Yunnan-Guizhou quasi-stationary front (YGQSF), which is consistent with previous research findings (Cai et al., 2022; Yang et al., 2023). The distribution characteristics of the stationary front indicate that it has a north-south orientation, as shown in Figure 3. Fronts with this orientation are often accompanied by overcast and rainy weather, with lower air temperatures near the Guizhou province, providing the favorable temperature and clouds conditions for the severe icing in Southwest China (Yang et al., 2023). Interestingly, the locations of icing cases precisely occur near the YGQSF, specifically in the cold air on the eastern side of the YGQSF. Therefore, the occurrence of severe aircraft icing in the Southwest China during winter is closely related to the YGQSF. Aircraft are highly likely to be affected by frontal clouds for an extended period, leading to severe icing.
The locations of these four severe icing cases align well with the position of the winter YGQSF, which is classified as the icing caused by frontal system (named frontal-type icing for convenience). Therefore, in the following sections, this study will use the ERA5 reanalysis data provided by the ECMWF to further analyze the distribution characteristics of the pseudo-equivalent potential temperature, air temperature field, wind field and water vapor flux divergence during icing events, in order to reveal critical role of the YGQSF in the occurrence of severe icing.
As shown in Figures 3, 4, the four severe icing events selected in this study all occurred in an environment with air temperatures in the range of −8∼-4°C and in regions with relatively dense isotherms. Near the locations of the aircraft icing events, the pseudo-equivalent potential temperature tilts toward the cold region with height, and the icing points are located near the areas where the pseudo-equivalent potential temperature lines are relatively dense. Previous studies have shown that the horizontal temperature gradient in a frontal zone is much larger than that within a single air mass on either side of the front, and there is a dense band of pseudo-equivalent potential temperature near the front (Suo et al., 2018; Cai et al., 2022). The dense isotherms on the isobaric surface represent the frontal zone. Therefore, it further confirms that the formation of the four icing cases is closely related to the YGQSF. It can also be seen from Figure 4 that there is a significant contrast between warm and cold air masses below 700 hPa on both sides of the icing location in terms of both the pseudo-equivalent potential temperature and air temperature. This suggests that the YGQSF is a shallow system located below 700 hPa between 103°E and 104°E (Cai et al., 2022). Furthermore, the wind field and thermal characteristics near the quasi-stationary front will be further discussed (Figure 4). For example, during Case 1, the pronounced descending motion was observed near 110°E, which transitioned into easterly winds in the lower troposphere (Figure 4a). Similarly, on the warm air side, pronounced subsidence was also evident west of 100°E, transitioning into westerly winds in the near-surface layer. The westerly and easterly winds are orographically uplifted by the plateau terrain, leading to intense convergence and subsequent formation of the Yunnan-Guizhou Quasi-Stationary Front (YGQSF). Meanwhile, the ascending airflow near the frontal zone abruptly shifts to westerly upon reaching approximately 700 hPa, and then a cold closed vertical circulation cell forms on the eastern flank, which can sustain cold air masses and frontal cloud clusters over Southwest China, triggering the severe icings (Figures 4b–d).
3.1.4 Possible roles of temperature inversion layers in maintaining supercooled water
The warm air ascending over the cold air results in a much smaller vertical temperature gradient within the frontal zone compared to that within the air masses on either side, sometimes even leading to a temperature inversion (where temperature increases with altitude). As indicated by the green contours in Figure 4, the temperature inversion layer can be primarily observed to the east of the YGQSF. This study selects a representative point within the cold air mass to construct a time-height cross-section of moisture flux divergence, as shown in Figure 5. The inversion layer on the cold side of YGQSF exhibits persistent stability, facilitating sustained moisture convergence within the inversion layer (850–600 hPa, maximized at 700 hPa) and promoting the development and maintenance of frontal cloud systems (Figure 5). Particularly, in Cases 1, 3, and 4, the moisture flux divergence value can reach more than −0.006 g cm-2·h-1, providing sufficient moisture conditions for the formation of supercooled water droplets within clouds.
FIGURE 5
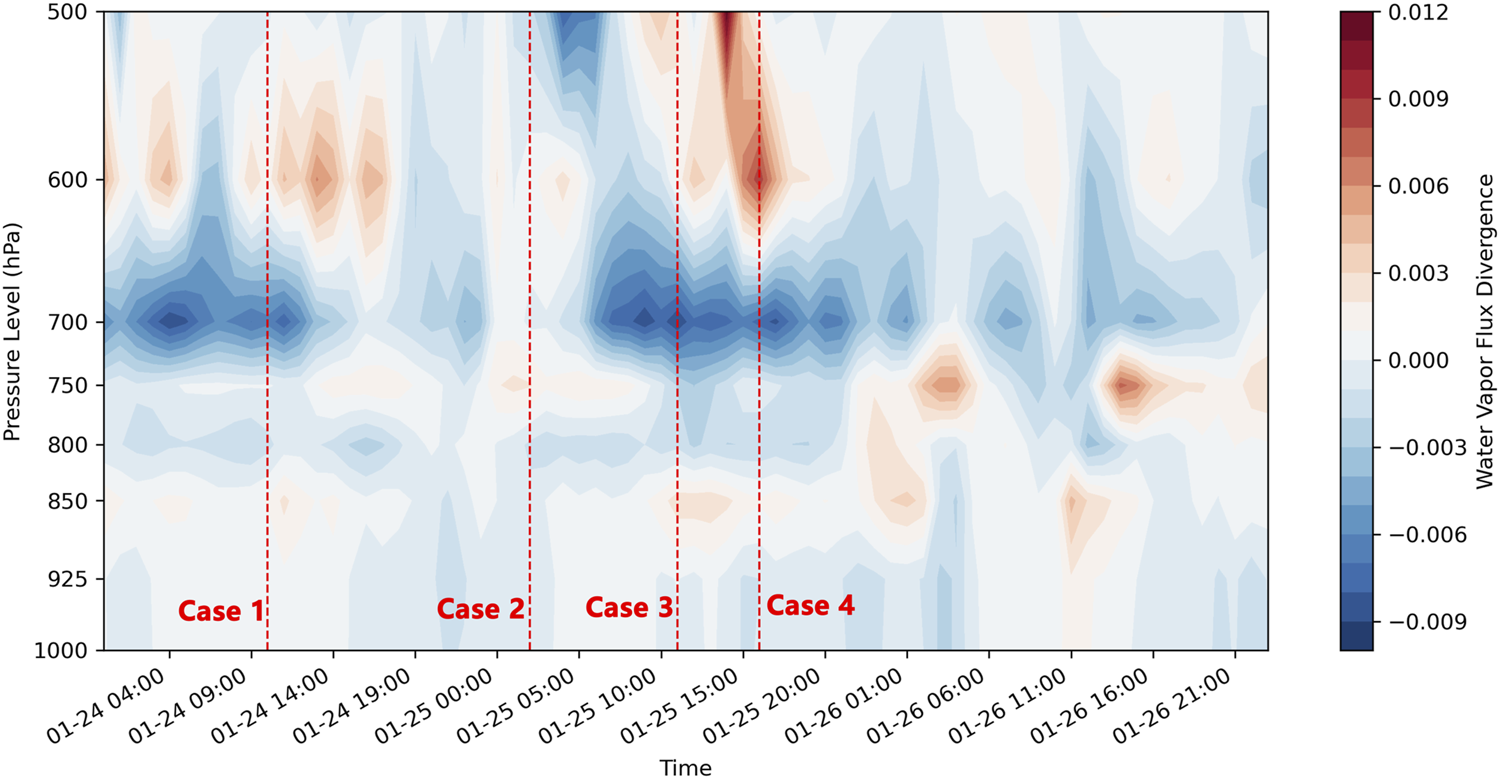
Time-height cross section of hourly water vapor flux divergence (unit: g·cm-2·h-1) from 24 to 26 January 2024 at the representative point of (107.25°E, 28.0°N). Red dashed lines mark the timing of four severe icing cases.
To more clearly analyze the location of the temperature inversion layer, Figure 6 shows the vertical profiles of air temperature and relative humidity (RH) during cases. As shown in Figure 6a, a distinct temperature inversion layer exists from 850 hPa to 700 hPa east of the YGQSF, where air temperature rises significantly with height. Besides, a pseudo-equivalent potential temperature () inversion layer is consistently observed in the lower-middle troposphere near the icing locations, establishing a thermally stable ‘warm-over-cold’ stratification () within the upper frontal zone (Figure 4). Evidence shows inversion layers persistently existed adjacent to icing points in these four severe icing episodes.
FIGURE 6

Vertical profiles of air temperature ((a), unit: °C) and relative humidity ((b), unit: %) at the point of (107.25°E, 28.0°N) for the four severe icing cases in Table 1.
Nevertheless, the mechanistic contribution of inversion layers to icing cases requires further exploration. Firstly, the temperature inversion layer can suppress vertical mixing and sustain supercooled liquid water within the inversion layer. The above-mentioned stable ‘warm-over-cold’ stratification and the temperature inversion layer suppress the development of further upward convective activity to the east of front, allowing supercooled liquid water droplets to persist in the upper cold air masses without freezing. Within the inversion layer (850–700 hPa), temperatures typically range from −8°C to 0°C (the most efficient range for icing), where supercooled liquid water rapidly freezes upon collides with aircraft surfaces.
Additionally, the inversion layer works like a lid, trapping moisture and creating a humid zone that extends from its base to its top (Figure 6b). The RH drops abruptly above the inversion layer top (Figure 6b). The layer of high relative humidity corresponds vertically with the altitude of strong moisture flux convergence shown in Figure 5. For instance, in Case 1, the RH reached 90%–100% within the inversion layer (850–700 hPa), which combined with the temperature inversion to form a reservoir of supercooled water conducive to icing formation (Wang et al., 2022). From the distribution characteristics of the specific cloud liquid water content (CLWC) and specific cloud ice water content (CIWC) in Figure 7, it can be seen that Case 1 occurred in areas with high cloud liquid water content and specific cloud ice water content (Figure 7a), indicating a convergent cloud with abundant supercooled liquid water (SLW) and ice-phase particles within the temperature inversion layer. In Cases 2, 3, and 4, both the CLWC and CIWC were concentrated within the inversion layer, indicating significant accumulation of supercooled cloud droplets within the temperature inversion zone (Figures 7b–d). Severe icing of Case 2 was precisely collocated with the peak cloud liquid water content (CLWC >0.2 g kg-1, Figure 7b), while exhibiting negligible cloud ice water content (CIWC ≈0). For Cases 1, 3, and 4, while the severe icing locations are not exactly at the center of the maximum CLWC, they are remarkably close to it, and the CLWC values can reach between 0.06 g kg-1 and 0.12 g kg-1 (Figures 7a,c,d). At the same time, the locations of severe icing in Cases 1, 3, and 4 are in areas with high cloud ice water content, with CIWC values reaching above 0.01–0.02 g kg-1. These findings indicate that severe icing in winter over Southwest China predominantly occurs within clouds characterized by both elevated supercooled liquid water content (SLWC) and limited ice-phase particles (Wang et al., 2022), while limited ice particles (CIWC: 0.01–0.02 g kg-1) prolong droplet lifetime (Figure 7).
FIGURE 7

Latitude–pressure cross section of the specific cloud liquid water content (shaded; unit: 10−2 g kg-1) and the specific cloud ice water content (contours; unit: 10−2 g kg-1) along the longitude where icing cases occurred, where the red plus signs indicate the locations of icing cases; (a) 2024-01-24 10:00 UTC; (b) 2024-01-25 02:00 UTC; (c) 2024-01-25 11:00 UTC; (d) 2024-01-25 16:00 UTC.
Thus, the temperature inversion related to the YGQSF forms strong cloud clusters on the eastern side of the stationary front, while the aircraft icing zones are precisely located within the area of high cloud water content. Figure 8 presents the latitude–pressure cross section of the Fraction of Cloud Cover (FCC), the specific rain water content, and the specific snow water content. The FCC distribution shows that cloud clusters are primarily concentrated in the temperature inversion layer, which is consistent with the location of the previously identified supercooled water reservoir. There is a cold air layer below the cloud clusters, where higher snow water content values can be found beneath the clouds, indicating that the freezing rain or sleet weather may occur over Guizhou Province on the eastern side of the YGQSF, especially in Cases 1, 3, and 4 (Figures 8a,c,d). However, Case 2 featured primarily liquid-phase precipitation below the cloud clusters, potentially attributable to the previously mentioned lack of ice-phase particles in the clouds (Figure 8b). Before the precipitation reaches the ground, the temperature rises above freezing, leading to higher rain water content values (Figure 8). In Cases 1 and 4, icing events occur not only within clouds but also in areas of high snow and rain water content, posing significant icing risks (Figures 8a,d). Prolonged high humidity conditions sustained the supply of supercooled water, intensifying aircraft icing severity. Aircraft flying for extended periods within these cloud clusters encounter a sufficient number of supercooled water droplets and abundant precipitation, leading to severe icing cases.
FIGURE 8

Latitude–pressure cross section of the fraction of cloud cover (shaded; value ranges from 0 to 1), the specific rain water content (blue contours; unit: g·kg-1), and the specific snow water content (black contours; unit: g·kg-1) averaged between 103.5°E and 107.0°E, where the red plus signs indicate the locations of icing cases; (a) 2024-01-24 10:00 UTC; (b) 2024-01-25 02:00 UTC; (c) 2024-01-25 11:00 UTC; (d) 2024-01-25 16:00 UTC.
3.2 Analysis of the cloud macro-characteristics of severe icing in the winter, Southwest China
For the four typical cases selected, analysis of the thermal and dynamic variables was performed to determine the characteristics of convective turbulence and the key factors impacting aircraft turbulence near convective clouds.
The following text analyses the macro-characteristics of clouds during four severe icing events using the FY-4A satellite data from January 24 to 25, 2024. As indicated by the previous analysis of circulation patterns, during these four icing events, the Southwest China was influenced by the Yunnan-Guizhou quasi-stationary front. During Case 1, cloud cover was predominantly observed over the northern sector of Southwest China, while the southern sector exhibited significantly lower cloud coverage (Figure 9a). In Case 2, the cloud coverage in the entire region reached nearly 100% (Figure 9b). Figure 10 shows the distribution characteristics of cloud phase (CLP) during the four events. From the figure, there is a significant amount of supercooled moisture within the cloud masses on the eastern side of the YGQSF (Thompson et al., 2017; Peng et al., 2023). It is evident that all the severe icing events occurred within supercooled clouds areas. Due to the presence of an inversion layer, supercooled clouds persist over the eastern Southwest China region, creating favorable conditions for severe icing (Figures 10a,b,d). Significant mixed-phase clouds can also be observed at the occurrence location of Case 3 (Figure 10c). Existing research confirms that both supercooled clouds and mixed-phase clouds are capable of inducing aircraft icing (Cober et al., 2001). The supercooled clouds show a southwest-northeast oriented band-like distribution, with cases 2, 3, and 4 in particular, where the supercooled clouds covered most of the Southwest China, including most of Guizhou, Chongqing, and the southeastern part of Sichuan. The aircraft’s long-duration flight through clouds rich in supercooled water may be a key factor in triggering severe icing.
FIGURE 9

The Cloud Fraction Ratio (CFR, unit: %) at the times of the four severe icing events, where the red plus signs indicate the locations where aircraft icing occurred; (a) 2024-01-24 10:00 UTC; (b) 2024-01-25 02:00 UTC; (c) 2024-01-25 11:00 UTC; (d) 2024-01-25 16:00 UTC.
FIGURE 10

The Cloud Phase (CLP) at the times of the four severe icing events, where the red plus signs indicate the locations where aircraft icing occurred. ‘0-4’ represents Clear, Water type, Super Cooled type, Mixed type, and Ice type, respectively; (a) 2024-01-24 10:00 UTC; (b) 2024-01-25 02:00 UTC; (c) 2024-01-25 11:00 UTC; (d) 2024-01-25 16:00 UTC.
Next, we will use FY-4A satellite data to analyse the cloud top temperature (CTT) and cloud top height (CTH) during the four icing events. Figures 11, 12 present the distribution of the CTT and CTH during four severe icing events in the Southwest China. As can be seen from the figures, the CTT over the Southwest China is generally between −35°C and 0°C, with a ‘colder in the north, warmer in the south’ distribution. The CTT in the northern part of the Southwest China is around −35°C to −15°C, while in the southern part, it is around −15°C–0°C. The cloud top temperature during the four severe icing events is approximately −25°C to −10°C. Similarly, during the four severe icing events, the cloud top height (CTH) in the Southwest China shows a ‘higher in the north, lower in the south’ distribution, with cloud top heights at the severe icing locations around 5–7 km. Since the CTH is relatively high and the cloud layer is thick, the four severe icing events occurred within an altitude range of 1,500–3,000 m. This indicates that the aircraft was likely to have flown for a long time within the clouds, potentially leading to the formation of severe icing.
FIGURE 11

The Cloud Top Temperature (CTT; unit: °C) at the times of the four severe icing events, where the red plus signs indicate the locations where aircraft icing occurred; (a) 2024-01-24 10:00 UTC; (b) 2024-01-25 02:00 UTC; (c) 2024-01-25 11:00 UTC; (d) 2024-01-25 16:00 UTC.
FIGURE 12

The Cloud Top Height (CTH; unit: m) at the times of the four severe icing events, where the red plus signs indicate the locations where aircraft icing occurred; (a) 2024-01-24 10:00 UTC; (b) 2024-01-25 02:00 UTC; (c) 2024-01-25 11:00 UTC; (d) 2024-01-25 16:00 UTC.
4 Conclusion
This study analyses four severe aircraft icing cases in Southwest China during the winter of 2023, exploring their atmospheric circulation characteristics and cloud macro-features. The following conclusions were drawn (
Figure 13):
(1) The winter severe icing over Southwest China were closely linked to a north-south-oriented Yunnan-Guizhou Quasi-Stationary Front (YGQSF). At 500 hPa, the subtropical high was displaced south of 20°N, while high-latitude regions were influenced by the Northeast China Cold Vortex (NCCV) and Mongolian High, driving pronounced meridional circulation that facilitated cold air advection southward. At 850 hPa, the synergistic interaction between the cold high-pressure system and NCCV intensified East Asian meridional circulation, triggering strong convergence of warm-moist and dry-cold air over Southwest China. Topographic uplift forces the warm-moist air to ascend into upper levels, where it transitions to westerly flow at 700 hPa, inducing the formation of convergent cloud clusters and the further horizontal cloud expansion. Moreover, a cold closed vertical circulation cell (the green circle in Figure 13) can be found on the eastern flank of YGQSF, which can sustain cold air masses and frontal cloud clusters over Southwest China, triggering the severe icings within the cold air mass (−8∼-4°C) enriched with supercooled water droplets.
(2) This study elucidates the critical role of temperature inversion layers on the cold side of the YGQSF in winter severe icing in Southwest China. The inversion layer (850–700 hPa) generally triggers robust cloud cluster development east of the YGQSF, trapping supercooled liquid water (SLW) within the efficient icing temperature range (−10–0°C) by suppressing vertical mixing and maintaining a “warm-over-cold” thermal structure (). Continuous moisture flux convergence coupled with high relative humidity (RH >90%) forms a persistent SLW reservoir east of the frontal zone within the top of inversion layer (Figures 5, 6). Meanwhile, severe icing in Southwest China occurs in clouds with elevated SLW content (0.06–0.2 g kg-1) and limited ice-phase particles (0.01–0.02 g kg-1). Besides, the vertical thermal structure ahead of the YGQSF facilitates the formation of mixed-phase precipitation (freezing rain or sleet weather). Aircraft traversing these regions encounter prolonged SLW exposure and mixed-phase precipitation, inducing severe icing.
(3) The cloud coverage in the areas of severe icing reached 100%. All four cases of severe icing occurred in supercooled clouds, with the cloud layers oriented from southwest to northeast. Particularly in cases 2, 3, and 4, the supercooled clouds covered most of Southwest China. The cloud top temperatures ranged from −25°C to −10°C, and the cloud top heights exhibited a “higher in the north, lower in the south” distribution pattern. Additionally, all events occurred in clouds with cloud top heights between 5 and 7 km.
FIGURE 13

Conceptual model of severe winter aircraft icing weather patterns influenced by the Yunnan-Guizhou Quasi-Stationary Front in Southwest China.
5 Discussion
The circulation characteristics and cloud macro-characteristics of severe aircraft icing in the winter of Southwest China are analyzed in the present paper. It finds that the occurrence of severe icing in winter in this region is closely related to the presence of the Yunnan-Guizhou quasi-stationary front (YGQSF). Although this front provides favourable weather conditions for severe icing events, its specific dynamic mechanisms, especially the alternating effects of cold and warm airflows at the frontal zone, still need to be further revealed through more in-depth numerical simulations and observational analyses. Future research can focus on collecting more icing cases to analyze the variations in this circulation system and its effects on local icing events, providing a theoretical basis for more precise early warning of severe icing events. Besides, future research could utilize high-resolution numerical weather prediction models to improve the forecasting timeliness and accuracy of CTT, CTH, and other factors prior to the occurrence of icing, particularly for early warnings in high-risk icing areas.
Statements
Data availability statement
The original contributions presented in the study are included in the article/supplementary material, further inquiries can be directed to the corresponding author.
Author contributions
YW: Writing – original draft, Writing – Review & Editing, Methodology, Investigation, and Funding acquisition. CW: Writing – original draft, Writing – Review & Editing, Data curation, Methodology, Software, and Funding acquisition. ZW: Writing – Review & Editing, Formal analysis, Investigation, Visualization, and Software. RW: Writing – Review & Editing, Data curation, Investigation, and Software. MY: Writing – Review & Editing, Methodology, Software, and Funding acquisition.
Funding
The author(s) declare that financial support was received for the research and/or publication of this article. This research was jointly Supported by Sichuan Science and Technology Program, grant number 2025ZNSFSC1137 and 2022NSFSC1149, and the General Program of the Innovation and Development Special Project of the China Meteorological Administration (No. CXFZ2025J061), and the Open Foundation of China Meteorological Administration Key Laboratory for Aviation Meteorology (No. HKQXM-2024022), and the Fundamental Research Funds for the Central Universities (No. 24CAFUC01003).
Acknowledgments
Special thanks to the reviewers for their valuable comments.
Conflict of interest
The authors declare that the research was conducted in the absence of any commercial or financial relationships that could be construed as a potential conflict of interest.
Generative AI statement
The author(s) declare that no Generative AI was used in the creation of this manuscript.
Publisher’s note
All claims expressed in this article are solely those of the authors and do not necessarily represent those of their affiliated organizations, or those of the publisher, the editors and the reviewers. Any product that may be evaluated in this article, or claim that may be made by its manufacturer, is not guaranteed or endorsed by the publisher.
References
1
Bolgiani P. Fernandez-Gonzalez S. Martin M. L. Valero F. Merino A. García-Ortega E. et al (2018). Analysis and numerical simulation of an aircraft icing episode near Adolfo Suarez Madrid-Baraj as International Airport. Atmos. Res.200, 60–69. 10.1016/j.atmosres.2017.10.001
2
Cai D. P. Tao L. F. Yang X. Q. Sang X. Z. Fang J. B. Sun X. G. et al (2022). A climate perspective of the quasi-stationary front in southwestern China: structure, variation and impact. Clim. Dyn.59, 547–560. 10.1007/s00382-022-06151-1
3
Carrière J. M. Alquier S. Le B. C. Moulin E. (1997). Statistical verification of forecast icing risk indices. Meteor. Appl.4 (2), 115–130. 10.1017/S1350482797000443
4
Casqueiro B. C. Trigo I. Belo-Pereira M. (2023). Characterization of icing conditions using aircraft reports and satellite data. Atmos. Res.293 (24), 106884. 10.1016/j.atmosres.2023.106884
5
Chen J. Lu H. Y. (2006). Dynamic diagnosis on aircraft icing under a convective instability meteorological condition. Meteorol. Mon.32 (12), 66–71. 10.7519/j.issn.1000-0526.2006.12.011
6
Chi Z. P. (2007). Statistical analysis and numerical prediction experiment of weather conditions for aircraft icing. Meteorological Sci. Technol.35 (05), 714–718. 10.3969/j.issn.1671-6345.2007.05.021
7
Cober S. G. Isaac G. A. (2011). Characterization of aircraft icing environments with supercooled large drops for application to commercial aircraft certification. J. Appl. Meteorology & Climatol.51 (2), 265–284. 10.1175/JAMC-D-11-022.1
8
Cober S. G. Isaac G. A. Strapp J. W. (2001). Characterizations of aircraft icing environments that include supercooled large drops. J. Appl. Meteorology Climatol.40 (11), 1984–2002. 10.1175/1520-0450(2001)040<1984:coaiet>2.0.co;2
9
Curry J. A. Liu G. (1992). Assessment of aircraft icing potential using satellite data. J. Appl. Meteor. Climatol.31, 605–621. 10.1175/1520-0450(1992)031<0605:aoaipu>2.0.co;2
10
Du Y. Zhang C. Li X. Chen X. Z. Wang S. Q. (2023). Spatial and temporal variation characteristics of Chinese aircraft icing based on IC index and its relationship with the atmospheric circulation. Clim. Change Res. Lett.12 (3), 502–513. 10.12677/CCRL.2023.123052
11
Fernández-González S. Sánchez J. L. Gascón E. López L. García-Ortega E. Merino A. (2014). Weather features associated with aircraft icing conditions: a case study. Sci. world J.2014, 1–18. 10.1155/2014/279063
12
Liu H. Y. Peng S. R. Fang R. Li Y. H. Duan L. Wang T. et al (2024). Analysis of the meteorological conditions and atmospheric numerical simulation of an aircraft icing accident. Atmosphere15, 1222. 10.3390/atmos15101222
13
Liu K. Y. Shen H. X. Li X. L. Liang A. M. (2005). Analysis of an aircraft-icing event in taiyuan airport. Meteorol. Mon.31 (12), 23–27. 10.3969/j.issn.1000-0526.2005.12.004
14
Louka P. Samos I. Gofa F. (2024). Forecasting in-flight icing over Greece: insights from a low-pressure system case study. Atmosphere15 (8), 990. 10.3390/atmos15080990
15
Pang Z. Y. Zhang Y. X. (2008). Weather conditions of aircraft icing in the middle part of Gansu Province. Arid. Meteorol.26 (3), 53–56. 10.3969/j.issn.1006-7639.2008.03.010
16
Peng C. Song C. Cai M. (2023). Comprehensive observation of the cloud macro- and microstructures of a rare aircraft icing case in henan province. Chin. J. Atmos. Sci.47 (6), 1757–1769. 10.3878/j.issn.1006-9895.2208.21044
17
Politovich M. K. Bernstein T. A. O. (2002). Aircraft icing conditions in northeast Colorado. J. Appl. Meteorology Climatol.41, 118–132. 10.1175/1520-0450(2002)041<0118:aicinc>2.0.co;2
18
Schultz P. Politovich M. K. (1992). Toward the improvement of aircraft-icing forecasts for the continental United States. Weather Forecast.7 (3), 491–500. 10.1175/1520-0434(1992)007<0491:ttioai>2.0.co;2
19
Sun Y. H. Zhang B. Liu W. Liu C. L. Huang W. Z. Liu Z. H. et al (2023). Study on the characteristics and mechanism of aircraft ice accumulation under the background of upper-air cold Vortex. Meteorol. Mon.49 (8), 972–984. 10.7519/j.issn.1000-0526.2023.042001
20
Suo M. Q. Ding Y. H. Lu Y. B. Tang S. Fan X. J. Li J. H. (2018). Effects of quasi-stationary fronts in southern China on large-scale freezing rain in winter. Acta Meteorol. Sin.76 (4), 525–538. 10.11676/qxxb2018.023
21
Thompson G. Politovich M. K. Rasmussen R. M. (2017). A numerical weather model's ability to predict characteristics of aircraft icing environments. Weather Forecast.32 (1), 207–221. 10.1175/WAF-D-16-0125.1
22
Wang J. H. Xie B. Z. Cai J. H. (2020). The distribution of aircraft icing accretion in China—preliminary study. Atmosphere11 (8), 876. 10.3390/atmos11080876
23
Wang P. Y. Ruan Z. (2002). Mesoscale numerical forecast for supercooled cloud water in convective cloud of south China-the main meteorological factor responsible for aircraft icing. J. Trop. Meteorology18 (04), 399–406. 10.16032/j.issn.1004-4965.2002.04.014
24
Wang Q. Wu J. J. (2018). Analysis of weather conditions for aircraft icing in low-level flight in Sichuan Basin. Meteorological Sci. Technol.46 (04), 799–808. 10.19517/j.1671-6345.20170375
25
Wang Z. L. Zhou X. Wu J. H. Li B. P. Lin Y. J. Yan W. H. et al (2022). Weather conditions and cloud microphysical characteristics of an aircraft severe icing progress. J. Appl. Meteorological Sci.33 (05), 555–567. 10.11898/1001-7313.20220504
26
Wen Y. Wang C. Wang R. Y. Nie R. Y. (2024). Physical quantity characteristics of severe aircraft turbulence near convective clouds over Australia. Front. Earth Sci.12, 1393032. 10.3389/feart.2024.1393032
27
Xu H. Cheng Y. Q. Li Y. C. Liu G. P. Liu J. D. (2015). Statistical analysis on the low level windshear and its impacts on the flight safety at Nyingchi Airport. Plateau and Mountain Meteorology Research35(3), 45–49. 10.3969/j.issn.1674-2184.2015.03.007
28
Yang F. T. Luo H. (2024). Spatiotemporal characteristics and meteorological conditions of aircraft ice accumulation in Guizhou region. Clim. Change Res. Lett.13 (03), 488–496. 10.12677/ccrl.2024.133052
29
Yang Q. Zhang H. P. Wu J. R. Li H. Zeng H. R. Lu Z. Q. (2023). Simulation of a multi-phase precipitation process over Yungui-Huanan quasi-stationary front in winter. J. Arid Meteorology42 (1), 75–83. 10.11755/j.issn.1006-7639(2024)-01-0075
30
Yang W. X. Zhou Y. Q. Sun J. Wu Z. H. (2014). Observational studies of distribution characteristics of supercooled cloud water during a westerly trough process. Acta Meteorol. Sin.72 (3), 583–595. 10.11676/qxxb2014.032
31
Zhao P. G. Xiao H. Liu C. Zhou Y. J. (2021). Dependence of Warm Season Cloud-to-Ground Lightning Polarity on Environmental Conditions over Sichuan, Southwest China. Advances in Meteorology1500470, 1–12. 10.1155/2021/1500470
32
Zhou X. X. Li Y. Y. Zhang C. (2023). Study on the forecasting method and application scenario of aircraft icing. Meteorol. Mon.49 (4), 415–426. 10.7519/j.issn.1000-0526.2023.030702
Summary
Keywords
Southwest China, aircraft icing, quasi-stationary front, cloud top temperature, supercooled water
Citation
Wen Y, Wang C, Wang Z, Wang R and Yuan M (2025) Analysis of the characteristics of four severe aircraft icing events in Southwest China during the winter of 2023. Front. Earth Sci. 13:1586116. doi: 10.3389/feart.2025.1586116
Received
02 March 2025
Accepted
26 May 2025
Published
20 June 2025
Volume
13 - 2025
Edited by
Chenghai Wang, Lanzhou University, China
Reviewed by
Di Wu, Civil Aviation University of China, China
YanHui Li, Gansu Sub-Bureau of Northwest Air Traffic Management Bureau of Civil Aviation of China, China
Updates
Copyright
© 2025 Wen, Wang, Wang, Wang and Yuan.
This is an open-access article distributed under the terms of the Creative Commons Attribution License (CC BY). The use, distribution or reproduction in other forums is permitted, provided the original author(s) and the copyright owner(s) are credited and that the original publication in this journal is cited, in accordance with accepted academic practice. No use, distribution or reproduction is permitted which does not comply with these terms.
*Correspondence: Chao Wang, wonchaos@cafuc.edu.cn
† Present address: Ying Wen, China Meteorological Administration Key Laboratory for Aviation Meteorology, Civil Aviation Flight University of China, Guanghan, China Chao Wang, China Meteorological Administration Key Laboratory for Aviation Meteorology, Civil Aviation Flight University of China, Guanghan, China Min Yuan, China Meteorological Administration Key Laboratory for Aviation Meteorology, Civil Aviation Flight University of China, Guanghan, China
Disclaimer
All claims expressed in this article are solely those of the authors and do not necessarily represent those of their affiliated organizations, or those of the publisher, the editors and the reviewers. Any product that may be evaluated in this article or claim that may be made by its manufacturer is not guaranteed or endorsed by the publisher.