 Xiaoyun Kong1,2,3Haibo An3
 Mingsheng Hao1,2,3,4*Changlong Zhang1,2,3Congcong Yang1,2,3Tao Jia1,2,3Xi Wang1,2,3Shanlin Wang5
 Shiliang Liu5
- 1Shandong Engineering Research Center for Environmental Protection and Remediation on Groundwater, Jinan, China
- 2Shandong Provincial Geo-mineral Engineering Exploration Institute, Jinan, China
- 3801 Institute of Hydrogeology and Engineering Geology, Shandong Provincial Bureau of Geology & Mineral Resources, Jinan, China
- 4Shandong Provincial Geological and Mineral Exploration and Development Bureau, Jinan, China
- 5School of Civil Engineering, Shandong University, Jinan, Shandong Province, China
The fluctuation of the groundwater level at a construction site is crucial in determining the design of the anti-floating water level. The design of the anti-floating water level is mainly based on the water level measured during the survey period combined with the information acquired from surrounding engineering. However, this approach fails to predict the future variation of groundwater level, which can potentially endanger the safety during the construction process and building occupancy. Therefore, a comprehensive method for determining the anti-floating water level is proposed based on the research background of expanding the airport site in Jinan. In conjunction with the actual survey of the expanded airport, numerical simulation research is conducted to predict the anti-floating water level under groundwater changes at three different depths of 3, 8, and 16 m. The anti-floating water levels corresponding to the depths are 19.2–18.3 m, 19.1–18.3 m, and 18.9 m−18.1 m, respectively. The analysis of the changes in groundwater level and precipitation in the site reveals a linear relationship between groundwater level and precipitation during January 2018 to December 2022. In addition, a quantitative theoretical calculation method for anti-floating water levels is proposed. Finally, a comprehensive comparison is performed between the anti-floating water level based on groundwater level and rainfall data and the simulated anti-floating water level. The measured and simulated anti-floating water levels are essentially the same in the western part of the study area, while the anti-floating water level obtained from the numerical simulation is lower in the southeast and higher in the northeast region. On this basis, the highest value among the measured and simulated is taken, and the anti-floating water level of the site is divided. The anti-floating measurements are proposed.
1 Introduction
With the exponential population growth and urban construction expansion, mankind is increasingly utilizing underground space. This has led to a widespread application of underground engineering in various areas such as airport construction, underground parking lots, underground rail transit, and others. Such engineering construction inevitably requires the excavation of deep foundation pits, with foundations buried in deeper strata (Gu, 2003; Wang et al., 2024). In areas with high groundwater levels, underground constructions often experience buoyancy due to the upward pressure exerted by groundwater. If the upward buoyant force exerted by water exceeds the downward gravitational force acting on the structure, it can cause upward arching or cracking of the bottom plate of the structure. When the buoyant force exerted by water is considerable, it can cause the entire structure to rise and displace, making it unusable (Yuan, 2007; Ren et al., 2024). The design of the anti-floating water level is mainly based on the water level measured during the survey period, combined with the information acquired from surrounding engineering. However, this approach cannot predict future extreme fluctuations in groundwater level, leading to safety hazards during the construction process and building occupancy. Therefore, there is an urgent need to propose a comprehensive method to determine a reasonable anti-floating water level that can provide much-needed theoretical and practical support.
Engineering construction activities inevitably disturb the groundwater system, causing fluctuations in groundwater levels, land subsidence, and difficulties in water resource management (Lee et al., 2024; Wang et al., 2018; Watson et al., 2022; Kim et al., 2023), and even affecting engineering safety (De Caro et al., 2020; Mondal, 2024; Li et al., 2024). The “Technical Standard for Anti-floating of Building Engineering” specifies that the anti-floating water level should be the highest groundwater level the structure can encounter from construction until the end of its service life (Ministry of Housing and Urban-Rural Development of the People’s Republic of China, 2019). Several scholars have proposed methods for determining the underground anti-floating water level and anti-floating measures designed to conditions specific to their research areas. They considered various natural and human factors for the studies, such as geological, building, and geomorphic conditions (Yu et al., 2020; Luo et al., 2020; Zhu et al., 2014). Kong et al. conducted a comprehensive study on the anti-floating water level of the underground (Kong and GuanYN, 2023). Li provided a comprehensive overview of the current state of anti-floating techniques for underground structures (Li, 2018). They analyzed the advantages, disadvantages, and applicability of different anti-floating measures. They indicated that the anti-floating water level should be determined based on the project’s specific conditions during the design process, and then appropriate anti-floating measures should be selected. Zhao considered the floating underground garage incident in a residential area in Hangzhou as the basis of their research and proposed improvement measures and calculation methods to address the shortcomings of the current anti-floating design methods for basements (Zhao, 2013; Mei and Song, 2019; Luo et al., 2022). Han et al. systematically analyzed the hydrogeological conditions and interannual dynamic variations in groundwater levels in the study area (Han et al., 2024). They determined the recommended elevation of the anti-floating water level for underground structures using numerical simulation and analogy prediction methods. They further employed numerical simulation and physical similarity simulation methods to predict the groundwater flow field or anti-floating water level of the construction site in the study area. An et al. employed Visual MODFLOW to predict the groundwater flow field of the site and determine the reasonable anti-floating water level (An et al., 2015). Zhang et al. conducted physical similarity experiments to quantify the variations in resistance during the upward movement of tunnels under different radii and surface water levels (Zhang RZ. et al., 2023). They revealed the underlying mechanism of soil damage during the overall upward movement of the tunnel. In addition, they developed the calculation method to determine the minimum burial depth of shield tunnels under different surface water levels during the construction period. Sun et al. extensively investigated the design of overburden thickness for shield tunnels in terms of face and anti-floating stability (Sun et al., 2023). Chen et al. investigated the effects of anti-floating and geological permeability coefficient on the retaining structure of a foundation pit under high water levels (Chen et al., 2022). Rastorguyev and Mukhina utilized the Dhi Feflow Software Package to solve groundwater flow issues at the site of hydroelectric power plants under construction (Rastorguyev and Mukhina, 2023). The research involved on-site monitoring and utilized both theoretical and numerical methods.Zhao et al. used numerical simulation to analyze the change law of groundwater seepage field in a riverside area of Zhuzhou, combined with groundwater monitoring data, and finally determined its anti-floating waterproof level, and their engineering practice results showed that the anti-floating waterproof level determined by this method was safe and feasible (Zhao and Zhou, 2024).
Determining the anti-floating water level for underground engineering structures is highly complex, and there is no established standardized technical methodology (Xu et al., 2019). Generally, the determination of anti-floating water level is often based on on-site experience in engineering practice. In light of this, this study proposes a method utilizing actual airport surveys and numerical simulations to predict the anti-floating water level of groundwater evolution under three different depth foundations: 3, 8, and 16 m. It analyzes the fluctuations in groundwater level and precipitation in the observation holes at the site and presents a quantitative method for calculating the anti-floating water level. Finally, a comparative analysis is conducted to compare the anti-floating water level based on long-term water level and rainfall data with the simulated anti-floating water level. The anti-floating water level of the site is divided to provide a scientific basis for anti-floating design. The research results are of great significance for engineering disaster prevention and mitigation, especially for areas with complex hydrogeological conditions.
2 Materials and methodology
2.1 Study area
The study area is situated in a prime geographical location and is conveniently located near multiple transportation hubs: east of the Ring Expressway in Licheng District, Jinan City; west of Yaoqiang Airport Road; 50 m north of Huayi Hotel (Jinan Airport Branch) in Licheng District; and adjacent to Jinan Yaoqiang Airport. Jinan City lies in the warm temperate continental monsoon climate zone, with an average annual precipitation of 665.7 mm and an average annual evaporation of 1525.6 mm. The study area is part of the Yellow River alluvial plain landform unit, and the site has a predominantly flat landscape (Figure 1). The regional geological data shows that no fault structures are present within the site area.
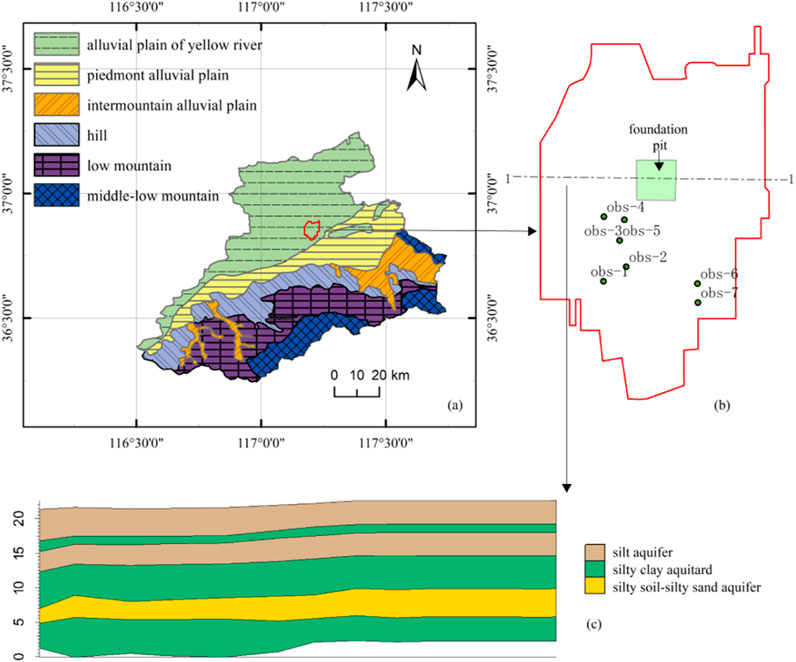
Figure 1. Schematic diagram of the location and geological structure of the research area site.
The site is in the runoff area between the Yellow and Xiaoqing Rivers. Groundwater is primarily found in silt, silty sand, and locally distributed fine sand. This type of groundwater is called pore groundwater. The main sources of groundwater recharge are lateral recharge from the Yellow River and precipitation. Evaporation, groundwater runoff, and artificial water intake are the main causes of discharge. During the exploration period, the stable depth of groundwater in the study area ranged from 2.30 to 3.60 m, with an average depth of 2.91 m. The stable water level elevation ranged from 17.94 to 19.77 m, with an average elevation of 18.83 m.
The investigation and comparative analysis of regional geological data reveal that the lithology of the strata in the site can be categorized as follows based on their genesis and age: Quaternary Holocene plain fill(Mainly silt), miscellaneous fill(Mainly silt), filling soil(Mainly silt), silty clay, silt, fine sand, and Upper Pleistocene silty clay. The site is located in the alluvial plain of the Yellow River, where the Quaternary system is relatively thick and the terrain is flat. The general trend of shallow, deep groundwater flow is from southwest to northeast, consistent with the direction of surface water flow and terrain slope. The riverbed of the Yellow River is higher than the surface, and in the wet season, the groundwater in the site, the Xiaoqing River and the Yellow River have a large head difference, so the lateral recharge of the river is strong. Groundwater is primarily recharged by atmospheric precipitation and the Yellow River side seepage. In contrast, the main ways of discharge are artificial mining, runoff discharge, and vertical evaporation during the dry season.
2.2 Methodology
2.2.1 Overall thinking of the research
Combined with numerical simulation, mathematical statistics, and theoretical analysis, a comprehensive method for determining the anti-floating water level is proposed. The technical roadmap of the study is shown in Figure 2.
Figure 2. Technical roadmap.
2.2.2 Numerical simulation
2.2.2.1 Model generalization
The hydrogeological conceptual model is structured into six levels, arranged in a vertical sequence based on the distribution of strata in the study area. From top to bottom, these layers consist of silt, silty-clay, silt, silty-clay, silt-powder sand soil and silty-clay layers. The study area has two types of groundwater: Quaternary loose layer pore groundwater and shallow micro-confined water. The Quaternary pore groundwater primarily exists in the Holocene and Upper Pleistocene alluvial deposits, with localized micro-confined pressure. The main aquifers are the first layer of silt, the third layer of silt, and the fifth layer of silt-powder sand soil layer. The silty clay layer has weak permeability, and the groundwater in this area can be generalized as a three-dimensional groundwater flow.
The northwestern section of the site is close to the Yellow River, while the southeastern section is near the Xiaoqing River, receiving recharge from the rivers. The perennial lateral recharge of the Yellow River is fed by the aquifers on both sides, and the hydraulic slope is between 0.2‰ and 0.5‰. Therefore, the northwest and southeast boundaries of the site are generalized as lateral recharge boundaries. The groundwater level in the site gradually decreases along the boundary from north to south. Thus, the northern boundary is designated as the lateral recharge boundary, and the southern boundary is designated as the lateral discharge boundary. The upper section of the site is affected by rainfall and evaporation and can be generalized as a boundary separating the recharge and evaporation regions. The lower section of the site has a layer of silty clay, which has low permeability and can be classified as a water barrier boundary.
A mathematical groundwater flow model is developed using the conceptual model (Equation 1) (Chen and Lin, 2011; Yi and Xu, 2009).
where Ω is the calculation area for groundwater; H (x, y, z, and t) is the water head elevation at any point in the area, m; H0 (x, y, z) is the initial water level, m; K is the permeability coefficient; B is the elevation of the aquifer floor, m; W is the source-sink term; µs is the water storage coefficient or water supply degree; q is the lateral supply or discharge amount; Γ2-1 is the lateral supply or discharge boundary; Γ2-2 refers to the waterproof boundary.
2.2.2.2 Numerical model construction
A numerical model of the study area was developed using the GMS software. The study area was discretized into 100 rows by 100 columns on a two-dimensional plane, with six layers vertically. This results in a total of 60,000 grid cells, of which 35,043 grid cells were considered effective grids. April 2021 is used as the initial simulation time, December 2027 is used as the end simulation time, 1 month is a stress period, the time step is 10 days, and the step growth factor is 1. The simulation results were identified and validated with water level monitoring data from April to July 2024. The hydrogeological parameters of the formation were calculated utilizing parameter inversion and estimating methods and based on a comprehensive analysis of factors such as pumping experiments, indoor tests, and hydrogeological conditions. The determined parameters are presented in Table 1.
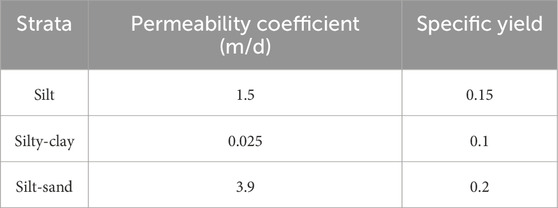
Table 1. Hydrogeological parameters.
2.2.2.3 Model recognition and validation
The period from 15 April 2022, to 27 July 2022, is selected as the validation period for the model, and the calculated values are compared to the fitted values. The error value is obtained by subtracting the observed value from the simulated value at the corresponding time, and the mean absolute value of the error is then calculated.
2.2.3 Numerical simulation and prediction of anti-floating water level
The variation in groundwater level was simulated and predicted under three different depths (3, 8, and 16 m) of foundations based on the actual construction requirements. The surface elevation of the study area ranges from 21 to 22 m. The groundwater in this area is mainly stored in silt and sand, namely, the model’s first, second, and third layers. The anti-floating water level varies depending on the aquifer in which the bottom of the foundation hole is placed. Therefore, three typical depths of 3, 8, and 16 m were selected for prediction, and the range of anti-floating water level was determined based on the groundwater level.
2.2.4 Method for determining anti-floating water level based on groundwater level and rainfall data
Soil water retention capacity significantly influences groundwater recharge patterns and fluctuations (Beck-Broichsitter et al., 2023). There are seven water-level observation holes in the site area. These observation holes are located in the fifth layer of the silt-silt aquifer, as shown in Figure 1B. The rainfall data is obtained from meteorological station data during January 2018 to December 2022. The observation holes are employed to analyze the changes in groundwater level and precipitation.
The variation law and functional relationship of observed water level with rainfall are obtained based on the site’s observed water level and rainfall data in recent years. The anti-floating fortification water level value of the site is determined by calculating the maximum historical water level value of the site, considering the highest water level, rainfall during the survey period, and the historical highest rainfall data (Hu and Chen, 2018). The anti-floating water level value of the structure can be calculated using the following formula (Equation 2):
where H is the value of the anti-floating water level in the site area, m; Hkmax is the highest groundwater level in the site area recorded during the survey period, m, and the maximum stable water level measured by on-site technical personnel in the site area; ΔH0 is the possible increase in groundwater level caused by unexpected replenishment, m, determined based on the site environmental and hydrogeological conditions; ΔHe is the maximum head value of the groundwater relative to the survey in this layer, m, which can be obtained based on the long-term water level and historical rainfall data of the site in recent years.
3 Results and discussions
3.1 Numerical model validation
In Figure 3, the point with the highest fitting error during the validation period is obs-6, with a maximum fitting error of 0.772 m and an average absolute error value of 0.577. The point with the lowest fitting error is obs-3, with a minimum fitting error value of 0.009 m and an average absolute error value of 0.322 m 85.7% of the data points have an average absolute error of water level fitting within 0.5 m, indicating a good fitting situation. This indicates that the mathematical model can simulate the aquifer, and the selection of hydrogeological parameters in the study area can effectively reflect the characteristics of the aquifer in the study area. The developed model can be used for water level simulation and prediction.
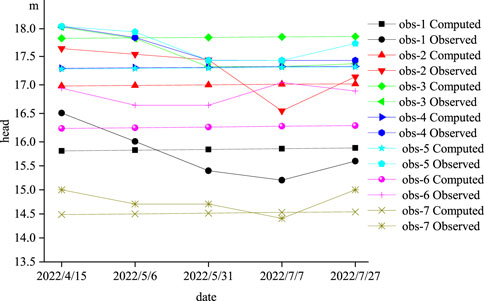
Figure 3. The curve of the water level fitting process for observation wells in the study area.
3.2 Numerical simulation and prediction of anti-floating water level
Considering that there may be differences in the sensitivity of different locations in the study area to the same parameter, 1,4,6 observation holes were selected as representatives for analysis. The water supply degree and permeability coefficient were used as parameters, and the change range was set to 10%, 20%, 30%, −10%, −20%, and −30%, and the sensitivity of the parameters was judged by the water level change range. The result of the water level change at obs-1, obs-4 and obs-6 are presented in Tables 2–5.

Table 2. The result of the water level change at obs-1.
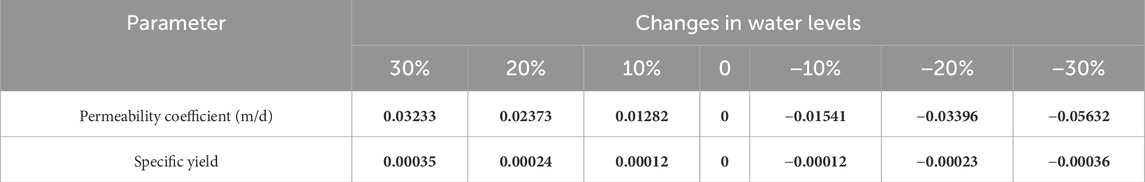
Table 3. The result of the water level change at obs-4.
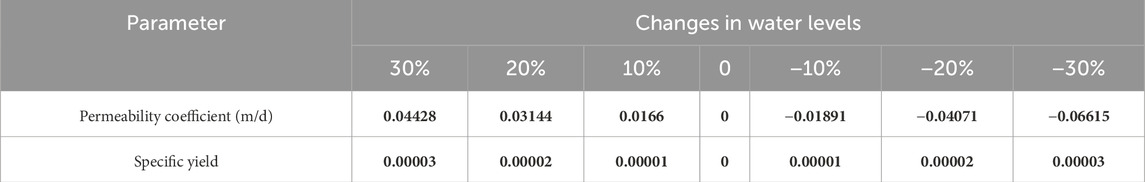
Table 4. The result of the water level change at obs-6.
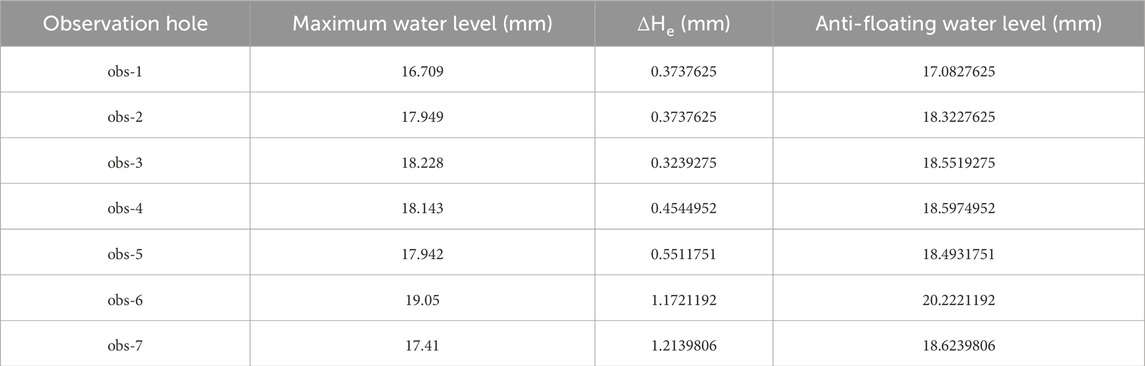
Table 5. Statistical results of anti-floating water level in observation holes.
Through the response analysis of the permeability coefficient and water supply degree under different parameters, it can be seen that the influence of the model parameters on the two hydrological parameters is significantly different, and it shows obvious directional characteristics. In terms of permeability coefficient, the effect of parameter changes shows a significant asymmetry.The amplitude of water level change caused by the positive change of permeability coefficient is less than that of the negative change. In contrast, the response of the water supply to the change of parameters is relatively flat. Although it also shows the symmetrical response when the parameters change positively and negatively, the amplitude of the change is small overall.
3.3 Numerical simulation and prediction of anti-floating water level
3.3.1 16 m depth basic water level forecast
The 16 m foundation primarily rests on the first layer of the silt-powder sand soil aquifer. Hence, the water level of the first layer of the silt aquifer corresponds to the water level of the 16 m foundation. The water level in the study area during the wet season is shown in Figure 4. Assuming average annual rainfall and abundant water period, the groundwater level in the area where the foundation is located reaches a maximum of 18.9 m and a minimum of 18.1 m.

Figure 4. Contour map of groundwater level at a depth of 16 m.
3.3.2 8 m depth foundation water level forecast
The 8 m foundation is located on the third layer of the silt aquifer. Hence, the water level of the third layer of the silt aquifer corresponds to the water level of the 8 m foundation. Figure 5 displays the water level in the study area during the wet season. Under average annual rainfall and abundant water period, the groundwater level in the study area where the foundation is located is highest at 19.1 m and lowest at 18.3 m.
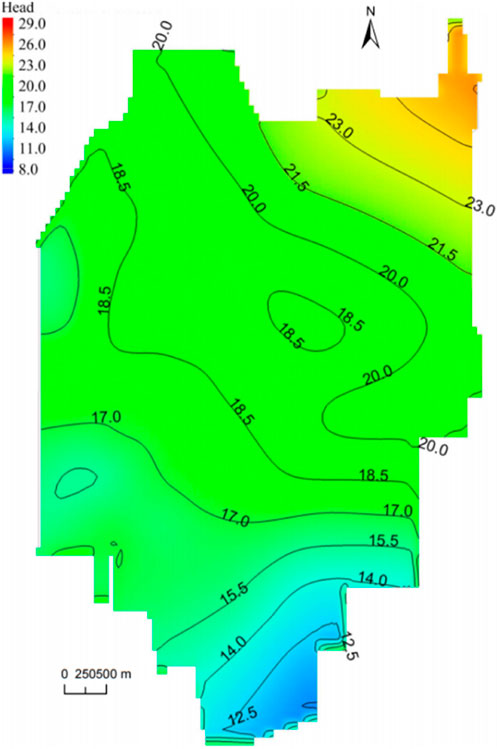
Figure 5. Contour map of groundwater level at a depth of 8 m.
3.3.3 3 m depth foundation water level forecast
The 3 m foundation is located on the fifth layer of the silt aquifer, so the water level of the fifth layer of the silt-silt aquifer corresponds to that of the 3 m foundation. The water level in the study area during the wet season is presented in Figure 6. The groundwater level in the area where the foundation is at its highest at 19.2 m and its lowest at 18.3 m during abundant water and average annual rainfall.
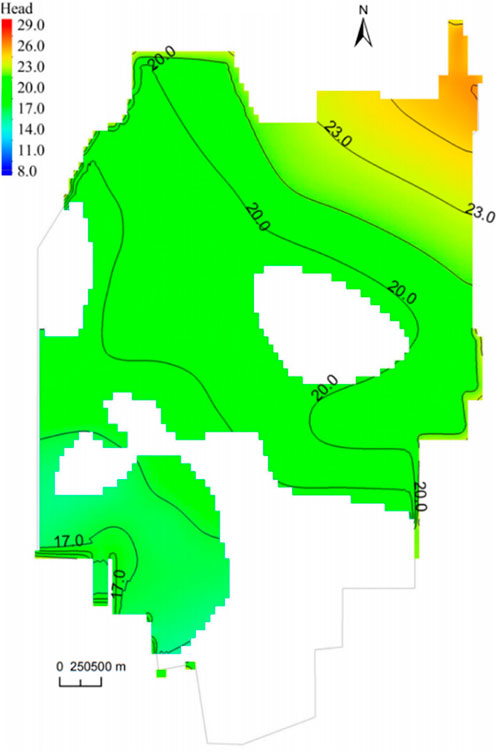
Figure 6. Contour map of groundwater level at a depth of 3 m.
3.3.4 Long-term projection uncertainty in AFWL determination
The uncertainties in the projections of the water level resistance (AFWL) are mainly due to the complex interaction of climate change, extreme rainfall events, and groundwater extraction trends. Climate change may lead to long-term declines in AFWL by changing precipitation patterns and enhancing evapotranspiration by affecting groundwater recharge efficiency, while extreme rainfall events may trigger short-term water level fluctuations, but their actual impacts depend on rainfall intensity, duration, and surface infiltration conditions. Moreover, the response of deep aquifers to extreme rainfall can be delayed by months, and there are recharge thresholds. The immediate effect of groundwater extraction is to reduce AFWL, but the study area is an airport expansion area, and there is no long-term large-scale groundwater extraction plan. In order to quantify these uncertainties, it is recommended to use probabilistic methods such as Monte Carlo simulation to generate probabilistic prediction results through multi-scenario analysis and random sampling of parameters.
3.4 Anti-floating water level based on groundwater level and rainfall data
3.4.1 Variation law of groundwater level and precipitation
Figure 7 presents the relationship between water level and rainfall data for seven observation holes. It illustrates a similarity between the trend of rainfall changes and the water level elevation in the observation hole. However, rainfall peaks in July and August, while the water level in the observation hole peaks in November and December, indicating a significant lag in the water level change compared to rainfall, because the process of infiltration of rainfall to recharge groundwater takes a while.
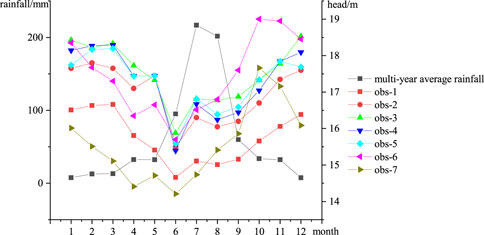
Figure 7. Relationship between groundwater level and rainfall in observation holes.
Temperature-driven soil moisture redistribution plays a role in groundwater recharge dynamics (Ahmad et al., 2021; Ahmad et al., 2025). When comparing the water level trends and rainfall in the observation holes, the rainfall data exhibits a relatively stable upward trend in May, June, and July. In contrast, the water level elevation shows a relatively stable upward trend in August, September, and October. A linear fitting was performed on the rainfall in May, June, and July and the observed water level in August, September, and October to investigate the relationship between the observed water level and rainfall, considering the significant lag between changes in water level and rainfall. Figure 8 shows the fitted relationship of water level elevation with monthly average rainfall, whereas Figure 9 depicts the fitted of water level changes with monthly rainfall changes, exhibiting a clear linear relationship.
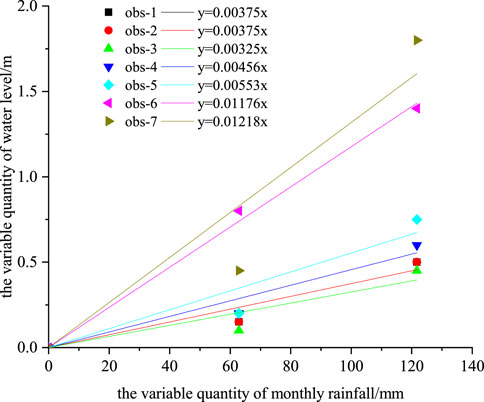
Figure 8. Fitting relationship between groundwater level and rainfall in observation holes.
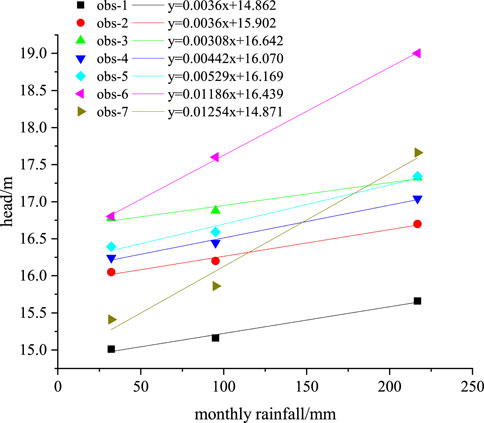
Figure 9. Fitting relationship between groundwater level change and rainfall change.
The linear relationship curve between the water level elevation and the monthly average rainfall in each observation hole is as follows: (1) obs-1: y = 0.0036x+14.862; (2) obs-2: y = 0.0036x+15.902; (3) obs-3: y = 0.00308x+16.642; (4) obs-4: y = 0.00442x+16.070; (5) obs-5: y = 0.00529x+16.169; (6) obs-6: y = 0.01186x+16.439; (7) obs-7: y = 0.01254x+14.871.
The linear relationship curve between the water level changes and the monthly rainfall changes in each observation hole is as follows: (1) obs-1: y = 0.00375x; (2) obs-2: y = 0.00375x; (3) obs-3: y = 0.00325x; (4) obs-4: y = 0.00456x; (5) obs-5: y = 0.00553x; (6) obs-6: y = 0.01176x; (7) obs-7: y = 0.01218x.
3.4.2 Theoretical determination of anti-floating water level
Lattice element modeling has been used effectively in simulating fluid-structure interactions in geomaterials (Rizvi et al., 2020). The highest monthly rainfall between 2018 and 2022 occurred in July 2022, reaching a peak of 316.48 mm and surpassing the monthly average rainfall by 99.67 mm. According to the linear relationship between the water level changes and the monthly rainfall changes in each observation hole, the ΔHe of each observation hole was obtained. The study area receives surface runoff primarily from the Dazhu and Yinqing Rivers. The Dazhu River remains dry all year round, while the Yinqing River is an airport drainage channel and will not increase its maximum water level. The statistical data of the anti-floating water level at each observation hole are listed in Table 2. The distribution map of the anti-floating water level in the study area is obtained using interpolation, as shown in Figure 10.
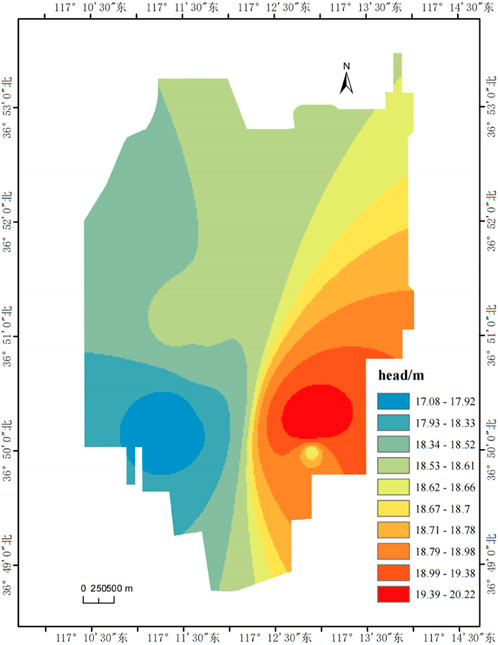
Figure 10. Distribution of anti-floating water level using theoretical analysis.
3.5 Comprehensive zoning results of anti-floating water level
A comprehensive analysis was conducted to compare the anti-floating water level, which was determined based on long-term water level and rainfall data, with the simulated maximum water level. In the western part of the study area, the measured and simulated anti-floating water levels remain consistent. However, in the southeastern part, the anti-floating water level obtained through numerical simulation is lower and does not meet the necessary safety standards. The simulated anti-floating water level is elevated and considered safe in the northeastern section. To ensure the project’s safety, the anti-floating water level is determined by considering both the anti-floating water level based on long-term water level and rainfall data and the anti-floating water level based on numerical simulation. The highest water level is taken as the anti-floating water level. A comprehensive anti-floating water level distribution map of the study area is obtained, as shown in Figure 11. The anti-floating water level gradually decreases from northeast to southwest.
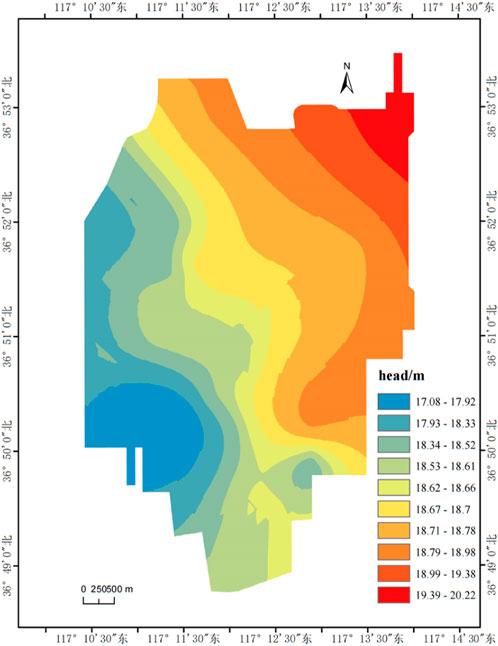
Figure 11. Comprehensive distribution of anti-floating water level.
The following measures can be taken for areas with high anti-floating water levels, especially in the northeast region of the site. (1) Lowering groundwater level: By setting up drainage facilities such as drainage ditches and collection wells, the groundwater level can be lowered below the foundation pit to reduce groundwater pressure on the pit. (2) Increasing the side wall support of the foundation pit: By setting up support structures such as steel sheet piles, cement soil walls, and others, the support force of the foundation pit side wall can be increased to prevent deformation and instability of the side wall. (3) Increasing the pressure at the bottom of the foundation pit: By laying materials such as sand, gravel, bricks, and others at the bottom of the foundation pit, the pressure at the bottom of the foundation pit can be increased to reduce the pressure of groundwater on the foundation pit. (4) Using anti-floating piles: They can sometimes be installed at the bottom of the foundation pit to improve its anti-floating capacity. Due to the impacts of factors such as underground engineering excavation, atmospheric precipitation, and spring preservation policies, the excavation of underground structures has blocked the only drainage channel, altered the permeability of the original geological formation, and changed the groundwater seepage field of the underground garage of a building in the eastern part of Jinan, Shandong Province. This has led to a significant rise in the surrounding groundwater level, exceeding the designed anti-floating waterproof level, and causing damage to the underground structure. According to the on-site survey, there are multiple clearly deformed areas in the bottom slab, and it is recommended to arrange emergency drainage wells in the later stage, as well as to reinforce and repair the bottom slab (Zhang Lihong et al., 2023).
4 Conclusion
Combined with numerical simulation, mathematical statistics, and theoretical analysis, a comprehensive method for determining the anti-floating water level is proposed in the research. Finite element analysis has been widely applied in assessing subsurface structural stability under varying groundwater pressures (Alsabhan et al., 2021). The research results are of great significance for engineering disaster prevention and mitigation, especially for areas with complex hydrogeological conditions. The main conclusions are as follows.
(1) Based on the actual investigation of the study area, a MODFLOW numerical model is established to simulate and predict the anti-floating water level under the evolution of groundwater at three different depths of 3, 8, and 16 m. The results indicated that the anti-floating water levels range from 19.2 to 18.3 m, 19.1 to 18.3 m, and 18.9 to 18.1 m, respectively.
(2) The analysis of the changes in groundwater level and precipitation in the observation holes of the site revealed a lag and linear relationship between groundwater level and precipitation. The anti-floating water level of seven observation holes is obtained using a method based on the long-term observation water level and precipitation data, and the distribution map of the anti-floating water level in the site is interpolated.
(3) A comprehensive analysis is conducted to compare the anti-floating water level, which is determined based on long-term water level and rainfall data, with the simulated anti-floating water level. The measured and simulated anti-floating water levels remain consistent in the western part of the study area, while the anti-floating water level obtained from the numerical simulation is lower in the southeast and higher in the northeast region. Finally, the highest values among the two are taken comprehensively, and the anti-floating water level of the site is divided into zones. The anti-floating measurements are proposed.
Generally, the proposed new method in the research is influenced by refined geological structure data, the number and periodicity of groundwater monitoring wells. The finer the geological structure data, the more groundwater monitoring wells there are, the longer the water level monitoring period, and the higher the accuracy of anti-floating water level calculation.
The groundwater simulation method proposed in this study performs well in homogeneous aquifers, but its applicability may be limited in karst landforms or extreme rainfall scenarios. There are limitations to applicability in highly heterogeneous aquifers (e.g., karst landforms) or extreme climate scenarios. The complex pipeline-matrix flow interaction in karst areas may lead to an underestimation of local recharge by the model, and the nonlinear infiltration process under extreme rainfall may exceed the linear assumptions of the current model. In the future, it is necessary to combine geostatistics, multi-scale coupling methods and climate model data to improve the generalization ability and long-term prediction reliability of the model under complex conditions.
Data availability statement
The data used to support the findings of this study are available from the author upon request.
Author contributions
XK: Conceptualization, Formal Analysis, Writing – review and editing. HA: Conceptualization, Writing – original draft. MH: Conceptualization, Formal Analysis, Writing – original draft, Writing – review and editing. CZ: Investigation, Writing – review and editing. CY: Investigation, Methodology, Writing – review and editing. TJ: Methodology, Software, Writing – review and editing. XW: Investigation, Methodology, Writing – review and editing. SW: Software, Writing – review and editing. SL: Investigation, Writing – review and editing.
Funding
The author(s) declare that financial support was received for the research and/or publication of this article. Financial support for this work was provided by the Shandong Geological and Mineral Engineering Survey Institute Project (No. 2022JBGS801-18).
Conflict of interest
The authors declare that the research was conducted in the absence of any commercial or financial relationships that could be construed as a potential conflict of interest.
Generative AI statement
The author(s) declare that no Generative AI was used in the creation of this manuscript.
Publisher’s note
All claims expressed in this article are solely those of the authors and do not necessarily represent those of their affiliated organizations, or those of the publisher, the editors and the reviewers. Any product that may be evaluated in this article, or claim that may be made by its manufacturer, is not guaranteed or endorsed by the publisher.
References
Ahmad, S., Rizvi, Z. H., and Wuttke, F. (2025). Unveiling soil thermal behavior under ultra-high voltage power cable operations. Sci. Rep. 15, 7315. doi:10.1038/s41598-025-91831-1
Ahmad, S., Rizvi, Z. H., Arp, J. C. C., Wuttke, F., Tirth, V., and Islam, S. (2021). Evolution of temperature field around underground power cable for static and Cyclic Heating. Energies 14 (23), 8191. doi:10.3390/en14238191
Alsabhan, A. H., Sadique, M. R., Ahmad, S., Alam, S., and Binyahya, A. S. (2021). The effect of Opening Shapes on the stability of underground tunnels: a finite element analysis. GEOMATE J. 21 (87), 19–27. doi:10.21660/2021.87.j2267
An, Z. D., Liu, G. Q., Zhang, T., Wang, T., Xu, D., and Zhou, S. Y. (2015). Prediction of groundwater level and determination of anti floating water level in building sites. J. Ocean. Univ. China 45 (4), 103–109.
Beck-Broichsitter, S., Rizvi, Z. H., Horn, R., and Wuttke, F. (2023). Effect of gravel content on soil water retention characteristics and thermal capacity of sandy and silty soils. J. Hydrol. Hydromechanics 71, 1–10. doi:10.2478/johh-2023-0001
Chen, Z. Y., Li, M., Gao, J. L., Zhao, Y. X., Zhan, G. Y., and Shi, Y. F. (2022). Study on the influence of groundwater level and formation permeability coefficient on the anti floating of foundation pits. J. East China Jiaot. Univ. 39 (1), 59–66.
De Caro, M., Crosta, G. B., and Previati, A. (2020). Modelling the interference of underground structures with groundwater flow and remedial solutions in Milan. Eng. Geol. 272, 105652. doi:10.1016/j.enggeo.2020.105652
Gu, X. L. (2003). Subgrade and foundation. 3rd edition. Beijing, China: Architecture&Building Press.
Han, B., Gao, Y. H., Ma, Z., Guo, X., Zhang, X., Liu, H. W., et al. (2024). Study on the values of anti-floating fortification water level for the underground structure in the starting area of Xiongan–Beijing Daxing International Airport Express Line. Acta Geosci. Sin. 45 (3), 397–409.
Hu, Z., and Chen, Z. Q. (2018). Research on the water level of anti-floating of building structure based on long-term boreholes and rainfall observations. Carsologica Sin. 37 (2), 245–253.
Kim, D., Cha, B. G., and Yeo, I. W. (2023). Impact of road embankment construction on groundwater system in alluvial aquifers. Geosci. J. 27, 89–99. doi:10.1007/s12303-022-0024-z
Kong, D. Z., and GuanYN, Y. H. (2023). Study on the anti-floating water level of the underground structure's comprehensive anti-floating. Structures 56, 104921. doi:10.1016/j.istruc.2023.104921
Lee, M., Lee, J. Y., and Jang, J. (2024). Numerical modeling of groundwater system with tunnel construction in an urban area of Korea: implications for land subsidence and mitigation measures. Environ. Earth Sci. 83, 80. doi:10.1007/s12665-023-11211-8
Li, G. S. (2018). Discussion on the buoyancy of water in basement design. Build. Struct. 48 (18), 117–123.
Li, T., Ran, W., Wei, K., Guo, J., Chen, S., Li, X., et al. (2024). Influence mechanism of water level variation on deformation of Steep and Toppling Bedding Rock slope. Water 16 (19), 2706. doi:10.3390/w16192706
Luo, G. Y., Ma, M. J., and Cao, H. (2020). A new anti-float method for riverside underground structures: drainage corridor combined with uplift piles or uplift anchors. Rock Soil Mech. 41 (11), 3730–3739.
Luo, Y. B., Chen, J. B., and Wang, Y. Y. (2022). Anti-floating failure mechanism of underground structures in expansive soil area and application of active anti-floating measures. Hydrogeo Eng. Geol. 49 (6), 64–73.
Mei, G. X., and Song, L. H. (2019). Anti-floating theory and technical application of underground structures. Beijing, China: Science Press.
Ministry of Housing and Urban-Rural Development of the People's Republic of China (2019). Technical standard for building engineering against uplift: JGJ 476– 2019. Beijing, China: Architecture & Building Press.
Mondal, M. (2024). Risk of groundwater depletion in Jaipur district, India: a prediction of groundwater for 2028 using artificial neural network. Rend. Fis. Acc. Lincei. 35, 971–984. doi:10.1007/s12210-024-01270-9
Rastorguyev, I. A., and Mukhina, L. N. (2023). Using the Dhi Feflow Software Package to solve groundwater flow issues at the site of hydroelectric power plants under construction. Power Tech. Eng 57, 341–345. doi:10.1007/s10749-023-01666-x
Ren, F. Z., Liu, N., and Zhang, C. (2024). Study on safe crossing in the dry season and an anti-floating drainage scheme in the wet season: a case study in Guiyang, Southwest China. Sci. Rep. 14, 2118. doi:10.1038/s41598-024-52473-x
Rizvi, Z. H., Mustafa, S. H., Sattari, A. S., Ahmad, S., Furtner, P., and Wuttke, F. (2020). “Dynamic Lattice element Modelling of cemented geomaterials,” in Advances in Computer methods and Geomechanics. Lecture Notes in Civil engineering. Editors A. Prashant, A. Sachan, and C. Desai (Singapore: Springer), 55, 655–665. doi:10.1007/978-981-15-0886-8_53
Sun, W. X., Liu, H. L., Zhang, W. G., Liu, S. L., and Gao, X. C. (2023). Investigation on overburden thickness considering face and anti-floating stability of shallow shield tunnel. Comput. Geotech. 160, 105562. doi:10.1016/j.compgeo.2023.105562
Wang, L. B., Zhang, C. P., Li, Y. J., Peng, H., Fu, P. J., Jin, Z. X., et al. (2024). Study on dynamic and failure characteristics of sand and anti-floating safety of tunnel structures under long-term vibration loads of the Beijing subway. Eng. Fail Anal. 163, 108591. doi:10.1016/j.engfailanal.2024.108591
Wang, W., Zhang, Z., Duan, L., Wang, Z., Zhao, Y., Zhang, Q., et al. (2018). Response of the groundwater system in the Guanzhong Basin (central China) to climate change and human activities. Hydrogeol. J. 26 (5), 1429–1441. doi:10.1007/s10040-018-1757-7
Watson, J., Stephen, T., and Thomas, G. (2022). Groundwater resource management during construction dewatering. Sustain. Water Resour. Manag. 8, 91. doi:10.1007/s40899-022-00678-1
Xu, Z. P., Wu, J. F., and Tang, P. (2019). Research on the technical system and application of anti floating water level design for regional subway. Eng. Surv. 47 (7), 29–35.
Yi, L. X., and Xu, H. (2009). Numerical simulation of groundwater: Fundamentals and Examples of GMS applications. Beijing, China: Chemical Industry Press.
Yu, G., Li, X., and Shu, Z. W. (2020). Research on floating deformation characteristics and treatment measures of high-rise building basement. Chin. J. Undergrd Space Eng. 16 (1), 211–218.
Yuan, Z. R. (2007). Anti floating design of underground engineering. J. Undergr. Space Eng. 3 (6), 199–200.
Zhang, L., Chen, L., Jiang, Y., Li, Z., and Wang, X. (2023b). A preliminary study on the mechanism of water gushing in the underground garage of a building in the east of Jinan, Shandong Province. Shandong Land Resour. 39 (01), 57–63.
Zhang, R. Z., Zhang, Q. F., Yang, X. Y., and Wang, J. L. (2023a). Study on the influence of water level during construction on the minimum burial depth of shield tunnels. J. Undergr. Space Eng. 19 (s1), 262–268.
Zhao, K., and Zhou, Q. (2024). The numerical simulation method was used to determine the anti-floating waterproof level of the basement in the Linjiang area. J. Sci. Technol. Industry24 (07), 165–171.
Zhao, Y. (2013). Analysis of Reasons for underground floating damage and research on Treatment measures. Zhejiang University.
Keywords: groundwater level, MODFLOW, numerical simulation, quantitative theoretical calculation, anti-floating water level
Citation: Kong X, An H, Hao M, Zhang C, Yang C, Jia T, Wang X, Wang S and Liu S (2025) MODFLOW-based groundwater level prediction and comprehensive determination of anti-floating water level for airports under construction. Front. Earth Sci. 13:1587990. doi: 10.3389/feart.2025.1587990
Received: 05 March 2025; Accepted: 10 April 2025;
Published: 28 April 2025.
Edited by:
Wenling Tian, China University of Mining and Technology, ChinaReviewed by:
Zarghaam Rizvi, GeoAnalysis Engineering GmbH, GermanyZhiyong Yin, Hunan University of Arts and Science, China
Copyright © 2025 Kong, An, Hao, Zhang, Yang, Jia, Wang, Wang and Liu. This is an open-access article distributed under the terms of the Creative Commons Attribution License (CC BY). The use, distribution or reproduction in other forums is permitted, provided the original author(s) and the copyright owner(s) are credited and that the original publication in this journal is cited, in accordance with accepted academic practice. No use, distribution or reproduction is permitted which does not comply with these terms.
*Correspondence: Mingsheng Hao, SG93ZXJfaG9zdGluZUAxNjMuY29t