 Mingguang Tang1
 Runwei Qiao
- 1Zhanjiang Branch of CNOOC Ltd., Zhanjiang, China
- 2China Oilfield Services Ltd., Tianjin, China
- 3National Key Laboratory of Highly Efficient Offshore Oil and Gas Exploitation, Beijing, China
The success in the pilot testing of offshore fracture–flooding provides a new technical idea for the development of low-permeability and under injection oilfields. However, the lack of criteria for well and layer selection has hindered further implementation of fracture–flooding technologies. The establishment of such criteria requires a deep understanding of the production enhancement mechanisms during the fracture–flooding operation. Currently, there is still a lack of a numerical simulation model for fracture–flooding operations that combines the mechanisms of energy replenishment, porosity and permeability increase, crack initiation, and oil displacement using surfactant and imbibition. Furthermore, the influence of individual mechanisms, i.e., how each mechanism contributes to the overall production enhancement, is not quantified. To fill the current knowledge gap in the mechanisms behind fracture–flooding practices, we have conducted experimental studies, established a numerical simulation method for fracture–flooding production enhancement mechanisms, and quantitatively characterized the effects of crack initiation, surfactants, and imbibition during well shut-in. Further studies on establishing the layer selection criteria for fracture–flooding were carried out with the key indexes identified and ranked based on the quantification result of their influence on production enhancement. The results show that the oil-bearing condition has first-order control on production enhancement compared to the physical properties of the reservoir; i.e., it is necessary to ensure that a certain amount of residual reserves exists in the formation first. The established criteria have been tested in the field practice of fracture–flooding, which shows an initial daily oil increase of 50 m3•d−1, and the production capacity of the target layer was increased from 1.2 m3 (d•MPa)-1 to 9.2 m3 (d•MPa)−1, and the cumulative oil increase reached 101,000 mcf in half a year. The field results indicate that the production enhancement effect has met the requirements of the fracture–flooding design. The field practice has proved the feasibility of using our numerical simulation method for the design of fracture–flooding and well/layer selection in the development of offshore low-permeability reservoirs.
1 Introduction
Low-permeability reservoirs often exhibit poor physical properties, scattered distribution of residual oil, and difficulties in water injection. Conventional fracture stimulation and flooding technologies can increase the recovery rate of low-permeability reservoirs to some extent. However, recovery enhancement depends highly on fracture development and is usually economically costly. The low-permeability nature of the reservoir also makes flooding inefficient. Considering such problems, the fracture–flooding technology is proposed and has received some satisfying results from practice (Yujuan, 2021; Zhang et al., 2022; Huang et al., 2022; Yong et al., 2023; Zhenfu et al., 2023; Wang et al., 2020). The fracture–flooding technology combines single-well fracturing, conventional water flooding, and chemical flooding. During the fracture–flooding operation, rapid injections of water and displacement agents into the formation replenish the formation energy and increase the local pressure condition. Porosity and permeability increase, crack initiation, oil displacement through agents, and imbibition mechanisms are activated during the process (Guo et al., 2022; Liu et al., 2022). In field development practice, the effect of production enhancement and the quality of fracture–flooding work performance depend largely on the target well and layer selection. Currently, the selection of wells and layers quite often relies on experience and is difficult to quantify. Statistics show that the target wells selected for fracture–flooding commonly show low reserve production, low water cut, and imperfect injection–production relationship (Yujuan, 2021; Yong et al., 2023; Wang et al., 2020; Guo et al., 2022; Liu et al., 2022), while the target layers are often thick layers with high formation energy and abundant residual oil (Guo et al., 2022).
Some efforts have been made in developing well and layer selection methods for fracture–flooding practices (Wang et al., 2019; Cao, 2020; Shang et al., 2017; Chenglong, 2021; Mei et al., 2023; Fengqiang, 2010; Zhang, 2009; Luming et al., 2023; Zhu et al., 2021; Bing, 2019; Zhang et al., 2023; Zhu et al., 2023). Common methods can be categorized as analogical optimization methods based on field practice experience; comprehensive evaluation methods based on mathematical analysis such as fuzzy mathematics, artificial neural networks, and optimal decision-making; as well as optimization methods based on numerical simulation.
The comprehensive evaluation methods are widely used during production capacity prediction, profile control, and flooding (Wang et al., 2019; Cao, 2020; Shang et al., 2017). For example, Chenglong (2021) studied the factors affecting the production enhancement of fracture–flooding wells and established a production enhancement prediction model based on multi-kernel learning. Mei et al. (2023) established a prediction model for reversed fracture–flooding in oil wells based on the AdaBoost-SVM algorithm. Fengqiang (2010) proposed an evaluation model for fractured wells based on gray correlation, analytic hierarchy processes, and fuzzy comprehensive evaluation methods. However, most comprehensive evaluation methods fail to consider the reservoir properties and ignore the mechanisms of production enhancement. The heavy dependence on data has also become a barrier to further application of comprehensive evaluation methods.
The numerical simulation method has advantages in characterizing mechanisms during reservoir development. Research has been conducted on fracturing, fracture–flooding, chemical flooding, and energy replenishment through water injection (Zhang, 2009; Luming et al., 2023; Zhu et al., 2021; Bing, 2019; Zhang et al., 2023; Zhu et al., 2023). These studies either focus on exploring the mechanisms and fail to consider their use in field applications, which cannot be directly used for guiding field operations, or only consider part of the mechanism that is activated during fracture–flooding practices (Cao et al., 2024; Cui et al., 2025; Jiang et al., 2022; Lu et al., 2023; Wang et al., 2025; Wang et al., 2024; Yang et al., 2022; Zhao et al., 2025; Zhi et al., 2021; Cao et al., 2025). Currently, there still is a lack of a numerical simulation model for the fracture–flooding operation that combines the mechanisms of energy replenishment, porosity and permeability increase, crack initiation, oil displacement using surfactants, and imbibition. Furthermore, the influence of individual mechanisms, i.e., how each mechanism contributes to the overall production enhancement, is not quantified.
Overall, although progress has been made in the field operation of fracture–flooding, there is still a knowledge gap in the understanding and quantitative characterization of various production-enhancement mechanisms. This becomes a barrier to developing a systematic guide for the fracture–flooding operation of low-permeability reservoirs. In this study, we developed a detailed numerical simulation method describing the production-enhancement mechanisms during the fracture–flooding operation based on the results obtained from laboratory studies. Mechanisms such as porosity and permeability increase, crack initiation, oil displacement through agents, and imbibition are described and quantified. Using our model, we have further conducted sensitivity tests on factors such as porosity, permeability, effective thickness, water saturation, formation stress index, and distance to the fault. We developed correlation functions to describe the combined influence of different factors and established standards in the evaluation of unit oil production enhancement. The established criteria provide guidance for future well and layer selection and the optimization of operation designs.
2 Numerical simulation of the production enhancement of fracture–flooding
2.1 Production-enhancement mechanisms of fracture–flooding
2.1.1 Stress disturbance and fracture development
For the fracture characterization of conventional fracturing, the fracture length and orientation are often calculated based on a constant or initial in situ stress field. However, when it comes to the fracture–flooding operation, the reservoir has been put into production for a period of time, which causes a change in the stress field. Water injection before fracturing results in energy replenishment, which further intensifies the stress disturbance. Therefore, it is necessary to carry out a study on the field evolution for exploring the mechanisms of fracture–flooding-generated cracks. In this study, the elastic deformation of rocks and in situ stress are calculated using the geomechanical model, in which the in situ stress and discharge are fully coupled, i.e., in each time step, the discharge and the in situ stress equation are solved simultaneously.
The flow chart in Figure 1 lists the steps for solving the fracture development and propagation. First, traditional reservoir numerical simulation calculations are carried out using the finite volume method while the pressure field at each time step is stored. The pressure is then fed into the finite element geomechanical solver to calculate the in situ stress field at this time step, from which the physical properties such as porosity and permeability are determined. The updated physical property field is used for the determination of the stress field in the next time step. The Mohr–Coulomb failure criterion is introduced to characterize fracture development during fracture–flooding. The dynamic embedded discrete fracture model is used to represent the formation fracture when the failure criterion is met.
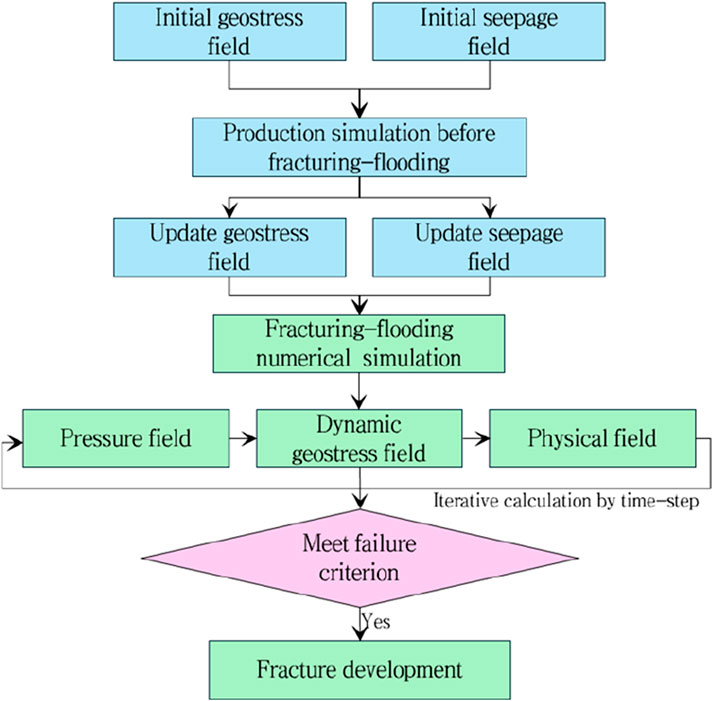
Figure 1. Flow chart of steps used in solving the coupled model of stress and discharge.
2.1.2 Micro-crack initiation and porosity/permeability increase
Fluid injection during fracture flooding is accompanied by larger discharge volumes and higher injection pressures compared to conventional injection. This results in an increase in the local stress and could generate several micro-cracks in the near-wellbore reservoir. The low-viscosity nature of the fluid used for fracture–flooding allows easier entry of fluid into the matrix pore space. The increase in the pore pressure causes an increase in the pore space and pore connectivity, resulting in an increase in both porosity and permeability.
To quantify permeability improvement during fluid injection of fracture flooding, experiments were conducted using rock cores collected from low-permeability reservoirs in the studied area. Three cylindrical cores with a diameter of 2.5 cm are selected (see Table 1 for details). A cylindrical hole with a diameter of 6 mm and depth of 1.5 cm is drilled in the representation of the injection well bore and its adjacent area. The confining pressure is kept constant at 20 MPa, while the displacement pressure is varied. During the displacement experiments, the pressure and flow rate data are automatically recorded every 0.2 s, and the permeability is calculated using the pressure difference and discharge volume. The results indicate that as the displacement pressure varies, changes in the permeability can be characterized into three stages. High displacement pressure represents the early stage, with high horizontal stress, during which there is a slow increase in permeability. In the second stage, the horizontal stress decreases, and the differential stress gradually approaches the strength of the sample. Micro-cracks are generated, which induces a turning point in the permeability evolution. In the third stage, a further decrease in the horizontal stress allows the propagation and coalescence of micro-cracks and the formation of effective flow channels, which cause a rapid increase in the permeability. Figure 2 shows the absolute and normalized value of the permeability evolution. The permeability change K/K0 shows an exponential decay with increasing horizontal stress. The relationship can be quantified using the following Equation 1:
where K is the permeability of the rock sample, 10−3μm2; K0 is the initial permeability prior to displacement, 10−3μm2; ∆σ is the net horizontal stress, i.e., the difference between the minimum principle stress and the pore pressure, MPa. The evolution of permeability during stages 2 and 3 is combined, where the effective pressure is negative, i.e., the pore pressure is lower than the confining pressure.
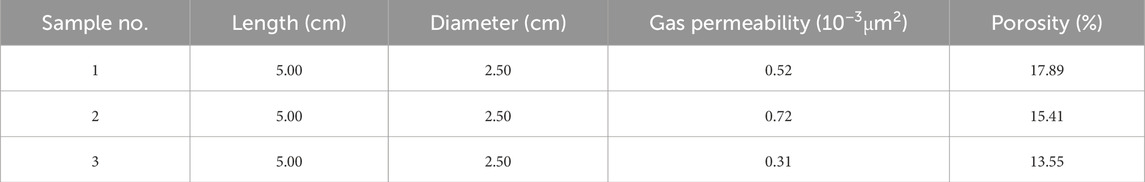
Table 1. Properties of rock core samples used for fluid injection experiments.
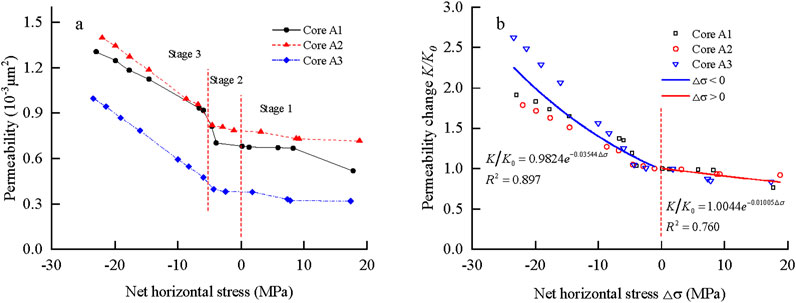
Figure 2. Fracture–flooding experiment results. (a) Relationship between the core permeability and the net horizontal stress; (b) relationship between the normalized change in permeability and net horizontal stress.
The evolution of porosity is calculated by using the geomechanical model based on the principles of mass conservation, as given in Equation 2 (Nasrollahzadeh et al., 2021):
where
2.1.3 Imbibition and surfactant effects
During the shut-in period of wells after fracture–flooding, imbibition takes place, driven by the capillary force and osmotic pressure. The surfactant is used to decrease the surface tension at the oil–water interface and increase the effectiveness of oil displacement (Guo et al., 2022). Experiments on the oil–water relative permeability, capillary force measurement for the imbibition effect, and interface tension measurement for oil and the surfactant are conducted to characterize the mechanism during the shut-in period.
① Evolution of relative permeability curve
The oil–water relative permeability tests are conducted in concordance with the standard operation procedure. Experiments are conducted at low, normal, and high pressures using water and surfactants as displacement fluids (Figure 3). The composition of the surfactant is as follows: 0.35% oil displacement agent, 0.1% resistance-reducing agent, and 0.3% clay stabilizer. Results show that the osmotic equilibrium point for water flooding is the lowest. The equilibrium point for the surfactant and high-pressure water flooding moves toward the upper right. The highest equilibrium point is observed in the high-pressure surfactant flooding experiment, while the oil saturation point is the lowest. The recovery rate calculated from the relative permeability curve increases from 48.49% in water flooding to 71.24% in high-pressure surfactant flooding, i.e., the high-pressure surfactant flooding can substantially increase the oil displacement effectiveness.
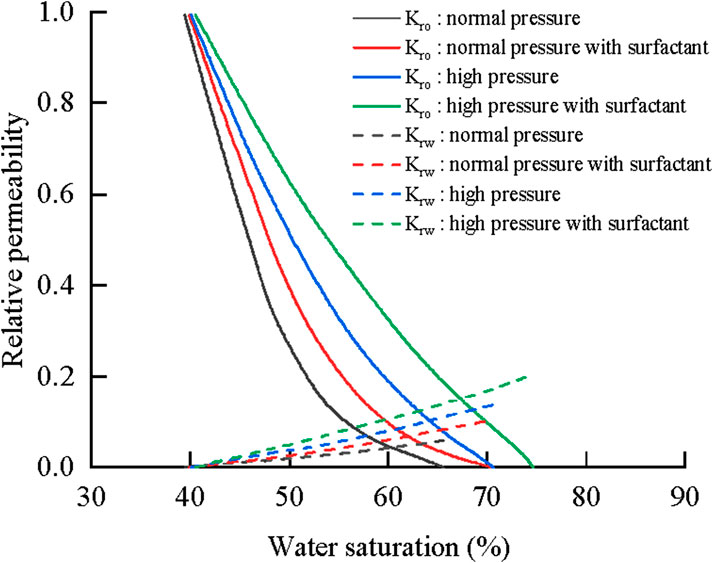
Figure 3. Relative permeability curve at different conditions.
The wettability of cores is measured using the Amott method (Amott, 1959). Results show that flooding with water or surfactants could change the wettability of cores from weak oleophylic to neutral or weak hydrophilic, as shown in Table 2.

Table 2. Wettability of cores measured using the Amott method.
The relative permeability calculation function is interpolated using the pressure and surfactant concentration as variants. The relative permeability at a certain pressure (curve A) and surfactant concentration (curve B) is interpolated separately, which is then used for the interpolation of the relative permeability curve at a given pressure and surfactant concentration using the following Equation 3:
where ω is the weighting factor; So is the oil saturation, %; Kro and Krw are the relative permeability of oil and water, respectively.
② Evolution of capillary force
The high-pressure mercury injection experiments were carried out on seven cores from the target block. The mercury withdrawal curves and their fitted lines are shown in Figure 4a. Figure 4b shows the tension at the oil–water interface with different surfactant concentrations.
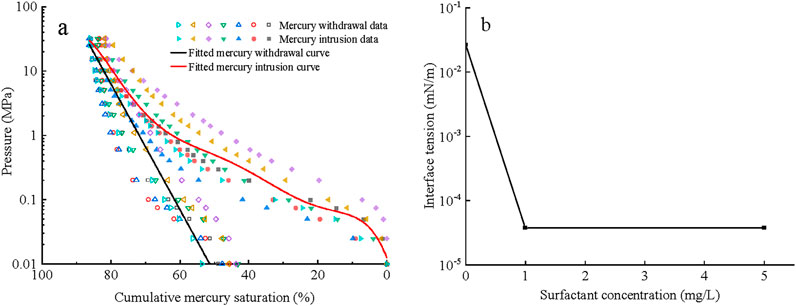
Figure 4. Mercury injection/withdrawal curves and interface tension measurement. (a) Fitted mercury injection/withdrawal curves; (b) interface tension measurement.
The J-function transformation is used in the establishment of the relationship between surfactant concentration, interface tension, and the capillary force based on which the model for the evolution of capillary force with a change in the surfactant concentration is constructed. The expression of the J-function is shown in Equation 4:
where J is the J-function; pc is the capillary force, dyn/cm2; Sw is the water saturation; K is the permeability, cm2; σ is the interface tension, dyn/cm, θ is the wetting angle, and ϕ is the porosity.
2.2 Numerical model and solution
The aforementioned mechanisms are integrated into the numerical model using tNavigator software. By calling the stress calculation module of tNavigator, the evolution of stress and crack initiation caused by fracture–flooding is considered, allowing a fully coupled calculation of the reservoir seepage model and the geomechanical model. The permeability increase caused by crack initiation is integrated by the self-constructed function, where the porosity evolution is characterized based on the rock mass conservation. We have also established functions in describing the evolution of the relative permeability and capillary force while considering the diffusion of surfactants in water during imbibition and surfactant displacement. Other production-enhancement mechanisms such as energy replenishment, flooding, and displacement are controlled by the seepage model. Necessary simplification and assumptions are made during the modeling of fracture–flooding, which include the following:
① The morphology of the main crack is simplified as a planar feature surrounded by regions of modified porosity and permeability.
② The initiation, propagation of the main fracture, and the associated change in its physical properties are affected by the evolution of stress field, geomechanical properties, and fluid pressure field and governed by the Mohr–Coulomb failure criterion.
③ Changes in the formation and properties of the modified region are affected by the evolution of the stress field and fluid pressure field.
④ The fluid within the formation contains only two phases: are oil and water (i.e., no degassing during the process). The surfactant is dissolved in the water phase. Viscosity and density of the water phase and the surface tension at the oil/water interface are controlled by the composition of the surfactant.
⑤ The flow of fluid within the reservoir is governed by Darcy’s law, with additional consideration of capillary force.
Running matching simulations for the history is necessary in order to obtain the seepage model and the physical property field of the geomechanical model. The stress field before fracture–flooding operations can be obtained by solving the coupled model of seepage and the geomechanics without considering the aforementioned production-enhancement mechanisms. During the production after fracture–flooding, the influence of the stress field change on the production simulation is small. Therefore, no coupled solution is reached for the model of seepage and the geomechanics in consideration of the computational efficiency.
3 Criteria of well and layer selection for fracturing–flooding practice
3.1 Well and layer selection criterion and model
A homogeneous reservoir model is established based on the aforementioned production-enhancement numerical simulation characterization method in order to explore the selection of the target well and layer for fracture–flooding practices (Figure 5). The thickness of the reservoir is set at 60 m. The grid number of the model is 41 × 41 × 3 with a size of 25 m × 25 m × 20 m. A producer well is set at the center of the model. Other parameters are set based on the actual operation and production data. The volume of the fracture–flooding fluid injected is 4,000 m3, with 450 m3 of the fracturing fluid. The shut-in period is set for 24 h. The physical properties of the reservoir are set according to geological data from an oilfield in the western South China Sea, with a reservoir depth of 3300 m and a pressure index of 1.46 (initial pressure 39 MPa). The oil is characterized as light oil with a viscosity of 5 mPa·s, a density of 0.85 g/cm3, and a saturation pressure of 18.6 MPa. Parameters associated with the seepage, capillary force, and pressure sensitivity of porosity and permeability were obtained from laboratory core tests. Simulation shows that symmetric fractures with double-wing features are developed vertically. The length, width, and conductivity of the fractures are controlled by the geomechanical characteristics at the selected timestep during fracture–flooding operations.
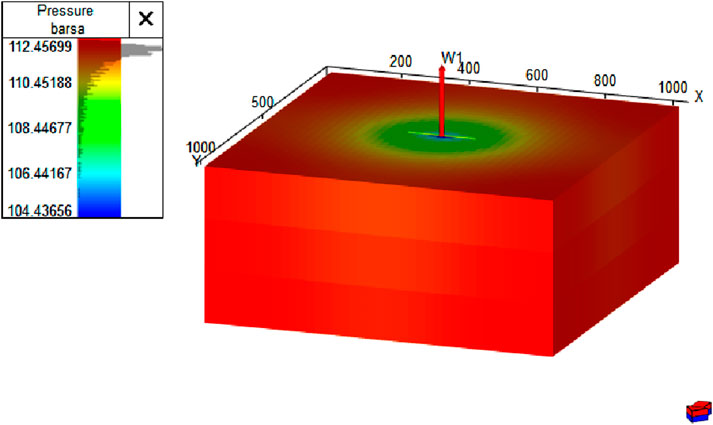
Figure 5. Numerical model of the homogeneous reservoir.
A study on Daqing, Jiangsu, and other oilfields (Yujuan, 2021; Zhang et al., 2022; Huang et al., 2022; Yong et al., 2023; Zhenfu et al., 2023; Wang et al., 2020) shows that porosity, permeability, effective thickness, water saturation, pressure maintenance, and distance to fault are key parameters taken into consideration during the selection of target wells and layers. Using the Latin hypercube sampling method, a total of 100 combinations are constructed with the ranges of each variable, as shown in Table 3. The variable range is selected based on the geological conditions of the studied area. For each variable combination, the cumulative oil production with and without fracture–flooding is predicted. The porosity, permeability, and oil saturation are modeled as direct inputs in the model settings. The effective thickness is modeled using the reservoir net-to-gross ratio. The distance to fault refers to the distance from the oil well to the model’s boundary and can be simulated by changing the location of the well. Pressure maintenance is defined as the ratio between the reservoir’s current average pressure and its initial pressure. The parameter is set in the optimization of the timing for fracture–flooding operations, i.e., the pressure threshold below which simulations of fracture–flooding starts.

Table 3. Value range of key variables.
3.2 Key parameter optimization
The quantitative production enhancement, i.e., the difference between the cumulative oil production with and without fracture–flooding, is selected as the standard for parameter optimization. Figure 6 shows the distribution of production enhancement as a function of different parameters.
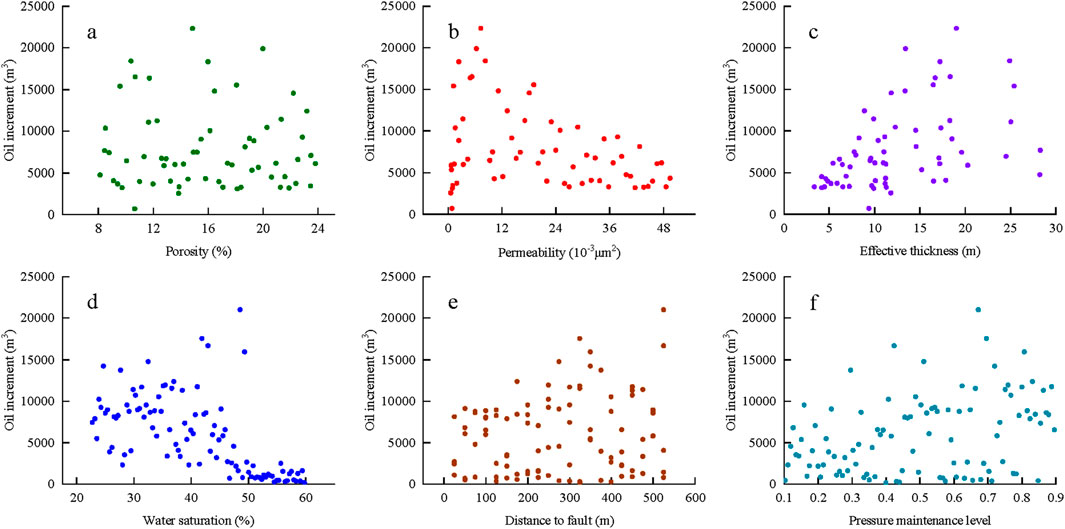
Figure 6. Production enhancement as a function of (a) porosity, (b) permeability, (c) effective thickness, (d) water saturation, (e) distance to fault, and (f) pressure maintenance.
3.2.1 Porosity and effective thickness
As shown in Figures 6a,c, the influence of porosity and effective thickness on production enhancement remains unclear as the porosity and effective thickness determine the Original Oil in Place (OOIP), while OOIP increases with the increase in the porosity and effective thickness. When other parameters affecting the reserves remain constant, the product of porosity and effective thickness (ΦH) is used as an indicator for the OOIP. Its relationship with production enhancement is shown in Figure 7, where larger enhancement in the production is commonly associated with a larger OOIP. This indicates that the selected formation should possess a certain amount of reserves to ensure success in the fracture–flooding operation. The cost of fracture–flooding operations requires a production enhancement of >10,000 m3 for economic development, which corresponds to a lower threshold of ΦH = 1.5.
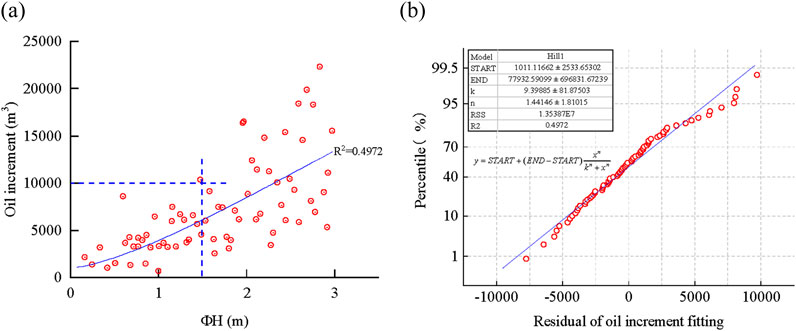
Figure 7. (a) Relationship between production enhancement and indicator for the OOIP; (b) residual analysis or the production enhancement fitting.
3.2.2 Permeability
Figure 6b shows that the relationship between permeability and enhanced production is obscured by the other variants. So, we have selected combinations with ΦH>1.5 and defined the unit enhanced production as the ratio between enhanced production and ΦH, ΦH2. Its relationship with permeability is shown in Figure 8 and Equation 5. The plot shows that the variant enhanced production/ΦH2 shows a positive linear correlation with permeability (R2 = 0.9128) at a permeability <5 × 10⁻³μm2. At the permeability >5 × 10⁻³μm2, the variant enhanced production/ΦH2 becomes negatively correlated with permeability and can be fitted using a logarithmic function (R2 = 0.8907). The two fitted lines define the boundary of 10,000 m3 production enhancement, below which the conditions are preferable for fracture–flooding development.
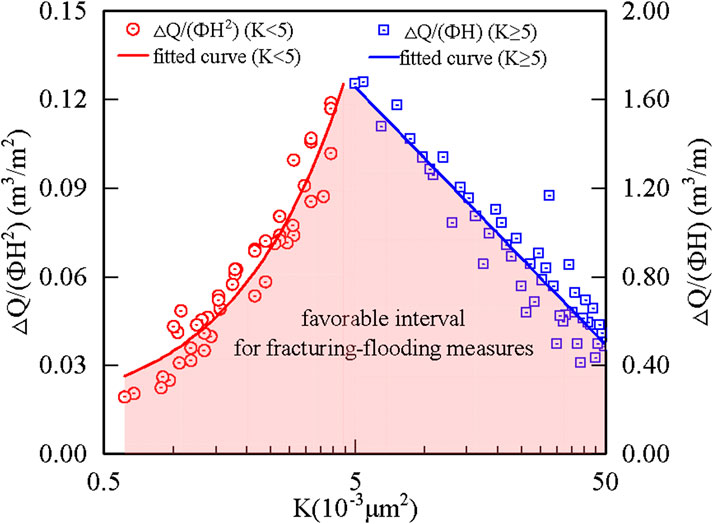
Figure 8. Effect of permeability on enhanced production.
3.2.3 Oil/water saturation
Figure 6d shows that higher water saturation correlates with lower enhanced production. At the water saturation range of 22%–50%, an increase in the water saturation generally causes a linear decrease in enhanced production. The scattering of the data point shows that other parameters also have a significant impact on the enhanced production at this saturation range (Figure 9). There is low enhanced production when the water saturation ranges between 50% and 60%. The compact data distribution also indicates that the water saturation is a dominant factor in affecting the enhanced production and that the impact of other parameters has become insignificant. Further increase in the water saturation above 60% causes a decrease in the mobility of the oil phase, and the enhanced production has become insignificant. Therefore, water saturation of 60%, i.e., oil saturation of 40%, is selected as the threshold limit for fracture–flooding well and layer selection.
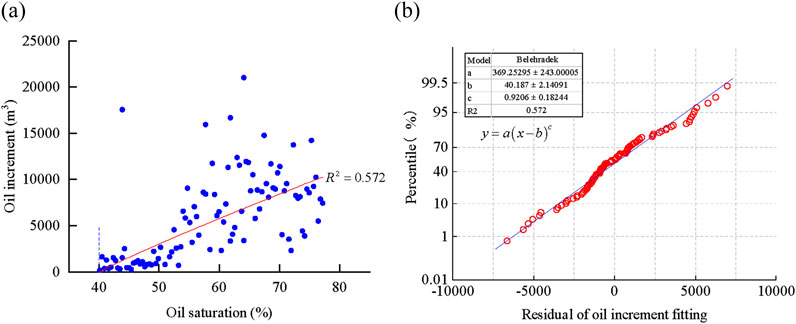
Figure 9. (a) Relationship between production enhancement and oil saturation; (b) residual analysis for the production enhancement fitting.
3.2.4 Distance to fault
Figure 6e shows that there is a weak correlation between distance to fault and enhanced production. The lower limit of distance to fault of 60 m is selected in consideration of the operation safety.
3.2.5 Pressure maintenance
The data points are scattered in the multi-parameter analysis of pressure maintenance and show no direct correlation with enhanced production. Further analysis of the relationship between injection volume and pressure maintenance is conducted. The range of injection volume in the simulation is set between 0.5 × 10⁴ m3 and 2.5 × 10⁴ m3. We defined the oil displacement efficiency as the ratio between enhanced production and the total volume of fluids injected and plotted the oil exchange rate against pressure maintenance (see Figure 10). The common oil exchange rate limit is set at 0.8, which corresponds to a pressure maintenance level of 0.4 (a pressure index of 0.5).
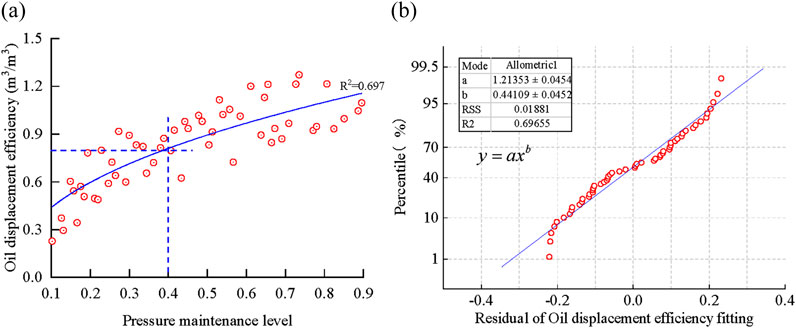
Figure 10. (a) Effect of pressure maintenance on oil displacement efficiency; (b) residual analysis for the oil displacement efficiency fitting.
3.2.6 Interbedding thickness
During the fracture–flooding operation, injected fluids could sometimes penetrate through the interbedded layer and cause additional fluid loss. Therefore, it is important to study the influence of interbedding thickness. We separate the model into layers of oil, water, and interbedding (Figure 11a). The vertical permeability of the interbedded layer is set to be 0.001 × 10⁻³μm2, with varied thicknesses between 0.1 and 5 m. Figure 11b shows that an increase in the interbedding thickness beyond 1.5 m causes no significant change in the enhanced production, which indicates that the fluid cannot penetrate through the interbedding layers of thickness more than 1.5 m. Therefore, the thickness of 1.5 m is selected as the lower limit for interbedding layers to ensure the safety and effectiveness of fracture–flooding operations.
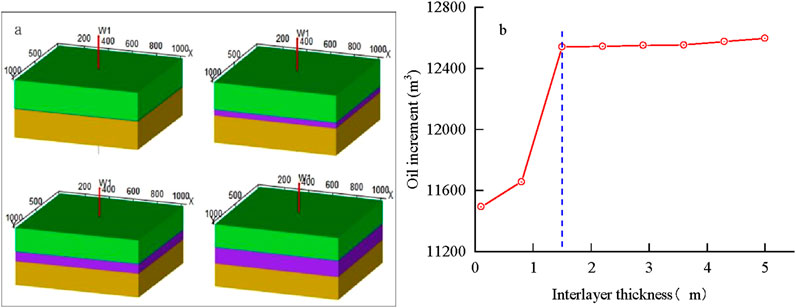
Figure 11. (a) Schematic representation of model settings. Oil, water, and interbedding layers are shown in green, yellow, and red, respectively. (b Influence of interbedding thickness on the enhanced production.
3.2.7 Multi-parameter analysis
The simulation from multi-parameter analysis allows the ranking of different parameters based on their impact on the enhanced production (Figure 12). These parameters can be categorized into three groups of oil-bearing indicators, reserve indicators, and reservoir characteristic indicators. The oil-bearing indicators include oil/water saturation and pressure indexes. The reserve indicators include porosity and effective thickness. The reservoir characteristic indicators include permeability and distance to fault. The result shows that oil-bearing indicators are the dominant parameters affecting the production enhancement as it determines the remaining reserve to be excavated. Following this, further selection of the target well and layer should consider reservoirs with insufficient energy, low porosity and permeability, and incomplete injector–producer networks.
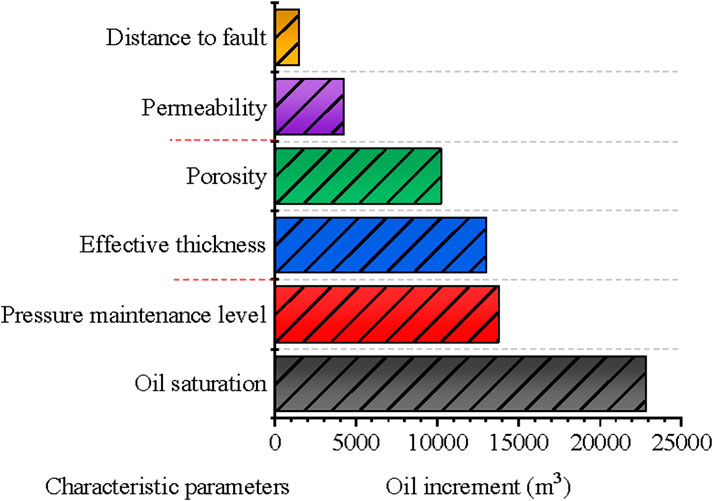
Figure 12. Ranking of parameters affecting the production enhancement base on their impact.
Table 4 lists the well selection criteria for the studied block. For broader application, wells can be ranked by calculating the selecting index using weight average of normalized parameters given in Table 5. The weight is calculated based on the standardized regression coefficient. Among all parameters, the recovery rate and water cut are the two fundamental parameters that determine the production enhancement potential of fracture–flooding operations. Higher water cut commonly indicates water flooding or channeling, which could easily lead to failure of fracture–flooding operations and is, therefore, assigned higher weight. Other key parameters such as oil saturation, pressure maintenance level, effective thickness and porosity are identified from aforementioned studies. These parameters ensure sufficient energy within the formation for the production of oil. The influence of the initial permeability is limited as the operation leads to modification of the matrix permeability through crack formation. Influences of fault and interbedding thickness are small as seen in the numerical simulations and are, therefore, assigned with the two lowest weights in the calculation of the well-selecting index.

Table 4. Criteria for well and layer selection.
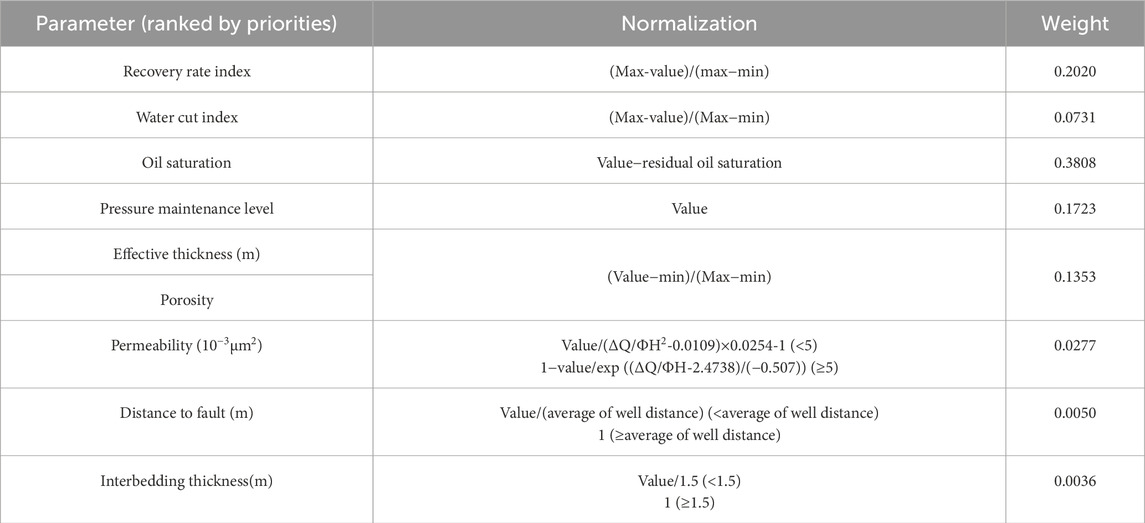
Table 5. Reference table for well-selecting index calculation.
3.3 Economic feasibility of fracture–flooding
The purpose of the economic feasibility analysis is to evaluate the net present value (NPV), internal rate of return (IRR), and payback period. The production costs can be divided into operation cost and oil production cost. Using the four fracture–flooded wells in the target oilfield as an example, the operation cost ranges from 14.2414 million CNY to 18.6518 million CNY per well, with an average cost of 16.50 million CNY. In 2023, the average production cost of China National Offshore Oil Corporation (CNOOC) was 28.83 US dollars per barrel. Assuming that the unit sales price of crude oil is 80.55 US dollars per barrel, with 10% discount rate and taking 3 months as one period, the production enhancement of 10,000 m3 with the effective duration of 3 years, the NPV for the fracture–flooding operation is calculated to be 4.40 million CNY, the payback period is 15 months, and the IRR is 39.33%. At 0 NPV, the oil price is 69.66 US dollars per barrel. Figure 13a shows that the NPV impacted by the fluctuations in crude oil prices and uncertainties of operation costs and the estimated production increase. Figure 13 demonstrates that with the crude oil price being approximately 75 US dollars per barrel and the operation cost of 15 million CNY, the enhanced production of 10,000 and 15,000 cubic meters could produce NPVs of 3.65–13.27 million CNY. An analysis on the effect of oil price on the net price value is conducted, assuming no change in the cost. The result shows that when the oil price is lower than 42 US dollars per barrel, the cost cannot be covered even if the production enhancement is over 30,000 m3.
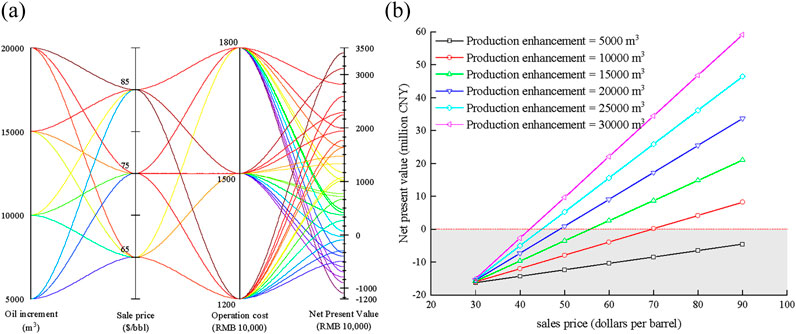
Figure 13. (a) Impact of the fluctuations in crude oil prices and uncertainties of operation costs and the estimated production increase in the NPV; (b) plot of sensitivity on oil price volatility.
3.4 Evaluation procedure for fracture–flooding operation
The numerical simulation study allows us to identify the key parameters and established criteria in the well and layer selection for fracture–flooding. During field practice, the values of the key parameters are determined, which is further evaluated by their economic feasibility.
The procedure for the target well and layer selection is as follows:
① Selection of the oil field and ground facilities.
Medium- to low-permeability oilfields with light oil are preferred. The target block should avoid major development test areas. The target field and platform should be equipped with fracturing string, water injection pipeline network, injection–production well pattern, and high-pressure pumping equipment. The working environment should meet requirements for water extraction from water source wells, water tank storage, liquid preparation by equipment, separate tank liquid storage, vehicle group construction, and operation under pressure.
② Preliminary selection of target wells.
The selected wells should be low-production and low-efficiency oil wells, directional wells, and non-heavy oil wells. The target wells should experience no complex well conditions such as casing damage or major repairs with excellent cementing quality. Wells exhibiting an imperfect injection–production relationship or production without injection are generally targets for the fracture–flooding practice.
③ Further selection of target wells.
Based on the experiences from Daqing and Jiangsu Oilfields and results from this study on the characteristic parameters such as porosity, permeability, effective thickness, water saturation, pressure maintenance level, and distance from faults, we have established well and layer selection criteria for the target block (see specifications in Table 4).
④ Post-operation production forecast.
Post-operation production can be predicted using the provided numerical simulation characterization method for fracture–flooding. This requires a geological model of the target well and data on the reservoir production dynamics.
4 Applications and results
4.1 Selection of fracture–flooding wells
Multiple producer wells in the target block are studied in the verification of the well and layer selection criteria (Figure 14). Reservoir properties of the wells are listed in Table 6.
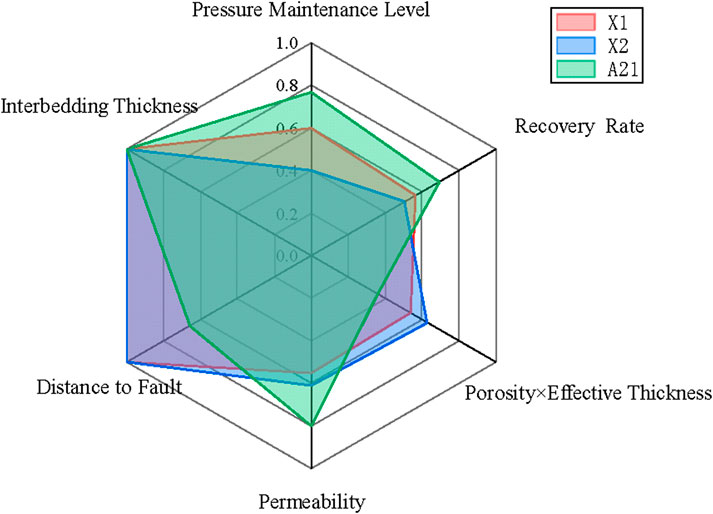
Figure 14. Radar diagram for the comparison of potential target wells. All parameters are normalized following the calculation methods listed in Table 5.
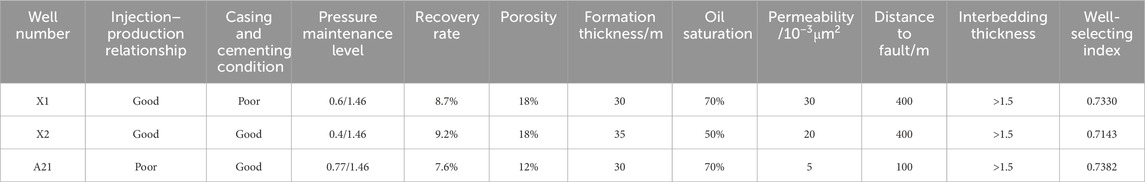
Table 6. Comparison of potential target wells for fracture–flooding operations.
Analysis shows that well X1 exhibits a potential risk in casing damage, while well X2 has a complete injection–production well pattern but low-pressure maintenance and low controlled reserves, which results in low profit in fracture–flooding operations. Well A21 started production in 2018, and its initial production was 7,070 m3·d−1, with a production index of 9.7 m3·(d·MPa)−1. However, its stable production did not last long and exhibited a fast decrease in production. The oil production rate has decreased to 20 m3·d−1, with a production index of 3.2 m3·(d·MPa)−1. The reservoir shows problems such as poor physical properties and insufficient energy. The well-selecting index is calculated for the three wells, among which well A21 shows the highest value. Based on the result of our analysis, well A21 was selected as the target well for the fracture–flooding operations, with a predicted production enhancement of 22,000 m3.
Following the design, fracture–flooding fluid with a total volume of 3,700 m3 was injected together along with a fracturing fluid of 436 m3. The designed half-length of fracture is 120 m, with a fluid conductivity of 20 D·cm. The predicted initial production enhancement is 30 m3·d−1 per well, with a 3-year cumulative production enhancement of 22,000 m3. The fracture–flooding operation for well A21 was completed in September 2023. Production resumed after a 3-day shut-in period. The initial production after fracture–flooding was 50 m3·d−1, with the production index increased from 3.2 m3·(d·MPa)−1 to 9.2 m3·(d·MPa)−1 (Figure 15). Cumulative production enhancement in the first two quarters was 1.01 × 10⁴ m3, which has met the expectation.
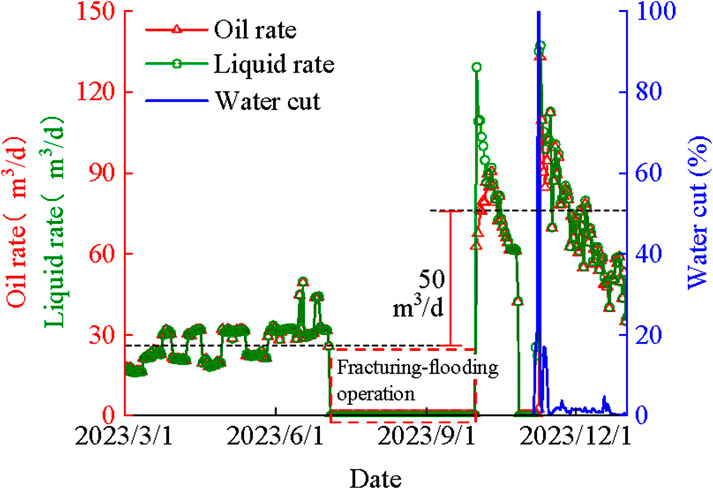
Figure 15. Comparison of production dynamics before and after operation.
4.2 Fracture–flooding evaluation
We plotted the data from wells experiencing fracture–flooding and compared them with the threshold boundary established in this study (Figure 16). The plot shows that data from all four operated wells fall below the boundary, which verifies the permeability selection criteria. Among these four wells, well B44 shows higher permeability (44.3 × 10⁻³μm2), which results in the data point falling marginally on the fitting boundary and lower production enhancement results, which demonstrates that high-permeability reservoirs are less ideal for the fracture–flooding operations with low economic retribution.
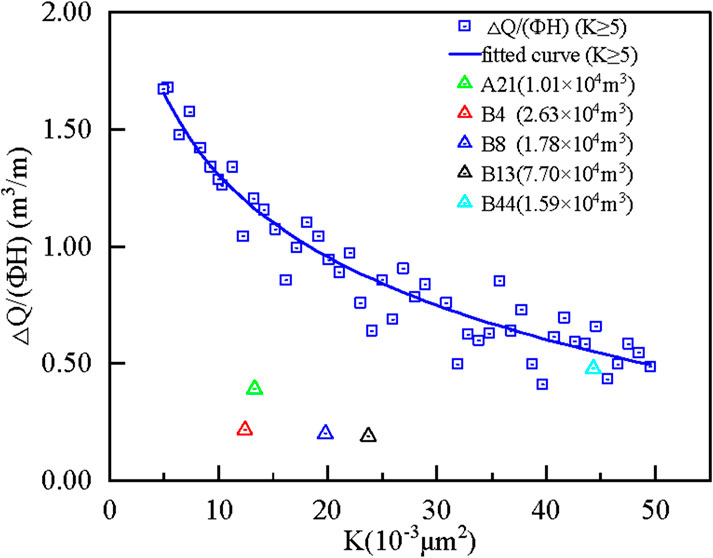
Figure 16. Production enhancement statistics from field operations.
5 Conclusion
In this study, we have established a method for developing the well and layer selection criteria for fracture–flooding development in low-permeability reservoirs based on laboratory experiments and numerical simulations. The quantitative evaluation of different mechanisms activated during the process provides a deeper and more accurate understanding of the fracture–flooding process. The study has broadened the application of fracture–flooding in the development of offshore low-permeability reservoirs.
(1) The fracture–flooding model considered production enhancement mechanisms of porosity and permeability increase, crack initiation, and oil displacement through agents and imbibition characterization, which filled the current knowledge gap and increased the accuracy in simulations.
(2) Analysis revealed that the oil-bearing condition is the dominant factor to be considered and fundamentally determine the overall enhanced production. In general, fracture–flooding is suitable for wells with a certain volume of residual oil low in porosity and permeability with incomplete injection–production relationships.
(3) Criteria for the selection of wells and layers for offshore fracture–flooding operations are established considering factors covering reservoir, engineering, and well-control conditions. The use of such criteria has been verified in this study and could increase the efficiency of the operational design procedures.
(4) Field application has received satisfactory results and met all expectations and specifications. However, the use of fracture–flooding in high-permeability reservoirs is not recommended in consideration of the operation’s economic efficiency.
Data availability statement
The raw data supporting the conclusions of this article will be made available by the authors, without undue reservation.
Author contributions
MT: Conceptualization, Data curation, Methodology, Supervision, Writing – review and editing. FW: Conceptualization, Formal Analysis, Project administration, Writing – review and editing. SM: Conceptualization, Funding acquisition, Project administration, Validation, Writing – review and editing. XD: Supervision, Writing – review & editing. Yuli Zhang: Writing – review and editing. JW: Conceptualization, Data curation, Formal Analysis, Writing – original draft, Writing – review and editing. TX: Conceptualization, Data curation, Formal Analysis, Writing – original draft, Writing – review and editing. RQ: Conceptualization, Data curation, Writing – original draft, Writing – review and editing.
Funding
The author(s) declare that no financial support was received for the research and/or publication of this article.
Conflict of interest
Authors MT, FW, SM, XD, and YZ were employed by Zhanjiang Branch of CNOOC Ltd. Authors JW, TX, and RQ were employed by China Oilfield Services Ltd.
Generative AI statement
The author(s) declare that no Generative AI was used in the creation of this manuscript.
Publisher’s note
All claims expressed in this article are solely those of the authors and do not necessarily represent those of their affiliated organizations, or those of the publisher, the editors and the reviewers. Any product that may be evaluated in this article, or claim that may be made by its manufacturer, is not guaranteed or endorsed by the publisher.
References
Amott, E. (1959). Observations relating to the wettability of porous rock. Pet. Trans. AIME 216, 156–162. doi:10.2118/1167-g
Bing, X. (2019). “Study on the mechanism and mathematical model of enhanced oil recovery by fracturing and filtration in medium and low permeability reservoirs,” in Northeast Petroleum. University.
Cao, H., Zhang, G., Li, S., Zhou, D., Yu, C., and Sun, Q. (2024). Fracturing initiation and breakdown pressures in fracturing-flooding sandstone reservoirs. Rock Mech. Rock Eng. doi:10.1007/s00603-024-04186-w
Cao, Z., Zhang, S., Du, F., Ma, D., Li, Z., Huang, C., et al. (2025). Water inrush mechanism and variable mass seepage of karst collapse columns based on a nonlinear coupling mechanical model. Mine Water Environ. doi:10.1007/s10230-025-01041-4
Cao, P. (2020). Study on comprehensive evaluation method of profile control and displacement effect in the extra-high water-cut period of sandstone reservoirs. China University of Petroleum East China.
Chenglong, X. (2021). Research on the optimal selection method of fracturing and displacement wells based on multiple kernel learning. Northeast Petroleum University.
Cui, C., Wang, J., Qian, Y., Li, J., and Lu, S. (2025). Fracturing–flooding for low-permeability oil reservoirs: a coupled model integrating DDM and Black-oil model. Rock Mech. Rock Eng. 58, 4069–4089. doi:10.1007/s00603-024-04344-0
Fengqiang, X. (2010). Optimal selection of fracturing wells based on fuzzy mathematical method. Sci. Technol. Eng. 10 (07), 1768–1771.
Guo, J., Ma, L., and Cong, L. (2022). Progress and development direction of fracturing and oil displacement technology in tight oil reservoirs in China. Acta Pet. Sin. 43 (12), 1788–1797. doi:10.7623/syxb202212009
Huang, Y., Jin, Z., and Qiao, C. (2022). Practice of fracturing and water injection technology in low-permeability reservoirs of small fault blocks in Jiangsu oilfield. Appl. Petrochem. Ind. 41 (06), 48–51.
Jiang, N., Zhang, Z., Qu, G., Zhi, J., and Zhang, R. (2022). Distribution characteristics of micro remaining oil of class III reservoirs after fracture flooding in daqing oilfield. Energies 15, 3385. doi:10.3390/en15093385
Liu, Y., Wang, F., and Wang, Y. (2022). Mechanism of enhanced oil recovery by fracturing and displacement in medium and low permeability reservoirs. Petroleum Explor. Dev. 49 (04), 752–759. doi:10.11698/PED.20210815
Lu, C., Ma, L., Guo, J., Zhao, L., Xu, S., Chen, B., et al. (2023). Fracture parameters optimization and field application in low-permeability sandstone reservoirs under fracturing flooding conditions. Processes 11, 285. doi:10.3390/pr11010285
Luming, C., Feng, Q., and Wang, S. (2023). Numerical simulation method of fracturing and water injection based on virtual element method and damage model. Chin. J. Comput. Phys. 40 (01), 81–90. doi:10.19596/j.cnki.1001-246x.8538
Mei, W., Ye, T., and Yang, E. (2023). Prediction method of reverse fracturing and displacement effect of oil wells based on AdaBoost-SVM algorithm. Math. Pract. Theory 53, 128–135.
Nasrollahzadeh, B., Akhlaghi Amiri, H. A., and Ghabezloo, S. (2021). Field-scale fully coupled simulation of fluid flow and geomechanics: Gas storage/recovery process in a depleted sandstone reservoir. J. Petroleum Sci. Eng. 200, 108423. doi:10.1016/j.petrol.2021.108423
Shang, Q., Wang, Y., and Yang, Y. (2017). Fuzzy comprehensive evaluation method and its application for the adaptability of air foam flooding. Special Oil and Gas Reservoirs 24 (05), 126–130.
Wang, X., Chu, X., Xie, Y., He, Y., Xu, H., and Xu, S. (2025). Machine learning framework for evaluating fracturing-flooding effectiveness: from prediction to decision recommendations. Fuel 381, 133299. doi:10.1016/j.fuel.2024.133299
Wang, X., Yu, W., Xie, Y., He, Y., Xu, H., Chu, X., et al. (2024). Numerical simulation of the dynamic behavior of low permeability reservoirs under fracturing-flooding based on a dual-porous and dual-permeable media model. Energies 17, 6203. doi:10.3390/en17236203
Wang, J., Jiang, M., and Xiang, H. (2020). Research and application of new fracturing and displacement process for the third type of reservoirs in shanshan oilfield. Technol. Superv. Petroleum Industry 36 (12), 6–9. doi:10.3969/j.issn.1004-1346.2020.12.002
Wang, W., Liu, P., and Biao, L. (2019). Study on fuzzy comprehensive evaluation method of productivity in ultra-low permeability reservoirs. Special Oil and Gas Reservoirs 26 (02), 127–131.
Yang, Y., Liao, G., Xiong, W., Shen, R., Zhang, J., Li, Q., et al. (2022). Physical and numerical simulation of inter-fracture flooding in heterogeneous tight oil reservoirs. Energy Rep. 8, 12970–12978. doi:10.1016/j.egyr.2022.09.194
Yinpeng, D., Xiaojia, X., and Ming, L. (2021). Energy enhancement mechanism of energy accumulation and repeated fracturing in ultra-low permeability oilfields. Sci. Technol. Eng. 21 (33), 14139–14146.
Yong, Y., Zhang, S., and Cao, X. (2023). Practice and understanding of fracturing and displacement development technology in low-permeability reservoirs of shengli oilfield. Petroleum Geol. Recovery Effic. 30 (06), 61–71. doi:10.13673/j.pgre.202206036
Yujuan, M. (2021). Technology and application of fracturing and oil displacement for enhanced oil recovery in the third type of reservoirs in daqing placanticline oilfield. Petroleum Geol. and Oilfield Dev. Daqing 40 (02), 103–109. doi:10.19597/J.ISSN.1000-3754.202006002
Zhang, F. (2009). Mechanism of fracturing and water injection in low-permeability reservoirs and optimization of process parameters. China University of Petroleum.
Zhang, H., Jin, Z., and Ma, W. (2023). Numerical simulation study on the design of fracturing and displacement in low-permeability reservoirs. Complex Hydrocarb. Reserv. 16 (03), 347–351. doi:10.16181/j.cnki.fzyqc.2023.03.017
Zhang, K., Tang, M., and Liang, T. (2022). Integrated volume fracturing technology of fracturing and permeability enhancement for horizontal wells in shale oil reservoirs of qingcheng oilfield. Pet. Drill. Tech. 50 (2), 9–15. doi:10.11911/syztjs.2022003
Zhang, Y. (2022). Reverse fracturing and displacement of the third type of reservoirs in the water flooding area of sa zhong. Chem. Eng. and Equip. (09), 124–125+130.
Zhao, Z., Jiang, S., Lei, T., Wang, J., and Zhang, Y. (2025). Optimization of key parameters of fracturing flooding development in offshore reservoirs with low permeability based on numerical modeling approach. JMSE 13, 282. doi:10.3390/jmse13020282
Zhenfu, M., Shao, X., and Gang, L. I. (2023). Application of capacity expansion fracturing and displacement process technology in bonan oilfield of low-permeability reservoirs. Unconv. Oil and Gas 10 (04), 58–66. doi:10.19901/j.fcgyq.2023.04.07
Zhi, J., Liu, Y., and Qu, G. (2021). Numerical simulation and sensitivity evaluation of fracture flooding in a class III reservoir. Chem. Technol. Fuels Oils 57, 591–601. doi:10.1007/s10553-021-01281-4
Zhu, W., Fan, B., and Qingjun, D. (2021). Numerical simulation study on surfactant fracturing and displacement after polymer flooding in the third type of reservoirs. Contemp. Chem. Ind. 50 (03), 682–687. doi:10.3969/j.issn.1671-0460.2021.03.042
Keywords: offshore reservoir, low-permeability reservoir, fracture–flooding practice, numerical simulation, well and layer selection
Citation: Tang M, Wei F, Ma S, Deng X, Zhang Y, Wang J, Xing T and Qiao R (2025) Criteria for well and layer selection for fracturing–flooding practice in offshore low-permeability reservoirs based on numerical simulation. Front. Earth Sci. 13:1591312. doi: 10.3389/feart.2025.1591312
Received: 11 March 2025; Accepted: 14 April 2025;
Published: 12 May 2025.
Edited by:
Faisal Ur Rahman Awan, Edith Cowan University, AustraliaReviewed by:
Zhengzheng Cao, Henan Polytechnic University, ChinaNajeeb Ullah, University of Technology Petronas, Malaysia
Darya Khan Bhutto, Dawood University of Engineering and Technology, Pakistan
Copyright © 2025 Tang, Wei, Ma, Deng, Zhang, Wang, Xing and Qiao. This is an open-access article distributed under the terms of the Creative Commons Attribution License (CC BY). The use, distribution or reproduction in other forums is permitted, provided the original author(s) and the copyright owner(s) are credited and that the original publication in this journal is cited, in accordance with accepted academic practice. No use, distribution or reproduction is permitted which does not comply with these terms.
*Correspondence: Runwei Qiao, cWlhb3J3QGNub29jLmNvbS5jbg==