 Haojie Wang1,2,3
 Jiarui Mao2,4*
- 1Observation and Research Station of Geological Disaster in Lanzhou, Ministry of Natural Resources (MNR), Lanzhou, Gansu, China
- 2Institute of Geomechanics, Chinese Academy of Geological Sciences, Beijing, China
- 3Observation and Research Station of Geological Disaster in Baoji, Ministry of Natural Resources, Shaanxi, Baoji, China
- 4Observation and Research Station of Crustal Stress and Strain in Beijing, Ministry of Natural Resources, Beijing, China
Slow-moving landslides, characterized by sustained destructive potential, are widely distributed in northwest China. However, research on the damage mechanisms of masonry buildings caused by slow-moving landslide-induced surface deformation is significantly lacking, which severely restricts the physical vulnerability assessment of masonry structures and the quantitative risk evaluation of slow-moving landslides. Through field investigations, CDEM numerical simulations, and statistical analyses, this study reveals the cooperative deformation characteristics and progressive failure mechanisms of masonry buildings subjected to ground cracks in slow-moving landslides, and establishes physical vulnerability curves for four distinct ground crack scenarios. The key findings indicate that masonry buildings affected by slow-moving landslides primarily exhibit transverse wall cracking and longitudinal wall inclination due to ground crack propagation. As crack propagation continues, the first-floor walls exhibit significantly higher Mises stresses compared to those on the second floor. Wall inclination rates demonstrate a distinct threshold effect during crack propagation: below the threshold, inclination increases linearly with crack displacement, while above the threshold, it exhibits exponential growth. Under identical crack displacement conditions, wall inclination rates decrease in the following order: horizontal tension, combined tension, settlement, and combined uplift scenarios. The differential effects of these scenarios on wall inclination become more pronounced with increasing crack displacement. Weibull functions were employed to fit vulnerability curves for masonry structures under four ground crack scenarios, revealing displacement thresholds of 22 cm, 26 cm, 27 cm, and 37 cm for complete structural vulnerability (V = 1) in each respective scenario. These findings provide valuable insights for vulnerability prediction and emergency rapid assessment of buildings subjected to slow-moving landslides across various disaster scenarios.
Highlights
Physical vulnerability represents a critical and fundamental challenge in landslide risk assessment. Existing research has predominantly focused on generalized vulnerability assessments for rapid slope failures, including flowslides, debris flows, and rockfalls, while neglecting the long-term impacts of slow-moving landslides. Through field investigations and CDEM numerical simulations, this study elucidates the cooperative deformation mechanisms and progressive failure processes of masonry buildings subjected to ground cracks in slow-moving landslides, establishing physical vulnerability curves for four distinct scenarios, thereby addressing a critical research gap in slow-moving landslide vulnerability assessment.
(1) Longitudinal wall inclination serves as a more reliable indicator for vulnerability assessment.
(2) Wall inclination rates exhibit a distinct threshold effect during crack propagation, transitioning to exponential growth when crack displacement surpasses the threshold.
(3) Wall inclination rates decrease in the following order across ground crack scenarios: horizontal tension, combined tension, settlement, and combined uplift.
(4) Weibull functions were employed to model vulnerability curves, revealing displacement thresholds of 22 cm, 26 cm, 27 cm, and 37 cm for complete structural vulnerability (V = 1) across the four scenarios.
1 Introduction
Slow-moving landslides, creep at rates ranging from millimetres to several metres per year and can persist for years to decades (Lacroix et al., 2020). Slow-moving landslides are widely distributed in many hilly regions in China, especially in northwest loess area and southwest Three Gorges reservoir area (Chen et al., 2023; Wang et al., 2020; Zhang and Wang, 2022). These landslides did not threaten people’s lives, but caused sustained deformation and damage to buildings, which resulted in huge economic losses to local residents (Singh et al., 2019; Chen et al., 2011). Therefore, it is necessary to carry out quantitative risk assessment of slow-moving landslides. The quantitative level of vulnerability analysis of elements at risk directly determines the accuracy of disaster risk analysis results, and further affects the reliability of disaster reduction and prevention emergency plans. Therefore, the physical vulnerability of buildings is the key to solve the risk assessment of slow-moving landslides (Peduto et al., 2018; Palmisano et al., 2021; Chen et al., 2020).
The vulnerability depends on the landslide intensity and the susceptibility of buildings at risk. In recent years, the quantitative vulnerability assessment of elements at risk has attracted more and more attention in the field of geological hazard research (Luo et al., 2021; Sun et al., 2023; Ferlisi et al., 2020; Singh et al., 2019; Peduto et al., 2018). In northwest loess areas of China, masonry structure is the main structure type of buildings exposed on slow-moving landslides. The surface or deep displacements of slow-moving landslides can cause ground cracks and integral inclination of building walls (Chen et al., 2020; Chen, 2022; Mansour et al., 2011). The researches on the adaptive deformation mechanism of buildings to ground deformation mainly focused on mining subsidence and ground fissures, which the methods included field deformation monitoring, numerical simulation, physical model test and statistical analysis, while there were very few studies in the landslides (Kang et al., 2021; Peduto et al., 2018; Nicodemo et al., 2020; Palmisano et al., 2021; Chen et al., 2023; Son and Cording Edward, 2005; Mansour et al., 2011). Buildings are sensitive to non-uniform subsidence and horizontal cracks caused by the landslides creeping (Deck et al., 2003; Tan and Deng, 2004, meaning that the degree of landslide deformation can be used as the basis for the classification of building damage grades. Alexander (1986) proposed an intensity scale for structural damage caused by subsidence, compression, or extension of the ground during landslides and offered a checklist of site observations. Cooper (2008) presented a unified damage assessment scheme for buildings and infrastructures which mainly based on the UK and Italian practice and can be applied to most situations; It unified the current, disparate approaches and extended the usage of the semi-quantified approach to damage assessment. Mansour et al. (2011) confirmed the expected degree of damage to urban settlements, highways, bridges and dams could be related to the velocity or accumulating displacement of slow-moving landslides. Buildings and residential houses may tolerate higher slide velocities and total displacements than other facilities before experiencing serious damage. The researches of the above scholars show that the damage of building is directly related to the ground deformation of landslides in progressive failure mode. Chen et al. (2011) proposed the idea of dividing the landslide into two stages of deformation and failure to assess the vulnerability of buildings in Three Gorges Reservoir area. Negulescu and Foerster, 2010 established the building vulnerability curve of the damage degree of reinforced concrete (RC) buildings versus the ground displacement of landslide. In the field of numerical simulation research on building vulnerability, Vaiano et al. (2025) investigated the response and damage mechanisms of masonry structures subjected to vertical ground settlements using nonlinear numerical simulation methods. Chen (2022) employed ABAQUS software to simulate the failure effects of masonry structures under tension and shear crack modes, subsequently proposing critical failure loads for masonry structures. Wang et al. (2022) pioneered the application of continuous-discontinuous numerical methods to simulate the progressive failure process of masonry structures impacted by loess landslides, demonstrating the advanced capabilities of the CDEM approach in modeling structural failure processes. Nicodemo et al. (2020) and Ferlisi et al. (2020) conducted three-dimensional numerical simulations using TREMURI and EF platforms to analyze the progressive failure processes and damage patterns of masonry structures under various ground settlement conditions, ultimately developing a probabilistic framework-based vulnerability assessment methodology. Peduto et al. (2018) explored the corresponding relationship between the building damage levels and the maximum annual deformation rate of slow-moving landslides, and established the vulnerability assessment curves of buildings exposed to slow-moving landslides; This study has made a major breakthrough in the quantitative vulnerability assessment of buildings. Chen et al. (2020) pioneered a vulnerability assessment model for masonry structures by adopting the safety factor as an indicator of landslide intensity and wall inclination as the vulnerability metric, providing a foundational framework for quantitative analysis. Building upon this theoretical foundation, Chen (2022), Chen et al. (2023) further advanced the field through physical model experiments that systematically investigated the damage evolution mechanisms of masonry buildings subjected to ground tension cracks in slow-moving landslides. Their experimental work not only validated the earlier theoretical model but also bridged critical knowledge gaps by elucidating the stress transfer and progressive failure processes between landslide deformation and structural response. These studies collectively establish a cohesive progression from theoretical modeling to empirical validation, significantly enhancing the mechanistic understanding of structure-landslide interactions.
In summary, predecessors have made many pioneering achievements in the study of slow-moving landslides deformation and the dynamic damage of buildings, which also confirmed that it was viable to carry out the quantitative vulnerability assessment of buildings to slow-moving landslides according to the landslide deformation (Mansour et al., 2011; Peduto et al., 2018; Chen et al., 2020). And the research of building vulnerability is developing from qualitative and semi-quantitative to quantitative analysis (Luo et al., 2023; Lei et al., 2022; Vallero et al., 2020). However, there are still some limitations (Chen, 2022; Vaiano et al., 2025; Kang et al., 2021). For example, the ground deformation caused by landslide creeping is very complex, and the influence of horizontal and vertical composite deformation on buildings has been studied only scarcely. In addition, the transfer mechanism of stress and deformation from ground to buildings, and the adaptive deformation mechanism of buildings to slow-moving landslides also need to be further studied. These key scientific problems are very important to establish the quantitative vulnerability assessment model of buildings exposed to slow-moving landslides.
Therefore, this study focuses on the typical slow-moving landslides in the northwest loess area, and summarizes the damage characteristics of masonry structures affected by landslide deformation. The cooperative deformation characteristics and progressive failure mechanisms of masonry buildings traversing ground cracks on slow-moving landslides are systematically investigated using the Continuous-Discontinuous Element Method (CDEM). Building on this analysis, physical vulnerability curves for masonry structures under four distinct ground crack scenarios are developed, which takes the building inclination as the vulnerability indicator and the ground crack displacement as the indicator of landslide intensity. This study is significant to improving the quantitative level of risk assessment on slow-moving landslides.
2 Damage characteristics of masonry buildings on slow-moving landslides
2.1 Geological background of the study area
The study area is primarily located in the Beishan area of Tianshui City (Figure 1a). Tianshui City is situated in the southeastern part of Gansu Province, with a general topographic trend of higher elevation in the southeast and lower in the northwest, ranging from 700 to 3,120 m above sea level. The average elevation of the urban area is approximately 1,100 m. The eastern and southern regions have been uplifted due to the folding of ancient strata, forming mountainous landforms, while the northern area has developed loess hills and ridge-loess landforms as a result of geological subsidence and loess deposition. A small portion of the central region, influenced by latitudinal tectonic zones, has formed the Weihe Graben, which was further shaped by Quaternary fluvial erosion and deposition, resulting in the Weihe Valley landform. Geomorphologically, the study area lies at the transitional zone between erosional-accumulated ridge-hill landforms and erosional-accumulated valley landforms.
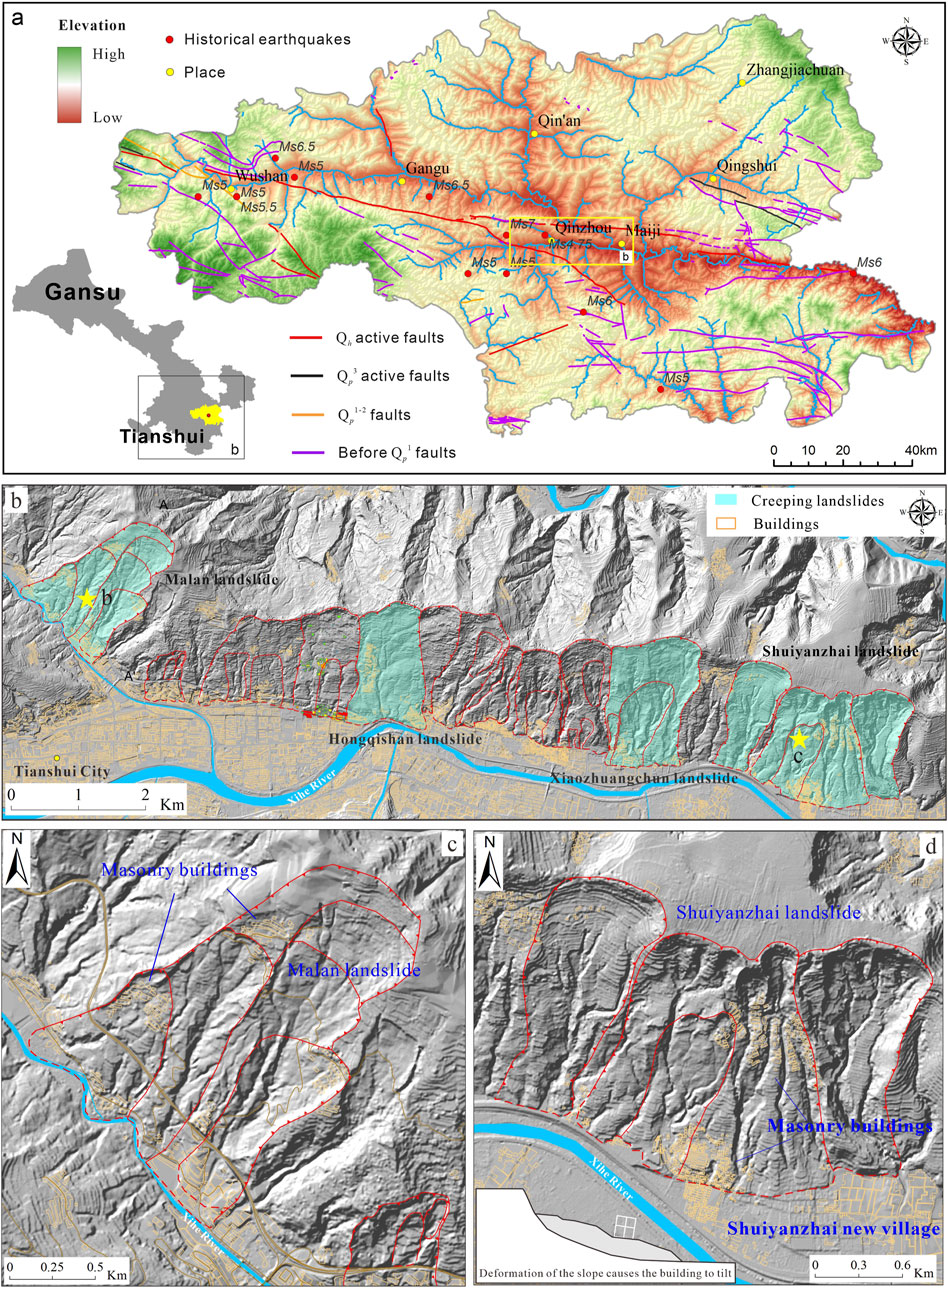
Figure 1. (a) Location of the Tianshui Beishan; (b) Distribution of slow-moving landslides in Tianshui Beishan; (c) Malan landslide; (d) Shuiyanzhai landslide.
The Tianshui Beishan area is characterized by complex neotectonic movements and sedimentary evolution, which under intense coupled endogenic and exogenic geological processes have triggered a cluster of giant landslides distributed in a belt-like pattern (Wang et al., 2023). Remote sensing interpretation and UAV surveying identified 14 landslides in the Beishan area (Figure 1b), predominantly comprising large-scale mudstone landslides and loess-mudstone interface landslides. The slip zones primarily develop within the weak layers of Neogene (N) mudstone and the strongly weathered zone at the top of the mudstone strata. Detailed field investigations revealed that six massive landslide accumulations remain in a state of long-term slow deformation: the Malan landslide, Hongqishan landslide, Xiaozhuang Village landslide, Shuiyanzhai No. 1 landslide, Shuiyanzhai No. 2 landslide, and Shuiyanzhai No. 3 landslide. Among these, the Malan and Shuiyanzhai No. 2 landslides exhibit such severe deformation that the Malan village and Shuiyanzhai village were forced to relocate entirely, resulting in significant economic and property losses.
According to field investigations, over 90% of the buildings located on the slow-moving landslides in Tianshui Beishan are masonry structures. Masonry structure has high compressive strength and low tensile and flexural strength. Therefore, masonry structure mainly bears axial or small eccentric pressure, and its ability to resist landslide deformation is relatively weak. On the Malan landslide, buildings are primarily distributed in the upper-middle section of the main body and the rear edge of secondary slides (Figure 1c). The Hongqishan landslide hosts most buildings in its middle-lower section, while those on the Xiaozhuang Village landslide are mainly clustered at the slope toe. Building distributions on the Shuiyanzhai landslide occur predominantly in both the upper section and slope toe (Figure 1d). The deformation zones of these landslides are mainly concentrated in their upper-middle sections. Consequently, buildings situated in these areas have sustained the most severe damage.
2.2 Damage characteristics of masonry buildings
As for the masonry buildings exposed on the slow-moving landslides, the additional stress caused by the differential ground deformation of the landslide will cause the structure to be damaged or even completely destroyed. Through the investigation and statistics of more than 25 slow-moving landslides in Gansu and Qinghai Provinces, it is found that there is an obvious exponential function relationship between the wall inclination and displacement of ground cracks (Figure 2). The continuous creep of Malan village landslide in Qinzhou District, Tianshui City caused many cracks on the landslide surface. These cracks are about 9∼15 cm in width, and most of them are tension and settlement cracks (Figure 3a). The longitudinal walls perpendicular to the slide direction show obvious inclination, and the inclination rate is about 2∼4% (Figures 3b,c). The cross walls parallel to the slide direction mainly present 45°∼80° shear and inclined cracks, which generally extend upward from the corners of doors, windows and walls (Figures 3d,e). Wamuchi Landslide in Minxian County, Gansu Province, is a typical slow-moving loess landslide. There are many composite tension and subsidence cracks on the landslide surface, which are about 41∼43 cm in width and 9∼13 cm in depth (Figures 4b–d). The cross walls parallel to the main slide direction mainly show shear inclined cracks, which extend upward from the corners of doors and windows (Figure 4b). The longitudinal walls perpendicular to the slide direction are seriously damaged, with obvious inclination and cracking, and the wall inclination rate is about 6%–8% (Figures 4a–c). In addition, affected by the differential deformation of the landslide surface and the length of the longitudinal wall, several inclined cracks extending from bottom to top appear in the longitudinal wall (Figure 4a).
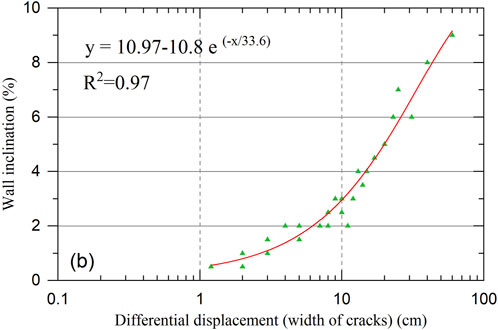
Figure 2. Correlation curve between the differential displacement of landslide and wall inclination.
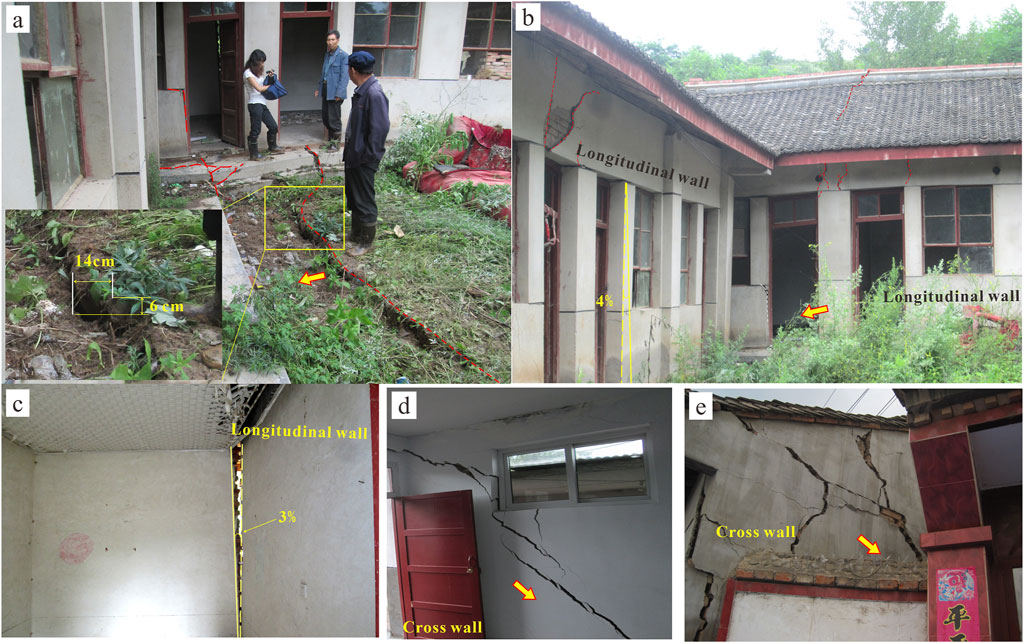
Figure 3. Damage of masonry buildings on Malan landslide in Tianshui City. (a) Tension cracks on the ground; (b,c) Inclined deformation of building walls; (d,e) Cracks on the cross wall.
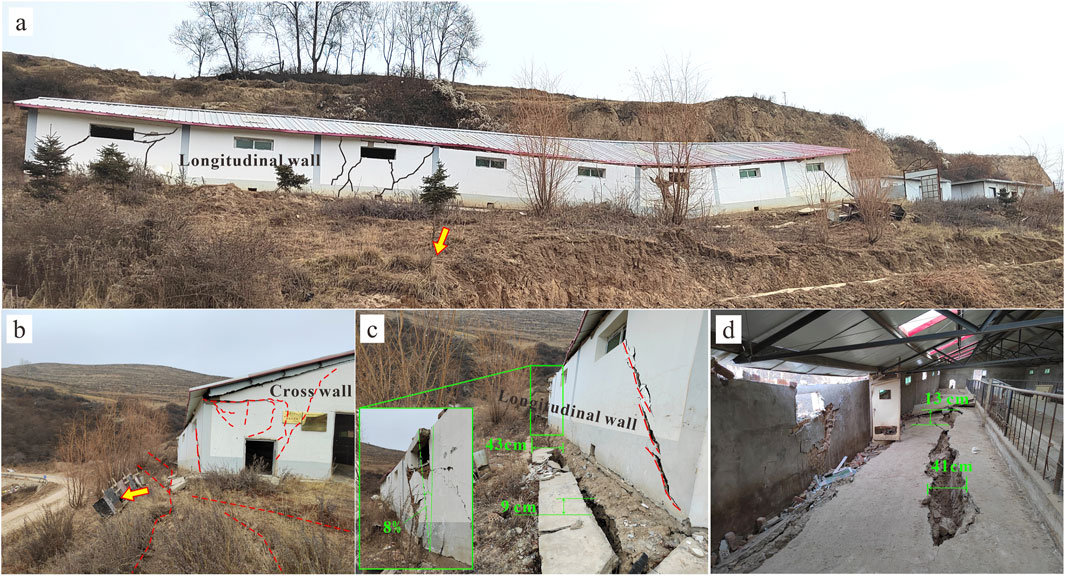
Figure 4. Damage of masonry building on Wamuchi landslide in Minxian, Dingxi City. (a) The integral deformation of the building; (b) Shear cracks on the cross wall; (c) Inclination of the longitudinal wall; (d) Tensile cracks on the ground.
According to the field investigation, there are five types of cracks on slow-moving landslide: horizontal tension cracks, vertical settlement cracks, combined tension cracks, combined uplift cracks and shear cracks. Since shear cracks are mainly distributed around the minor scarps of landslides, and houses are rarely built around the minor scarps, the influence of shear cracks on house damage is not considered. In this study, to focus on the response of unreinforced masonry walls to ground cracks, we assume that the masonry buildings are not equipped with additional reinforcing structures such as ring beams or structural columns. Consequently, the structural model, as illustrated in Figures 6, 7, includes only masonry walls and floor slabs, which are prevalent in loess regions and more vulnerable to ground deformation caused by slow-moving landslides. This simplification allows us to isolate the effects of ground deformation on the walls themselves, though it may not fully represent buildings with enhanced structural integrity.
The slow-moving landslide mainly shows horizontal tension deformation and vertical settlement deformation. The mechanism of masonry buildings subject to landslide deformation is complex, and the damage characteristics and types can be summarized into two categories. (1) The longitudinal wall perpendicular to the slide direction mainly shows the characteristics of overall inclined failure. In addition, cracks may appear in the wall due to uneven landslide deformation (Figure 5a). (2) The cross wall parallel to the slide direction are prone to oblique cracks extending from bottom to top along the mortar joints, and the dip angles of these cracks are generally greater than 40° (Figure 5b).
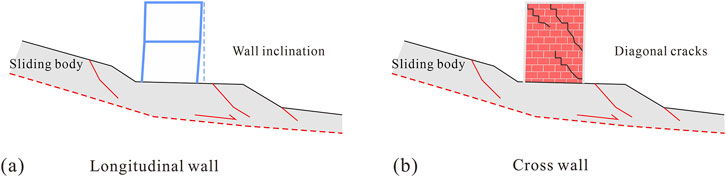
Figure 5. Damage patterns of (a) longitudinal wall and (b) cross wall.
According to the damage characteristics of masonry structures, the damage degree of the buildings can be evaluated by wall-cracking and building inclination. If the cracks on the wall is used as the indicator of vulnerability assessment, the number, width, length of the cracks have to be considered. However, these parameters are difficult to be effectively combined and quantified in the process of establishing the vulnerability curve. Therefore, referring to the Evaluation Standard for Dangerous Buildings (Ministry of Housing and Urban–Rural Development of PRC, 2016) and the building damage grade classification standard (Alexander, 1986), the inclination rate is chosen as the indicator of building vulnerability in this study.
Based on the above analysis, this study summarizes four schematic diagrams of building damage subject to ground cracks (Figure 6).
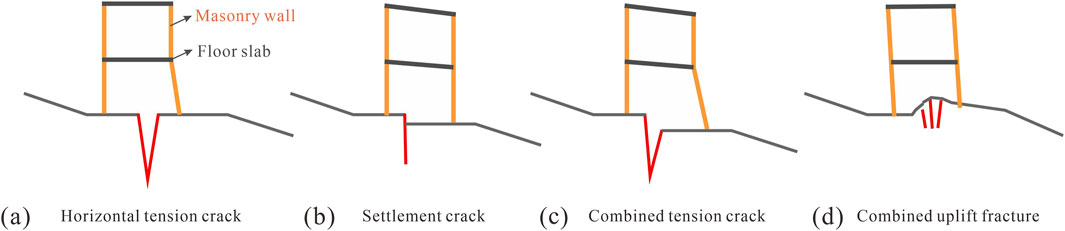
Figure 6. Schematic diagrams of building damage subject to ground cracks. (a) Horizontal tension crack; (b) Settlement crack; (c) Combined tension crack; (d) Combined uplift crack.
3 Failure process of masonry buildings affected by slow-moving landslides
3.1 Numerical analysis method
According to the schematic diagrams of building damage, a two-dimensional structural model is established, which includes masonry walls and floor slabs. Monitoring points are set on the building to monitor the cumulative displacement and inclination of the building wall (Figure 7). The Continuous-Discontinuous Element Method (CDEM) is used for numerical analysis in this study. CDEM is a coupled finite/discrete element method (FEM/DEM) that has been used for a wide variety of applications (Li et al., 2004; Feng et al., 2014). A microstructural model of material comprises two elements: block element and jointed element. The model is configured such that the FEM is used inside the block, while the DEM is adopted for the interface. A two-dimensional (2-D) contact contains one normal spring (kn) and one tangent spring (ks) (Feng et al., 2014). These springs are orthogonal to each other, and their characteristics are same as the DEM. The evolution from continuous to discontinuous deformation is simulated by the breakage of springs. The Mohr–Coulomb brittle fracture model is applied on the interface, with these contacts, the discontinuous deformation between blocks can be achieved.
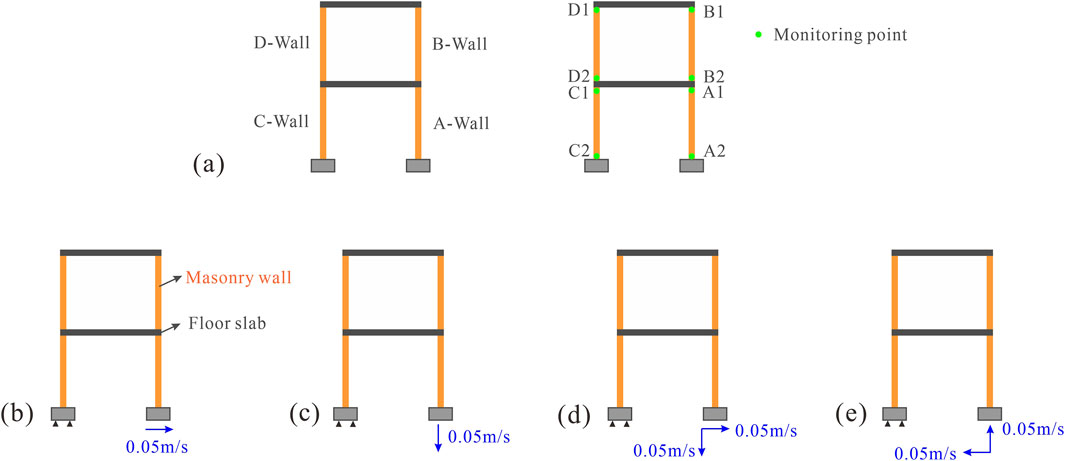
Figure 7. Structural model of the masonry building used in this study, consisting of masonry walls and floor slabs without ring beams or structural columns. (a) Layout of monitoring points; (b–e) Schematic diagram of four crack scenarios simulation.
In the 2D structural model developed in this study, the building walls are constructed with brick masonry, while the floor slabs are made of reinforced concrete. The thickness of the masonry walls is set to 240 mm, a common dimension in masonry buildings in Northwest China, providing sufficient load-bearing capacity and stability. The floor slab has a thickness of 200 mm, complying with the requirements for beam cross-sections specified in the Chinese building code.
Reinforced concrete is a complex engineering material, and it is theoretically feasible to establish solid models of reinforced concrete and concrete respectively for coupling analysis, but this will greatly reduce the mesh size, which makes the calculation difficult to converge, and the calculation efficiency is greatly reduced. Therefore, in our study, the integral modeling of reinforced concrete be used to replace the separate modeling, which can greatly simplify the calculation. The function of steel bars is equivalent to the mechanical parameters of the integral reinforced concrete model through the reinforcement ratio.
According to the principle of equal strength, the actual strength (Rt) of reinforced concrete can be estimated as:
where RC is the strength of concrete; RA is the yield strength of the reinforcement; Vs is the volume of reinforcement in the concrete, V is the volume of the concrete, n is the correction factor, typically ranging from 0.5 to 0.6. Vs/V is the reinforcement ratio in concrete. In this study, C30 concrete and HPB235 steel bars are selected as reinforced concrete materials, and the mechanical parameters of Floor slab calculated by Equation 1 are shown in Table 1.
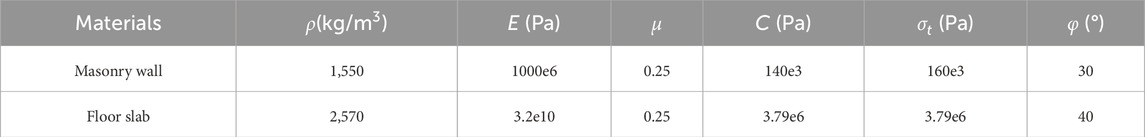
Table 1. Parameters used for the GDEM simulation.
In this numerical analysis, Mohr-coulomb model (elastoplastic constitutive and maximum tensile stress constitutive) is used for solid elements of the structural model. Since the shear and flexural failure mainly occurs in the building walls and floor slabs, virtual interfaces are set in their elements. The brittle fracture constitutive is adopted for virtual interface between solid elements to calculate the damage characteristics of the buildings. The normal and tangential contact stiffness of the virtual interface is 10 times of the material’s elastic modulus. According to Code for Design of Masonry Structures (Ministry of Housing and Urban–Rural Development of PRC, 2011), the failure of masonry buildings is generally along the section of masonry mortar joints, and the tension strength and shear strength are determined according to different mortar grades (Table 2). The strength parameters of masonry structure for this simulation mainly refer to M7.5 mortar strength. Physical and mechanical parameters used for the numerical analysis are shown in Table 1.
Table 2. Tension strength (ft) and shear strength (fτ) values of brick masonry wall when it is destroyed along ash joints.
In this study, different types of ground cracks are simulated by applying different velocity boundary conditions at the base of the building. The vertical movement of the left foundation of the building is fixed, and horizontal rightward velocity is applied to the right foundation of the building to simulate the generation of horizontal tension cracks on the ground; Vertical downward velocity is applied to the right foundation to simulate the formation of subsidence cracks; Horizontal rightward and vertical downward velocity are applied to the right foundation to simulate the generation of combined tension cracks; Horizontal leftward and vertical upward velocity are applied to the right foundation to simulate the generation of combined uplift cracks. On this basis, the effects of different crack types on the failure process of building structures are analyzed. The monitoring points and boundary conditions of the model are shown in Figure 7.
3.2 Failure process of masonry building
According to Figure 8, with the continuous expansion of cracks, the walls of the building show obvious inclination, and the Mises stresses of the first-floor walls are also significantly higher than that of the second floor. Plastic hinges and cracks also appeared in the contact parts of wall and floor. Under the scenarios of horizontal tension cracks and combined tension cracks, the inclination of the walls on the first-floor is higher than that of the second-floor. Under the conditions of settlement cracks and combined uplift cracks, the inclination of the walls on the second floor is higher than that of the first floor.
Figure 8. Mises stress evolution and structural failure process of building under different crack conditions (The % represent the inclination rates of building walls). (a) Horizontal tension crack; (b) Settlement crack; (c) Combined tension crack; (d) Combined uplift crack.
According to Figure 8a, with the expansion of horizontal tension crack, wall A on the first floor was inclined first, and when the width of the crack exceeded 60 cm, walls C, B, and D also inclined in turn. The junction between wall A and the foundation first failed, and then the junction between wall A and the upper floor slab also failed and fractured, and the maximum Mises stress of the failure node was about 240 kPa. According to Figure 8b, with the vertical expansion of the settlement cracks, walls B and D of the second-floor were inclined preferentially, and the plastic hinges and cracks also occurred at the contact nodes between the second-floor wall and the floor slab. When the settlement exceeded 40 cm, the first-floor wall also inclined, and the Mises stress near the contact node between the wall C and the foundation was the largest, about 200 kPa. According to Figure 8c, with the expansion of the combined tension cracks, the wall C of the first floor was inclined preferentially, and when the total displacement of the crack exceeded 56 cm, walls A, B and D also inclined in turn. The contact node between wall C and the upper floor slab first failed and fractured, then the contact node between wall A and the foundation also failed, and the maximum Mises stress of the failure node was about 280 kPa. According to Figure 8d, with the expansion of the combined uplift crack, wall C on the first floor was inclined preferentially, followed by walls B and D on the second floor, and wall A on the first floor was almost not inclined. The contact node between the wall C and the substructure preferentially failed and fractured, and the maximum Mises stress of the failure node was about 280 kPa.
Figure 9a shows that the Mises stress of the A1 and C1 nodes increases instantaneously at the initial stage of tension crack expansion (displacement < 10 cm), and the stress increment is about 90–100 kPa. After that, the Mises stress of A1 lowly increases to 240 kPa, and the Mises stress of C1 slowly decreases to 125 kPa. The Mises stress of A2 increases from 175 kPa to 225 kPa within 30 cm of tension crack extension, and then remains stable. When the crack displacement exceeds 70 cm, the Mises stress of all the bottom joints decreases suddenly, which is mainly due to the fracture of the plastic hinge elements of the A and C walls, resulting in the stress release inside the elements. Figure 9b shows that the Mises stress of the A1 and C1 nodes increases instantaneously at the initial stage of settlement crack expansion (displacement < 10 cm), and the stress increment is about 70–80 kPa. After that, The Mises stress of A1 and C1 decreases to 150 kPa and tends to be stable. When the crack displacement exceeds 40 cm, the Mises stress of C1 suddenly decreases to 100 kPa, which is mainly due to the fracture of the plastic hinge element at the C1 node with the continuous tilt of the building wall, resulting in the stress release inside the element. The stresses of A2 and C2 remain basically stable during the settlement crack expansion. Figure 9c shows that the Mises stress of A1 and C1 nodes fluctuates significantly at the initial stage of combined tension crack expansion (displacement <15 cm), with the stress variation range of about 70–100 kPa. With the crack displacement increasing to 50 cm, the Mises stress of C1 slowly increases to 240 kPa, and that of A1 slowly decreases to 150 kPa. When the crack displacement exceeds 53 cm, the Mises stress of C1 suddenly increases to 300 kPa, and then decreases to 150 kPa with the fracture of plastic hinge element. When the crack displacement exceeds 65 cm, the Mises stress of A1 suddenly increases to 225 kPa, and then decreases to 150 kPa with the fracture of plastic hinge element. The stresses of A2 and C2 remain basically stable during the combined tension crack expansion. Figure 9d shows that at the initial stage of combined uplift crack propagation (displacement < 20 cm), the Mises stress of C1 increases by about 110 kPa, that of C2 increases by about 50 kPa, and that of A1 decreases by about 100 kPa. With the crack displacement increasing to 43 cm, the Mises stress of A1 decreases to 100 kPa due to the fracture of plastic hinge element. As the crack displacement exceeds 65 cm, the Mises stress of C1 and C2 suddenly decreases due to the fracture of the plastic hinge element. The stress of A2 remain basically stable during the combined uplift crack expansion.
Figure 9. Mises stress change curves of the monitoring points under different crack conditions. (a) Horizontal tension crack; (b) Settlement crack; (c) Combined tension crack; (d) Combined uplift crack.
In summary, the stress changes of the joints of wall A and wall C can be divided into three stages under different crack expansion scenarios: stress increase stage, stress stable stage and the stress sudden drop stage. In the initial stage of crack expansion (displacement < 20 cm), with the slight inclination of the building, the Mises stress of the bottom wall nodes fluctuates greatly and shows the tendency of stress increase during the process of internal deformation and coordination of the structure. In this stage, plastic hinges are also formed at the upper and lower ends of the building walls. With the continuous expansion of the crack, the inclination of the building structure gradually increases, and the Mises stress inside the structure changes slowly and the change amplitude is small. As the crack expands to a certain threshold, the plastic hinge elements at both ends of the building wall break, resulting in a sudden decrease of Mises stress. In addition, under the four crack expansion scenarios, the stress of A1 and C1 nodes at the top of walls A and C changes greatly, while the stress of A2 and C2 nodes changes little. Therefore, the buildings exposed to slow-moving landslides need to focus on reinforcing the contact areas of walls and floors.
The three-stage stress evolution correlates with structural adaptation to ground crack propagation. The Mises stress at nodes A1 and C1 initially rises due to the redistribution of internal forces as the building adjusts to minor ground deformation. This stress accumulation facilitates the formation of plastic hinges at wall-floor junctions. As crack displacement surpasses a critical threshold, these hinges fracture, leading to a sudden stress drop, which signifies localized structural failure consistent with our simulation outcomes.
According to the Figure 10, at the initial stage of crack propagation, the plastic zone of the building mainly appears in the hinge part of the floor slab and the bearing wall, and the failure mode is mainly shear failure. With the increase of crack displacement, the inclination rate of the building increases gradually, so does the plastic zone area. The plastic zone of the second-floor wall of the building only develops in the contact part of the wall and the floor. From the perspective of plastic zone, the development area of plastic zone of the building is smaller under the scenario of horizontal tension crack and combined uplift crack, and that is the largest under the combination tension crack scenario.
Figure 10. Plastic zone development of buildings under different crack conditions. (a) Horizontal tension crack; (b) Settlement crack; (c) Combined tension crack; (d) Combined uplift crack.
Under the horizontal tension crack scenario, the greater the ground crack displacement, the greater the traction force in the first floor wall, resulting in obvious tension and inclination phenomenon of the wall; When the crack displacement is less than 70 cm, only the inclination rate of wall A increases linearly with the increase of the crack expansion (Figures 10A, 11a), and the inclination rates of walls B,C and D are almost 0; When the crack displacement exceeds 70 cm, the inclination rates of walls A∼D increase rapidly, and when the crack displacement reaches 78 cm, the inclination rates of walls A∼D exceed 40% (Figure 11a). Under the vertical settlement crack scenario, only walls B and D are inclined significantly with the expansion of the crack, while walls A and C are inclined slightly, with the inclination rates of less than 2% (Figures 10b, 11b); When the crack displacement is less than 43 cm, the inclination rates of walls B and D increase linearly with the increase of crack displacement; When the crack displacement exceeds 43 cm, the inclination rates of walls B and D increase exponentially (Figure 11b). Under the combined tension crack scenario, when the crack displacement is less than 70 cm, the inclination rates of walls A∼D increase linearly with the increase of crack displacement (Figures 10c, 11c), and those A∼D increase in order from large to small are: C wall > D wall = B wall > A wall; When the crack displacement exceeds 70 cm, the inclination rates of walls A and C show an exponential growth trend with the increase of crack displacement (Figure 11c). Under the combined uplift crack scenario, when the crack displacement is less than 55 cm, the inclination rates of walls B-D increase linearly with the increase of crack displacement (Figures 10d, 11d), and the growth rates are almost the same; When the crack displacement is greater than 55 cm, the inclination rates of walls B and D increase exponentially (Figure 11c), and wall C still maintains a linear growth trend. During the expansion of the combined expansion crack, the inclination rate of wall A hardly changed. In addition, the roof load and the RC floor slab significantly influence the stress and deformation of masonry walls. The roof load increases the axial compression on the walls, enhancing their shear strength but potentially exacerbating uneven settlement under ground crack propagation. The high stiffness of the RC slab restricts the relative displacement of the walls, affecting their inclination and cracking patterns. The inclusion of these factors enhances the consistency between the simulation results and field observations.
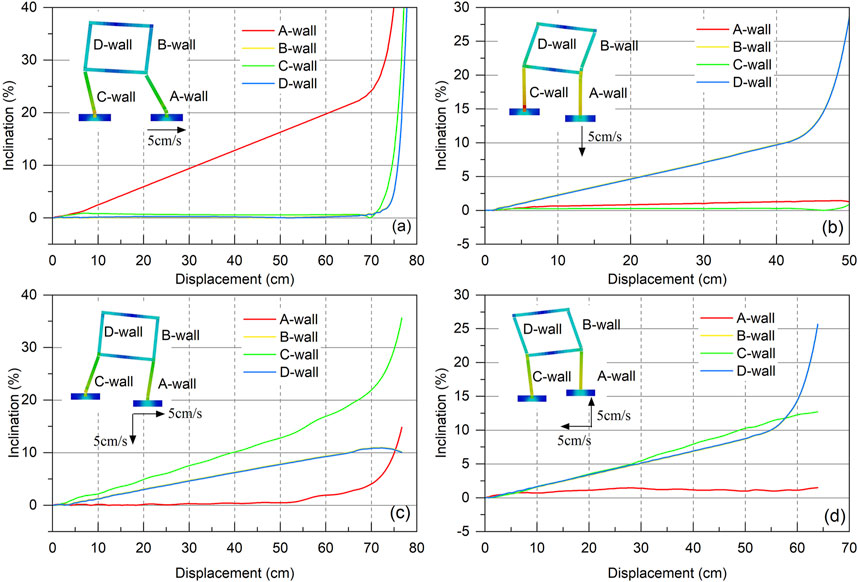
Figure 11. The variation curve of the building inclination with the displacement of the ground crack. (a) Horizontal tension crack; (b) Settlement crack; (c) Combined tension crack; (d) Combined uplift crack.
Under the four ground crack scenarios, the change of wall inclination rates shows an obvious threshold effect with the expansion of cracks; When the crack displacement is less than the threshold, the inclination rates of walls increase linearly with the crack expansion. When the crack displacement is greater than the threshold, the inclination rates of walls increase exponentially and rapidly with the crack expansion. The linear-to-exponential transition in inclination rates marks the structural yield point. For small crack displacements, deformation remains linear within the structure’s elastic limit. Beyond this threshold, an exponential increase in inclination occurs due to the onset of plastic deformation and progressive loss of structural integrity. This behavior corroborates field observations of masonry buildings subjected to slow-moving landslides. According to Figures 10, 11, the inclination rates of walls B and D are completely consistent, and that shows a regular growth trend with crack propagation in the scenarios of settlement, combined tension and combined uplift cracks. The inclination rate of wall A only increases significantly in the case of horizontal tension crack, and that is not sensitive to the expansion of the crack in the vertical direction. The wall C shows a regular growth trend with the crack expansion only under the combined tension and uplift crack scenarios.
Figure 12 shows the change curve of the inclination rate of the most dangerous wall with the fracture displacement under four crack scenarios. For crack displacements below 40 cm, the linear correlation between inclination and displacement indicates a consistent structural response. Under the same crack displacement conditions, the inclination rate of the building wall caused by the horizontal tension crack is the highest, that caused by the combined uplift crack is the smallest, and that caused by the settlement crack and the combined tensile crack is in the middle, which are basically consistent with the results of Chen (2022). Horizontal tension cracks induce the highest inclination due to direct tensile loading parallel to the slide direction. In contrast, combined uplift cracks mitigate tilt via vertical displacement counteracting horizontal strain, delaying failure.
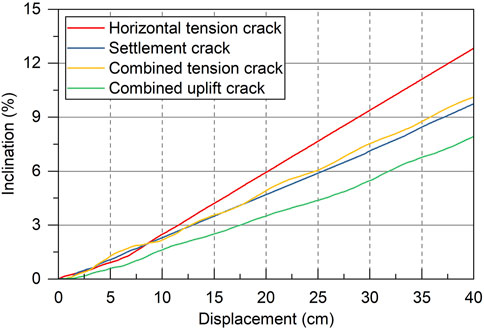
Figure 12. Correlation between the building inclination and the displacement of the ground crack.
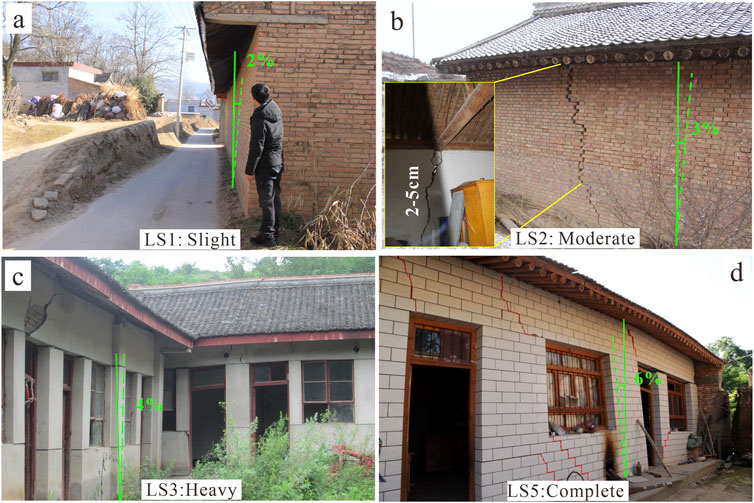
Figure 13. Damage grade of masonry buildings. (a) Slight damage; (b) Moderate damage; (c) Heavy damage; (d) Complete damage.
4 Vulnerability assessment curve of masonry buildings
4.1 Damage grade of masonry building
According to the Identification Standard for Dangerous Houses (Ministry of Housing and Urban–Rural Development of PRC, 2016), the overall inclination rate of a building with two or less floors exceeds 3%, and that of a building with three or more floors exceeds 2%, which should be assessed as a dangerous state. It should be noted that the dangerous state specified in this standard does not indicate the failure or collapse of the building, but it needs to be reinforced and repaired. Alexander (1986) established the classification standard of building damage grade based on the inclined state of the wall and the degree of cracking. The standard stipulates that when the wall is inclined 5∼6°, the house is uninhabitable. Based on the field investigation in Tianshui area, the buildings exposed to slow-moving landslides show different degrees of cracking and inclination. Generally, when the inclination rate of masonry buildings is less than 2%, the buildings can be normally inhabited. When it exceeds 4%, the walls show serious cracking or inclination, and the buildings are basically uninhabitable.
In this study, the damage degrees of masonry building are divided into five grades: slight damage, moderate damage, heavy damage, extreme damage and complete damage (Table 3; Figure 13). And the corresponding limits of building inclination rates are shown in Table 3. Slight damage means that the building does not need reinforcement and maintenance. Moderate and heavy damage indicate that the building needs to be strengthened and repaired. Extreme and complete damage means that the building is uninhabitable, or the cost of maintenance and reinforcement exceeds that of reconstruction.
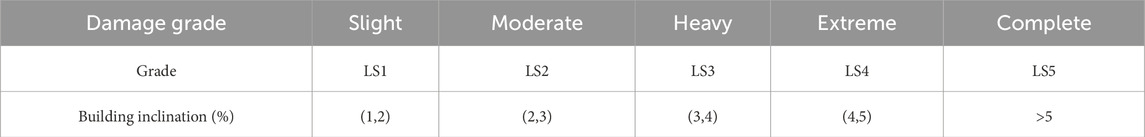
Table 3. Damage grade of masonry buildings.
4.2 Vulnerability assessment curve
The physical vulnerability of masonry building indicates the probability that the structure exceeds the specific damage state in different landslide intensities. Physical vulnerability curves are usually represented by S-shaped curves fitted with Weibull function (Papathoma-Köhle, 2016). Therefore, the physical vulnerability model of masonry building defined in this paper is as follows:
V is the vulnerability value, D is the ground crack displacement, a and b are the parameters to be fitted. According to the correspondence between the inclination rates and damage grades of masonry building (Table 3), the suggested values of vulnerability are given (Table 4).
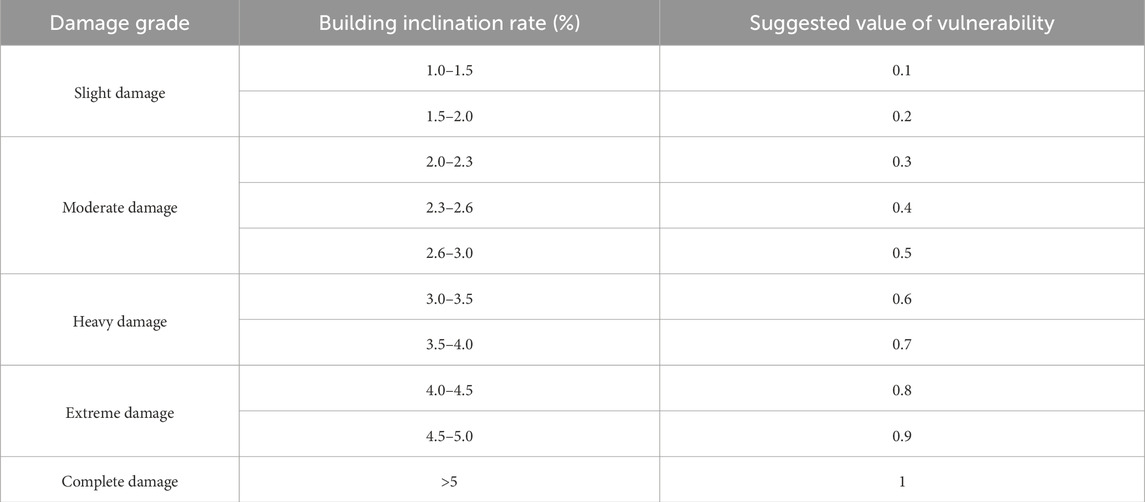
Table 4. The suggested values of vulnerability.
Based on the quantitative criteria of damage degree of masonry structure and correlation between the building inclination and the crack displacement, the vulnerability curves (Figure 14) of masonry building under landslide ground cracks are obtained by Weibull function (Equation 2). The results show that there is a high correlation between the ground crack displacement and the physical vulnerability, and the R2 exceeds 0.95. It should be noted that Figure 14 is only the vulnerability curve of a specific structural building (2-story masonry structure, mortar strength = M7.5). Similarly, the method proposed in this study can be used to establish vulnerability assessment models for buildings with different structures and stories. This method has a great prospect of popularization and application.
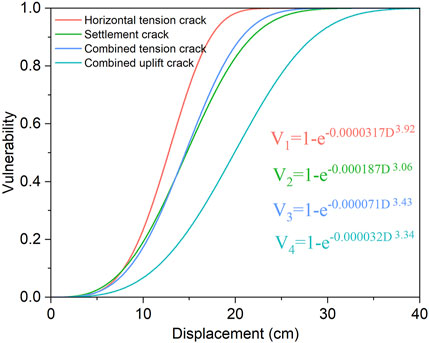
Figure 14. Vulnerability curves of 2-floors masonry building exposed on slow-moving landslide.
The vulnerability model of the 2-story masonry building under the horizontal tension crack scenario is shown in Equation 3:
The vulnerability model of the 2-story masonry building under the vertical settlement crack scenario is shown in Equation 4:
The vulnerability model of the 2-story masonry building under the combined tension crack scenario is shown in Equation 5:
The vulnerability model of the 2-story masonry building under the combined uplift crack scenario is shown in Equation 6:
According to Figure 14, the vulnerability curves of the building exposed to slow-moving landslide are S-shaped. Table 5 shows the limit displacement assumed for each damage state (DS) under four crack scenarios. The ground crack displacement thresholds for building vulnerability reaching 1 under four crack scenarios are 22 cm, 26 cm, 27 cm and 37 cm, respectively. When the displacement of ground crack is less than 10 cm, the vulnerability of the building under the four crack scenarios is less than 0.2, which belongs to the slight damage level. When the displacement of ground crack reaches 20 cm, the vulnerability of the building under the horizontal tension crack scenario is 1, which reaches the level of complete damage; Under the scenario of settlement crack and combined tensile crack, the vulnerability values of the building are 0.8, which reaches the level of extreme damage. Under the scenario of combined uplift crack, the vulnerability of the building is 0.5, which belongs to the level of moderate damage. When the displacement of ground crack reaches 30 cm, the buildings are completely destroyed under the scenarios of horizontal tension crack, settlement crack and combined tension cracks; While under the scenario of combined uplift crack, the vulnerability of the building is 0.9, which belongs to the level of extreme damage. When the displacement of ground crack exceeds 37 cm, the building is completely destroyed under the combined uplift crack scenario, and the vulnerability value reaches 1.
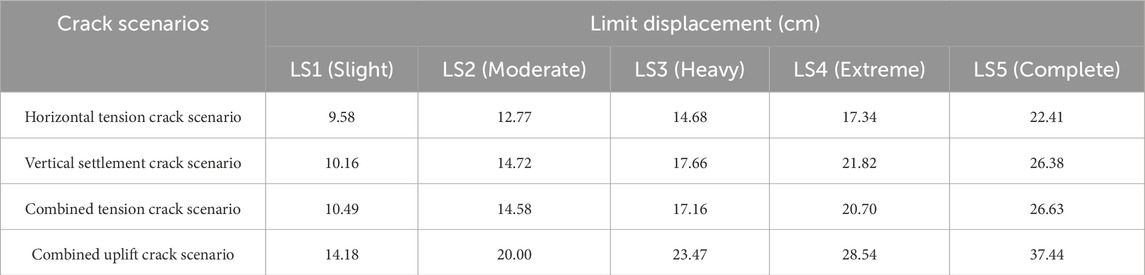
Table 5. The limit displacement assumed for each damage state (DS) under four crack scenarios.
5 Discussion
5.1 Rationality of vulnerability assessment index
The damage characteristics of masonry buildings exposed to slow-moving landslides are mainly shown as wall cracking or inclination. For buildings that have been damaged after disasters, the damage degree can be identified according to the development of the wall cracks or inclination (Alexander, 1986; Chen et al., 2023). The appearance and expansion of cracks are subject to the building stiffness. Richard et al. (2005) reported that when highly stiff buildings are very inclined due to ground deformation, the wall-cracking phenomenon is not obvious; On the contrary, if the stiffness of the building is small, the cracks on the wall becomes serious, but it is difficult to establish a equation between the crack parameters (extension length, width, number, et al.) and the landslide intensity. Therefore, the vulnerability quantification of the masonry buildings exposed to slow-moving landslides is still a major challenge.
With reference to the Classification of Earthquake Damage to Buildings and Special Structures (China National Standardization Management Committee, 2009) and Standard for Dangerous Building Appraisal (Ministry of Housing and Urban–Rural Development of PRC, 2016), it is simple and practical to assess the building vulnerability by the wall inclination (Chen et al., 2020). As for the perspective of risk assessment, although the inclination of the building cannot accurately represent the absolute damage degree of the building, once it exceeds the habitable threshold, even if the majority of the structure has not failed, we can also consider the building’s vulnerability reach 1 (Chen et al., 2020; Mansour et al., 2011). Therefore, it is reasonable to use the inclination of the building wall to assess its vulnerability.
5.2 Validations of the vulnerability curves
Since the damaged buildings exposed to the slow-moving landslide in the loess areas are mainly caused by horizontal tension cracks and combined tension cracks, the observation results of the damaged buildings in the field are compared and verified with the vulnerability curves under the two cracks scenarios (Figure 15). The results show that the vulnerability of the buildings observed in the field are basically consistent with the vulnerability curves established in this study, but the vulnerability value observed in the field is greater than the estimated value by the vulnerability curves when the crack displacement is less than 10 cm. The reasons may be as follows: (1) The numerical simulation simplifies the three-dimensional building structure into a two-dimensional structure, so it cannot accurately reflect the complex stress and deformation coordination relationship in the three-dimensional building structure. (2) In the numerical simulation, the cracks expand at uniform speed, while the cracks expansion on the slow-moving landslides observed in the field are nonlinear, which also leads to the difference between the deformation and failure characteristics of the building observed in the field and the numerical simulation results. Through the verification of some field observation results, it shows that the simulation results are reliable and reveal the damage evolution of the masonry structures affected by the horizontal and combined tensile cracks on the slow-moving landslides, and the vulnerability curves of masonry structure constructed in this study have high reliability.
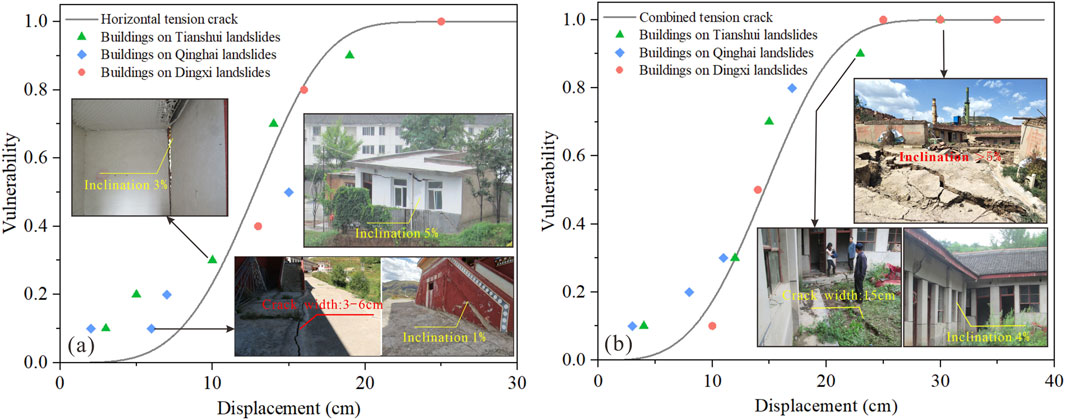
Figure 15. Validation of the vulnerability curves. (a) Horizontal tension crack scenario; (b) Combined tension crack scenario.
5.3 Necessity and methods of structural strengthening
According to the Standard for Dangerous Building Appraisal (Ministry of Housing and Urban–Rural Development of PRC, 2016), when the inclination rate of a building exceeds specific thresholds, strengthening or repair is required to ensure safety. For masonry buildings affected by slow-moving landslides, strengthening measures are particularly critical to prevent further structural deterioration and ensure operational safety. The following common strengthening methods are applicable: (1) Embedding steel reinforcements in masonry walls enhances their tensile and shear strength. Belliazzi et al. (2024) proposed a non-linear analysis method for rectangular cross-section masonry, providing a dimensionless closed-form solution that supports the design of steel reinforcement. (2) Ferretti et al. (2023) demonstrated that reinforced repointing combined with Fibre-Reinforced Cementitious Matrix (FRCM) and Coated Reinforced Mesh (CRM) systems is highly effective in repairing cracked masonry and improving structural performance, particularly for walls damaged by landslides. (3) To address ground cracks and settlement caused by landslides, techniques such as grouting or pile foundations can stabilize the foundation, reducing building inclination and deformation. These strengthening methods significantly enhance the deformation resistance of masonry buildings, extend their service life, and mitigate potential risks posed by landslides.
5.4 Limitations and future research potential
The vulnerability curves proposed in this study have certain limitations. Firstly, the foundation type and depth are not taken into accounts. Chen et al. (2020) demonstrates that the foundation depth is a critical factor that affects the physical vulnerability value. Therefore, the influence of the foundation type and depth of the building on the vulnerability will be further studied. Secondly, only masonry structure with two floors is considered, however, different building structures and floors can affect the ability of buildings to resist the landslide deformation (Ferlisi et al., 2020; Nicodemo et al., 2020; Negulescu and Foerster, 2010). In order to improve the accuracy of buildings vulnerability assessment and reduce the uncertainty in the establishment of the vulnerability curves, different building structures, materials and floors will be considered in future researches. In addition, only the deformation characteristics of buildings exposed to slow-moving landslides in the loess area are used to verify the vulnerability model proposed in this paper. Due to the lack of sample data in other regions of China, the applicability of the vulnerability model has not been verified in this study. In the future, more vulnerability data of buildings exposed to slow-moving landslides will be collected to verify the accuracy of this model.
The displacement of the ground crack on the landslide only represents the relative displacement of the landslide deformation, but not the absolute displacement (Chen et al., 2020; Kang et al., 2021). Although the displacement of ground crack directly affects the landslide intensity and building damage level, it has limitations in practical application as an indicator of landslide intensity. Because common landslide hazard assessment methods such as InSAR, numerical simulation and theoretical calculation cannot directly and quantitatively characterize the displacement of ground cracks (Mansour et al., 2011; Nicodemo et al., 2020; Kang et al., 2021). Therefore, it is urgent to establish the quantitative vulnerability assessment model with landslide absolute displacement as the disaster intensity index in the future, and it is expected to solve the vulnerability prediction assessment and emergency rapid assessment of buildings exposed to slow-moving landslide in different disaster scenarios (Palmisano et al., 2021; Peduto et al., 2020; Nicodemo et al., 2020; Mansour et al., 2011).
The numerical simulation simplifies the three-dimensional building structure into a two-dimensional structure, which may affect the accuracy of building vulnerability simulation results. In the furfure research, 3D numerical simulation methods can be used to analysis and compare the building vulnerability characteristics under different ground crack scenarios. Meanwhile, it is also necessary to introduce the probability density function to analyze the influence of uncertainties such as the number of floors, floor height, and mechanical strength of building materials on the vulnerability (Luo et al., 2021; Sun et al., 2023), so as to realize the vulnerability probability evaluation of buildings in different damage states.
Although limitation exists, the numerical simulation results provide a new perspective to analyze the progressive failure process and vulnerability of masonry building across ground cracks on slow-moving landslides.
6 Conclusion
Through field investigations, CDEM numerical simulations, and statistical analyses, this study reveals the cooperative deformation characteristics and progressive failure mechanisms of masonry buildings subjected to ground cracks in slow-moving landslides, and establishes physical vulnerability curves for four distinct ground crack scenarios. The main findings are summarized as follows:
(1) Masonry buildings affected by slow-moving landslides primarily exhibit transverse wall cracking and longitudinal wall inclination due to ground crack propagation. Consequently, a vulnerability assessment framework was developed, utilizing longitudinal wall inclination rate and ground crack displacement as indicators for building vulnerability and landslide hazard intensity, respectively.
(2) Progressive crack propagation induces significant wall inclination, with first-floor walls exhibiting substantially higher Mises stresses compared to second-floor walls. Plastic hinges and cracks develop at wall-floor junctions. In horizontal and combined tension crack scenarios, first-floor walls demonstrate greater inclination, whereas settlement and combined uplift crack scenarios predominantly affect second-floor walls.
(3) Wall inclination rates exhibit a distinct threshold effect: below the threshold, inclination increases linearly with crack displacement, while above the threshold, it demonstrates exponential growth.
(4) A linear relationship between wall inclination and crack displacement is evident for displacements below 40 cm. Under identical crack displacement conditions, wall inclination rates decrease in the following order: horizontal tension, combined tension, settlement, and combined uplift scenarios. The differential effects of these scenarios on wall inclination become more pronounced with increasing crack displacement.
(5) The vulnerability curves of masonry structures under four ground crack scenarios are fitted by Weibull function. The thresholds of ground crack displacement for building vulnerability reaching 1 under four crack scenarios are 22 cm, 26 cm, 27 cm and 37 cm, respectively. Field observations of damaged buildings validated the proposed vulnerability curves, demonstrating high model reliability.
Data availability statement
The raw data supporting the conclusions of this article will be made available by the authors, without undue reservation.
Ethics statement
Written informed consent was obtained from the individual(s) for the publication of any identifiable images or data included in this article.
Author contributions
HW: Investigation, Software, Writing – original draft. JM: Conceptualization, Visualization, Writing – review and editing.
Funding
The author(s) declare that financial support was received for the research and/or publication of this article. This work was supported by the Open Fund Project of the Observation and Research Station of Geological Disaster in Lanzhou, MNR [grant number: ORSGD-2024-01], National Natural Science Foundation of China [grant number: 42307266, 42130720], and the China Geological Survey [grant numbers: DD20221738].
Acknowledgments
The authors’ special appreciation goes to the editor and reviewers of this manuscript for their useful comments. We thank Warwick Hastie, from Liwen Bianji, Edanz Editing China, for editing the English text of a draft of this manuscript.
Conflict of interest
The authors declare that the research was conducted in the absence of any commercial or financial relationships that could be construed as a potential conflict of interest.
Generative AI statement
The authors declare that no Generative AI was used in the creation of this manuscript.
Publisher’s note
All claims expressed in this article are solely those of the authors and do not necessarily represent those of their affiliated organizations, or those of the publisher, the editors and the reviewers. Any product that may be evaluated in this article, or claim that may be made by its manufacturer, is not guaranteed or endorsed by the publisher.
Abbreviations
1ρ,Density; C, Cohesion; E, Elasticity modulus; μ, Poisson’s ratio; σt, ft, Tensile strength; φ, Internal friction angle; fτ, shear strength; Es, Compression modulus.
References
Alexander, D. (1986). Landslide damage to buildings. Environ. Geol. Water Sci. 8, 147–151. doi:10.1007/BF02509902
Belliazzi, S., Lignola, G. P., Cosenza, E., and Fabbrocino, F. (2024). Non-linear analysis of rectangular cross-sections with different reinforcements: dimensionless closed form solution. Mater. Struct. 57, 33. doi:10.1617/s11527-024-02293-2
Chen, L. X., Yin, K. L., and Dai, Y. X. (2011). Building vulnerability evaluation in landslide deformation phase. J. Mt. Sci. 8, 286–295. doi:10.1007/s11629-011-2101-z
Chen, Q. (2022). Study on failure behavior and vulnerability of masonry structure caused by ground cracks on slow-moving landslides. Doctor. Wuhan: China University of Geosciences.
Chen, Q., Chen, L., Gui, L., Yin, K., Shrestha, D. P., Du, J., et al. (2020). Assessment of the physical vulnerability of buildings affected by slow-moving landslides. Nat. Hazards Earth Syst. Sci. 20, 2547–2565. doi:10.5194/nhess-2019-318
Chen, Q., Chen, L., Macciotta, R., Yin, K., Gui, L., Zhao, Y., et al. (2023). Experimental investigation of masonry building damage caused by surface tension cracks on slow-moving landslides. Nat. Hazards 119, 1193–1221. doi:10.1007/s11069-023-06141-4
China National Standardization Management Committee (GB/T24335-2009) (2009). Classification of earthquake damage to buildings and special structures. Beijing: Standards Press of China.
Cooper, A. H. (2008). The classification, recording, databasing and use of information about building damage caused by subsidence and landslides. Q. J. Eng. Geol. Hydrogeology 41, 409–424. doi:10.1144/1470-9236/07-223
Deck, O., Al Heib, M., and Homand, F. (2003). Taking the soil–structure interaction into account in assessing the loading of a structure in a mining subsidence area. Eng. Struct. 25, 435–448. doi:10.1016/S0141-0296(02)00184-0
Feng, C., Li, S., Liu, X., and Zhang, Y. (2014). A semi-spring and semi-edge combined contact model in CDEM and its application to analysis of Jiweishan landslide. J. Rock Mech. Geotechnical Eng. 6, 26–35. doi:10.1016/j.jrmge.2013.12.001
Ferlisi, S., Nicodemo, G., Peduto, D., Negulescu, C., and Grandjean, G. (2020). Deterministic and probabilistic analyses of the 3D response of masonry buildings to imposed settlement troughs. Georisk Assess. Manag. Risk Eng. Syst. Geohazards 14, 260–279. doi:10.1080/17499518.2019.1658880
Ferretti, F., Khatiwada, S., Incerti, A., Giacomin, G., Tomaro, F., De Martino, V., et al. (2023). Structural strengthening of masonry elements by reinforced repointing combined with FRCM and CRM. Procedia Struct. Integr. 44, 2254–2261. doi:10.1016/j.prostr.2023.01.288
Kang, Y., Lu, Z., Zhao, C., Xu, Y., Kim, J.-W., and Gallegos, A. J. (2021). InSAR monitoring of creeping landslides in mountainous regions: a case study in Eldorado National Forest, California. Remote Sens. Environ. 258, 112400. doi:10.1016/j.rse.2021.112400
Lacroix, P., Handwerger, A. L., and Bièvre, G. (2020). Life and death of slow-moving landslides. Nat. Rev. Earth and Environ. 1, 404–419. doi:10.1038/s43017-020-0072-8
Lei, Y., Gu, H., and Cui, P. (2022). Vulnerability assessment for buildings exposed to torrential hazards at Sichuan-Tibet transportation corridor. Eng. Geol. 308, 106803. doi:10.1016/j.enggeo.2022.106803
Li, S., Zhao, M., Wang, Y., and Rao, Y. (2004). A new numerical method for dem –block and particle model. Int. J. Rock Mech. Min. Sci. 41, 414–418. doi:10.1016/j.ijrmms.2004.03.076
Luo, H., Zhang, L. M., He, J., and Yin, K. (2021). Reliability based formulation of building vulnerability to debris flow impacts. Can. Geotechnical J. 59, 40–54. doi:10.1139/cgj-2020-0120
Luo, H. Y., Zhang, L. M., Zhang, L. L., He, J., and Yin, K. S. (2023). Vulnerability of buildings to landslides: the state of the art and future needs. Earth-Science Rev. 238, 104329. doi:10.1016/j.earscirev.2023.104329
Mansour, M. F., Morgenstern, N. R., and Martin, C. D. (2011). Expected damage from displacement of slow-moving slides. Landslides 8, 117–131. doi:10.1007/s10346-010-0227-7
Ministry of Housing and Urban–Rural Development of PRC (GB50003-2011) (2011). Code for design of masonry structures. Beijing: China Architecture and Building Press.
Ministry of Housing and Urban–Rural Development of PRC (JGJ125-2016) (2016). Standard for dangerous building appraisal. Beijing: China Architecture and Building Press.
Negulescu, C., and Foerster, E. (2010). Parametric studies and quantitative assessment of the vulnerability of a RC frame building exposed to differential settlements. Nat. Hazards Earth Syst. Sci. 10, 1781–1792. doi:10.5194/nhess-10-1781-2010
Nicodemo, G., Ferlisi, S., Peduto, D., Aceto, L., and Gullà, G. (2020). “Damage to masonry buildings interacting with slow-moving landslides: a numerical analysis,” in Geotechnical research for land protection and development. Editors F. Calvetti, F. Cotecchia, A. Galli, and C. Jommi (Cham: Springer International Publishing), 52–61.
Palmisano, F., Vitone, C., Cotecchia, F., Santaloia, F., and Peduto, D. (2021). “An interdisciplinary approach to landslide damage assessment in urban areas,” in IABSE congress ghent 2021 (Belgium: Ghent), 1083–1091.
Papathoma-Köhle, M. (2016). Vulnerability curves vs. vulnerability indicators: application of an indicator-based methodology for debris-flow hazards. Nat. Hazards Earth Syst. Sci. 16, 1771–1790. doi:10.5194/nhess-16-1771-2016
Peduto, D., Nicodemo, G., Caraffa, M., and Gullà, G. (2018). Quantitative analysis of consequences to masonry buildings interacting with slow-moving landslide mechanisms: a case study. Landslides 15, 2017–2030. doi:10.1007/s10346-018-1014-0
Peduto, D., Santoro, M., Aceto, L., Borrelli, L., and Gullà, G. (2020). Full integration of geomorphological, geotechnical, A-DInSAR and damage data for detailed geometric-kinematic features of a slow-moving landslide in urban area. Landslides 18, 807–825. doi:10.1007/s10346-020-01541-0
Richard, R. J., Voss Frank, T., Rossow, E., and Blackburn, J. T. (2005). Evaluating damage potential in buildings affected by Excavations. J. Geotechnical Geoenvironmental Eng. 131, 1199–1210. doi:10.1061/(ASCE)1090-0241(2005)131:10(1199)
Singh, A., Kanungo, D., and Pal, S. (2019). Physical vulnerability assessment of buildings exposed to landslides in India. Nat. Hazards 23, 753–790. doi:10.1007/s11069-018-03568-y
Son, M., and Cording Edward, J. (2005). Estimation of building damage due to excavation-induced ground movements. J. Geotechnical Geoenvironmental Eng. 131, 162–177. doi:10.1061/(ASCE)1090-0241(2005)131:2(162)
Sun, X., Zeng, P., Li, T., Jimenez, R., Xu, Q., and Zhang, L. (2023). Probabilistic framework to evaluate scenario-based building vulnerability under landslide run-out impacts. Eng. Geol. 325, 107274. doi:10.1016/j.enggeo.2023.107274
Tan, Z., and Deng, K. (2004). Coordinating work model of ground, foundation and structure of building in mining area. J. China Univ. Mining Tech. 33, 30–33.
Vaiano, G., Belliazzi, S., Olivieri, C., Ramaglia, G., Fabbrocino, F., and Miano, A. (2025). “Assessment of typological residential masonry building under vertical ground settlements,” in Computational mechanics and applied mathematics: perspectives from young scholars. Editors F. Marmo, S. Cuomo, and A. Cutolo (Nature Switzerland, Cham: Springer), 177–187.
Vallero, G., De Biagi, V., Barbero, M., Castelli, M., and Napoli, M. L. (2020). A method to quantitatively assess the vulnerability of masonry structures subjected to rockfalls. Nat. Hazards 103, 1307–1325. doi:10.1007/s11069-020-04036-2
Wang, H., Sun, P., Zhang, S., Ren, J., Wang, T., and Xin, P. (2022). Evolutionary and dynamic processes of the zhongzhai landslide reactivated on october 5, 2021, in niangniangba, Gansu Province, China. Landslides 19, 2983–2996. doi:10.1007/s10346-022-01966-9
Wang, H., Sun, P., Zhang, S., Han, S., Li, X., Wang, T., et al. (2020). Rainfall-induced landslide in loess area, Northwest China: a case study of the Changhe landslide on September 14, 2019, in Gansu Province. Landslides 17, 2145–2160. doi:10.1007/s10346-020-01460-0
Wang, H. J., Sun, P., Wang, T., Zhang, S., and Ren, J. (2023). Development characteristics and slope structure zoning of the Beishan landslide group in Tianshui City. J. Geomechanics (In Chinese) 29, 236–252. doi:10.12090/j.issn.1006-6616.2022052
Keywords: loess area, physical vulnerability, masonry building, slow-moving landslide, cooperative deformation
Citation: Wang H and Mao J (2025) Physical vulnerability of masonry building to the slow-moving landslide: insight from numerical simulation. Front. Earth Sci. 13:1591525. doi: 10.3389/feart.2025.1591525
Received: 11 March 2025; Accepted: 28 April 2025;
Published: 08 May 2025.
Edited by:
Andrea Miano, University of Naples Federico II, ItalyReviewed by:
Stefano Belliazzi, Pegaso University, ItalyXiangning Li, Chinese Academy of Sciences (CAS), China
Copyright © 2025 Wang and Mao. This is an open-access article distributed under the terms of the Creative Commons Attribution License (CC BY). The use, distribution or reproduction in other forums is permitted, provided the original author(s) and the copyright owner(s) are credited and that the original publication in this journal is cited, in accordance with accepted academic practice. No use, distribution or reproduction is permitted which does not comply with these terms.
*Correspondence: Jiarui Mao, bWFvamlhcnVpY2dzQGZveG1haWwuY29t