 Xiaoli Zhou
 Yunxuan Wang
 Mingyang Han
- School of Management, Minzu University of China, Beijing, China
Achieving common prosperity is a long-term and challenging historical process globally, with particularly arduous tasks facing rural areas. Digital rural development provides material guarantees for realizing common prosperity in rural areas. This paper calculates the digital rural development and rural common prosperity levels across provinces from 2011 to 2021, creates Kernel density plots, and preliminarily demonstrates the dynamic evolutionary trends of China’s digital rural development and common prosperity. Furthermore, panel data analysis is employed to investigate the impact effects, mechanisms, and spatial spillovers of digital rural development on rural common prosperity. The research shows that the development of digital rural areas exhibits significant heterogeneity across different domains, periods, and regions. Additionally, government central transfer payment policies can effectively enhance rural common prosperity levels. However, excessively strict environmental regulatory policies (pollution discharge fees) may inhibit the effectiveness of digital rural development on rural common prosperity. Finally, spatial modeling reveals that digital rural development has significant spillover effects on improving rural common prosperity, generating positive “dividend” effects for adjacent regions, though these dividends gradually diminish with increasing distance.
1 Introduction
Common prosperity is not only an essential requirement and historical mission of socialism with Chinese characteristics but also a crucial pathway for emerging market economies and developing countries to achieve collective advancement (Kakwani et al., 2022). Against the backdrop of globalization, technological progress, and economic transformation, many countries are exploring how to achieve more equitable and sustainable development while pursuing economic growth (Bhöringer and Jochem, 2007; Naldi et al., 2015). The 2024 Global Multidimensional Poverty Index shows that 83.7% of multidimensionally poor people reside in rural areas. In sub-Saharan Africa, 71.9% (463 million people) of the multidimensionally poor live in rural areas, while in South Asia, 37.6% (350 million people) are multidimensionally poor (Aguilar and Sumner, 2020). This manifests specifically as structural imbalances between singular policy subsidies and agricultural employment, lacking long-term sustainable development planning. The roots of these structural imbalances lie in the unequal allocation of urban and rural resources, delayed technological diffusion, and solidified institutional barriers under traditional development models (Zhang J. et al., 2024; Zhang L. et al., 2024). Within the context of global common prosperity, China’s rural common prosperity goals have unique temporal significance and reference value. Common prosperity exemplifies the combination of original theoretical innovation and practical application by the Communist Party of China (Chen et al., 2022). Among these efforts, China has consistently adhered to the strategic principle that “a strong nation must first strengthen agriculture, and only with strong agriculture can the nation be strong.” Relevant data indicate that the per capita disposable income of rural residents has increased from 133.6 yuan at the beginning of the reform and opening-up period to 17,734 yuan in 2022, representing more than a 100-fold increase (Zhang et al., 2020). However, while promoting economic development, China also faces increasingly serious issues of wealth disparity and urban-rural gaps. For instance, the household registration system and land transfer restrictions have hindered farmers’ transition to non-agricultural industries, resulting in productivity that is merely one-tenth of that in developed countries.
Today, digital villages have become a crucial breakthrough point for overcoming traditional rural development impasses. Research has found that digital infrastructure development can mitigate income inequality, enhance social security levels, strengthen government governance capacity, and collectively elevate residents’ living standards (Lechman and Popowska, 2022; Dzator et al., 2023; Collington, 2022). In this process, China has gradually recognized the importance of digital transformation and provided a new development pathway for developing countries worldwide, specifically by promoting rural common prosperity goals through information technology innovation and application (Liu et al., 2024a; Leng, 2022). Globally, in the new round of information technology-led technological revolution, the developmental trend of “digital prosperity for farmers” has become increasingly prominent. Within this context, digital technologies centered on the Internet of Things, big data, cloud computing, and artificial intelligence have brought tremendous opportunities for rural development. Consequently, to consolidate the rural economic foundation and ensure steady growth in rural per capita income, the Chinese government proposed the “Digital Rural Strategy” in 2018. The following year, the National Bureau of Statistics reported that rural per capita disposable income growth rebounded to over 10% (Cao et al., 2023). Evidently, digital rural development, as a vital channel for reshaping economic development, has enormous potential in the agricultural sector of China and developing countries worldwide. This development strategy of the Chinese government provides the international community with a new perspective for understanding the role of information technology in promoting rural economic growth and narrowing urban-rural disparities, especially against the backdrop of a still-significant global digital divide.
Currently, research on rural common prosperity in China does not clearly reflect the pathway and significance of integrated digital rural development. Luo et al. (2023) observed that although the Chinese government has implemented a comprehensive model coordinating multiple departments and established clear objectives in telecommunications infrastructure, e-commerce, public services, and agricultural modernization, standing out globally. However, disparities persist with internet penetration rates of 85.1% in urban areas compared to only 60.5% in rural areas. While broadband coverage in villages is relatively high (98.35%), new infrastructure such as 5G base stations has not achieved full coverage, which constrains the development of telemedicine, online education, and other services (Fang et al., 2024). Additionally, research on these two areas predominantly focuses on economic growth dimensions while neglecting the multidimensional impacts of digital rural construction on rural social structures, ecological environment, and cultural heritage, resulting in a singular evaluation perspective (Mei et al., 2022). Research methodologies mostly remain at the level of theoretical discussion or single case analysis, supplemented by field-specific approaches such as the Delphi method or Analytic Hierarchy Process, which present issues of strong specificity but insufficient scientific rigor. Unlike Mei et al. (2022), who examined only the digital industry entrepreneurship perspective, this paper draws on Liu et al. (2024) to construct a comprehensive digital rural assessment framework, encompassing digital infrastructure, digitalization of daily life, digital operations, digital circulation, and digital production. Furthermore, diverging from traditional economic growth dimensions, this research integrates developmental, sharing, and sustainability perspectives to examine the multidimensional pathways through which digital rural development facilitates rural common prosperity. The study primarily seeks to address the following questions: Does digital ruralization and its multidimensional heterogeneity drive the enhancement of rural common prosperity? During the integration process, how do central transfer payment policies dynamically adjust to effectively embed within the practical pathways of digital rural development and rural common prosperity? Additionally, in the process of digital construction, do high pollution fees potentially impact this enhancement? Moreover, do digital rural development and rural common prosperity exhibit potential spillover effects? Do they generate radiation and driving effects on the development of adjacent regions?
In summary, the marginal contributions of this paper are as follows: First, by utilizing panel data from 31 provincial-level regions across China from 2011 to 2021, this study constructs a comprehensive evaluation index system based on traditional digital infrastructure, integrated with production, lifestyle, operational, and circulation digitalization dimensions. This system, combined with China’s specific context, thoroughly investigates regional heterogeneity. Second, using Matlab, this paper demonstrates the Kernel indices of digital rural development and rural common prosperity, overcoming the limitations of traditional two-dimensional planes in data arrangement, separation, and overlap. This approach enables systematic analysis of development trends and fluctuation predictions for both phenomena. Third, by identifying macroeconomic policies from governmental environmental and economic perspectives, this research selects “pollution fees” and “central transfer payments” as proxy variables to investigate the scientific validity and feasibility of these policy instruments in enabling rural common prosperity through digital rural development. Fourth, considering the non-renewable nature of policy resources, this paper employs the Spatial Durbin Model (SDM) to verify the spatial spillover effects of rural common prosperity. This analysis aims to provide valuable references and insights for efficient, high-quality, and streamlined advancement of rural common prosperity initiatives both nationally and internationally.
2 Literature review
Common prosperity, as the ultimate value orientation and ideal vision of human social development, exhibits profound complexity and diversity in its theoretical connotations and practical pathways throughout the evolution of diverse civilizational systems. From the “Great Unity” ideal of ancient civilizations to the institutional designs of modern society, common prosperity has consistently remained a central proposition throughout human history. Common prosperity is a concept with Chinese characteristics, while at the international level, this theory is typically referred to as “Shared Prosperity.” Shared prosperity was proposed by Kozmetsky, who identified technology and ideology as the two primary forces driving economic transformation, and articulated the principle of “domestic and international shared prosperity” (Kozmetsky, 1997; Kozmetsky et al., 2004). In 2013, the World Bank established two significant goals: “Ending Poverty” and “Shared Prosperity,” after which the term “Shared Prosperity” became widely adopted in academic literature (Sabatino et al., 2022). “Common prosperity” itself is not a novel concept; its ideological origins are deeply rooted in Chinese culture (Li, 2023). The Confucian classic “Book of Rites: Conveyance of Rites” proposes the ideal of “Great Unity” with the principle that “when the Great Way prevails, the world is for all,” emphasizing shared resources and social harmony (Li, 2008). Evidently, while early ideas concerning common prosperity had not yet coalesced into a systematic theory, they established the ethical foundation for common prosperity.
Several scholars have conducted systematic and scientific quantitative analyses to thoroughly reveal the underlying logic, policy regulations, and fluctuation effects of digital rural development. For instance, Salemink et al. (2017) emphasizes that digital infrastructure construction and digital skills training are prerequisites for achieving digital empowerment, contributing to enhanced digital literacy and participation among rural populations. In contrast, the Chinese approach to digital rural development focuses more on promoting non-agricultural employment and achieving redistribution of labor time and income (Li, 2023). With the integration and innovation of global digital rural theoretical concepts, alongside the popularization and application of networks, information, and digitalization, rural production and lifestyle patterns are undergoing subtle yet profound transformations. However, these informal innovations have, over time, generated certain “frictions.” Warren (2007) affirms the breadth of benefits that the internet brings to rural areas, while noting that as the internet is increasingly viewed as the default communication medium, a minority gradually finds itself disadvantaged—a consequence of the “digital vicious cycle.” While China has preliminarily accomplished its poverty alleviation objectives, the digital foundation across rural areas remains weak, with digital potential unevenly distributed. Therefore, addressing the practical challenge of bridging the “last mile” of digital empowerment still requires formal organizations and the correct leadership of the Party to establish a multi-domain coordinated development mechanism characterized by “government guidance,” “market leadership,” and “villager participation.” Evidently, traditional formal organizations remain the “direction indicator” and “stabilizer” of digital rural development, effectively facilitating the realization of common prosperity goals.
Facing the accelerating evolution of unprecedented changes unseen in a century, the Communist Party of China actively seizes strategic opportunities and historical initiative, raising the distinctive “thematic” banner while striving toward the goal of common prosperity (Wang et al., 2022). Exploring the Chinese path to common prosperity represents both a contemporary mission and a historical responsibility (Li, 2023). Since the reform and opening-up, the Chinese government has conducted systematic explorations based on the long-term objective of rural common prosperity, primarily encompassing economic growth and distributive equity (Liu et al., 2020; Hou and Gao, 2025), rural financial development (Huang et al., 2025), social security system construction (Yu et al., 2024; Jie et al., 2023), land system reform (Liu et al., 2024b), agricultural modernization and technological innovation (Chen et al., 2024), as well as ecological civilization construction and sustainable development (Zhang and Fan, 2024). Research methodologies predominantly involve theoretical reviews (Kakwani et al., 2022) and case analyses (Sun et al., 2023; Zhou et al., 2024), supplemented by quantitative baseline regressions (Zhang and wang, 2023; Jin et al., 2024). Evidently, various sectors of society have already undertaken systematic exploration of rural “wealth generation” pathways. However, the advent of the digital era has prompted increasingly personalized demands, subsequently leading to diversification of issues in rural areas. Traditional research paradigms struggle to adequately address the dynamic evolution of agricultural modernization, indicating that rural common prosperity remains a formidable and long-term undertaking (Zhao and Jiao, 2024). RetryClaude can make mistakes. Please double-check responses.
Martin Hilbert’s “Digital Divide Theory” and Amartya Sen’s “Capability Development Theory” collectively establish the theoretical framework for understanding digital empowerment in rural development (Hilbert, 2011). Subsequently, Chinese scholar Ye and Yang (2020) proposed the “Digital Empowerment Theory,” further elucidating how digital technology reconstructs rural production relationships and enhances the endogenous dynamics of rural development. Digital villages represent a new form of rural development centered on the deep integration of digital technology with rural economy and society. In recent years, China has progressively shifted from “paying attention to” to “emphasizing” comprehensive high-quality rural development, with the thorough integration of digital technology and rural common prosperity emerging as the “new productive force” in the rural revitalization strategy (Tu et al., 2024). Among these developments, Leong et al. (2016) pioneered an in-depth examination of Yunnan Province’s “Digital Village” initiative, evaluating both the achievements and challenges in promoting rural informatization. Later, Zhao et al. (2022) emphasized that “digital village” construction should be founded on digital governance platforms, drawing upon exemplary urban experiences from “Digital China” while incorporating local provincial conditions and infrastructure to develop digital villages. Evidently, early scholars primarily employed theoretical exploration and case analysis as the predominant paradigms in researching how “digital villages” advance rural common prosperity. As research deepened, Lai et al. (2024) posited that despite digital villages’ successful integration as a crucial component of rural social formation, constructing models to quantitatively verify factor mechanisms and intrinsic connections remains equally important, considering the underlying logic between elements and the complex dynamics of Chinese rural evolution. Consequently, Lei et al. (2025) scientifically revealed through statistical models how various factors promote or impede the development of digital empowerment for rural common prosperity across different stages and levels, fully demonstrating the complex trends in rural dynamic development. This new trend can provide policymakers with more precise, efficient, and reliable empirical support, ensuring that digitalization strategies better serve the realization of the grand objective of common prosperity. RetryClaude can make mistakes. Please double-check responses.
3 Theoretical analysis and research hypotheses
3.1 Direct impact of digital villages
According to endogenous growth theory, macroeconomic growth is inseparable from information technology innovation, with technological advancement serving as the source of China’s rapid yet steady economic and social development (Romer, 1990). However, when material resource inputs reach their peak, the resulting marginal benefits gradually exhibit diminishing returns, whereas technological innovation can maintain sustained growth in marginal benefits. Evidently, the advantages of technological innovation are increasingly prominent in the domain of economic growth (Fan et al., 2021). Nevertheless, unlike urban digital development, rural digitalization confronts unique theoretical contexts and practical challenges. According to dual economic structure theory and regional unbalanced development theory (Rodrik et al., 2016; Myrdal, 2017), rural areas exhibit fundamental differences from urban areas in resource endowments, industrial structures, and development stages, resulting in digitalization manifesting different operational mechanisms and development trajectories in rural areas compared to urban regions. RetryClaude can make mistakes. Please double-check responses.
Prior to this, Calabrese and Jung (1992) observed that digital infrastructure establishes foundational conditions for rural common prosperity by eliminating digital access barriers in rural areas, expanding rural residents’ capability space, and optimizing pluralistic governance mechanisms for digital public goods. Leveraging digital infrastructure construction to promote digital informatization, intelligence, and smartness, thereby elevating rural living standards to a modernized foundation and achieving low-cost sharing of quality resources (such as inclusive finance, online education, and telemedicine), has become an important approach for consistency and integration of public services between urban and rural areas, serving as supporting resource assurance for digital infrastructure construction (Srivastava and Shainesh, 2015). In this process, the popularization of digital technologies (such as IoT, big data, artificial intelligence, etc.) has comprehensively enhanced agricultural production vitality (in aspects ranging from planting and breeding to processing, storage, and transportation of agricultural products), thereby achieving intelligent, precise, and informationized production processes, optimizing production workflows and efficiency (Papadopoulos et al., 2024). Moreover, rural areas have established digital logistics networks utilizing big data and artificial intelligence technologies, achieving intelligent management and optimization of logistics processes, enabling rural products to enter markets rapidly and efficiently, reducing circulation time and costs, thus becoming a critical “bridge” for rural common prosperity (Zhao et al., 2022; Dong et al., 2024). However, the construction of China’s new agricultural operation system faces challenges of insufficient market accessibility, resulting in supply-demand mismatches and loose connections between “small farmers” and “large markets,” severely constraining rural development (Yang et al., 2024). To address this, Kosasih and Sulaiman, (2024) argues that introducing intelligent management and market analysis tools improves decision-making efficiency and market response speed of rural enterprises, helping to broaden income sources and promote rural economic diversification, thereby supporting the realization of common prosperity. In summary, digital rural construction forms a complete theoretical chain from “fundamental support - value creation - value distribution - value realization” through the multidimensional synergistic effects of digital infrastructure, production digitalization, circulation digitalization, and operational digitalization, providing theoretical support and experiential reference for resolving imbalanced and inadequate rural development and achieving rural common prosperity (see the Figure 1). Based on this, the paper proposes Hypothesis H1:

Figure 1. Theoretical Framework of Rural Common prosperity.
Hypothesis H1. Digital rural development and its multidimensional heterogeneity can promote rural common prosperity.
3.2 The mediating effect of central transfer payments
Fiscal decentralization theory posits that the allocation and utilization of fiscal resources should account for regional heterogeneity to achieve effective resource allocation and interregional equity (Vo, 2010). China, a modernizing nation with an enormous population base, abundant natural resources, and substantial development potential, adheres to the core concept of a “Chinese characteristic” socialist path in its development (Choi, 2011). Within this framework, grounding Chinese-style modernization in the people’s aspirations for a better life as both the “starting point” and “ultimate goal,” ensuring economic and social fairness and justice, and steadily advancing common prosperity constitute essential requirements of socialism with Chinese characteristics (Gow, 2017). In this process, Zhang and Song (2024) argues that certain cities, benefiting from national policy “preferences,” have experienced prioritized “cake expansion.” Subsequently, due to market imperfections and institutional reform lags in the real world, resource allocation struggles to meet the principle of equalized marginal returns, generating allocation distortions that ultimately lead to structural imbalances in rural resource allocation. Therefore, after achieving the first centenary goal of a “moderately prosperous society,” China advances toward its second objective—“common prosperity.” Compared to the former, the second goal of “fair distribution of the cake” may be more important yet considerably more complex and challenging. This stage not only demands sustained economic growth but also emphasizes ensuring that all sectors of society, particularly vulnerable groups, can equitably enjoy development outcomes through more rational distribution mechanisms, thereby promoting overall social harmony and stability.
Currently, centrally formulated transfer payment policies have become a new paradigm for local governments to coordinate rational rural resource allocation. The advent of the digital era has not only enhanced agricultural production efficiency and quality, facilitated market access and value addition for agricultural products, but also improved the rural financial environment and elevated public service standards (Salemink et al., 2017). These efforts indirectly enhance rural residents’ quality of life and economic wellbeing, establishing a solid foundation for achieving common prosperity both within rural areas and between urban and rural regions. However, China’s rural areas are characterized by wide dispersion, small scale, and weak foundations (Yang et al., 2015). How to ensure that regions with weaker self-sufficiency capacity and poorer economic foundations gradually narrow digital resource supply gaps represents a critical juncture for optimizing capital allocation efficiency among China’s rural areas and achieving digital empowerment for rural common prosperity. Subsequently, local governments have gradually employed transfer payments to implement policy preferences as a strategic decision for balanced regional development, ensuring the comprehensive advancement of digital technology in “agricultural, rural, and farmer domains” and bridging the interregional digital development divide (Li and Du, 2021). Evidently, local governments’ intensification of fiscal transfer payment “downward penetration” and enhancement of foundational capacity in fiscally challenged rural areas contribute favorably to elevating rural common prosperity levels. Based on this, the article proposes research Hypothesis H2:
Hypothesis H2. Digital rural development effectively enhances agricultural common prosperity through central transfer payments.
3.3 The moderating effect of pollution fees
Environmental regulation, as a crucial measure to address the externalities generated by green lifestyles, holds significant importance for promoting the transformation toward green production methods and fostering high-quality development (Luo et al., 2023). Appropriate environmental regulation can facilitate technological advancement and diffusion, generating an “innovation compensation” effect that enhances competitiveness while offsetting “compliance cost” effects (Ambec et al., 2013). Generally, increases in agricultural GDP per capita provide exploitable economies of scale for pollution-intensive investments, intensifying agricultural pollution (scale effect). However, further increases in agricultural GDP per capita continuously improve human capital development and infrastructure construction, promoting the absorption and transformation of new technologies, thereby reducing agricultural pollution emissions (technology effect). An “inverted U-shaped” relationship exists between agricultural GDP per capita and pollution, which can largely be explained by “the dominance of scale effects at low income levels and the dominance of technology effects at high income levels” (Aydoğan and Vardar, 2020). In today’s rapidly developing China, the “agriculture, rural areas, and farmers” domain faces the dual challenges of digitalization and sustainable economic development, with environmental regulatory constraints serving as a “stabilizer” ensuring coordinated sustainable development of rural ecological environments and economies. Among various environmental regulatory instruments, the pollution fee system, as a typical market-based environmental regulation approach, effectively internalizes environmental externalities in agricultural production processes through the “polluter pays” principle (Baumol and Oates, 1988). The pollution fee system imposes direct economic constraints on agricultural producers’ pollution emission behaviors, compelling agricultural operators to incorporate environmental costs into production decisions, thereby incentivizing the adoption of clean production technologies and optimization of resource allocation (Li et al., 2024). Particularly in the context of digital village construction, the combination of pollution fees and digital technology can generate synergistic effects. For instance, precision agriculture technology can reduce pesticide and fertilizer use, while IoT technology can optimize irrigation water usage—these technological applications constitute the core content of digital village construction (Jiao et al., 2015). Against this background, considering the complexity of rural populations, high carbon emissions from agricultural industries, and agriculture’s inherent vulnerabilities, government departments have prioritized rural ecological governance and implemented targeted regulatory measures such as pollution fees, deriving important means for a “Chinese-characteristic” path to rural prosperity. Thus, the government’s establishment of reasonable environmental regulations (pollution fees) is conducive to the long-term, stable construction of digital villages and the realization of rural common prosperity goals. Based on the theoretical analysis above, this paper proposes the following research Hypothesis H3:
Hypothesis H3. Environmental regulation positively moderates the impact of digital rural development on rural common prosperity.
3.4 Analysis of regional heterogeneity
New economic geography theory posits that trade, factor mobility, and the diffusion and spillover of knowledge and technology lead to enhanced spatial dependencies between regions (Döring and Schnellenbanch, 2006). In recent years, considering the disparities in resource allocation among provincial administrative regions, rural revitalization efforts in certain areas of China have encountered impediments (Wan et al., 2023). Today, the advent of the information age has brought both opportunities and challenges to rural development. Research indicates that agglomeration and diffusion mechanisms of technology dissemination and market access facilitate the widespread transmission of agricultural knowledge and management techniques, enabling agricultural products to reach consumers directly through e-commerce platforms, thereby expanding market scope and enhancing sales efficiency of rural products (Zeng et al., 2017). Furthermore, Ho et al. (2019) argues that the driving forces of innovation and collaborative development, such as agricultural supply chain integration and low-cost entrepreneurial innovation, constitute inexhaustible momentum for strengthening rural economic vitality and enhancing farmer incomes. Additionally, Chang and Chuang (2011) points out that the proliferation of digital platforms facilitates the sharing of quality educational resources and the enhancement of social capital, further promoting comprehensive rural development through educational advancement and social interaction. This multidimensional driving mechanism not only promotes economic growth but also fosters interregional economic balance and social integration, providing robust support for the realization of rural revitalization strategies (Wang et al., 2019). Evidently, the application of digital technologies facilitates communication and cooperation among regional governments in policy framework formulation and implementation, thereby reducing barriers between regional markets, promoting economic growth in adjacent areas, and generating positive spatial effects on regional common prosperity. In view of this, this paper proposes the following research Hypothesis H4:
Hypothesis H4. Digital rural development has positive spatial spillover effects on rural common prosperity.
4 Methodology
4.1 Selection of variables
This study utilizes panel data from 31 Chinese provinces and municipalities spanning from 2011 to 2021, sourced specifically from the “China Statistical Yearbook,” “China Rural Statistical Yearbook,” “China Environmental Statistical Yearbook,” “China Science and Technology Statistical Yearbook,” and other publications. Missing data points were supplemented using interpolation methods. First, based on comprehensive consideration of data characteristics and methodological applicability, the data demonstrates relatively stable growth trends without obvious cyclical fluctuations or structural breakpoints. Second, the missing data points (2019) are situated between two known data points (2018 and 2020), which satisfies the basic application conditions for linear interpolation. Furthermore, compared to other complex imputation methods (such as multiple imputation or random forest imputation), linear interpolation offers advantages of higher computational efficiency and fewer assumptions when handling single-year missing values in time series data, thereby avoiding the risk of model overfitting. Finally, cross-validation tests using historical data indicate that the prediction error of the linear interpolation method is controlled within 5%, meeting the precision requirements of this research.
4.2 Variable definitions
4.2.1 Explained variable
Rural Common Prosperity (RCP). Research indicates that in comprehensively building common prosperity, the most arduous and onerous tasks remain in rural areas (Wei et al., 2024). Specifically, rural common prosperity must first address the question of “where prosperity comes from,” aligning with the logic of prioritizing productivity development. Subsequently, it must resolve the question of “to whom prosperity flows,” embodying principles of distributive equity. Finally, it must address the question of “how far prosperity extends,” ensuring intergenerational equity. These three aspects form a systemic coupling, constructing a virtuous cycle of development-sharing-sustainability. Accordingly, this paper adopts Li (2023) research paradigm, selecting development, sharing, and sustainability as the constituent elements of rural common prosperity. The aim is to focus on China’s great objective of achieving nationwide rural common prosperity oriented toward high-quality agricultural development following the completion of poverty alleviation tasks (see Table 1).
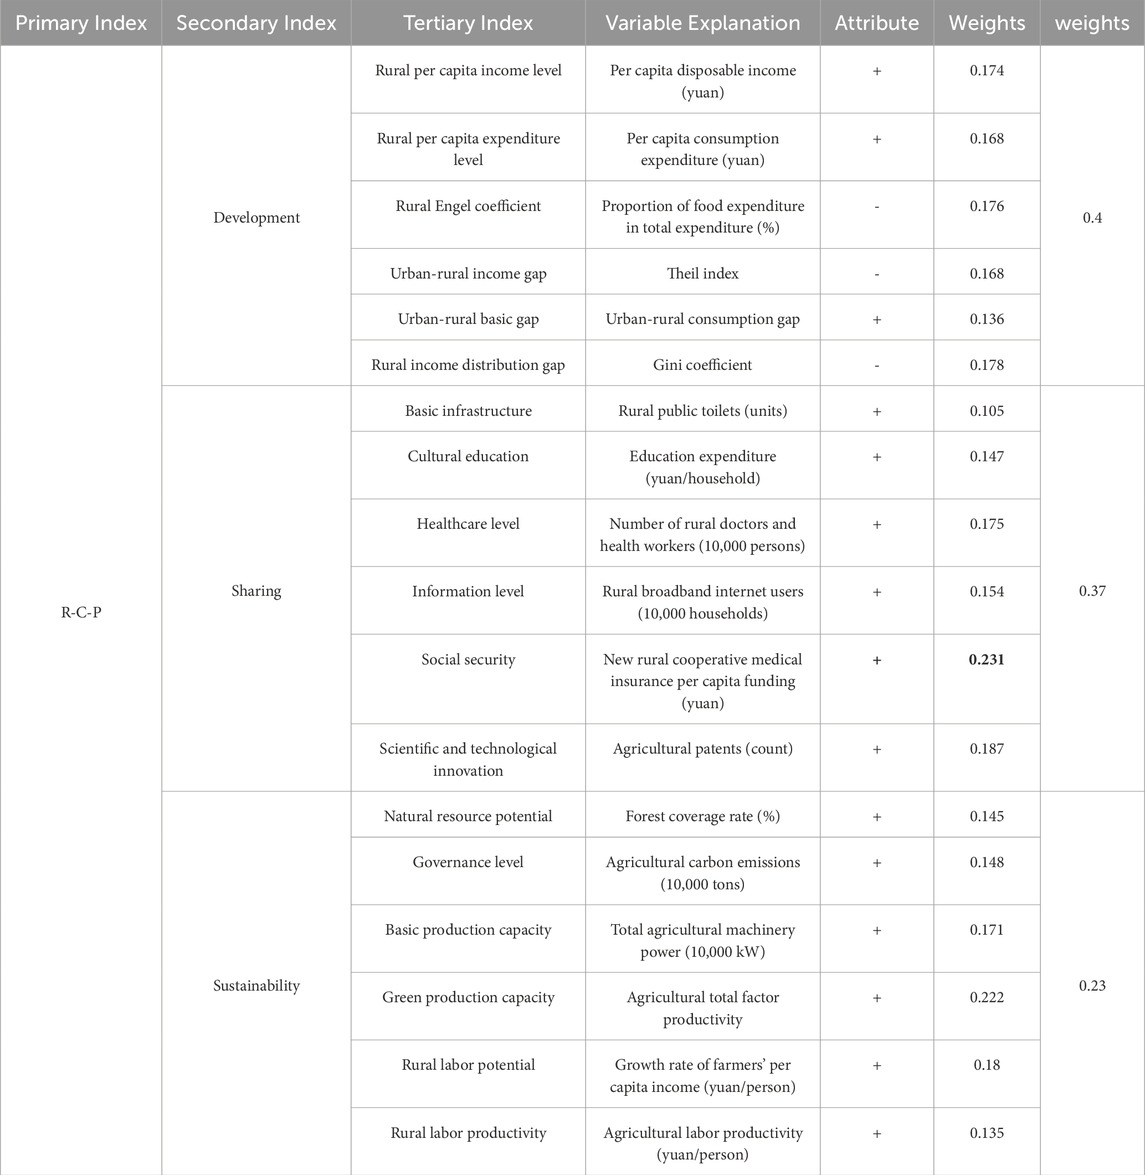
Table 1. Rural common prosperity indicator system.
4.2.2 Explanatory variable
Digital Rural Development (DR). Research shows that digital empowerment in rural construction is not only a key means of advancing the rural revitalization strategy but also an important driving force for achieving comprehensive economic, social, and cultural development in rural areas (Zhao et al., 2022). From a socio-technical systems theoretical perspective, digital rural development, as an integration of rural informatization and modernization, exhibits multi-dimensional collaborative characteristics in its development pathway. For example, digital infrastructure serves as technical support and is mutually embedded with the digital transformation of production factors, jointly constructing a new agricultural production system. The digitalization of operational processes promotes the reshaping of industrial value realization pathways by enhancing management effectiveness. Meanwhile, digitalization in the circulation domain closely connects frontend production with terminal consumption, ultimately facilitating the comprehensive digital transformation of rural lifestyles (Zhang J. et al., 2024; Hou et al., 2024). These five elements constitute the complete ecosystem of digital rural development, forming a collaborative development chain of “infrastructure-production-operation-circulation-lifestyle,” serving as core supporting elements for promoting rural digital transformation and high-quality development. Therefore, referencing Zhou et al. (2023) research and based on the long-term fundamental national condition of digital empowerment with Chinese rural construction as the application foundation, this paper constructs an explanatory variable model around digital infrastructure (Ddr), production digitalization (Dp), operational digitalization (Od), circulation digitalization (Dc), and lifestyle digitalization (Dls) (see Table 2).

Table 2. Digital rural development index evaluation system.
4.2.3 Mediating variable
Central Transfer Payment (TP). Examining the evolutionary trajectory of macroeconomic policy orientations in recent years, the institutional environment and policy framework they have constructed not only serve as a key catalyst for digital economy empowering rural revitalization and promoting high-quality rural development but also play an irreplaceable strategic leading role in industrial structure optimization and regional coordinated development (Miao and Liu, 2023). Therefore, referencing Li and Du (2021) research, this paper designates the “Central Transfer Payment” policy as a mediating effect variable, validating the Chinese government’s strategic decision in digital-empowered rural construction to improve infrastructure development, reduce regional development disparities, and promote balanced regional development through central fiscal appropriations.
4.2.4 Moderating variable
Pollution Fee (FV). The “Pollution Fee,” as an economic incentive measure, aims to reduce pollution emissions by local enterprises and individuals through policy regulation and promote environmental protection, reflecting the close integration of environmental challenges faced by current Chinese rural development with national policy orientations (Zeng et al., 2024). Therefore, referencing Cheng and Liu (2022) research on advancing “Digital Rural Development and Rural Common Prosperity,” this paper selects the “Pollution Fee” as a proxy variable for environmental regulation.
4.2.5 Control variables (Con)
To reduce model result bias, following Lavenberg and Welch (1981) approach, this paper selects government agricultural fiscal support (FS), primary industry proportion in total production (PP), and rural social security level (SS) as control variables. Specifically, fiscal support is measured by the proportion of agricultural, forestry, and water expenditure in local general public budget expenditure across 31 provinces, reflecting government agricultural support. The primary industry proportion is measured by the ratio of primary industry gross output value to the gross output value of primary, secondary, and tertiary industries.
4.3 Model building
4.3.1 Data fitting
Research on rural common prosperity in China has consistently been characterized as a dynamic sustainability study with multiple dimensions and broad domains (Gai et al., 2025). This encompasses explicit indicators such as rural economic income growth and wealth distribution equity, as well as implicit indicators including accessibility to public services and the comprehensiveness of social security systems. In consideration of this dynamic complexity, this paper employs the entropy method to measure variable dimensions and weights. Given the non-uniformity of measurement units across indicators, natural logarithm transformations are applied to absolute value variables and variables with large orders of magnitude to mitigate the interference of disparate data dimensions. Subsequently, to avoid the randomness inherent in subjective weighting and ensure the credibility of indicator weights, this paper references Georgescu-Roegen’s (1971) application in physics, employing the entropy method to objectively assign indicator weights (Equations 1–7): Select
First, through data standardization, the impact of indicators on the evaluation results in terms of dimensionality and positive/negative orientation is eliminated. The processing formula for positive indicators is:
Negative indicators are treated with the formula:
Second, the weight of the
Third, the information entropy of the
Fourth, the information shell margin for indicator J was calculated as follows:
Fifth, calculation of indicator weights:
Sixth, calculate the composite score:
According to the preliminary weights determined by the entropy method, current rural common prosperity development is still predominantly led by the development dimension (0.4), complemented by the sharing dimension (0.37), while the sustainability dimension (0.23) remains relatively weak. The specific weight distribution indicates that within the current framework of Chinese rural development, the primary focus has been on economic development, income growth, and infrastructure construction, while green sustainable development still possesses considerable future potential.
4.3.2 Kernel density index
Considering that both digital rural development and rural common prosperity exhibit spatial characteristics of wide distribution, long cycles, and significant differences, it is necessary to further identify potential patterns or trends through smoothed probability distributions and reveal the concentration or diffusion of certain phenomena within geographical or social structures. Kernel density estimation (KDE), as a spatial analysis method, can effectively demonstrate geographical distribution characteristics. This method requires no assumptions about distribution forms and is suitable for processing data with characteristics of wide distribution, long cycles, and significant differences. Therefore, this paper employs the Gaussian Function to obtain the Kernel density distribution, illustrating the dynamic evolutionary distribution, potential patterns, “hot spots” (high-value cluster areas), and “cold spots” (low-value cluster areas) across 31 provincial administrative regions (Davies et al., 2018). This provides a spatial dimensional framework for subsequently explaining the relationship between digital rural development and rural common prosperity, thereby deepening the policy implications of the research conclusions. The calculation formulas are shown in Equation (8) and (9):
Wherein,
4.3.3 Benchmark regression
To examine the impact of digital rural development (DR) on rural common prosperity (RCP), this paper employs a fixed effects model, incorporating both time and individual fixed effects. The specific model specification is as follows:
In Equation 10,
4.3.4 Mediation effect model
To test the effect of digital rural development on enhancing rural common prosperity through government intervention (central transfer payments), this paper establishes the following econometric model:
In this model, Equation 11 analyzes the intrinsic relationship between digital rural development
4.3.5 Moderation effect model
To test the moderating effect of environmental regulation (pollution fees) FV, this paper establishes the following econometric model:
Equation 13 reveals the intrinsic relationship between digital rural development and rural common prosperity through basic regression. Equation 14 analyzes the basic regression results after incorporating the moderating variable FV. Equation 15 introduces the interaction term between digital rural development and pollution fees
4.3.6 Spatial durbin model
When analyzing spatial correlations in regional economic development or policy effects, spatial panel models serve as important tools, with their core function being the characterization of complex spatial interaction mechanisms between variables. Therefore, considering the circulation of digital, economic, and human capital, we further verified the potential spatial spillover effects between digital rural development and rural common prosperity, with the model as follows:
Intangible elements such as digital technology can effectively exert “radiation effects” only in regions with geographical proximity and similar natural environments and topographical features, thus exhibiting an attenuation trend with increasing geographical distance during the diffusion process. Following Peng’s et al. (2024) research, the minimum and maximum distances between two locations are set as [dmin, dmax], with 50 km as the incremental distance interval and 100 km as the minimum distance between provinces.
In which, Equation 16
In Equation 17,
5 Results and analysis
5.1 Kernel density measurement
To further investigate the dynamic evolutionary trends of digital rural development and rural common prosperity across different provinces in China, kernel density estimation was employed to generate kernel density curves for both indices. As shown in Figure 2, the analysis examines the evolution of digital rural development and rural common prosperity levels from the perspectives of distribution morphology, distribution characteristics, distribution extensibility, and polarization features. At the macro level, rural common prosperity indicators demonstrate an overall rightward shift, indicating a general improvement in rural common prosperity levels. Notably, while the peak values fluctuated multiple times, the curve width remained relatively stable. This can potentially be attributed to the resource concentration system established in certain rural areas from 2011 to 2021, promoting the macroeconomic strategic decision of “letting some get rich first to drive others toward prosperity.” Additionally, eastern coastal regions of China achieved industrialization and urbanization earlier and more rapidly than western inland regions, potentially resulting in the uneven geographical distribution of rural common prosperity. From the perspective of eastern, northeastern, central, and western regions, the peak values of eastern regions show a distinct rightward shift compared to northeastern, central, and western regions, indicating more advanced levels of rural common prosperity. Furthermore, eastern regions consistently display multiple peaks, with trends steadily shifting rightward and declining fluctuations. This suggests that polarization in common prosperity levels within eastern regions has been mitigated. However, while provinces such as Guangdong and Fujian demonstrate clear economic development advantages, Hainan Province remains relatively underdeveloped, exhibiting left and right tail phenomena. Northeastern regions experienced peak values in the early 2000s, primarily attributed to the stronger industrial foundation of the three northeastern provinces and the implementation of the “Northeast Revitalization Strategy” launched by the central government in 2003, which temporarily accelerated economic growth in these provinces. In central regions, common prosperity levels have steadily improved over time, albeit with multiple peaks. This can be attributed to early 2000s national initiatives promoting cross-regional, cross-sectoral, and urban-rural factor mobility, prioritizing the development of economic radiation zones exemplified by Hubei Province. Concurrently, significant declines in Henan and Shanxi provinces led to substantial fluctuations within central regions. Over time, the multi-peak pattern in central regions has gradually diminished, indicating reduced multipolarization and more stable advancement of common prosperity levels. Finally, western regions exhibit multimodal distribution patterns. Due to dramatic ranking fluctuations among western provinces, predominantly displaying oscillating growth trends, regional coordinated development between provinces appears relatively poor.
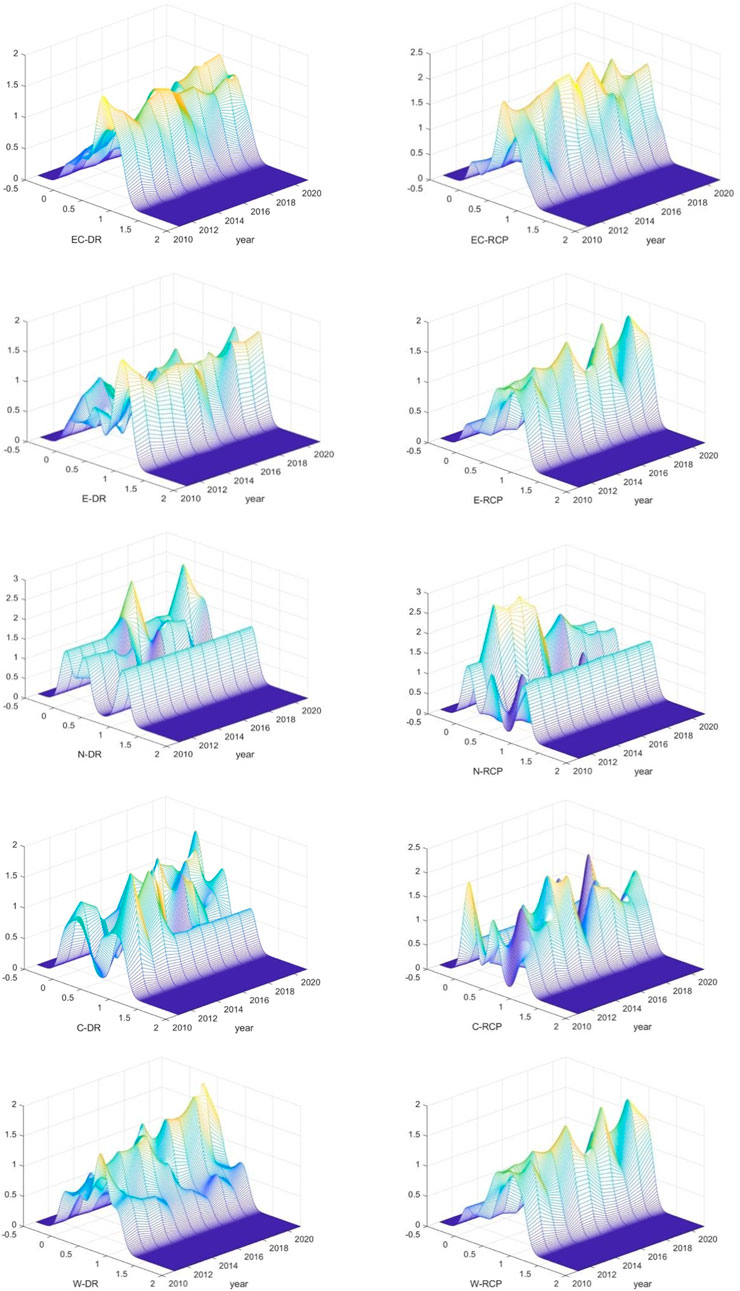
Figure 2. Kernel density distribution of digital rural areas and rural common prosperity. Note: Eastern region: Beijing, Tianjin, Hebei, Shanghai, Jiangsu, Zhejiang, Fujian, Shandong, Guangdong, Hainan; Northeast region: Liaoning, Jilin, and Heilongjiang. Central region: Shanxi, Anhui, Jiangxi, Henan, Hubei, Hunan; Western region: Inner Mongolia, Guangxi, Chongqing, Sichuan, Guizhou, Yunnan, Tibet, Shaanxi, Gansu, Qinghai, Ningxia, Xinjiang.
The Kernel density dynamics of digital rural development demonstrate an overall rightward shift trend, indicating a general improvement in digital rural development levels across regions. During this process, digital rural construction exhibits regular multi-peak trends, primarily attributable to the targeted guidance, innovative implementation, and phased breakthroughs of the national rural revitalization strategy. In contrast, development trends in eastern regions have decelerated, inseparable from the region’s digital foundation and long-term policy preferences. Additionally, the northeastern region rarely exhibited two extreme values, closely associated with the implementation of the national “Northeast Revitalization” program, though the ultimate effectiveness was minimal. Unlike other regions, central regions experienced multi-peak fluctuation phenomena. As major agricultural provinces, they possess substantial development potential for rural infrastructure with strong sustained momentum, facilitating notable outcomes from digital investments. Furthermore, the Kernel density index for western regions exhibits periodic peaks, potentially indicating that digital rural development in western regions is influenced by cyclical factors. Despite the varying peak heights in western regions, overall data demonstrate steady and rapid improvement.
5.2 Benchmark regression results
The impact of digital rural development on rural common prosperity is significantly positive at the 1% statistical level (Model 1). Further analysis reveals that production digitalization (Model 3), lifestyle digitalization (Model 6), and operational digitalization (Model 4) maintain positive effects on rural common prosperity. However, digital infrastructure did not achieve the expected significance (Model 2), and circulation digitalization showed significantly negative effects (Model 5), indicating that Hypothesis H1 is not fully supported. Considering potential endogeneity issues and to enhance the authenticity and reliability of research findings, this paper conducts endogeneity tests using “first-order one-period lag” results from the GMM model, which not only mitigates potential endogeneity but also confirms the robustness of the research results (Moral-Benito et al., 2019). The “first-order lag endogeneity test” refers to using the first-order lagged term (t-1 period) of explanatory variables as instrumental variables to examine potential endogeneity issues in the model through two-stage least squares (2SLS) methodology (Bellemare et al., 2017). Additionally, system GMM, proposed by Arellano and Bover (1995) and Blundell and Bond (1998), constructs an equation system by simultaneously utilizing level equations and difference equations, which effectively addresses endogeneity issues in dynamic panel models while reducing finite sample bias caused by weak instrumental variables. Furthermore, the F statistic calculated through Eviews is 21.63, significantly exceeding the Stock-Yogo 10% maximum relative bias critical value (16.38), confirming that the instrumental variables are not weak. The specific analysis is as follows (see Table 3):
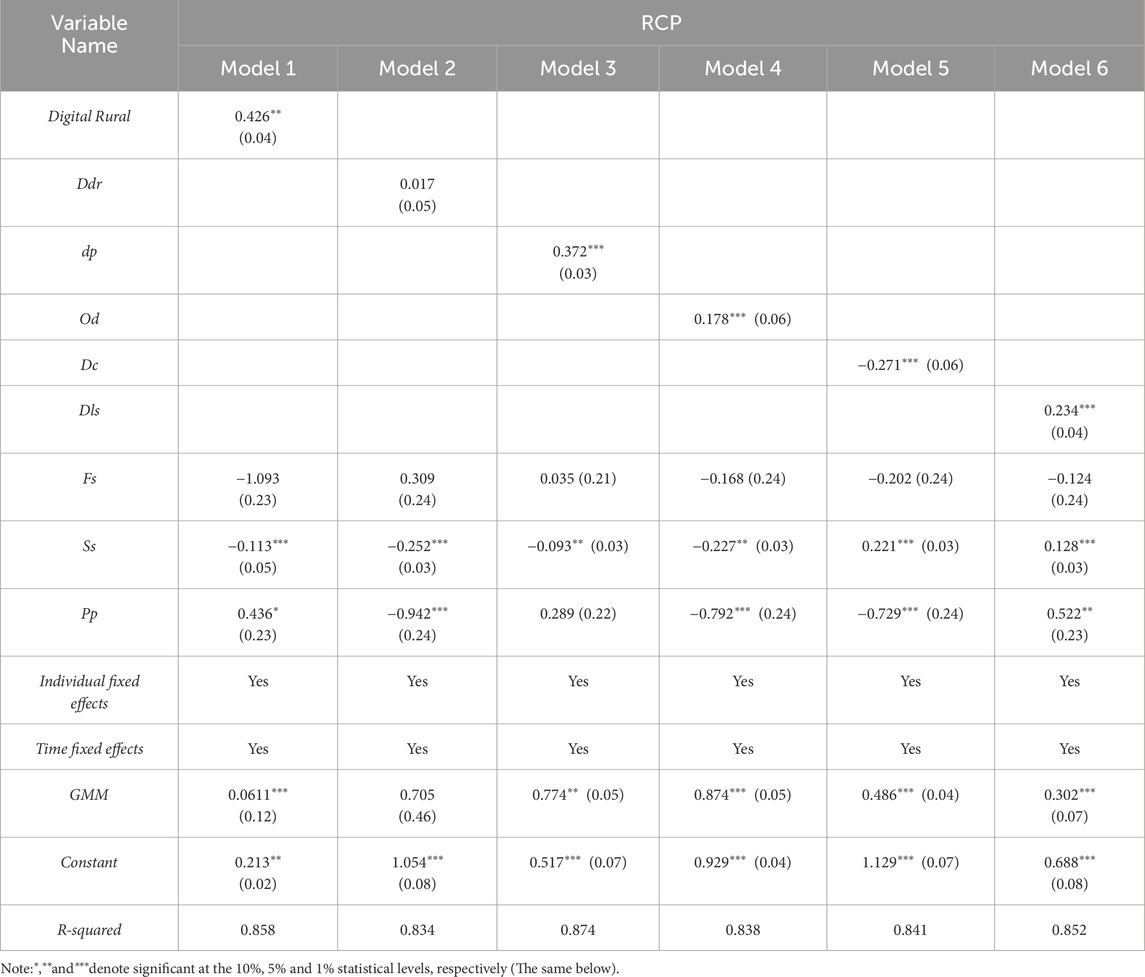
Table 3. Benchmark regression results.
In the current wave of globalization and informatization, the Chinese government has positioned the digital economy as a national strategy, particularly emphasizing the utilization of advanced digital technologies to promote coordinated economic and social development. This strategic choice has already demonstrated preliminary positive outcomes in rural areas, especially with notable progress in the digitalization of production, operations, and lifestyle services, signaling new trends in rural development against the backdrop of the new era. However, in-depth analysis of current implementation reveals that despite significant advances in production and operational digitalization in rural areas, and the steady progress of lifestyle service digitalization, basic digital infrastructure construction has not achieved the expected results. This may relate to multiple factors, including subsequent product utilization efficiency, digital divide, incomplete industrial chains, insufficient market access and services, and inadequate regulatory policies. More critically, while the advancement of circulation digitalization has enhanced market efficiency, it has also intensified competitive pressures in traditional markets, placing small-scale farmers at a disadvantage when competing with large enterprises, potentially resulting in the loss of valuable market share. Similarly, Salemink et al. (2017) found through case studies of 157 developed countries globally that disparities in urban-rural data infrastructure quality persist and continue to widen, necessitating solutions tailored to local specific needs to improve digital connectivity and inclusivity in rural communities. Evidently, in the process of digital rural construction, only by attending to dynamic development trends and innovating development models according to local conditions can comprehensive rural revitalization be implemented and rural common prosperity be achieved expeditiously.
5.3 Mediation effect analysis
As shown in Table 4, Digital Countryside has a significant positive impact on central transfer payments at the 1% statistical level (Model 1). Furthermore, after incorporating the central transfer payment policy, we found that Digital Countryside can further enhance rural common prosperity by leveraging central transfer payment policies (Model 2).

Table 4. Mediation effects.
The Chinese government has long been committed to channeling fiscal resources from economically developed regions to relatively underdeveloped rural areas through central transfer payment mechanisms, aiming to reduce regional development imbalances and promote rural development and farmers’ income growth. In this context, Digital Countryside construction, as a key measure to promote rural modernization and achieve common prosperity, has received strong support and investment from the government. The positive effect of central transfer payments indicates that these fiscal funds have effectively facilitated the construction of digital infrastructure and the popularization of digital services in rural areas, providing farmers with more income-generating opportunities such as e-commerce and smart agriculture, thereby accelerating rural economic transformation and upgrading, and improving rural residents’ income and quality of life. Moreover, in the impact of Digital Countryside (Dr) on central transfer payments, the coefficient value of Dr is 0.929, denoted as
5.4 Moderation effect analysis
In modern national governance, traditional environmental regulation has consistently served as a “navigational beacon” guiding regional development. Its influence has become increasingly prominent in the current process of Digital Countryside promoting rural common prosperity. However, statistical analysis from Models 2 and 3 reveals that the interaction term coefficient for environmental regulation (pollution fees) is negative and significant at the 1% statistical level, indicating that pollution fees negatively moderate the effect of Digital Countryside on rural common prosperity (see the Table 5). Based on this finding, Hypothesis H3 is not supported.
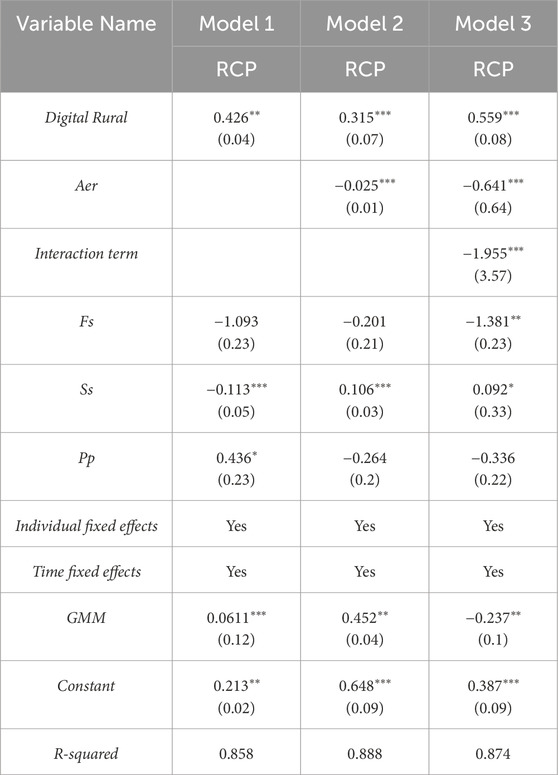
Table 5. Moderator variable.
The potential reasons for this finding are as follows. First, considering the cyclical nature and vulnerability of rural economies, the pollution fee system may directly increase operational costs for rural enterprises and households, particularly in regions dependent on traditional agricultural production and small-scale processing industries. This cost increase may reduce farmers’ net income, thereby negatively affecting their contribution to common prosperity. Second, the financial burden imposed by pollution fees may restrict the flow of funds available for investment in Digital Countryside construction and other rural development projects. This suggests that although environmental protection investments can yield sustainable economic benefits in the long term, in the short term, resources allocated to paying pollution fees may reduce investments that would directly contribute to rural common prosperity. Finally, pollution fees may increase resistance to economic transformation in rural areas. For regions that have not yet achieved industrial upgrading and technological transformation, pollution fees add direct costs to transition efforts, potentially delaying or even suppressing the adoption of clean production technologies and the transition to a digital economy in rural areas. Similarly, Meegoda et al. (2021) observed that stringent pollution prevention and control measures in developed countries (such as the United States) may lead to decreased corporate willingness to participate, as businesses fear that compliance costs or penalties could affect their operations and subsequently impact local economic vitality.
5.5 Regional heterogeneity analysis
Considering the significant differences between regions in terms of economic development, infrastructure, policy support, and cultural variations, this study categorized China’s 31 provincial administrative regions into Eastern, Northeastern, Central, and Western regions to conduct a stepwise analysis for more precise and specific research outcomes (see Table 6). The analysis results indicate: First, Digital Countryside construction in the Eastern, Central, and Western regions (Models 1–3) demonstrates a significant positive effect on rural common prosperity overall. Notably, Digital Countryside construction in the Northeastern region (Model 4) has not achieved the expected effectiveness for rural common prosperity. Second, according to geographical location, Digital Countryside in the Yangtze River Basin’s major grain-producing areas shows a positive impact on rural common prosperity (Model 5), while Digital Countryside in the Songhua River Basin’s major grain-producing areas demonstrates no significant impact (Model 6). The Digital Countryside in the Yellow River Basin exhibits a positive impact on rural common prosperity (Model 7). Notably, Digital Countryside construction in non-grain-producing areas also has a positive impact on rural common prosperity, with a relatively larger effect (Model 8). Additionally, Digital Countryside in both the Yangtze River Economic Belt and non-Yangtze River Economic Belt areas generally produces positive effects on rural common prosperity (Model 9).
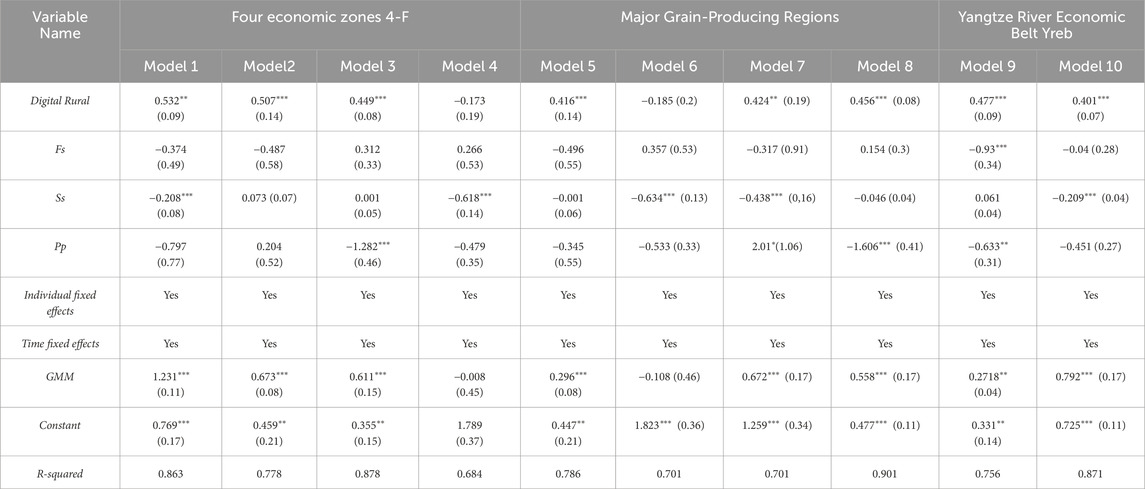
Table 6. Analysis of regional heterogeneity.
The possible explanation is that the Eastern region, with its developed economic foundation and high degree of marketization, coupled with sufficient policy support and resource allocation, has achieved the most significant results in Digital Countryside construction. Although the Central and Western regions started from lower development points, they have also made positive progress in Digital Countryside construction, benefiting from national regional development strategies such as the “Rise of Central China” and “Western Development” initiatives. In contrast, Digital Countryside construction in the Northeastern region is constrained by challenges in economic structural adjustment and unfavorable demographic factors, affecting its role in promoting rural common prosperity. Furthermore, from a regional characteristics perspective, the harsh climate and geographical isolation in the Songhua River Basin constitute objective obstacles to digital infrastructure construction and maintenance, limiting the effective implementation and application expansion of digital technologies. Additionally, the regional outflow of young and middle-aged labor has resulted in insufficient digital literacy among the remaining population, creating a dual dilemma of digital skills gap and inadequate application motivation. Similarly, Hudson (2015) analyzed Alaska’s cold regions, revealing the special challenges posed by harsh climates for digital infrastructure construction and maintenance. Moreover, Hargittai (2002) emphasized that differences in individual capacities are more critical than physical access. Based on these findings, Hypothesis H4 is supported.
5.6 Robustness test
To enhance the credibility of our research model and the reliability of results, this study conducts multiple robustness tests. We use alternative control variables, specifically replacing fiscal support, social security, and primary industry proportion with rural infrastructure investment, rural pension insurance participation rate, and non-agricultural employment ratio, while adding labor force quality and agricultural product marketization degree. Additionally, we divide the sample into early and late periods of China’s digital promotion to verify the temporal stability of results. Furthermore, we test result stability by excluding samples from specific regions (such as municipalities). Finally, the study applies a 1% trimming procedure to eliminate potential interference from extreme observations (As shown in Table 7).
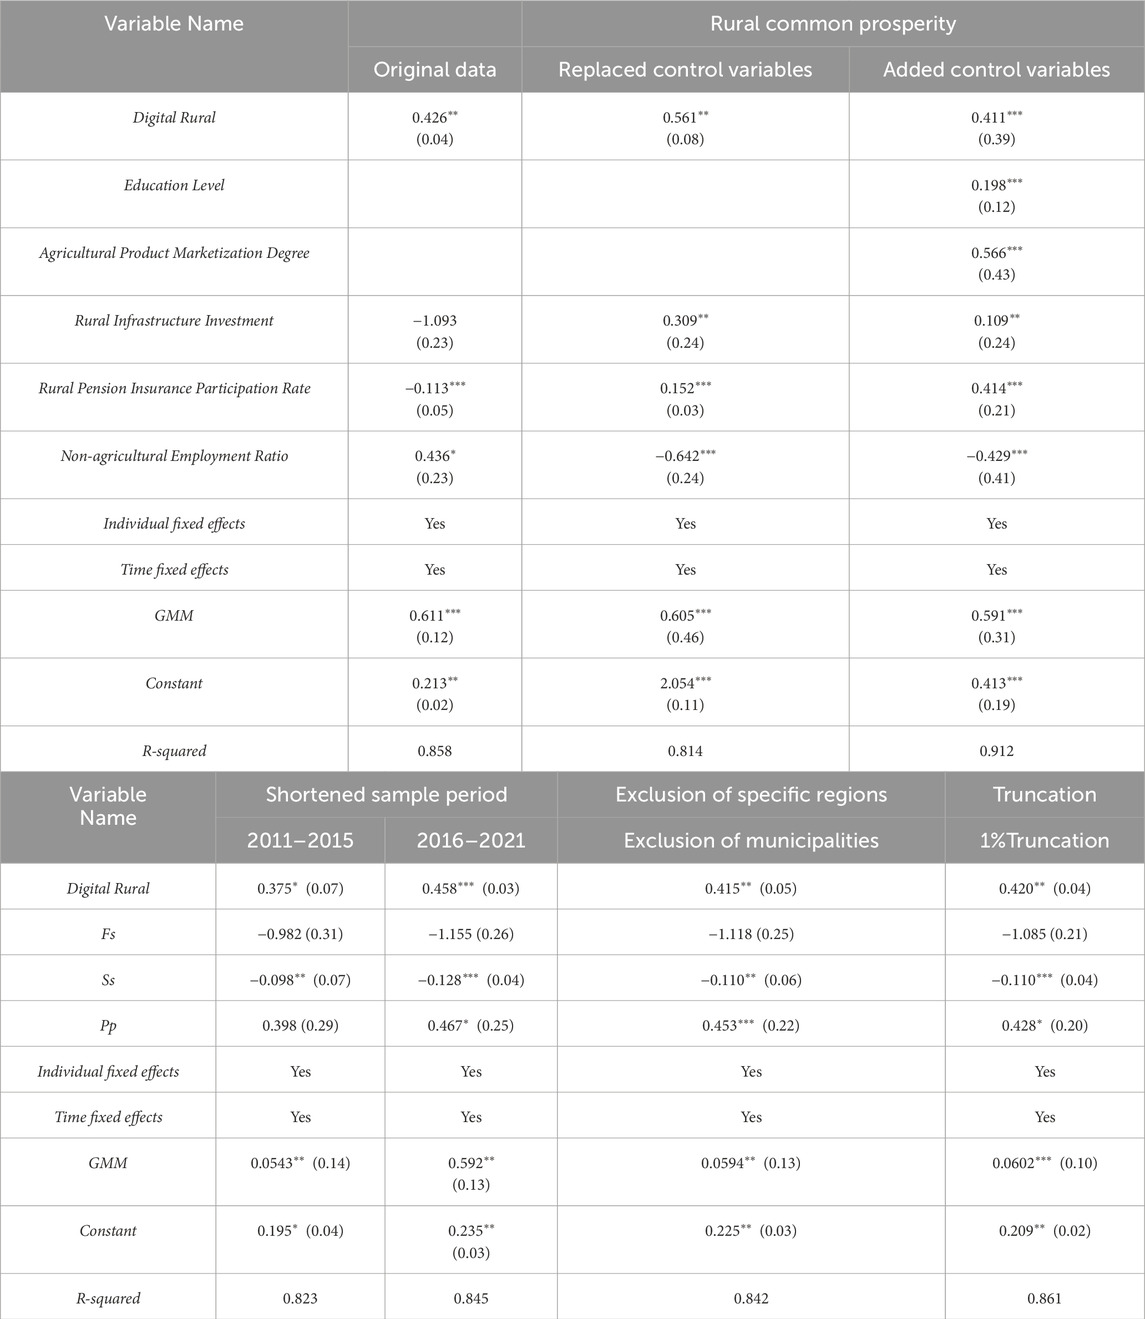
Table 7. Robustness test.
The results indicate that despite minor numerical differences in regression coefficients after various robustness tests, their significance levels and directions remain unchanged. Evidently, the robustness test results in Table 7 are fundamentally consistent with the original data in Table 3, demonstrating that the regression results are relatively robust.
5.7 Spatial spillover effect analysis
5.7.1 Spatial correlation test
Table 8 adopts the global Moran’s I index as a testing tool to examine the spatial autocorrelation of digital rural development and rural common prosperity. The research finds that the global Moran’s I index for digital rural development is significantly positive, indicating a preliminary positive spatial autocorrelation in its distribution, while the global Moran’s I index for rural common prosperity is also significantly positive, demonstrating positive spatial autocorrelation. This suggests that both exhibit “neighborhood similarity” characteristics spatially. This aligns with digital technology diffusion theory, whereby digital development levels in geographically adjacent areas often influence each other through technology diffusion, information flow, and demonstration effects, resulting in spatial agglomeration patterns of regional development. From a practical perspective, the existence of these spatial autocorrelations confirms the necessity of employing spatial econometric models.
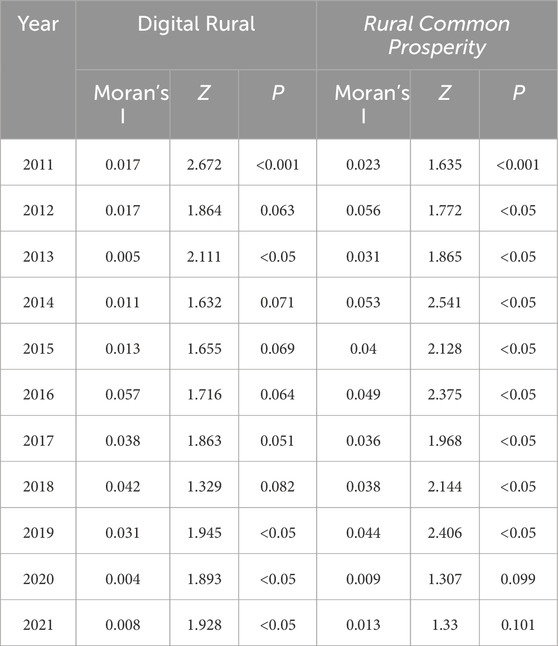
Table 8. Spatial Autocorrelation test.
5.7.2 Spatial durbin model
In constructing the spatial econometric model, the paper considers issues such as global economic cycles, regional cultural backgrounds, and economic growth dynamics, adopting a multi-model analysis approach. This includes time fixed effects (Model 7), random effects (Model 8), individual fixed effects (Model 9), and two-way fixed effects (Model 10). By controlling different types of fixed effects, the risk of omitted variable bias in the model can be reduced, thereby enhancing the reliability and precision of the estimation results. After Log-likelihood comparison, Hausman test, LR test, and Wald test (Note, 1982; Zapata and Rambaldi, 1997; Lee, 2017), all passing the 1% significance level test, the null hypothesis is rejected, indicating that the selection of the spatial Durbin model is appropriate. The time fixed effects model performs optimally, with results shown in Table 9.
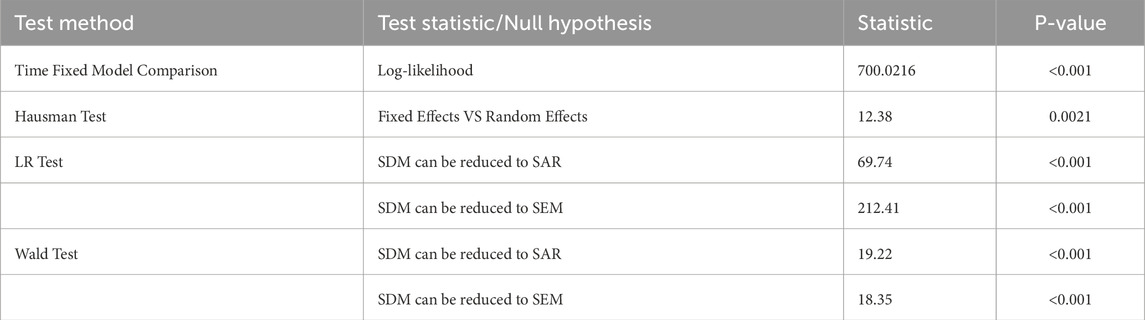
Table 9. Model test results.
Among these, Model 1 in Table 10 shows a significantly positive coefficient for the digital rural index at the 1% significance level, indicating that the impact of digital rural development on rural common prosperity may primarily manifest through temporal variation, fully demonstrating the cyclical effect of digital rural construction in improving rural prosperity levels. Specifically, the introduction and application of information technology has greatly improved information circulation, market access capabilities, and production efficiency in rural areas, all of which are key factors driving rapid rural economic development. Notably, in Model 1 which controls for time fixed effects, digital rural development has a significant positive impact on rural common prosperity (0.751***), while in subsequent Models 2-4, this direct effect becomes insignificant. This result suggests that inherent regional characteristics may play a critical role in the relationship between digital rural development and rural common prosperity. A potential reason for this is that the level of digital development in rural areas is largely constrained by inherent characteristics that are difficult to change in the short term, such as regional economic foundation, human capital accumulation, and infrastructure conditions. Particularly in underdeveloped regions, long-term accumulated burdens and the digital divide lead to time lags in digital development, where inputs and outputs in the short term may not exhibit a linear relationship. Therefore, when we control for these inherent characteristics, the marginal effect of digital rural construction is relatively limited in the short term.
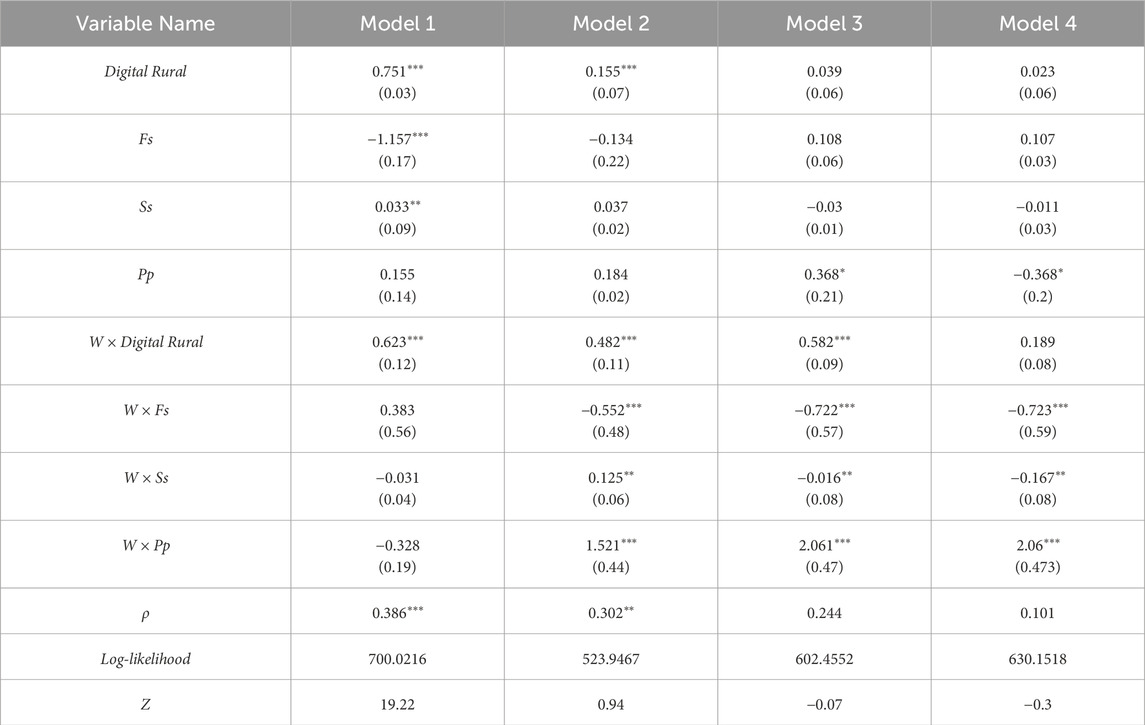
Table 10. Spatial durbin model.
Simultaneously, the coefficients of spatially lagged terms for digital rural development (Models 7–10) also exhibit significant weakening or disappearance, confirming that the impact of digital rural initiatives on rural common prosperity cannot disregard the moderating effect of region-specific conditions. Growth pole theory also indicates that under the impetus of long-term capital operations and economic activities, core regions not only develop rapidly themselves but also promote technological innovation and production efficiency improvements in surrounding areas, thereby accelerating the realization of common prosperity within the region. However, significant disparities exist in digital infrastructure construction, industrial development foundations, and residents’ digital literacy, resulting in varied effects of identical digital rural policies across different regions. Particularly in economically developed regions, well-established market mechanisms and higher degrees of digitalization may amplify the positive effects of digital rural construction, whereas in underdeveloped regions, the digital divide may constrain the effective implementation of digital rural policies. These findings provide dynamic theoretical support for rural digitalization strategies and an empirical foundation for relevant policy formulation, offering significant guidance for China’s regional coordinated development strategy and digital rural construction policy development.
Research indicates that digital rural development not only directly promotes rural common prosperity, but its indirect effects are also significantly manifested through spatial spillovers, thus comprehensively validating the correctness of Hypothesis H4. Specifically, according to the decomposition results of research data (see Table 11), the direct effect coefficient of digital rural development reaches 0.733, and this significant positive coefficient demonstrates that digital rural construction has generated substantial and powerful promotional effects within the local region. Meanwhile, the indirect effect coefficient of digital rural development is 0.262, revealing the regional linkage effect whereby digital rural areas promote rural common prosperity in adjacent regions through spatial technology diffusion. Combining these two aspects, the total effect coefficient of digital rural development reaches 0.996, demonstrating the positive driving force of digital rural construction on rural common prosperity. Similarly, the European Commission also views information and communication technology as an increasingly important component of European cohesion policy, considering that rural digitalization can reduce regional disparities (Norris, 2020). The research not only elaborates on the direct economic benefits of digital rural development but also appropriately positions digital rural areas as “products of deep integration between information technology and rural economy,” and thoroughly explores their multidimensional impacts on regional economic development, providing strong support for achieving comprehensive development and sustainable common prosperity in rural areas.

Table 11. Space overflow analysis.
6 Conclusion and recommendations
This paper selects panel data from 31 Chinese provinces spanning 2011–2021 to construct an analytical framework for China’s digital rural development and rural common prosperity. The research finds that the hardware aspects of digital rural construction, centered on infrastructure development, cannot effectively promote rural common prosperity. More critically, while the advancement of circulation digitalization appears to increase rural market competition and efficiency on the surface, it actually presents compatibility contradictions with traditional rural economic structures, failing to promote rural economic vitality as expected. Furthermore, in the process of promoting rural common prosperity, the effectiveness of digital rural initiatives exhibits heterogeneity due to differences in digital environments, cultural backgrounds, and strategic elements across different regions. Additionally, pollution discharge fees in rural areas may increase the economic burden on farmers, restrict agricultural modernization investments, weaken rural economic vitality, and consequently affect the promotional role of digital rural construction on rural common prosperity. However, through optimized allocation of central transfer payments, local governments have increased resource allocation toward rural areas, thereby strengthening the role of digital means in narrowing urban-rural disparities and promoting rural prosperity. Finally, digital rural construction not only enhances the level of common prosperity in local rural areas but also radiates to surrounding regions through information circulation, technology diffusion, and economic connections, promoting the elevation of common prosperity levels in neighboring rural areas. Based on the above conclusions, this paper proposes the following recommendations:
First, Local governments should collaborate with village committees to actively respond to the national “Digital Farmer” initiative, promote digital skills training, and enhance local farmers’ production efficiency and market competitiveness. Furthermore, considering the cyclical nature of digital infrastructure development, grassroots governments should proceed according to their capabilities. The emphasis should be on introducing digital technologies to drive digital industrial transformation and revitalize the rural economy.
Second, establish agricultural technology innovation supply models utilizing regional characteristics. Leveraging demographic and geographical advantages, local governments can enter into strategic cooperation agreements with developed regions, particularly with eastern regions that focus on high-tech resource allocation as their primary approach, thus providing long-term effective supply. Furthermore, underdeveloped regions can cultivate “high-quality” farmers through paired assistance programs, while attracting investment through fiscal subsidies and tax incentives, thereby achieving rapid “internal-external circulation” of local economy and talent. Particular attention should be paid to the resource advantages of northeastern regions, including forestry, agriculture, and mineral resources, to develop digital management and marketing solutions such as digital agricultural product traceability systems, intelligent forestry management systems, and online agricultural product direct sales platforms.
Third, establish and improve the long-term mechanism for central government transfer payments. Primarily, the central government should build fund management and project monitoring systems based on big data and artificial intelligence to track and evaluate the utilization of central transfer payments in real time. Simultaneously, inspection teams should be dispatched to regularly evaluate local fund utilization efficiency and project implementation outcomes, coordinate resource allocation between economically developed and underdeveloped regions, and establish a dynamic supervision system featuring AI-first technology with human oversight. Additionally, emphasis should be placed on cultivating local governments’ ability to mobilize diversified funding sources, while preventing the formation of an excessive dependency mindset characterized by “waiting,” “relying,” and “asking,” which would undermine local government autonomy and innovation capacity.
Fourth, focus on the dynamic equilibrium threshold between environmental costs and economic development. Through scientific determination of pollution fee standards, establish a flexible charging mechanism that covers pollution control costs while not exceeding rural economic capacity, ultimately forming a virtuous cycle system of “polluter pays-environmental restoration-industrial transformation.” Concurrently, develop tiered and phased pollution fee collection standards based on different regions’ economic development levels, industrial structures, and environmental carrying capacities. Moreover, rural areas and enterprises that actively implement pollution reduction measures and exceed environmental protection targets should be rewarded through fiscal compensation, tax exemptions, and green credit mechanisms, thereby incentivizing broader participation in environmental protection among rural regions and enterprises. Concurrently, the establishment of an “emission rights trading” mechanism is recommended, allowing rural areas and enterprises with lower pollution emissions to generate additional revenue by selling surplus emission rights, thus encouraging more regions and enterprises to adopt environmental protection measures and achieve a win-win situation between environmental protection and economic development.
Data availability statement
The raw data supporting the conclusions of this article will be made available by the authors, without undue reservation.
Author contributions
XZ: Funding acquisition, Supervision, Writing – review and editing. YW: Conceptualization, Data curation, Methodology, Writing – original draft. MH: Resources, Software, Supervision, Writing – review and editing.
Funding
The author(s) declare that financial support was received for the research and/or publication of this article. Beijing Social Science Foundation: Beijing Social Science Foundation Project: “Research on the Experience and Pathways of Digital Empowerment for Social Governance Innovation in Beijing,” Project Number (24ZGB005).
Conflict of interest
The authors declare that the research was conducted in the absence of any commercial or financial relationships that could be construed as a potential conflict of interest.
Generative AI statement
The author(s) declare that no Generative AI was used in the creation of this manuscript.
Publisher’s note
All claims expressed in this article are solely those of the authors and do not necessarily represent those of their affiliated organizations, or those of the publisher, the editors and the reviewers. Any product that may be evaluated in this article, or claim that may be made by its manufacturer, is not guaranteed or endorsed by the publisher.
References
Aguilar, G. R., and Sumner, A. (2020). Who are the world’s poor? A new profile of global multidimensional poverty. World Dev. 126, 104716. doi:10.1016/j.worlddev.2019.104716
Ambec, S., Cohen, M. A., Elgie, S., and Lanoie, P. (2013). The Porter hypothesis at 20: can environmental regulation enhance innovation and competitiveness? Rev. Environ. Econ. policy 7, 2–22. doi:10.1093/reep/res016
Arellano, M., and Bover, O. (1995). Another look at the instrumental variable estimation of error-components models. J. Econ. 68 (1), 29–51. doi:10.1016/0304-4076(94)01642-d
Aydoğan, B., and Vardar, G. (2020). Evaluating the role of renewable energy, economic growth and agriculture on CO2 emission in E7 countries. Int. J. Sustain. Energy 39 (4), 335–348. doi:10.1080/14786451.2019.1686380
Baumol, W. J., and Oates, W. E. (1988). The theory of environmental policy. Cambridge, United Kingdom: Cambridge University Press.
Bellemare, M. F., Masaki, T., and Pepinsky, T. B. (2017). Lagged explanatory variables and the estimation of causal effect. J. Polit. 79 (3), 949–963. doi:10.1086/690946
Blundell, R., and Bond, S. (1998). Initial conditions and moment restrictions in dynamic panel data models. J. Econ. 87 (1), 115–143. doi:10.1016/s0304-4076(98)00009-8
Böhringer, C., and Jochem, P. E. (2007). Measuring the immeasurable—a survey of sustainability indices. Ecol. Econ. 63 (1), 1–8. doi:10.1016/j.ecolecon.2007.03.008
Calabrese, A., and Jung, D. (1992). Broadband telecommunications in rural America: emerging infrastructures for residential service. Telecommun. Policy 16 (3), 225–236. doi:10.1016/0308-5961(92)90050-y
Cao, X., Yan, M., and Wen, J. (2023). Exploring the level and influencing factors of digital village development in China: insights and recommendations. Sustainability 15 (13), 10423. doi:10.3390/su151310423
Chang, H. H., and Chuang, S. S. (2011). Social capital and individual motivations on knowledge sharing: participant involvement as a moderator. Inf. and Manag. 48(1): 9–18. doi:10.1016/j.im.2010.11.001
Chen, C., Gao, J., Cao, H., and Chen, W. (2024). Unpacking the agricultural innovation and diffusion for modernizing the smallholders in rural China: from the perspective of agricultural innovation system and its governance. J. Rural Stud. 110, 103385. doi:10.1016/j.jrurstud.2024.103385
Chen, H., Cao, J., Zhu, H., and Wang, Y. (2022). Understanding household vulnerability and relative poverty in forestry transition: a study on forestry-worker families in China’s greater khingan Mountains state-owned forest region. Sustainability, 14(9): 4936, doi:10.3390/su14094936
Cheng, Z., and Li, X. (2022). Do raising environmental costs promote industrial green growth? A Quasi-natural experiment based on the policy of raising standard sewage charges. J. Clean. Prod. 343, 131004. doi:10.1016/j.jclepro.2022.131004
Choi, Y. (2011). The evolution of “socialism with Chinese characteristics”: its elliptical structure of socialist principles and China's realities. Pac. Focus, 26(3): 385–404. doi:10.1111/j.1976-5118.2011.01070.x
Collington, R. (2022). Disrupting the welfare state? Digitalisation and the retrenchment of public sector capacity. New Polit. Econ. 27 (2), 312–328. doi:10.1080/13563467.2021.1952559
Davies, T. M., Marshall, J. C., and Hazelton, M. L. (2018). Tutorial on kernel estimation of continuous spatial and spatiotemporal relative risk. Statistics Med. 37 (7), 1191–1221. doi:10.1002/sim.7577
Dong, J., Sheng, Y., Shao, Q., Jing, H., Xia, M., and Li, D. (2024). The impact of digital economy on the coordinated development of urban and rural areas in the context of common prosperity. Int. J. Soc. Sci. Public Adm. 2, 205–211. doi:10.62051/ijsspa.v2n3.28
Döring, T., and Schnellenbach, J. (2006). What do we know about geographical knowledge spillovers and regional growth? a survey of the literature. Reg. Stud., 40(03): 375–395. doi:10.1080/00343400600632739
Dzator, J., Acheampong, A. O., Appiah-Otoo, I., and Dzator, M. (2023). Leveraging digital technology for development: does ICT contribute to poverty reduction? Telecommun. Policy 47 (4), 102524. doi:10.1016/j.telpol.2023.102524
Fan, F., Lian, H., Liu, X., and Wang, X. (2021). Can environmental regulation promote urban green innovation Efficiency? An empirical study based on Chinese cities. J. Clean. Prod., 287: 125060, doi:10.1016/j.jclepro.2020.125060
Fang, C., Chen, Z., Liao, X., Sun, B., and Meng, L. (2024). Urban-rural digitalization evolves from divide to inclusion: empirical evidence from China. npj Urban Sustain. 4 (1), 51. doi:10.1038/s42949-024-00187-4
Gai, Q., He, Z., Su, F., and Zhao, W. (2025). The impacts, mechanisms, and patterns of China rural collective economic development with common prosperity for all. Int. Stud. Econ. doi:10.1002/ise3.70004
Georgescu-Roegen, N. (1971). The entropy law and the economic process. Cambridge, MA: Harvard University Press.
Gow, M. (2017). The core socialist values of the Chinese dream: towards a Chinese integral state. Crit. Asian Stud., 49(1): 92–116. doi:10.1080/14672715.2016.1263803
Hargittai, E. (2002). Second-level digital divide: mapping differences in people's online skills. arXiv Prepr. cs/0109068. doi:10.5210/fm.v7i4.942
Hilbert, M. (2011). The end justifies the definition: the manifold outlooks on the digital divide and their practical usefulness for policy-making. Telecommun. Policy 35 (8), 715–736. doi:10.1016/j.telpol.2011.06.012
Ho, K. L. P., Nguyen, C. N., Adhikari, R., Miles, M. P., and Bonney, L. (2019). Leveraging innovation knowledge management to create positional advantage in agricultural value chains. J. Innovation and Knowl., 4(2): 115–123. doi:10.1016/j.jik.2017.08.001
Hou, J., Zhang, M., and Li, Y. (2024). Can digital economy truly improve agricultural ecological transformation? New insights from China. Humanit. Soc. Sci. Commun. 11 (1), 153–13. doi:10.1057/s41599-023-02593-y
Hou, X., and Gao, J. (2025). Toward Common Prosperity: measuring decrease in inequality in China prefecture-level cities. Struct. Change Econ. Dyn. 72, 29–46. doi:10.1016/j.strueco.2024.10.006
Huang, Z., Wang, L., and Yu, W. (2025). Financial development, electronic payments, and residents' consumption: evidence from rural China. Finance Res. Lett. 71, 106455. doi:10.1016/j.frl.2024.106455
Hudson, H. E. (2015). Connecting alaskans: telecommunications in Alaska from telegraph to broadband. Fairbanks, Alaska: University of Alaska Press.
Jiao, W., Hagler, G. S. W., Williams, R. W., Sharpe, R. N., Weinstock, L., and Rice, J. (2015). Field assessment of the village green project: an autonomous community air quality monitoring system. Environ. Sci. and Technol., 49(10): 6085–6092. doi:10.1021/acs.est.5b01245
Jie, Y. I. N., Yiting, H., and Lan, W. (2023). Impacts of human–animal interrelationships on spatial planning and implications for applications thereof from the “one health” perspective. Landsc. Archit., 30(12): 27–32. doi:10.12409/j.fjyl.202306060263
Jin, Q., Guo, Y., Dang, H., Zhu, J., and Abula, K. (2024). The second-round effects of the agriculture value chain on farmers’ land transfer-in: evidence from the 2019 land economy survey data of eleven provinces in China. Land, 13(4): 490, doi:10.3390/land13040490
Kakwani, N., Wang, X., Xue, N., and Zhan, P. (2022). Growth and common prosperity in China. China and World Econ., 30(1): 28–57. doi:10.1111/cwe.12401
Kosasih, A., and Sulaiman, E. (2024). Digital transformation in rural settings: unlocking opportunities for sustainable economic growth and community empowerment. J. Sustain. Tour. Entrepreneursh. 5 (2), 129–143. doi:10.35912/joste.v5i2.2278
Kozmetsky, G. (1997). Synergy for the 21st Century: between unstructured problems and management planning controls.
Kozmetsky, G., Williams, F., and Williams, V. (2004). New wealth: commercialization of science and technology for business and economic development.
Lai, M., Li, W., Gao, Z., and Xing, Z. (2024). Evaluation, mechanism and policy implications of the symbiotic relationship among rural digitization, agricultural development and farmer enrichment: evidence from digital village pilots in China. Front. Environ. Sci. 12, 1361633. doi:10.3389/fenvs.2024.1361633
Lavenberg, S. S., and Welch, P. D. (1981). A perspective on the use of control variables to increase the efficiency of Monte Carlo simulations. Manag. Sci. 27 (3), 322–335. doi:10.1287/mnsc.27.3.322
Lechman, E., and Popowska, M. (2022). Harnessing digital technologies for poverty reduction. Evidence for low-income and lower-middle income countries. Telecommun. Policy 46 (6), 102313. doi:10.1016/j.telpol.2022.102313
Lee, S. (2017). Detecting differential item functioning using the logistic regression procedure in small samples. Appl. Psychol. Meas. 41 (1), 30–43. doi:10.1177/0146621616668015
Lei, M., Yang, X., Hong, S., Wang, D., Zhang, W., and Chen, H. (2025). Sustainable digital rural development: measurements, dynamic evolutions, and regional disparities—a case study of China. Sustainability 17 (9), 4250. doi:10.3390/su17094250
Leng, X. (2022). Digital revolution and rural family income: evidence from China. J. Rural Stud. 94, 336–343. doi:10.1016/j.jrurstud.2022.07.004
Leong, C., Pan, S. L., Newell, S., and Cui, L. (2016). The emergence of self-organizing ecommerce ecosystems in remote villages of China: a tale of digital empowerment for rural development. Mis Q. 40, 475–484. doi:10.25300/misq/2016/40.2.11
Li, C. (2008). The philosophy of harmony in classical Confucianism. Philos. compass 3 (3), 423–435. doi:10.1111/j.1747-9991.2008.00141.x
Li, J., Liu, G., and Dong, J. (2024). Coordinated reduction effect of pollutant discharge fees on enterprises' pollutant and carbon emissions in China. Energy Econ. 136, 107707. doi:10.1016/j.eneco.2024.107707
Li, S. (2023). Understanding China’s road to common prosperity: background, definition and path. China Econ. J. 16 (1), 1–13. doi:10.1080/17538963.2023.2164950
Li, T., and Du, T. (2021). Vertical fiscal imbalance, transfer payments, and fiscal sustainability of local governments in China. Int. Rev. Econ. and Finance, 74: 392–404. doi:10.1016/j.iref.2021.03.019
Liu, Y., Li, X., and Guo, Y. (2024b). Exploring land system reform for demographic transition in rural China. Land Use Policy 147, 107355. doi:10.1016/j.landusepol.2024.107355
Liu, Y., Zang, Y., and Yang, Y. (2020). China’s rural revitalization and development: theory, technology and management. J. Geogr. Sci., 30: 1923–1942. doi:10.1007/s11442-020-1819-3
Liu, Y., Zhang, H., Ning, M., and Wang, L. (2024a). Has digital village construction narrowed the urban–rural income gap: evidence from Chinese counties. Sustainability 16 (13), 5330. doi:10.3390/su16135330
Luo, G., Yang, Y., and Wang, L. (2023). Driving rural industry revitalization in the digital economy era: exploring strategies and pathways in China. Plos one 18 (9), e0292241. doi:10.1371/journal.pone.0292241
Meegoda, J. N., Watts, D., Hsieh, H. N., and Bezerra de Souza, B. (2021). Community based pollution prevention for two urban cities—a case study. Clean. Technol. 3 (1), 59–78. doi:10.3390/cleantechnol3010004
Mei, Y., Miao, J., and Lu, Y. (2022). Digital villages construction accelerates high-quality economic development in rural China through promoting digital entrepreneurship. Sustainability 14 (21), 14224. doi:10.3390/su142114224
Miao, Y., and Li, Z. (2023). The poverty alleviation effect of transfer payments: evidence from China. Humanit. Soc. Sci. Commun. 10 (1), 910–919. doi:10.1057/s41599-023-02446-8
Moral-Benito, E., Allison, P., and Williams, R. (2019). Dynamic panel data modelling using maximum likelihood: an alternative to Arellano-Bond. Appl. Econ. 51 (20), 2221–2232. doi:10.1080/00036846.2018.1540854
Myrdal, G. (2017). The political element in the development of economic theory. London, England: Routledge.
Naldi, L., Nilsson, P., Westlund, H., and Wixe, S. (2015). What is smart rural development? J. rural Stud. 40, 90–101. doi:10.1016/j.jrurstud.2015.06.006
Norris, L. (2020). The spatial implications of rural business digitalization: case studies from Wales. Regional Stud. Regional Sci. 7 (1), 499–510. doi:10.1080/21681376.2020.1841674
Note, A. E. (1982). The likelihood ratio, Wald, and Lagrange multiplier tests: an expository note. Am. Statistician 36 (3 Part 1), 153–157. doi:10.2307/2683166
Papadopoulos, G., Arduini, S., Uyar, H., Psiroukis, V., Kasimati, A., and Fountas, S. (2024). Economic and environmental benefits of digital agricultural technologies in crop production: a review. Smart Agric. Technol. 8, 100441. doi:10.1016/j.atech.2024.100441
Peng, X., Yan, S., and Yan, X. (2024). Studying whether the digital economy effectively promotes China’s common prosperity based on the spatial Durbin model. Humanit. Soc. Sci. Commun. 11 (1), 1655–14. doi:10.1057/s41599-024-04132-9
Rodrik, D., McMillan, M., and Sepúlveda, C. (2016). Structural change, fundamentals, and growth. Structural change, fundamentals, and growth. Washington DC: IFPRI.
Romer, P. M. (1990). Endogenous technological change. J. political Econ. 98 (5), S71–S102. doi:10.1086/261725
Sabatino, C., Diaz-Bonilla, C., Aron, D., Haddad, C., Nguyen, M. C., and Wu, H. (2022). Global database of shared prosperity.
Salemink, K., Strijker, D., and Bosworth, G. (2017). Rural development in the digital age: a systematic literature review on unequal ICT availability, adoption, and use in rural areas. J. rural Stud. 54, 360–371. doi:10.1016/j.jrurstud.2015.09.001
Srivastava, S. C., and Shainesh, G. (2015). Bridging the service divide through digitally enabled service innovations. Mis Q., 39(1): 245–268. Available online at: https://aisel.aisnet.org/misq/vol39/iss1/14/.
Sun, F., Zheng, Q., Ye, C., and Lin, J. (2023). A rural resilience development indicator system oriented to common prosperity: the case of a coastal village in Zhejiang Province. Ecol. Indic., 156: 111126, doi:10.1016/j.ecolind.2023.111126
Tu, Z., Kong, J., Sun, L., and Liu, B. (2024). Can the digital economy reduce the rural-urban income gap? Sustainability 16 (2), 938. doi:10.3390/su16020938
Vo, D. H. (2010). The economics of fiscal decentralization. J. Econ. Surv., 24(4): 657–679. doi:10.1111/j.1467-6419.2009.00600.x
Wan, Y., Sheng, N., Wei, X., and Su, H. (2023). Study on the spatial spillover effect and path mechanism of green finance development on China's energy structure transformation. J. Clean. Prod., 415: 137820, doi:10.1016/j.jclepro.2023.137820
Wang, R., Zameer, H., Feng, Y., Jiao, Z., Xu, L., and Gedikli, A. (2019). Revisiting Chinese resource curse hypothesis based on spatial spillover effect: a fresh evidence. Resour. Policy, 64: 101521, doi:10.1016/j.resourpol.2019.101521
Wang, Y., Huo, Z., Li, D., and Zhang, M. (2022). Evaluation of common prosperity level and regional difference analysis along the Yangtze River Economic Belt. Int. J. Environ. Res. Public Health, 19(19): 11851, doi:10.3390/ijerph191911851
Warren, M. (2007). The digital vicious cycle: links between social disadvantage and digital exclusion in rural areas. Telecommun. policy, 31(6-7): 374–388. doi:10.1016/j.telpol.2007.04.001
Wei, X., Yang, Z., Yan, Y., and Sun, J. (2024). Rural E-commerce, digital finance, and urban–rural common prosperity: a quasi-natural experiment based on China's comprehensive demonstration of E-commerce entering rural areas policy. Finance Res. Lett. 69, 106237. doi:10.1016/j.frl.2024.106237
Xu, Q., Zhong, M., and Dong, Y. (2024). Digital finance and rural revitalization: empirical test and mechanism discussion. Technol. Forecast. Soc. Change, 201: 123248, doi:10.1016/j.techfore.2024.123248
Yang, R., Liu, Y., Long, H., and Qiao, L. (2015). Spatio-temporal characteristics of rural settlements and land use in the Bohai Rim of China. J. Geogr. Sci., 25: 559–572. doi:10.1007/s11442-015-1187-6
Yang, Y., Lian, D., Zhang, Y., Wang, D., and Wang, J. (2024). Towards sustainable agricultural development: integrating small-scale farmers in China through agricultural social services. J. Knowl. Econ. 15, 16575–16616. doi:10.1007/s13132-024-01742-1
Ye, L., and Yang, H. (2020). From digital divide to social inclusion: a tale of mobile platform empowerment in rural areas. Sustainability 12 (6), 2424. doi:10.3390/su12062424
Yu, A. (2024). Cross-cultural evolution of China’s rural social security system: a global comparison. In SHS Web Conf., 187, 04020. doi:10.1051/shsconf/202418704020
Zapata, H. O., and Rambaldi, A. N. (1997). Monte Carlo evidence on cointegration and causation. Oxf. Bull. Econ. statistics 59 (2), 285–298. doi:10.1111/1468-0084.00065
Zeng, G., Ma, Z., He, Y., Chen, L., Sun, D., and Lei, X. (2024). Current status of and suggestions on sewage treatment fees in China. Water 16 (9), 1219. doi:10.3390/w16091219
Zeng, Y., Jia, F., Wan, L., and Guo, H. (2017). E-commerce in agri-food sector: a systematic literature review. Int. Food Agribus. Manag. Rev., 20(4): 439–460. doi:10.22434/ifamr2016.0156
Zhang, D., Gao, W., and Lv, Y. (2020). The triple logic and choice strategy of rural revitalization in the 70 years since the founding of the People’s Republic of China, based on the perspective of historical evolution. Agriculture 10 (4), 125. doi:10.3390/agriculture10040125
Zhang, H., and Song, W. (2024). Disparity of rural income in counties between ecologically functional areas and non-ecologically functional areas from social capital perspective. Sustainability, 16(7): 2661, doi:10.3390/su16072661
Zhang, J., Jabbar, A., and Li, X. (2024a). How does China’s agricultural subsidy policy drive more commercially productive small farmers? The role of farmland scale, labor supply, and cropping structural change. Land 13 (12), 2058. doi:10.3390/land13122058
Zhang, L., Wei, L., Zhang, W., and Fang, Y. (2024b). Bridging the gap: coordinating equity and efficiency in older people care resource allocation in China. BMC Geriatr., 24(1): 165, doi:10.1186/s12877-024-04696-w
Zhang, M., and Wang, X. (2023). Measurement of common prosperity of Chinese rural households using graded response models: evidence from Zhejiang province. Int. J. Environ. Res. Public Health, 20(5): 4602, doi:10.3390/ijerph20054602
Zhang, X., and Fan, D. (2024). Can agricultural digital transformation help farmers increase income? An empirical study based on thousands of farmers in Hubei Province. Environ. Dev. Sustain. 26 (6), 14405–14431. doi:10.1007/s10668-023-03200-5
Zhao, T., and Jiao, F. (2024). Does digital financial inclusion promote common prosperity? The role of regional innovation. Electron. Commer. Res., 1–26. doi:10.1007/s10660-023-09797-z
Zhao, W., Liang, Z., and Li, B. (2022). Realizing a rural sustainable development through a digital village construction: experiences from China. Sustainability 14 (21), 14199. doi:10.3390/su142114199
Zhou, X., Lv, Y., Zou, J., and Gu, X. (2024). Theoretical logic and implementation path of comprehensive land consolidation for promoting common prosperity: a case study of ningbo city. Land, 13(2): 253, doi:10.3390/land13020253
Keywords: digital rural development, rural common prosperity, central transfer payments, spatial spillover, pollution discharge fees
Citation: Zhou X, Wang Y and Han M (2025) Bridging the digital divide: how does rural digitalization promote rural common prosperity?. Front. Earth Sci. 13:1591924. doi: 10.3389/feart.2025.1591924
Received: 11 March 2025; Accepted: 21 May 2025;
Published: 04 June 2025.
Edited by:
Stefano Rinaldi, University of Brescia, ItalyReviewed by:
Iqbal Yulizar Mukti, Telkom University, IndonesiaJiancong Tao, Renmin University of China, China
Copyright © 2025 Zhou, Wang and Han. This is an open-access article distributed under the terms of the Creative Commons Attribution License (CC BY). The use, distribution or reproduction in other forums is permitted, provided the original author(s) and the copyright owner(s) are credited and that the original publication in this journal is cited, in accordance with accepted academic practice. No use, distribution or reproduction is permitted which does not comply with these terms.
*Correspondence: Mingyang Han, bWF0ZXJpYWwwNTA0QDE2My5jb20=