 Douaa Fathy
 Eun Young Lee
 Xinxuan Xiang2
 Mabrouk Sami
- 1Geology Department, Faculty of Science, Minia University, El-Minia, Egypt
- 2Department of Geology, University of Vienna, Vienna, Austria
- 3Department of Agricultural Microbiology, Faculty of Agriculture, Minia University, El-Minia, Egypt
- 4Geosciences Department, College of Science, United Arab Emirates University, Al Ain, United Arab Emirates
1 Introduction
Petrophysical properties are essential for exploring subsurface rocks, particularly in evaluating their capacity to store and transmit fluids. These properties play a crucial role across various geoscientific disciplines, including lithologic characterization, rock mechanics, and reservoir performance evaluation. Their variability is influenced by a complex interplay of depositional environments, diagenetic alterations (e.g., cementation, dissolution), burial history, structural deformation, and fluid-rock interactions, spanning diverse geological settings (e.g., Lee et al., 2021a; Lee et al., 2021b; Lee et al., 2025; Spahić et al., 2024; Pan et al., 2025; Zou et al., 2025). Understanding these properties is fundamental for assessing reservoir quality, optimizing fluid extraction and injection processes (including hydrocarbons, water, and CO2), and enhancing reservoir management strategies (e.g., Dandekar, 2013; Falcon-Suarez et al., 2024; Shedid, 2019). A comprehensive study that integrates a diverse and extensive range of petrophysical data and ensures its accessibility has been required for advancing geoscientific research and technological developments.
Around the Gulf of Suez, Miocene sedimentary sequences are crucial for understanding the syn-rift structural and stratigraphic evolution of the Neogene continental rifting system while also forming the region’s primary hydrocarbon reservoirs (Ayyad et al., 2023; Alsharhan, 2003; Bosworth et al., 1998; Bosworth and McClay, 2001; Evans, 1988; Henaish et al., 2023; McClay et al., 1998; Moustafa and Khalil, 2020; Sallam et al., 2019; Sobhy and Moustafa, 2024). Although extensive explorations and research have been conducted, Miocene deposits remain a subject of interest for both geoscientists and oil industry. Previous studies have used petrophysical datasets to reveal important insights into the structural and stratigraphic frameworks of subsurface Miocene sequences (e.g., Abudeif et al., 2016; Attia et al., 2015), as well as deeply buried Mesozoic strata (e.g., Mohamed et al., 2023), thereby enhancing our understanding of basin evolution and associated petroleum systems. However, due to the confidentiality surrounding productive reservoirs, access to such datasets has not been widely available and published, hindering broader scientific analysis and data re-use. This limitation highlights the need for more data-sharing initiatives and further comprehensive studies. In response, this study presents a comprehensive petrophysical dataset from the middle Miocene reservoir interval in the central Gulf of Suez, contributing to the regional geological knowledge base.
This study presents a comprehensive petrophysical dataset for the middle Miocene Sidri Member in the Belayim oil field, central Gulf of Suez. While petrophysical characteristics of the Sidri Member have been examined in previous studies (e.g., Abd El Rahman et al., 2012; Fathy, 2012; Lee et al., 2025; Nabawy and Barakat, 2017; Ramadan and Eysa, 2012), the lack of complete methodological details and publicly accessible dataset has limited comparative and follow-up analyses. Given that its reservoir significance and variability (e.g., Abudeif et al., 2016; Abuhagaza et al., 2021; Alsharhan, 2003; Attia et al., 2015; El-Kadi et al., 2016; El-Khadragy et al., 2016; Abd El Rahman et al., 2012; Rizk, 1992; Radwan, 2021), integrated studies are essential for improving our understanding of syn-rift evolution and reservoir potential. To address these gaps, this study provides a detailed account of the methodologies and measurements used to analyze core samples from wells 112–82 and BB4. The dataset includes grain and bulk density, porosity, pore-throat radius, horizontal and vertical permeability, and oil and water saturation, incorporating a combination of previously unpublished, re-evaluated, and re-used data. By making these data publicly available to promote transparency and reproducibility, this work aims to support further research, facilitate regional comparisons, and enhance reservoir evaluation across the Gulf of Suez.
2 Geological background
The Gulf of Suez is one of a Neogene continental rift system, marking the boundary between the African and Arabian plates (Figure 1A). It is a key site for studying continental breakup and early-stage oceanic basin formation (Bosworth et al., 1998; Bosworth and McClay, 2001; Evans, 1988; McClay et al., 1998; Moustafa and Khalil, 2020). The syn-rifting commenced in the late Oligocene, progressed during the Miocene, and waned by the late Miocene, which shaped a series of asymmetric mega-half grabens with complex fault system. The uplift and tilting of fault blocks exposed largely the extensive stratigraphic record, ranging from the Precambrian basement to recent deposits. During the Miocene, the extensional tectonic regime generated significant accommodation space for the deposition of thick sedimentary sequence, with syn-sedimentary faulting (Ayyad et al., 2023; Bosworth et al., 1998; El-Naby et al., 2009; Henaish et al., 2023; Moustafa and Khalil, 2020; Segev et al., 2017). The Miocene succession consists of clastics, carbonates, and anhydrite interbeds deposited in fluvial, restricted and shallow marine settings, which is divided into the Gharandal Group (Lower Miocene) and the Ras Malaab Group (Middle to Upper Miocene). The Gharandal Group consists of Nukhul and Rudeis Formations. The Ras Malaab Group is subdivided into the Kareem, Belayim, South Gharib, and Zeit Formations. Our study interval, Sidri Member, is a part of the Belayim Formation (e.g., Al-Husseini, 2012; Bosworth and McClay, 2001; El-Azabi, 2024; Evans, 1988; Sallam et al., 2019; El-Naby et al., 2010).
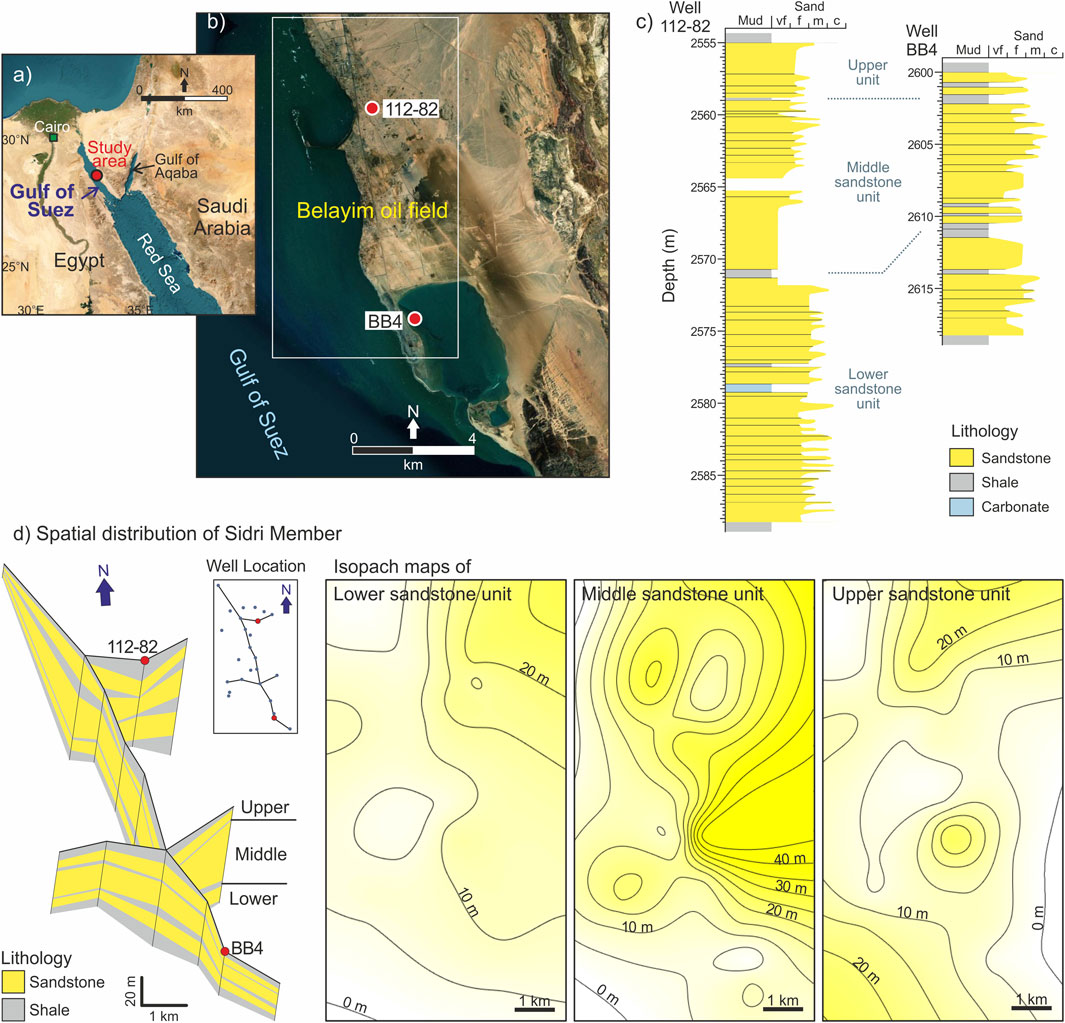
Figure 1. (A) Location of the Gulf of Suez in northeastern Egypt and at the northern end of the Red Sea, showing the study area (red circle; Belayim oil field) in the central Gulf of Suez. (B) Locations of wells 112–82 and BB4 (red circles) in the study area. Image source: ArcGIS (https://www.arcgis.com/). (C) Lithologic profile of the middle Miocene sandstone-shale sequence (Sidri Member) with the upper, middle, and lower units in wells 112–82 and BB4 (revised from Lee et al., 2025). Sandstone grain size: very fine (vf), fine (f), medium (m), and coarse (C). (D) Composite profile and isopach maps of the Sidri sandstone units across the 6 × 11 km2 area [see (B) for location], visualized using the BasinVis 2.0 program (Lee et al.,2020). Contour interval: 5 m.
This study investigates the middle Miocene Sidri Member in the Belayim oil field, central Gulf of Suez (Figure 1B). The Sidri Member comprises interbedded sandstone and shale, consisting of three primary sandstone units delineated by thin calcareous shale layers (Abd El Rahman et al., 2012; Fathy, 2012; Lee et al., 2025). In well 112–82, the Sidri Member is ∼64 m thick, with the main sandstone interval (∼33 m) between depths of 2,555–2,588 m. Well BB4 records a total thickness of ∼30 m, with sandstone units up to 18 m thick between 2,600 and 2,618 m (Figure 1C). Lateral and vertical facies changes, reaching up to 117 m in thickness and exhibiting significant lateral variation (Figure 1D), reflect the influence of syn-rift tectonics, depositional environments, and sea-level changes (Lee et al., 2025).
3 Methods
Discrete core samples from the Sidri sandstone units in wells 112–82 and BB4 (Figure 1C) were collected and subjected to comprehensive petrophysical analyses in the laboratories of Petrobel Service Company, Egypt (Fathy, 2012). To prepare the samples for analysis, a cold solvent extraction process was used for cleaned-state core testing. Chloroform was applied to remove residual hydrocarbons, while methanol was used to eliminate water and any remaining salts. Chemical and visual inspections ensured the complete removal of contaminants. After cleaning, the core plugs were dried in an oven at 60°C with 40% relative humidity until their weights stabilized. Once dried, the plugs were transferred to desiccators partially filled with silica gel and allowed to cool to ambient temperature. Once thermal equilibrium was reached, key petrophysical parameters were measured. The petrophysical dataset obtained from these analyses includes grain and bulk density, porosity, pore-throat radius, horizontal and vertical permeability, as well as water and oil saturation values, which are available in Supplementary Table S1.
3.1 Density and porosity measurements
Density and porosity measurements were conducted using the helium gas expansion porosimeter technique, which operates based on Boyle’s Law, and the mercury injection method, utilizing a positive displacement mercury pump (e.g., Pittman, 1992). Corex Services Limited used a double cell helium expansion gas porosimeter to measure the porosity and grain density of the samples. The porosimeter functions by first filling a sealed reference chamber with helium gas at room temperature to a pressure of 100 psi. The sample is placed in a separate sealed chamber connected to the reference chamber via a two-way valve. When the valve is opened, the helium expands into the combined volume of both chambers. By applying Boyle’s Law, the volume of the sample chamber can be determined using the known values of the reference chamber volume, initial pressure, and final pressure after expansion. Before analyzing samples, the instrument was calibrated by running a series of stainless steel blanks to generate a calibration curve of blank volume versus the inverse of the final pressure. This data was processed using a computer program that applied linear regression to establish an equation for calculating grain volume. Once the grain volume was determined, porosity and grain density were calculated using the bulk volume and weight of each sample. The porosity was calculated by using the following equations;
Where
3.2 Pore throat determination
The mercury injection method can be used to measure the displacement pressure required to establish a connected hydrocarbon filament within pore throats. The bulk volume of each core plug sample was determined with a positive displacement mercury pump, which consisted of a stainless steel high-pressure pycnometer serving as the sample receptacle. This pycnometer was connected to a volumetric pump cylinder. As the handwheel attached to the pump was rotated, mercury was either injected into or withdrawn from the sample chamber. A digital transducer connected to the pump recorded the displaced mercury volume, providing precise bulk volume measurements. In practice, mercury was first introduced into the sealed, empty pycnometer up to a predefined reference point, and the transducer was zeroed. This process was repeated multiple times to ensure accuracy. The mercury was then withdrawn, and the core sample was placed inside and sealed within the pycnometer. Mercury was reintroduced to the same reference point, and the transducer reading was recorded. This value was then converted into the actual bulk volume of the sample using a correction factor derived from calibration volumes. To maintain accuracy, the mercury was cleaned, and the pump was recalibrated after every four samples, depending on the sample type.
To estimate pore-throat parameters from routine core analysis, an empirical equation was developed (Kolodzie, 1980). This equation establishes a relationship between porosity, permeability, and pore-throat size corresponding to a mercury saturation level of 35% (R35), showing the strongest correlation (highest R-value). Furthermore, R35 was found to be useful in delineating commercial hydrocarbon accumulations, particularly in stratigraphic traps.
Where
3.3 Permeability measurement
Permeability measurements were conducted using a Nitrogen Permeameter, following standard procedures (e.g., Tiab and Donaldson, 2016). Clean, dry core samples were placed in a Hassler-type core holder, designed to accommodate samples with a one-inch diameter and up to two inches in length. An overburden pressure of 400 psig was applied to the cell, compressing the rubber sleeve around the circumference of the sample to simulate in situ conditions and prevent gas bypass. Nitrogen gas pressure was then applied to one end of the sample, while the opposite end remained open to atmospheric pressure, creating a pressure gradient that induced gas flow through the sample. The gas flow rate was measured at the low-pressure (downstream) end by directing the gas through one of four calibrated laminar flow orifices and recording the differential pressure across the orifice. The core sample’s length was measured using calipers, and its bulk volume was determined by mercury displacement. These parameters, along with the upstream and downstream pressures, gas flow rate, nitrogen viscosity, barometric pressure, and temperature, were input into Darcy’s equation to calculate gas permeability (in millidarcies, mD).
Where
3.4 Saturation measurement
The Dean Stark method was used for determining fluid saturations in core plugs, which involves the distillation of water from the sample, with being condensed and collected in a calibrated receiver (Dandekar. 2013). The oil is extracted using a solvent with a boiling point higher than that of water. This allows the water to evaporate as the solvent vapor heats up, while the solvent vapor continuously drips on the core sample, facilitating oil extraction. Once the water and oil have been fully removed, the core sample is dried and weighed. The difference in weight represents the combined weight of the extracted oil and water. To isolate the weight of the oil, the amount of water collected in the receiver is subtracted from the total liquid weight. To calculate the water and oil contents as a percentage of the pore space, measurements of porosity, bulk volume, and the specific gravity of the extracted oil are taken (Dandekar, 2013). This method allows for accurate determination of fluid saturations, which is essential for understanding reservoir characteristics and optimizing fluid extraction processes.
4 Data description
This study presents values of grain density, bulk density, porosity, pore-throat radius, horizontal permeability, vertical permeability, oil saturation, and water saturation (Figure 2), evaluated based on measurements using core samples from wells 112–82 and BB4. The complete dataset is provided in Supplementary Table S1. These petrophysical properties are analyzed in the following subsections to assess their variability and implications for reservoir quality.
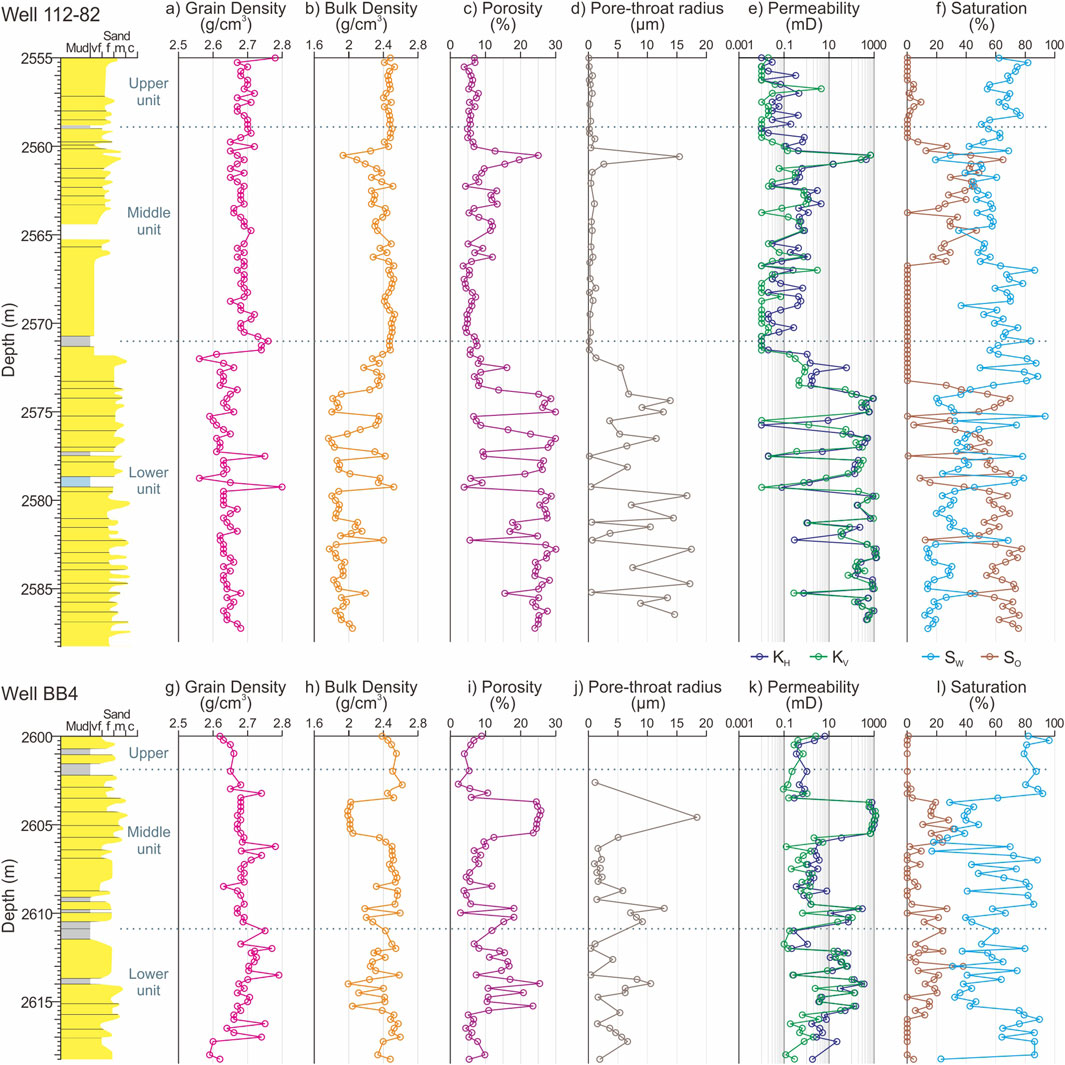
Figure 2. Petrophysical properties of the middle Miocene sequence (Sidri Member) in wells 112–82 and BB4; grain and bulk density, porosity, pore-throat radius, horizontal and vertical permeability, oil and water saturation of sandstones (modified from Lee et al., 2025). (A) Grain density (g/cm3). (B) Bulk density (g/cm3). (C) Porosity (%). (D) Pore-throat radius (μm). (E) Permeability (mD). (F) Saturation (%). (G) Grain density (g/cm3). (H) Bulk density (g/cm3). (I) Porosity (%). (J) Pore-throat radius (μm). (K) Permeability (mD). (L) Saturation (%).
4.1 Grain and bulk density
Grain density in well 112–82 averages approximately 2.67 g/cm3, ranging from 2.56 to 2.8 g/cm3 (Figure 2A), while, in well BB4, it averages around 2.69 g/cm3 with a range of 2.59 g/cm3 to 2.79 g/cm3 (Figure 2G). These values are close to the density of quartz (2.65 g/cm3), reflecting major mineral component. Minor variations are affected by the presence of feldspar, lithic fragments, and cementation by carbonates and clays. The higher grain density observed in the upper section of well 112–82 reflects increased cementation (Lee et al., 2025).
Bulk density varies from 1.83 g/cm3 to 2.59 g/cm3 (2.3 g/cm3 on average) in well 112–82 (Figure 2B) and from 1.99 g/cm3 to 2.59 g/cm3 (2.38 g/cm3 on average) in well BB4 (Figure 2H). Bulk density shows an inverse correlation with porosity (Figures 2C,I), indicating that intervals with lower bulk density exhibit higher porosity.
4.2 Porosity and pore-throat radius
In well 112–82, porosity values range from 3.6% to 30% with an average approximately 13.8% (Figure 2C). The lower sandstone unit exhibits the higher porosity with an average of ∼19.5%, while the middle and upper sandstone units display lower porosity with an average of ∼7.6%. The porosity in the lower unit aligns with typical sandstone properties at comparable burial depths (e.g., Lee et al., 2020), whereas the reduced porosity in the middle and upper units is attributed to extensive cementation. Particularly, carbonate minerals, such as calcite and dolomite, precipitated within pores and pore throats, significantly influencing porosity variations (e.g., Lee et al., 2021a). In well BB4, porosity values generally trend lower, ranging from 3.8% to 25.5%, with an average of 11.5%, and distributing mostly below 10% with sporadic peaks (Figure 2I). In both wells, intervals with higher porosity are evaluated as good to excellent reservoir quality (Lee et al., 2025). A lateral difference in porosity correlates with increasing shale content (e.g., El-Kadi et al., 2016; Mohaned et al., 2023).
Pore-throat radius in well 112–82 ranges from 0.05 μm to 17.34 μm, with an average of 4.3 μm (Figure 2D). The lower sandstone unit shows a wide range of pore-throat size, corresponding to variations in porosity. Larger pore-throat radii in this unit suggest better connectivity between pores, enhancing fluid flow and reservoir quality. In well BB4, the pore-throat radius varies from 0.4 μm to 18.3 μm, averaging 4.2 μm (Figure 2J).
4.3 Horizontal and vertical permeability
In well 112–82, horizontal permeability varies widely from <0.01 to 1,309 mD, with an average of 167.7 mD, reflecting substantial heterogeneity in pore structure and connectivity (Figure 2E). The units show significant difference; the lower unit exhibiting higher values from <0.01 to 1,309 mD (321 mD on average) suggesting well-developed pore networks and higher reservoir quality, while the middle and upper units having much lower permeability mostly from <0.01 to 4.5 mD, with occasional peaks up to 695 mD, likely due to extensive cementation reducing pore connectivity. Vertical permeability in well 112–82 follows a similar pattern, ranging from <0.01 to 1,288 mD, with an average of 154.3 mD. In well BB4, horizontal permeability ranges from 0.2 to 1,197 mD, averaging 145 mD (Figure 2K). An interval in the middle unit shows high permeability values up to 1,197 mD, corresponding to a high-porosity zone (Figure 2I). Vertical permeability in well BB4 varies from 0.1 to 1,158 mD with an average of 127 mD. In both wells, horizontal permeability is generally higher than vertical permeability, likely due to grain alignment, preferred orientation of pore spaces, and bedding plane development during sand deposition, which enhances lateral fluid flow and migration potential (Shedid, 2019).
4.4 Oil and water saturation
In well 112–82, oil saturation ranges from 0% to 77.6%, with an average of 29.7% (Figure 2F). Two distinct high-saturation intervals are observed; reaching up to 64.8% at 2559.75–2566.5 m and up to 77.6% at 2573.5–2587.25 m. In well BB4, oil saturation varies between 0% and 38%, averaging 9.1% (Figure 2L). Notable oil-rich zones are noted at 2603.5–2606.5 m and at 2609.5–2615.75 m. The zones with elevated oil saturation closely correspond to intervals of lower bulk density, higher porosity, and increased permeability, indicating good to excellent reservoir quality. The difference in oil saturation between the wells likely reflects their structural settings: well 112–82 lies within a major anticline, while well BB4 is on a tilted fault block (Lee et al., 2025). Water saturation values show an inverse relationship with oil saturation; water saturation ranging from 12% to 93.6% in well 112–82 and from 16.8% to 96.3% in well BB4 (Figures 2F,L).
5 Conclusion
This study analyzed the petrophysical properties of the middle Miocene sandstone (Sidri Member) using core samples from wells 112–82 and BB4 in the Belayim oil field, central Gulf of Suez. Various analytical techniques were employed, including helium gas expansion porosimeter for density and porosity, mercury injection for pore throat radius, nitrogen permeameter for permeability, and the Dean Stark method for saturation. Generally in both wells, grain density varies but averages around 2.7 g/cm3, and bulk density ranges from 1.8 to 2.6 g/cm3. Porosity spans 3.6%–30% in well 112–82 and 2.2%–25.8% in well BB4. Pore-throat radii range from 0.05 to 17.3 μm and from 0.4 to 18.3 μm, respectively. Horizontal permeability displays a broad range, from <0.01 to 1,309 md in well 112–82 and from 0.01 to 1,197 md in well BB4, with vertical permeability reaching <0.01 to 1,288 md and 0.01 to 1,159 md, respectively. Higher horizontal permeability is likely attributed to grain alignment and bedding plane orientation. Oil saturation exhibits high values in certain intervals, reaching up to 77.6% in well 112–82 and up to 38% in well BB4, which has an inverse correlation to water saturation. The observed petrophysical variability reflects the complex interplay of depositional environments, tectonic setting, and diagenetic processes, which contributed to the good to excellent reservoir quality. These findings hold strong potential to enhance our understanding of the Sidri Member and its evolution in the syn-to post-rift phases of the Gulf of Suez. Integrated petrophysical data reveal critical insights into reservoir quality and heterogeneity, which delineate high-quality reservoir zones and show how lithological and structural variations control fluid flow and hydrocarbon distribution. This knowledge is key for improving reservoir modeling, well placement, and recovery strategies, while also shedding light on broader geodynamic processes in this economically significant syn-rift basin.
Data availability statement
The original contributions presented in the study are included in the article/Supplementary Material, further inquiries can be directed to the corresponding author.
Author contributions
DF: Conceptualization, Data curation, Formal Analysis, Funding acquisition, Investigation, Methodology, Project administration, Resources, Supervision, Validation, Writing – review and editing, Writing – original draft. EL: Data curation, Formal Analysis, Investigation, Software, Validation, Visualization, Writing – original draft, Writing – review and editing. XX: Software, Visualization, Writing – review and editing. EF: Writing – review and editing. MS: Validation, Writing – review and editing.
Funding
The author(s) declare that financial support was received for the research and/or publication of this article. This research was supported by United Arab Emirates University research fund (No. 12S218). APC was supported by the University of Vienna.
Acknowledgments
We would like to acknowledge the valuable support by the Petrobel Service Company in Egypt with core sample preparation and petrophysical measurements.
Conflict of interest
The authors declare that the research was conducted in the absence of any commercial or financial relationships that could be construed as a potential conflict of interest.
Generative AI statement
The author(s) declare that no Generative AI was used in the creation of this manuscript.
Publisher’s note
All claims expressed in this article are solely those of the authors and do not necessarily represent those of their affiliated organizations, or those of the publisher, the editors and the reviewers. Any product that may be evaluated in this article, or claim that may be made by its manufacturer, is not guaranteed or endorsed by the publisher.
Supplementary material
The Supplementary Material for this article can be found online at: https://www.frontiersin.org/articles/10.3389/feart.2025.1592041/full#supplementary-material
References
Abd El Rahman, I., Mohamed, R., Salah, A., and Fathy, D. (2012). Reservoir characterization of Sidri member in Belayim land oil field, Gulf of Suez, Egypt. El-Minia Sci. Bull. 23, 1–16.
Abudeif, A. M., Attia, M. M., and Radwan, A. E. (2016). Petrophysical and petrographic evaluation of Sidri member of Belayim Formation, badri field, Gulf of Suez, Egypt. J. African Earth Sci. 115, 108–120. doi:10.1016/j.jafrearsci.2015.11.028
Abuhagaza, A. A., Kassab, M. A., Wanas, H. A., and Teama, M. A. (2021). Reservoir quality and rock type zonation for the Sidri and feiran members of the Belayim Formation, in Belayim land oil field, Gulf of Suez, Egypt. J. African Earth Sci. 181, 104242. doi:10.1016/j.jafrearsci.2021.104242
Al-Husseini, M. I. (2012). Late oligocene–early Miocene Nukhul sequence, Gulf of Suez and Red Sea. GeoArabia 17, 17–44. doi:10.2113/geoarabia170117
Alsharhan, A. S. (2003). Petroleum geology and potential hydrocarbon plays in the Gulf of Suez rift basin, Egypt. AAPG Bull. 87, 143–180. doi:10.1306/062002870143
Attia, M. M., Abudeif, A. M., and Radwan, A. E. (2015). Petrophysical analysis and hydrocarbon potentialities of the untested middle Miocene Sidri and baba sandstone of Belayim Formation, badri field, Gulf of Suez, Egypt. J. African Earth Sci. 109, 120–130. doi:10.1016/j.jafrearsci.2015.05.020
Ayyad, H. M., Hewaidy, A. G. A., Omar, M., and Fathy, M. (2023). Sequence stratigraphy and reservoir quality of the Gulf of Suez syn-rift deposits of the Nukhul formation: implications of rift initiation and the impact of eustacy and tectonic on deposition. Mar. Petroleum Geol. 156, 106459. doi:10.1016/j.marpetgeo.2023.106459
Bosworth, W., Crevello, P., Winn Jr, R. D., and Steinmetz, J. (1998). “Structure, sedimentological and basin dynamic during rifting of the Gulf of Suez and northwestern Red sea,” in Sedimentation and tectonics of rift basins: red Sea - Gulf of aden. Editors B. H. Purser, and D. Bosence (Springer Netherlands), 77–96. doi:10.1007/978-94-011-4930-3_6
Bosworth, W., and McClay, K. (2001). “Structural and stratigraphic evolution of the Gulf of Suez rift, Egypt: a synthesis,” in Peri-Tethys Memoir 6: peri-Tethyan rift/wrench basins and passive margins. Editors P. A. Ziegler, W. Cavazza, and A. H. F. S. Robertson (Paris: Museum National d’Histoire naturelle), 186, 567–606.
Dandekar, A. Y. (2013). Petroleum reservoir rock and fluid properties. 2nd Edition. Boca Raton: CRC Press.
El-Azabi, M. H. (2024). Sedimentary evolution of the Miocene syn-rift marginal and deeper marine facies in the Gulf of Suez rift basin, Egypt: a review. Earth-Science Rev. 258, 104944. doi:10.1016/j.earscirev.2024.104944
El Kadi, H. H., Salah, A. S., and Abdel Wahid, M. M. (2016). Integrated evaluation of the main petrophysical parameters for Sidri member, Belayim land oil field, sinai, Egypt using log and core data. Int. J. Innovative Sci. Eng. and Technol. 3, 255–273.
El-Khadragy, A. A., Eysa, E. A., Khedr, F. I., and Saleh, A. H. (2016). Reservoir characteristics of Belayim Formation in Belayim land oil field, southwest sinai, Egypt, using core and well logging analysis. Int. J. Sci. Eng. Appl. Sci. 2, 435–450.
El-Naby, A. A., El-Aal, M. A., Kuss, J., Boukhary, M., and Lashin, A. (2009). Structural and basin evolution in Miocene time, southwestern Gulf of Suez, Egypt. Neues Jahrb. für Geol. Paläontologie - Abh. 251, 331–353. doi:10.1127/0077-7749/2009/0251-0331
El-Naby, A. I. M., Ghanem, H., Boukhary, M., El-Aal, M., Lüning, S., and Kuss, J. (2010). Sequence-stratigraphic interpretation of structurally controlled deposition: middle Miocene Kareem formation, southwestern Gulf of Suez, Egypt. GeoArabia 15, 129–150. doi:10.2113/geoarabia1503129
Evans, A. L. (1988). Neogene tectonic and stratigraphic events in the Gulf of Suez rift area, Egypt. Tectonophysics 153, 235–247. doi:10.1016/0040-1951(88)90018-2
Falcon-Suarez, I. H., Mangriotis, M.-D., Papageorgiou, G., and Mondol, N. H. (2024). Impact of fluid distribution and petrophysics on geophysical signatures of CO2 storage sandstone reservoirs. J. Geophys. Res. Solid Earth 129 (5), e2024JB029027. doi:10.1029/2024JB029027
Fathy, D. (2012). “Petroleum reservoir properties and formational evaluation for Sidri member, Belayim Formation, Belayim land oil field, Sinai, Egypt,”. M.Sc. Dissertation (Minia, Egypt: Minia University).
Henaish, A., El Shinawi, A., and Awad, M. (2023). Internal architecture and structural evolution of a horst relay zone from the northern Gulf of Suez rift, Egypt: implications for syn-rift sedimentation. Mar. Petroleum Geol. 150, 106170. doi:10.1016/j.marpetgeo.2023.106170
Kolodzie, S. (1980). “Analysis of pore throat size and use of the waxman-smits equation to determine OOIP in spindle field, Colorado,” in SPE annual technical conference and exhibition, Dallas, 21-24 September 1980, SPE 9382. doi:10.2118/9382-MS
Lee, E. Y., Fathy, D., Xiang, X., Spahić, D., Ahmed, M. S., Fathi, E., et al. (2025). Middle Miocene syn-rift sequence on the central Gulf of Suez, Egypt: depositional environment, diagenesis, and their roles in reservoir quality. Mar. Petroleum Geol. 174, 107305. doi:10.1016/j.marpetgeo.2025.107305
Lee, E. Y., Kominz, M., Reuning, L., Gallagher, S. J., Takayanagi, H., Ishiwa, T., et al. (2021a). Quantitative compaction trends of Miocene to Holocene carbonates off the west coast of Australia. Aust. J. Earth Sci. 68 (8), 1149–1161. doi:10.1080/08120099.2021.1915867
Lee, E. Y., Novotny, J., and Wagreich, M. (2020). Compaction trend estimation and applications to sedimentary basin reconstruction (BasinVis 2.0). Appl. Comput. Geosciences 5, 100015. doi:10.1016/j.acags.2019.100015
Lee, E. Y., Tejada, M. L. G., Song, I., Chun, S. S., Gier, S., Riquier, L., et al. (2021b). Petrophysical property modifications by alteration in a volcanic sequence at IODP site U1513, naturaliste plateau. J. Geophys. Res. Solid Earth 126 (10), e2020JB021061. doi:10.1029/2020JB021061
McClay, K. R., Nichols, G. J., Khalil, S. M., Darwish, M., and Bosworth, W. (1998). “Extensional tectonics and sedimentation, eastern Gulf of Suez, Egypt,” in Sedimentation and tectonics of rift basins: red Sea-Gulf of aden. Editors B. H. Purser, and D. Bosence (Springer Netherlands), 223–238. doi:10.1007/978-94-011-4930-3_14
Mohamed, A. S., Omran, A. A., Mohamed, M. T., and Nabawy, B. S. (2023). Petrophysical analysis and hydrocarbon potential of the matulla formation in the muzhil field, central part of the Gulf of Suez, Egypt. Min. Mineral Deposits 17 (2), 121–139. doi:10.33271/mining17.02.121
Moustafa, A. R., and Khalil, S. M. (2020). “Structural setting and tectonic evolution of the Gulf of Suez, NW Red Sea and Gulf of aqaba rift systems,” in The geology of Egypt. Editors Z. Hamimi, A. El-Barkooky, J. M. Frías, H. Fritz, and Y. A. El-Rahman (Cham: Springer), 295–342. doi:10.1007/978-3-030-15265-9_8
Nabawy, B. S., and Barakat, M. K. (2017). Formation evaluation using conventional and special core analyses: Belayim Formation as a case study, Gulf of Suez, Egypt. Arabian J. Geoscience 10, 25. doi:10.1007/s12517-016-2796-9
Pan, H., Xie, H., Zhao, Z., Liu, J., Jiang, G., Li, R., et al. (2025). Quaternary gas hydrate dissociation promotes the formation of shenhu canyon Group in the South China sea. Front. Mar. Sci. 12. doi:10.3389/fmars.2025.1530207
Pittman, E. D. (1992). Relationship of porosity and permeability to various parameters derived from mercury injection-capillary pressure curves for sandstone. AAPG Bull. 76, 191–198. doi:10.1306/BDFF87A4-1718-11D7-8645000102C1865D
Radwan, A. E. (2021). Modeling the depositional environment of the sandstone reservoir in the middle Miocene Sidri member, badri field, Gulf of Suez basin, Egypt: integration of gamma-ray log patterns and petrographic characteristics of lithology. Nat. Resour. Res. 30, 431–449. doi:10.1007/s11053-020-09757-6
Ramadan, F. S., and Eysa, E. A. (2012). Diagenesis and petrophysical properties of the middle Miocene (Belayim Formation) at Belayim land oil field, West Sinai, Egypt. Aust. J. Basic Appl. Sci. 6 (6), 309–322.
Rizk, R. (1992). “Sedimentology and reservoir characteristics of Sidri member, Belayim land oil field, Gulf of Suez,” in The 11th petroleum exploration and production conference.
Sallam, E. S., Afife, M. M., Fares, M., van Loon, A. J., and Ruban, D. A. (2019). Depositional cycles of the lower Miocene Rudeis formation (southwestern offshore margin of the Gulf of Suez, Egypt): implications for reservoir evaluation. Mar. Geol. 415, 105964. doi:10.1016/j.margeo.2019.105964
Segev, A., Avni, Y., Shahar, J., and Wald, R. (2017). Late Oligocene and Miocene different seaways to the Red Sea–Gulf of Suez rift and the Gulf of aqaba–dead sea basins. Earth-Science Rev. 171, 196–219. doi:10.1016/j.earscirev.2017.05.004
Shedid, A. S. (2019). Vertical-horizontal permeability correlations using coring data. Egypt. J. Petroleum 28 (1), 97–101. doi:10.1016/j.ejpe.2018.12.007
Sobhy, H., and Moustafa, A. R. (2024). Impact of structural geometry of tilted fault blocks on hydrocarbon entrapment and deposition of syn-rift clastic reservoirs: Belayim Marine field (Gulf of Suez rift). Mar. Petroleum Geol. 160, 106631. doi:10.1016/j.marpetgeo.2023.106631
Spahić, D., Lee, E. Y., Šajnović, A., and Stepić, R. (2024). Opening and post-rift evolution of alpine tethys passive margins: insights from 1D numerical modeling of the jurassic mikulov formation in the Vienna basin region, Austria. Geosciences 14, 202. doi:10.3390/geosciences14080202
Tiab, D., and Donaldson, E. C. (2016). Petrophysics: theory and practice of measuring reservoir rock and fluid transport properties. 4th Edition. Houston, TX: Gulf Professional Publishing. doi:10.1016/C2014-0-03707-0
Keywords: sandstone, syn-rift, porosity, pore-throat size, density, permeability, saturation, oil reservoir evaluation
Citation: Fathy D, Lee EY, Xiang X, Fathi E and Sami M (2025) Petrophysical properties of the middle Miocene sediments on the central Gulf of Suez, Egypt. Front. Earth Sci. 13:1592041. doi: 10.3389/feart.2025.1592041
Received: 12 March 2025; Accepted: 28 April 2025;
Published: 15 May 2025.
Edited by:
Vasyl Lozynskyi, Dnipro University of Technology, UkraineReviewed by:
Pavlo Saik, Guangdong University of Petrochemical Technology, ChinaCong Hu, Ocean University of China, China
Huan Li, Yangtze University, China
Copyright © 2025 Fathy, Lee, Xiang, Fathi and Sami. This is an open-access article distributed under the terms of the Creative Commons Attribution License (CC BY). The use, distribution or reproduction in other forums is permitted, provided the original author(s) and the copyright owner(s) are credited and that the original publication in this journal is cited, in accordance with accepted academic practice. No use, distribution or reproduction is permitted which does not comply with these terms.
*Correspondence: Eun Young Lee, ZXVuLmxlZUB1bml2aWUuYWMuYXQ=Mabrouk Sami, bWFicm91a3NhbWlAdWFldS5hYy5hZQ==