 Hangtao Yu
 Mingming Wen1,2,3*
 Chuang Xu
- 1Guangzhou Marine Geological Survey, China Geological Survey, Guangzhou, China
- 2Key Laboratory of Marine Mineral Resources, Ministry of Natural Resources, Guangzhou Marine Geological Survey, China Geological Survey, Guangzhou, China
- 3National Engineering Research Center for Gas Hydrate Exploration and Development, Guangzhou, China
- 4School of Civil and Transportation Engineering, Guangdong University of Technology, Guangzhou, China
Taiwan is located at the junction between the Philippine Sea Plate and the Eurasian Plate, with intense tectonic movements in the region. A more accurate Moho topography model is significant for the study of the intrinsic genesis within Taiwan’s orogenic movement and the subduction pattern of the Philippine Sea plate. Previously, there were two key issues in Moho topographic inversion that needed to be solved, i.e., extracting signals originating from Moho topography and estimating more accurate inversion parameters. To solve these two issues, we use wavelet multi-scale analysis to separate the gravity signals at different depths and extract the signals originating from Moho topography from them. Then, more accurate inversion parameters are estimated using simulated annealing with available seismic data as constraints. On this basis, a more refined Moho topography of Taiwan is inverted. The Moho topography shows that most of Taiwan has a Moho topography of about 28 km, with the highest point slightly above 30 km and the lowest point between 20 and 25 km. Based on the Moho topography contours, we estimate that subduction of the Philippine Sea plate ends at the 25 km contour, in the middle of the Coastal Range, near 23.5°N. This is one of the possible reasons for the high frequency of earthquakes in the region. Comparing with the existing seismic control points, the corresponding root-mean-square error of our Moho model is 4.98 km smaller than the CRUST 1.0 model, which indicates that our Moho model is more accurate and realistic.
1 Introduction
Taiwan (TW) is located at the junction between the Eurasian Plate (EP) and the Philippine Sea Plate (PSP), formed by the collision and extrusion of the Luzon Island Arc with the Eurasian continental margin (Teng, 1990; 1996; Huang MH. et al., 2006). TW and its surrounding seas are tectonically active, where plate collisions are still in progress (Teng, 1990; Kao et al., 1998; Bos et al., 2003). This unique ‘arc-land collision’ is associated with two different directions of subduction, one in the eastern part of the TW and one in the southwestern part of the TW (Hsu, 1990; Rau and Wu, 1995; Ching et al., 2011). Among them, in the eastern part of the TW, the PSP subducts north-westward under the EP along the Ryukyu Trench, with a motion rate of 81.5 mm/yr (Yu et al., 1997; 1999). In the southwestern part of the TW, the EP subducts southeastward along the Manila Trench under the PSP (Yi-Ben, 1986; Pezzopane and Wesnousky, 1989). Plate activity has led to frequent earthquakes in TW. In the last decade, as many as 206 earthquakes of magnitude five or higher have occurred in TW. The mutual subduction between the PSP and the EP forms the unique orogenic belt in the TW, which also influences the Moho topography. Therefore, an accurate Moho topography model is the key to unravelling the unique plate motions of the TW, and is also significant for the study of orogeny.
Previously, several authors have used seismic methods to study the Moho topography of TW (Cheng et al., 1996; Wang et al., 2010a; 2010b; Hsu et al., 2011; Ustaszewski et al., 2012; Li et al., 2014; Van Avendonk et al., 2014; Goyal and Hung, 2021; Shih et al., 2023). Cheng et al. (1996) used a two-dimensional ray-tracing method to study the velocity structure in the eastern and northeastern parts of TW and inferred that the Moho topography in the eastern waters of TW is around 25 km. By analysing the teleseismic waveform data, Wang et al. (2010a) proposed two Moho topography models of TW, and the results showed that there is a significant crustal thickening in the central part of TW. Based on the results from 27 broadband stations, Wang et al. (2010b) estimated the average Moho depth of TW to be 30 km. Hsu et al. (2011) used the PmP-phase travelling time to study the Moho topography of TW, and deduced that the Moho depth distribution of TW is consistent with the topography, showing a NNE-SSW trend. Ustaszewski et al. (2012) used local earthquake tomography to map the Moho topography of TW and hypothesised that the PSP subducts in SE Taiwan. Based on earthquake and active source seismic data, van Avendonk et al. (2014) inverted the velocity structure across the central part of the TW. The results show that the Moho topography of Coastal Plain is around 35 km. Based on four multi-channel seismic profiles, Eakin et al. (2015) calculated that the Moho topography in the Huatung Basin (sea basin in the southwest of TW) is around 14 km. Goyal and Hung (2021) calculated the Moho topography of TW using the H-V stacking method, and suggested that the crustal thickening in central TW is due to its weak crust. Shih et al. (2023) identified Moho refracted P waves from seismic data recorded by a dense seismic array (Formosa Array) in northern Taiwan, and showed that beneath TW, strong Moho variations extend along the direction NE-SW. Although seismic methods have a wide range of applications in studying Moho topography of TW, there are still some drawbacks. Such as, due to the insufficiently dense distribution of seismic stations, it does not have an advantage in calculating Moho topography at large scales.
Accompanied by the development of satellite exploration technology, satellite gravity has covered the globe with high spatial resolution and accuracy. Therefore, compared with seismic methods, gravity methods can better invert the large-scale Moho topography. Based on the EGM2008 model, Xuan et al. (2020) inverted the Moho topography of the East China Sea and its adjacent areas. Among them, the Moho depth of TW is between 30 and 35 km. Li et al. (2022) inverted the Moho topography of the South China Sea and its surroundings using the improved Bott method, and the results showed that the Moho topography of TW is generally higher than 30 km. These results proved that the gravity method is reliable in inverting the Moho topography of TW.
The Parker-Oldenburg method, as a classical gravity method for Moho topographic inversion, has been applied many times before (Zhao et al., 2020; Xuan et al., 2020; Rao et al., 2023; Yu et al., 2024). However, the accuracy of the inverted Moho topography is not high due to the unreliable inversion parameters. To solve this problem, Yu et al. (2024) proposed an improved Parker-Oldenburg method, i.e., using the existing seismic data as constraints and applying simulated annealing to estimate more accurate inversion parameters, then inverted the Moho topography in the northern part of the South China Sea. Therefore, based on the existing seismic and gravity data, this paper adopted this improved Parker-Oldenburg method to invert the finer Moho topography of TW. Based on this Moho topography model, the tectonic features of TW are further revealed.
2 Study area and data
The study area of this paper is TW and its surrounding seas, located between 21.5°N and 25.5°N and 119.5°E and 122.5°E. As the junction between the EP and the PSP, active geological movements have formed the complex tectonic features of TW, and Figure 1 illustrates its topographic distribution and major tectonic elements. From west to east, the orogeny divided Taiwan into Coastal Plain (CP), Western Foothills (WF), Hsuehshan Range (HR), Backbone Range (BR), Eastern Central Range (ECR), Coastal Range (CR). From TW to PSP, the topographic height ranges from the highest at 3,608.7 m to the lowest at −5609 m. The undulation of the topography can illustrate the intensity of the orogenic movement. In addition, there are two trenches, Ryukyu Trench (RT) and Manila Trench (MT), in the surrounding sea due to plate interaction.
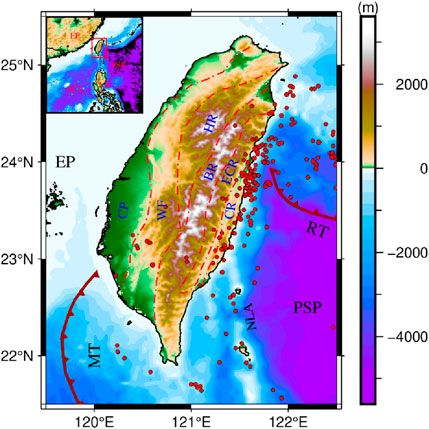
Figure 1. The topography and primary tectonic elements of Taiwan. The solid dark red line is the Trench, the red dotted line is the boundary line of the tectonic block. CP, Coastal Plain; WF, Western Foothills; HR, Hsuehshan Range; BR, Backbone Range; ECR, Eastern Central Range; CR, Coastal Range; NLA, North Luzon Arc; RT, Ryukyu Trench; MT, Manila Trench; PSP, Phillippine Sea Plate; EP, Eurasian Plate; SCS, South China Sea; LZ, Luzon Island Arc. Red dots represent earthquakes of magnitude five or higher (The data site is https://www.usgs.gov/programs/earthquake-hazards).
The data used in this paper contain mainly topography, gravity field model, sediment thickness, and seismic station data (collected from earthquake observing stations). Of these, the topography is from the ETOPO1 model by Amante and Eakins (2009) (Figure 1), which has a spatial resolution of 1′× 1′. The gravity field model is the XGM 2019e_2159 model published by Zingerle et al. (2020) (http://icgem.gfz-potsdam.de/tom_longtime), which has a spatial resolution of 2′× 2′. Based on the ETOPO1 model and the XGM 2019e_2159 model, we solved the Bouguer gravity anomaly in the study area using the computational services provided by ICGEM (Barthelmes, 2009) (solved height of 0 km and spatial resolution of 1′× 1′), as shown in Figure 2a. The sediment thickness was adopted from the Globsed-v3 model from Straume et al. (2019), which has a spatial resolution of 5′× 5′, as shown in Figure 2b. Based on the Globsed-v3 model, we calculated the gravity effects corresponding to the sediment using Parker’s method (Parker, 1973), as shown in Figure 2c. Next, the gravity effects are resampled to a spatial resolution of 1′× 1′. Finally, the gravity effects corresponding to the sediment are subtracted from the Bouguer gravity anomalies to obtain Sediment-free gravity anomalies, as shown in Figure 2d. In addition, to prevent edge effects, the model used in this paper is extended by 2.5° in all directions (i.e., the range is 117°E to 125°E, 19°N to 28°N).
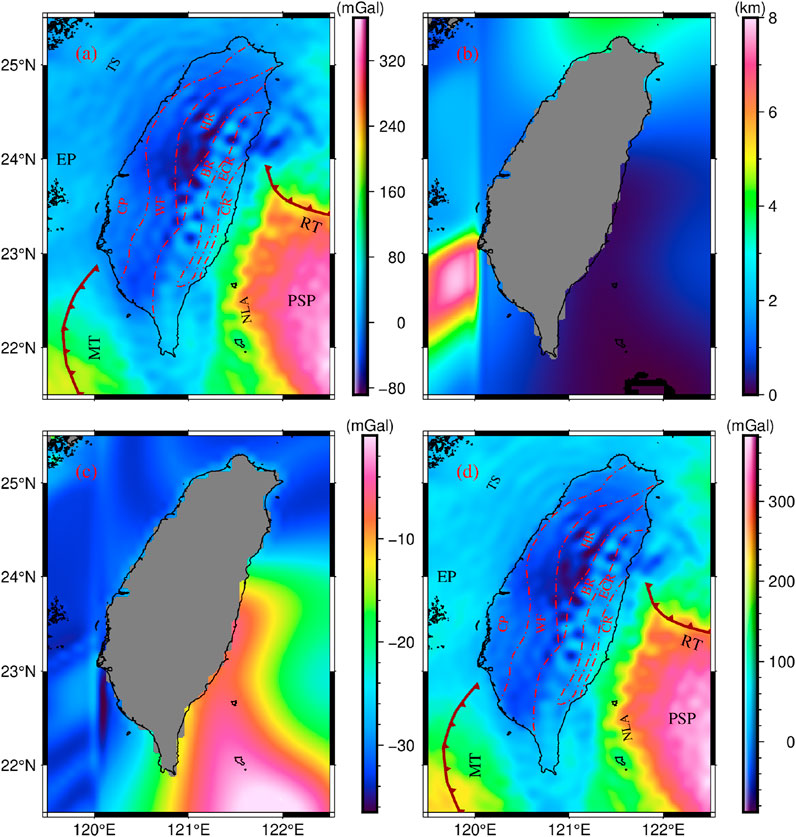
Figure 2. (a) Bouguer gravity anomaly. (b) Sediment thickness. (c) Gravity effects corresponding to sediment. (d) Sediment-free gravity anomalies.
Seismic data were collected from Wang et al. (2010a), Wang et al. (2010b) and Goyal and Hung, (2021), with a total of 40 seismic control points distributed throughout the TW (seismic control point are known seismic points used for constraints from earthquake observing stations, OBS, multichannel seismic data, etc.), as shown in Figure 3. The seismic data (longitude, latitude and Moho depth) used are shown in Table 1. Considering the estimation of optimal parameters and evaluation of the Moho topography model, we divided the seismic data into a test set (30 points, circles in Figure 3) and a validation set (10 points, triangles in Figure 3). The validation set is used to assess the accuracy of the Moho topography model in this paper and the CRUST 1.0 model, the test set is used to estimate the optimal inversion parameters, i.e., the average Moho depth and Moho density contrast.
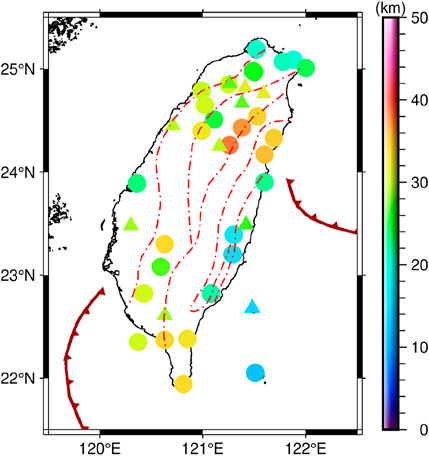
Figure 3. Seismic control points in the TW. Circles are test points for the estimation of hyperparameters. Triangles are validation points for estimating the accuracy of the Moho topography.
Table 1. Depth of seismic control points.
3 Methodology
Gravity anomalies are the combined signals of all the materials in the interior. In the previous section, we have already deducted the gravity effects from the sediment, but in order to extract the gravity signal corresponding to Moho topography, the gravity effects from the crust needs to be deducted as well. In this paper, the wavelet multi-scale analysis proposed by Mallat (1989) is used to separate the signals corresponding to different layers as shown in Equation 1.
Where,
Separating the wavelet details of different orders, the next step is to determine their corresponding average field source depths for later deducting the gravity effect due to the earth’s crust. Based on the radial power spectrum method proposed by Spector and Grant (1970), we estimate the average field source depths
where
Based on the average field source depth and the existing Moho topography model, we can extract the gravity signal
where
4 Results
4.1 Wavelet multi-scale analysis
Xu et al. (2017) had done experiments on signal separation under different wavelet basis and confirmed that coif3 as the optimal wavelet basis. Therefore, in this paper, coif3 is adopted as the wavelet basis, and Equation 1 is used to separate the sediment-free gravity anomalies (Figure 1d), which gives the eighth-order wavelet details, as shown in Figure 4. On this basis, the average field source depths corresponding to these wavelet details are estimated using Equation 2, and the results are shown in Table 2. Among them, the average field source depths of D1∼D8 are 2.5 km, 6.4 km, 12.8 km, 28.2 km, 52.0 km, 71.5 km, 91.0 km, and 119.8 km, respectively.
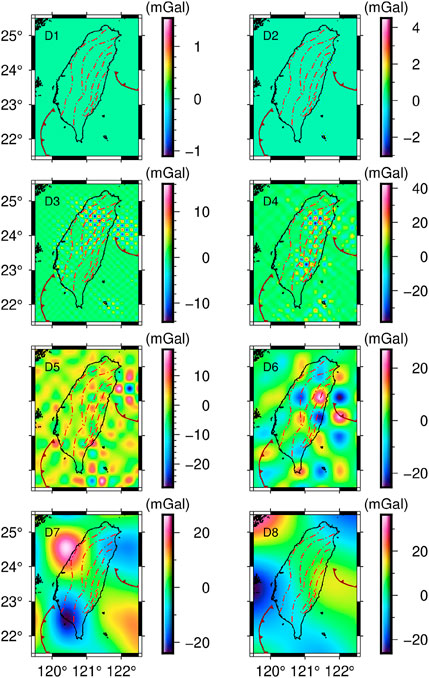
Figure 4. Decomposed gravity anomalies D1-D8 in TW.
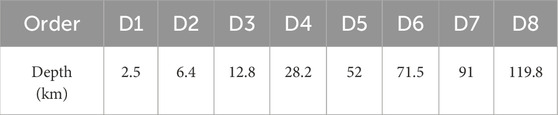
Table 2. The average field source depth corresponding to different orders of gravity signals.
In Figure 4, the gravity anomalies of D1 to D3 range from −14 mGal to 16 mGal, and the gravity anomalies do not vary drastically numerically, suggesting that the tectonic is stable in this depth region. Among them, the average field source depth of D3 is 12.8 km, and comparing with the CRUST 1.0 model (Laske et al., 2013), we assume that D1∼D3 are located in the crustal part of TW. The gravity anomalies of D4 are between −39 mGal and 41 mGal, with the most drastic changes in the gravity anomaly value, and the traces of tectonic movement are obvious, and we presume that D4 is near the Moho interface of TW. The gravity anomalies of D5 to D8 range from −22 mGal to 23 mGal, and although there are occasional ups and downs in the values, the variations are limited, suggesting that the tectonics is relatively stable, and combined with the corresponding field source depths, it is possible to judge that D5 to D8 are located in the mantle portion of the TW.
Therefore, in order to extract the gravity signal originating from Moho topography, in this paper, the first three orders of wavelet details D1∼D3 (gravity signal corresponding to the crustal part) are subtracted and the remaining signal (the third order wavelet approximation A3) is selected as the gravity signal for Moho topographic inversion, as shown in Figure 5.
Figure 5. The 3rd-order wavelet approximation A3 of the sediment-free gravity anomalies.
The gravity anomalies in Figure 5 range from −92 mGal to 341 mGal. The high gravity anomalies are predominantly distributed in the PSP, decreasing outwards with North Luzon Arc and Ryukyu Trench as the dividing line. The low gravity anomalies are mainly distributed in TW, and most of the regions have gravity anomalies lower than 0 mGal. The gravity anomalies in TW show two high sides and a low centre, with the lowest gravity anomalies in Hsuehshan Range close to −92 mGal. In addition, the gravity anomalies in TS and EP are around 100 mGal.
4.2 Inversion parameters
After obtaining the gravity signal from the Moho topography, two parameters need to be determined next, the average Moho depth and the Moho density contrast. With the constraints of the existing seismic test points (circles in Figure 3), we used the method proposed by Yu et al. (2024) to search for the average Moho depth and Moho density contrast, and the search tracks is shown in Figure 6. At the beginning, we set a search starting point of 15 km and 0.35 g/cm3 From this starting point, the search proceeds roughly in the direction of decreasing RMS (RMS of the difference between the inverted Moho topography model and the seismic test points). After 4813 searches, we searched for the optimal average Moho depth and Moho density contrast of 20.35 km and 0.438 g/cm3, respectively (position of the red star in Figure 6).
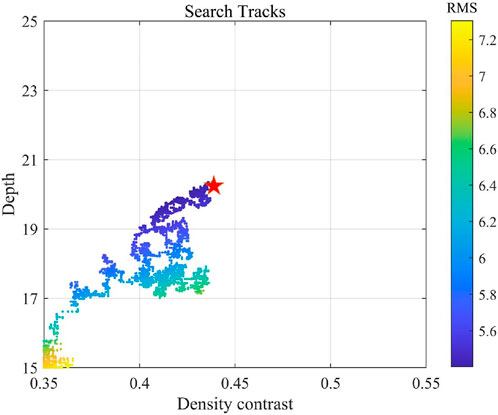
Figure 6. Search tracks of optimal parameters. Red star represent search results.
4.3 Moho topography in the TW
Based on the estimated optimal average Moho depth and Moho density contrast, we used Equation 3 to invert the Moho topography of TW, and the result is shown in Figure 7.
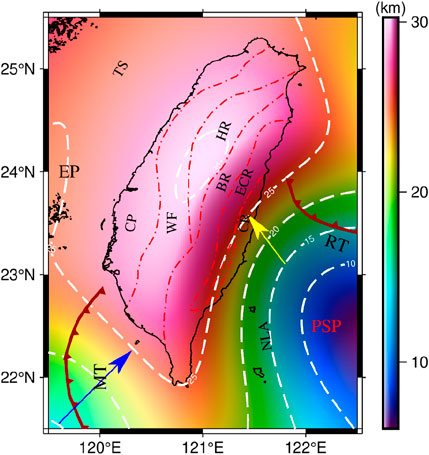
Figure 7. Moho topography of TW. The white dashed line is the contour. From the bottom right to the top left, the contours are 10 km, 15 km, 20 km, 25 km, and 30 km, respectively. The blue line represents subduction direction of the EP and the yellow line represents subduction direction of the PSP.
In Figure 7, the Moho topography in the study area is in the range of 6.1 km–30.3 km, with a more pronounced overall undulation. The Moho topography in the PSP is the shallowest, with an overall depth of less than 10 km. TW has the deepest Moho topography, with most depths near 28 km. Notably, the Moho topography of Ryukyu Trench and Manila Trench is distinctly undulating, with depths ranging from 15 km to 25 km. In addition, Taiwan Strait and EP have Moho topography around 25 km and North Luzon Arc has Moho topography around 18 km.
The TW can be divided into six main sections, from west to east, Coastal Plain, Western Foothills, Hsuehshan Range, Backbone Range, Eastern Central Range, and Coastal Range. Of these, the deepest area of Moho topography (the white dotted line in the TW) lies mostly in the Hsuehshan Range, with a small portion in the Western Foothills, and depths within the area are higher than 30 km. Simoes et al. (2007) suggested that there is significant crustal thickening in the Hsuehshan Range as a result of wedge basement intrusion, which is confirmed by our Moho topography. Goyal and Hung (2021) suggested that the average Moho topography of the Hsuehshan Range is 33 km, which is not the deepest area of the TW. Unlike the result of Goyal and Hung (2021), our Moho topography showed that the Hsuehshan Range, at a depth of about 30 km, is the deepest area of the TW.
The shallowest area of Moho topography in the TW is mainly the Coastal Range, which is divided by the white dashed line into two parts, northeast and southwest. Moho topography is slightly above 25 km in the northeast and between 20 km and 25 km in the southwest. Goyal and Hung (2021) have suggested that the crust of the Coastal Range thickened significantly to the north near 23.5°N. This is in agreement with Angelier (1986) who suggested that this was the beginning of PSP subduction. The result in Figure 7 also showed that the Moho topography of the Coastal Range is drastically shifted around 23.5°N, but we do not think that this is the beginning of PSP subduction. From Figure 7, we can see that the direction of the PSP subduction is from south-east to north-west, and the starting point of the subduction may be the middle of North Luzon Arc and Ryukyu Trench, which is an increase of more than 10 km compared with the Moho topography of the PSP. The end point of the subduction may be Coastal Range, which is close to 23.5°N, 121.4°E.
In addition, the depth of Moho topography in Coastal Plain and Western Foothills is around 28 km.The results of Wang et al. (2010b), Hsu et al. (2011), Li et al. (2014), and Hsieh and Yen, (2016) showed that the Moho topography in Coastal Plain and Western Foothills is shallower in comparison with Hsuehshan Range, and the result in Figure 7 is in line with this view. The difference is that they believe there is a sharp Moho undulation between Coastal Plain, Western Foothills in the western part of TW and HR in the central part, while Figure 7 showed that this Moho undulation is not sharp.
Previously, the publicly available Moho topography model is mainly the CRUST 1.0 model, as shown in Figure 8a. In Figure 8a, the Moho topography in the study area ranges from 7.0 km to 39.9 km, and the overall distribution is “shallow in the southeast and deep in the northwest”, with obvious traces of plate subduction, but the specific boundary is not clear. The deepest part of Moho topography is located in the southern part of Coastal Plain and Western Foothills, and the shallowest part is located in PSP, while the exact location of the deepest and shallowest parts of Moho topography cannot be determined due to the lack of spatial resolution. Compared to Figure 7, the CRUST 1.0 model has obvious deficiencies in detail.
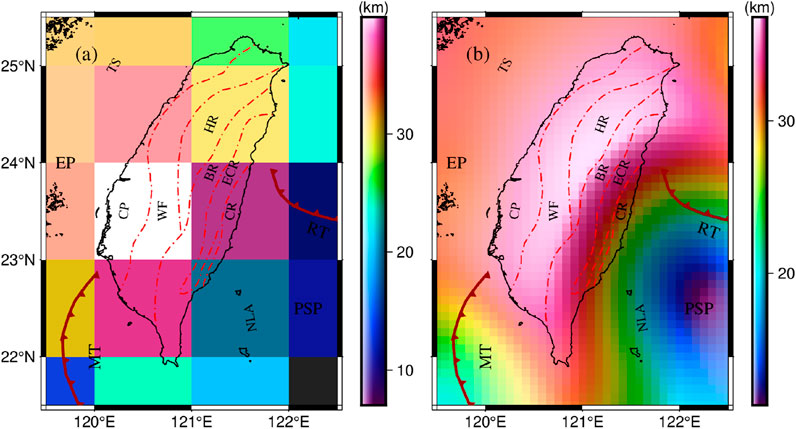
Figure 8. (a) Moho topography in CRUST1.0. (b) Moho model from Xuan et al. (2020).
To validate the accuracy of our Moho model, we chose the CRUST 1.0 model and Moho model from Xuan et al. (2020) in Figure 8 as the control group. These three Moho models were compared with all seismic points and seismic validation points, respectively, and the various statistics (Max, Min, Mean and RMS (Root Mean Square Error)) of the differences were shown in Table 3. In Table 3, when the comparison object is all seismic points, the RMS of the difference between CRUST 1.0 model and all seismic points is 7.47 km, the RMS of the difference between all seismic points and Moho model from Xuan et al. (2020) is 7.55 km, while the RMS of the difference between our model and all seismic points is 4.82 km. When the comparison object is seismic validation points, the RMS of the difference between CRUST 1.0 model and seismic validation points is 7.22 km, the RMS of the difference between seismic validation points and Moho model from Xuan et al. (2020) is 6.00 km, while the RMS of the difference between our model and all seismic points is 2.24 km. This indicated that our model is more accurate and realistic compared to the CRUST1.0 model.
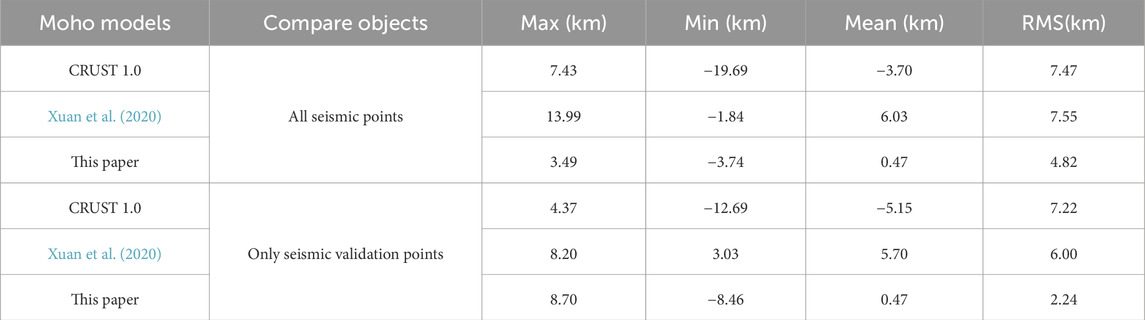
Table 3. Comparison of different Moho topography models and seismic Moho depth.
5 Discussions
There are two main subduction in the vicinity of TW, the subduction of EP (blue arrow in Figure 7) and the subduction of PSP (yellow line in Figure 7). Based on the direction of the fastest uplift of the Moho topography, we hypothesized that the subduction angle of PSP is 36.9° northwest, and its ending position is the 25 km contour. Additionally, The subduction angle of EP is 45° northeast. Previously, Yu et al. (1997) used data from GPS stations to infer that the direction of subduction is northwest-southeast and that the ending position is in the Coastal Range. This is close to our hypothesis. This suggests that it is feasible to use Moho topography to determine the direction and location of subduction. Based on deep earthquake data, Lin (2015) proposed an eastward subduction beneath southern TW. In contrast to this result, we suggested that the subduction is oriented to the northeast and that its ending position is in the southwestern waters of TW, which explains the infrequent earthquakes in the southwestern part of TW.
As can be seen from Figure 7, the Moho topography located in the PSP subduction (southeast corner of the study area) changes from 10 km to 25 km, and the Moho topography located in the EP subduction (southwest corner of the study area) changes from 15 km to 25 km at a similar distance. This situation illustrates the point that the deformation in the PSP subduction is more significant compared to the deformation in the EP subduction. Although EP subduction has an effect on the orogenic motion of TW, this effect is not significant. Huang CY. et al. (2006) suggested that the orogeny of TW still has a tendency to expand to the south, but we consider that the probability of the orogeny expanding to the south is very low under the combined effect of EP subduction and PSP subduction, and on the contrary, the greater probability is to expand to the northwest.
In addition, it can be seen from Figure 7 that the overall Moho topography of TW varies within 5 km, which is not drastic, except for part of the Coastal Range. In this regard, we have an inference that the PSP subduction and EP subduction led to the thickening crust of TW, and since TW is located on a hard plate, similar to the Tibetan Plateau, this thickening plate force fuelled the orogenic movement of TW.
Previously, Xuan et al. (2020) calculated the Moho topography of the region using the Parker-Oldenburg method. In this paper, we use seismic data as constraints to obtain more accurate inversion parameters and invert more accurate Moho topography. In Table 3, compared with the model from Xuan et al. (2020), the RMS of our model decreases by nearly 3 km. This indicates that the accuracy of our model is significantly improved compared with other models. We believed that improving the limitations of the algorithm (e.g., curvature not taken into account, filtering parameters fixed, etc.) and including new seismic data, which will be possible to improve the results obtained in this work. On the one hand, the estimated two optimal inversion parameters may be biased, which is most directly attributed to the insufficient number of seismic points. In addition, we can see from Figure 6 that the RMS corresponding to the optimal inversion parameters is 5.42 km, which indicated that the estimation of the inversion parameters still has a large bias, and we speculate that this is likely to be caused by the low quality of seismic points (the corresponding Moho depth is inaccurate). On the other hand, the Parker-Oldenburg method used for Moho topographic inversion does not take into account the effect of curvature. Although the study area in this paper is small and the effect of curvature is not significant.
6 Conclusion
In this paper, wavelet multi-scale analysis is used to separate the sediment-free gravity anomalies and obtain gravity signals of different orders. Later, based on the results of power spectrum estimation and the signal strength, the third order is selected as the gravity signal for Moho topographic inversion. Based on this gravity signal and the available seismic points, we used simulated annealing to estimate more accurate average Moho depth and Moho density contrast. Finally, the Moho topography of TW is calculated using the Parker-Oldenburg method. The main improvements in this paper are two: one is the extraction of signals from Moho topography by taking into account and subtracting gravity effects originating from the Earth’s crust. The other is to estimate more accurate inversion parameters using the available seismic data as constraints. On this basis, we inverted a finer Moho topography of TW.
The results showed that most of the Moho topography in TW is around 28 km. Among them, the deepest Moho topography in TW is located in Hsuehshan Range and Western Foothills, with a depth of slightly more than 30 km, while the shallowest Moho topography in TW is located in CR, with a depth of between 20 and 25 km. In addition, the Moho topography of PSP is less than 10 km. Based on the contours of the Moho topography, we hypothesized that the subduction direction of the PSP is 36.9° northwest and it terminates at the Coastal Range (25 km contour).
Data availability statement
The original contributions presented in the study are included in the article/supplementary material, further inquiries can be directed to the corresponding authors.
Author contributions
HY: Formal Analysis, Writing – original draft, Software, Investigation. MW: Writing – review and editing, Supervision, Project administration, Data curation, Funding acquisition. CX: Resources, Visualization, Funding acquisition, Validation, Writing – review and editing, Supervision.
Funding
The author(s) declare that financial support was received for the research and/or publication of this article. This study was supported by the National Key Research and Development Program of China (Grant no. 2024YFC2813305), the National Natural Science Foundation of China (Grant Nos 42476080, 42274004), the Director General’s Scientific Research Fund of Guangzhou Marine Geological Survey (Grant No. 2024GMGS-QN-19), and the Open Fund of National Precise Gravity measurement Facility, Huazhong University of Science and Technology (grant PGMF-2024-P011).
Acknowledgments
We are grateful to Zingerle et al. (2020), Straume et al. (2019), Xuan et al. (2020) and Laske et al. (2013) for providing data for this experiment, and the figures in this paper were produced using the General Mapping Tool (GMT).
Conflict of interest
The authors declare that the research was conducted in the absence of any commercial or financial relationships that could be construed as a potential conflict of interest.
Generative AI statement
The author(s) declare that no Generative AI was used in the creation of this manuscript.
Publisher’s note
All claims expressed in this article are solely those of the authors and do not necessarily represent those of their affiliated organizations, or those of the publisher, the editors and the reviewers. Any product that may be evaluated in this article, or claim that may be made by its manufacturer, is not guaranteed or endorsed by the publisher.
References
Amante, C., and Eakins, B. W. (2009). ETOPO1 arc-minute global relief model: procedures, data sources and analysis.
Barthelmes, F. (2009). Definition of functionals of the geopotential and their calculation from spherical harmonic models: theory and formulas used by the calculation service of the International Centre for Global Earth Models (ICGEM). Available online at: http://icgem.gfz-potsdam.de.
Bos, A. G., Spakman, W., and Nyst, M. C. J. (2003). Surface deformation and tectonic setting of Taiwan inferred from a GPS velocity field. J. Geophys. Res. Solid Earth 108 (B10). doi:10.1029/2002jb002336
Cheng, W. B., Wang, C., and Shyu, C. T. (1996). Crustal structure of the northeastern Taiwan area from seismic refraction data and its tectonic implications. TAO 7, 467–487. doi:10.3319/tao.1996.7.4.467(acct)
Ching, K. E., Rau, R. J., Johnson, K. M., Lee, J. C., and Hu, J. C. (2011). Present-day kinematics of active mountain building in Taiwan from GPS observations during 1995–2005. J. Geophys. Res. solid earth 116 (B9), B09405. doi:10.1029/2010jb008058
Eakin, D. H., McIntosh, K. D., Van Avendonk, H. J. A., and Lavier, L. (2015). New geophysical constraints on a failed subduction initiation: the structure and potential evolution of the Gagua Ridge and Huatung Basin. Geochem. Geophys. Geosystems 16 (2), 380–400. doi:10.1002/2014gc005548
Goyal, A., and Hung, S. H. (2021). Lateral variations of Moho depth and average crustal properties across the taiwan orogen from H-V stacking of P and S receiver functions. Geochem. Geophys. Geosystems 22 (3), e2020GC009527. doi:10.1029/2020gc009527
Hsieh, H. H., and Yen, H. Y. (2016). Three-dimensional density structures of Taiwan and tectonic implications based on the analysis of gravity data. J. Asian Earth Sci. 124, 247–259. doi:10.1016/j.jseaes.2016.05.009
Hsu, H. J., Wen, S., and Chen, C. H. (2011). 3D topography of the Moho discontinuity in the Taiwan area as extracted from travel time inversion of PmP phases. J. Asian Earth Sci. 41 (3), 335–343. doi:10.1016/j.jseaes.2011.02.003
Hsu, V. (1990). Seismicity and tectonics of a continent-island arc collision zone at the island of Taiwan. J. Geophys. Res. Solid Earth 95 (B4), 4725–4734. doi:10.1029/jb095ib04p04725
Huang, C. Y., Yuan, P. B., and Tsao, S. J. (2006a). Temporal and spatial records of active arc-continent collision in Taiwan: a synthesis. Geol. Soc. Am. Bull. 118 (3-4), 274–288. doi:10.1130/b25527.1
Huang, M. H., Hu, J. C., Hsieh, C. S., Ching, K., Rau, R., Pathier, E., et al. (2006b). A growing structure near the deformation front in SW Taiwan as deduced from SAR interferometry and geodetic observation. Geophys. Res. Lett. 33 (12). doi:10.1029/2005gl025613
Kao, H., Shen, S. J., and Ma, K. F. (1998). Transition from oblique subduction to collision: earthquakes in the southernmost Ryukyu arc-Taiwan region. J. Geophys. Res. Solid Earth 103 (B4), 7211–7229. doi:10.1029/97jb03510
Laske, G., Masters, G., Ma, Z., and Pasyanos, M. (2013). Update on CRUST1. 0—a 1-degree global model of Earth’s crust[C]//Geophysical research abstracts. Vienna, Austria. EGU General Assem. 15 (15), 2658.
Li, J., Xu, C., and Chen, H. (2022). An improved method to Moho depth recovery from gravity disturbance and its application in the South China Sea. J. Geophys. Res. solid earth 127 (7), e2022JB024536. doi:10.1029/2022jb024536
Li, Z., Roecker, S., Kim, K., Xu, Y., and Hao, T. (2014). Moho depth variations in the Taiwan orogen from joint inversion of seismic arrival time and Bouguer gravity data. Tectonophysics 632, 151–159. doi:10.1016/j.tecto.2014.06.009
Lin, C. (2015). Seismic evidence of ancient westward residual slab subduction beneath southern Taiwan. TAO Terr. Atmos. Ocean. Sci. 26 (6), 655. doi:10.3319/tao.2015.05.11.02(tc)
Mallat, S. G. (1989). A theory for multiresolution signal decomposition: the wavelet representation. IEEE Trans. pattern analysis Mach. Intell. 11 (7), 674–693. doi:10.1109/34.192463
Parker, R. L. (1973). The rapid calculation of potential anomalies. Geophys. J. Int. 31 (4), 447–455. doi:10.1111/j.1365-246x.1973.tb06513.x
Pezzopane, S. K., and Wesnousky, S. G. (1989). Large earthquakes and crustal deformation near Taiwan. J. Geophys. Res. Solid Earth 94 (B6), 7250–7264. doi:10.1029/jb094ib06p07250
Rao, W., Yu, N., Chen, G., Xu, X., Zhao, S., Song, Z., et al. (2023). Moho inversion by gravity anomalies in the South China Sea: updates and improved iteration of the parker-oldenburg algorithm. Earth Space Sci. 10 (9), e2022EA002794. doi:10.1029/2022ea002794
Rau, R. J., and Wu, F. T. (1995). Tomographic imaging of lithospheric structures under Taiwan. Earth Planet. Sci. Lett. 133 (3-4), 517–532. doi:10.1016/0012-821x(95)00076-o
Shih, M. H., Lai, Y. C., and Lin, C. H. (2023). Large variations of crustal thickness across the Taiwan orogeny constrained by Moho-refraction recorded by the Formosa Array. Terr. Atmos. Ocean. Sci. 34 (1), 3. doi:10.1007/s44195-023-00035-5
Simoes, M., Avouac, J. P., Beyssac, O., Goffé, B., Farley, K. A., and Chen, Y. (2007). Mountain building in Taiwan: a thermokinematic model. J. Geophys. Res. Solid Earth 112 (B11). doi:10.1029/2006jb004824
Spector, A., and Grant, F. S. (1970). Statistical models for interpreting aeromagnetic data. Geophysics 35 (2), 293–302. doi:10.1190/1.1440092
Straume, E. O., Gaina, C., Medvedev, S., Hochmuth, K., Gohl, K., Whittaker, J. M., et al. (2019). GlobSed: updated total sediment thickness in the world's oceans. Geochemistry Geophysics Geosystems 20 (4), 1756–1772. doi:10.1029/2018GC008115
Teng, L. S. (1990). Geotectonic evolution of late Cenozoic arc-continent collision in Taiwan. Tectonophysics 183 (1-4), 57–76. doi:10.1016/0040-1951(90)90188-e
Teng, L. S. (1996). Extensional collapse of the northern Taiwan mountain belt. Geology 24 (10), 949–952. doi:10.1130/0091-7613(1996)024<0949:ecotnt>2.3.co;2
Ustaszewski, K., Wu, Y. M., Suppe, J., Huang, H. H., Chang, C. H., and Carena, S. (2012). Crust–mantle boundaries in the Taiwan–Luzon arc-continent collision system determined from local earthquake tomography and 1D models: implications for the mode of subduction polarity reversal. Tectonophysics 578, 31–49. doi:10.1016/j.tecto.2011.12.029
Van Avendonk, H. J. A., Kuo-Chen, H., McIntosh, K. D., Lavier, L. L., Okaya, D. A., Wu, F. T., et al. (2014). Deep crustal structure of an arc-continent collision: constraints from seismic traveltimes in central Taiwan and the Philippine Sea. J. Geophys. Res. Solid Earth 119 (11), 8397–8416. doi:10.1002/2014jb011327
Wang, H. L., Chen, H. W., and Zhu, L. (2010a). Constraints on average Taiwan Reference Moho Discontinuity Model—receiver function analysis using BATS data. Geophys. J. Int. 183 (1), 1–19. doi:10.1111/j.1365-246x.2010.04692.x
Wang, H. L., Zhu, L., and Chen, H. W. (2010b). Moho depth variation in Taiwan from teleseismic receiver functions. J. Asian Earth Sci. 37 (3), 286–291. doi:10.1016/j.jseaes.2009.08.015
Xu, C., Liu, Z., Luo, Z., Wu, Y., and Wang, H. (2017). Moho topography of the Tibetan Plateau using multi-scale gravity analysis and its tectonic implications. J. Asian Earth Sci. 138, 378–386. doi:10.1016/j.jseaes.2017.02.028
Xuan, S., Jin, S., and Chen, Y. (2020). Determination of the isostatic and gravity Moho in the East China Sea and its implications. J. Asian Earth Sci. 187, 104098. doi:10.1016/j.jseaes.2019.104098
Yi-Ben, T. (1986). Seismotectonics of taiwan. Tectonophysics 125 (1-3), 17–37. doi:10.1016/0040-1951(86)90005-3
Yu, H., Qin, P., Xu, C., Zhang, H., Chai, Y., and Du, R. (2024). Improved parker–oldenburg method and its application to Moho topographic inversion in the northern south China sea. Geophys. J. Int. 238 (3), 1530–1545. doi:10.1093/gji/ggae224
Yu, S. B., Chen, H. Y., and Kuo, L. C. (1997). Velocity field of GPS stations in the Taiwan area. Tectonophysics 274 (1-3), 41–59. doi:10.1016/s0040-1951(96)00297-1
Yu, S. B., Kuo, L. C., Punongbayan, R. S., and Ramos, E. G. (1999). GPS observation of crustal deformation in the Taiwan-Luzon region. Geophys. Res. Lett. 26 (7), 923–926. doi:10.1029/1999gl900148
Zhao, G., Liu, J., Chen, B., Kaban, M., and Zheng, X. (2020). Moho beneath Tibet based on a joint analysis of gravity and seismic data. Geochem. Geophys. Geosystems 21 (2), e2019GC008849. doi:10.1029/2019gc008849
Keywords: Moho topography, gravity inversion, Parker-Oldenburg method, Taiwan, simulated annealing
Citation: Yu H, Wen M and Xu C (2025) Inversion of Moho topography in Taiwan using improved Parker-Oldenburg method. Front. Earth Sci. 13:1592768. doi: 10.3389/feart.2025.1592768
Received: 13 March 2025; Accepted: 06 May 2025;
Published: 16 May 2025.
Edited by:
Paolo Capuano, University of Salerno, ItalyReviewed by:
Diana Núñez, Complutense University of Madrid, SpainDongmei Guo, Chinese Academy of Sciences (CAS), China
Copyright © 2025 Yu, Wen and Xu. This is an open-access article distributed under the terms of the Creative Commons Attribution License (CC BY). The use, distribution or reproduction in other forums is permitted, provided the original author(s) and the copyright owner(s) are credited and that the original publication in this journal is cited, in accordance with accepted academic practice. No use, distribution or reproduction is permitted which does not comply with these terms.
*Correspondence: Mingming Wen, MzI3MzE4NTVAcXEuY29t; Chuang Xu, Y2h1YW5neHVAZ2R1dC5lZHUuY24=