 Hangtao Yu
 Mingming Wen1,2,3*
 Chuang Xu
- 1Guangzhou Marine Geological Survey, China Geological Survey, Guangzhou, China
- 2Key Laboratory of Marine Mineral Resources, Ministry of Natural Resources, Guangzhou Marine Geological Survey, China Geological Survey, Guangzhou, China
- 3Guangzhou Marine Geological Survey, National Engineering Research Center for Gas Hydrate Exploration and Development, Guangzhou, China
- 4Department of Geodesy and Geomatics Engineering, School of Civil and Transportation Engineering, Guangdong University of Technology, Guangzhou, China
- 5Cross Research Institute of Ocean Engineering Safety and Sustainable Development, Guangdong University of Technology, Guangzhou, China
As one of the representative multi-ring basins on the Moon, the internal structure of Mare Orientale is crucial for exploring the formation mechanism of multi-ring basins. Due to the sparsity of moonquake data, at present, only gravity data can be more effectively applied to study the internal structure of Mare Orientale. Therefore, based on the GRGM1200A model from Gravity Recovery and Interior Laboratory, we inverted the internal density structure of Mare Orientale from the perspective of signal separation. In addition, based on the gravity anomalies after deducting the influence of the crust, we calculated the depth of its crust-mantle interface. The results of the study show that there is a wide-ranging, high-density body beneath Mare Orientale. Its morphology is similar to that of a prism, with a depth ranging from 32.4 to 64.0 km. The upper tip is located roughly 98°W longitude and 18°S latitude, and the lower tip roughly 94°W longitude and 22°S latitude. Within the internal depression, the crust-mantle interface in Mare Orientale is clearly uplifted with a shallowest depth of 1.47 km. In the basin centre, there is an uplifted rebound of the crust-mantle interface. Based on our results, we suggested that the multi-ring structure of Mare Orientale was formed primarily by a large, tilted meteorite impact, which left meteorite residues in the upper mantle of Mare Orientale and caused a dramatic uplift of the crust-mantle interface within the basin.
1 Introduction
Mare Orientale (MO) lies on the lunar nearside, and is one of the youngest multi-ring basins on the Moon, formed between 3.68 and 3.85 billion years ago (Wilhelms et al., 1987; Whitten et al., 2011). MO has four concentric rings, the outermost of which is the Cordillera Ring (CR), with a diameter of ∼930 km (Smith et al., 2010; Potter et al., 2013). The mechanism of the ring formation is still controversial (Melosh and McKinnon, 1978; Schultz et al., 1981; Head, 2010). Likewise, the fundamental properties of the basin, such as the volume of impact-generated melt, the basin rim, and the dimensions of transient craters, are similarly uncertain (Potter et al., 2013). Some studies have addressed these features by numerically modelling the formation mechanisms of MO (Stewart, 2011; Potter et al., 2013; Johnson et al., 2016). Stewart (2011) proposed that a 100 km diameter rock projectile is impacted into MO at a velocity of 10.6 km/s. The results show that the crust in the basin centre of MO was very thin after the impact. Potter et al. (2013) made an impact model of MO, and estimated the diameter of the impactor to be 50–80 km, the transient crater formed by it to be 320–480 km in diameter, and the excavation depth to be 40–55 km. Johnson et al. (2016) simulated an impact event at MO and validated the simulations with gravity data, which showed that the impact formed a transient crater of nearly 390 km.
Regarding the formation mechanism of MO, numerical simulations have provided a number of valuable insights. However, because the lunar interior tectonics are not horizontally uniformly distributed (Jolliff et al., 2000), numerical simulations are not well suited to explore the consequences of impacts. The most important prerequisite for possibly revealing the nature of the impact is a more realistic subsurface structure. With the development of the Gravity Recovery and Interior Laboratory (GRAIL) mission, lunar gravity data have the advantage of high accuracy and resolution, which can be used directly to resolve subsurface structures. Therefore, based on gravity data, numerous studies have investigated the internal structure of MO. Based on GRAIL gravity data and Lunar Reconnaissance Orbiter (LRO) topographic data, Wieczorek et al. (2013) computed a crustal thickness model of the whole Moon. Kattoum and Andrews-Hanna (2013) used a Markov chain Monte Carlo method to find the best-fitting fault dip and displacement within MO, as well as the depth of the density interface within the crust and the density contrasts at that interface. Liang et al. (2014) calculated the 3D density distribution of the whole Moon and showed that high density anomalies exist 20–40 km inside MO. Zuber et al. (2016) used gravity data to resolve the three-ring structure of MO, and hypothesised the presence of faults associated with the outer two rings. Based on gravity gradient data, Andrews-Hanna et al. (2018) constrained the shallow and deep structure of MO. Based on the lunar gravity field model GL1500E, Zhao et al. (2021) inverted the internal structure of MO in three dimensions, and the results showed that there are high-density anomalies inside MO in the depth range of 18–70 km. However, gravity is an integrated representation of all material signals in the lunar interior. How to effectively improve the accuracy of gravity modelling is the key point to obtain a fine crust and upper mantle structure inside MO.
Currently, there are three types of methods used commonly for gravity modelling, which are depth weighting (Li and Oldenburg, 1998; Liang et al., 2014), forward fitting (Li and Oldenburg, 2003; Zhao et al., 2021), and signal separation (Hou et al., 1998; Xu et al., 2018). Among them, depth weighting means setting a depth weighting function according to the existing prior information or empirical formulas, so as to overcome the skinning effect during the inversion process, thus enabling the implementation of the inversion. Forward fitting is the setting of subsurface module densities and then forward their corresponding gravity values. By comparing with the actual gravity values, the fit is achieved by continuously modifying the module values. Signal separation is the process of separating the high and low frequency signals in the gravity signal and thus inverting the signals in different frequency bands. Since more accurate a priori information about MO internals is not yet available, traditional depth weighting methods or forward fitting methods are not very reliable. Compared with these two methods, signal separation is more suitable for this situation where there is no a priori information. In the direction of signal separation, wavelet multi-scale analysis, as its representative classical algorithm, has been widely used in internal structure research (Jiang et al., 2012; Xu et al., 2017). Therefore, we use wavelet multi-scale analysis to separate the Bouguer gravity anomaly signals of MO and thus invert the internal density structure of MO. In addition, we computed the crust-mantle interface depth in this region after deducting the gravity effect from the crust of MO. Based on the internal density structure and the crust-mantle interface depth, we obtained the fine structure of MO’s crust and upper mantle, and explored its formation mechanism.
2 Methods
2.1 Wavelet multi-scale analysis
The Bouguer gravity anomaly contains several different frequency bands of signals from material at different depths beneath MO. Previously, wavelet multi-scale analysis has been applied several times to frequency band separation of field data (Mallat, 1989). The low-frequency
where,
2.2 Tesseroid body inversion method
To implement the density inversion, we need to calculate the average field source depths corresponding to the signals in different frequency bands which are used to determine the thickness of the Tesseroid body in each layer. Spector and Grant (1970) have proposed the radial power spectrum method. The method uses gravity anomalies of different orders
where
When
By substituting Equation 4 into Equation 3,
Simultaneously squaring both sides of Equation 5,
Based on Equation 6,
After determining
where
where
where
2.3 Parker-oldenburg method
After separating the gravity anomaly signals in different frequency bands, high-frequency contents from MO crust can be distinguished based on the anomaly signal strength and depth information. On this basis, this high-frequency signal is subtracted from Equation 1 to obtain the low-frequency signal from MO crust-mantle interface,
where
where
3 Study area
3.1 Topography
MO is located on the western side of the lunar nearside, with its centre located at longitude 93.5°W and latitude 19.5°S. It is surrounded by Grimaldi to the NE, Hertzsprung and Korolev to the NW, and Mendel-Rydberg and South Pole-Aitken to the SW. As one of the typical impact basins on the Moon, MO exhibits concentric rings similar to other impact basins, including the Cordillera Ring (CR, ∼930 km in diameter), the Outer Rook Ring (ORR, ∼620 km in diameter), the Inner Rook Ring (IRR, ∼480 km in diameter), and the Inner Depression Ring (IDR, ∼320 km in diameter) (Spudis, 1993). Figure 1 shows the topography of MO, derived from Lunar Orbiter Laser Altimeter (LOLA) data (Neumann, 2011), showing four rings surrounding the outside of MO, as extracted from Ji et al. (2021). Of these, the elevations of ORR, IRR and CR are generally at 6,000 m and the elevations of IDR are around 0. Overall, the elevation of the study area ranges from −8827.9–18,639 m. The highest elevations occur in the western part of MO (outside of CR), where most of the elevations are greater than 12,000 m. The lowest elevations occur in the centre of MO, and most of them are below −4,000 m. There are four relatively distinct craters in the study area, Maunder (MA), Kopff (KO), Lowell (LO), and Schlüter (SC). Among them, MA has the lowest elevation, with most of the area within the crater close to −8,800 m.
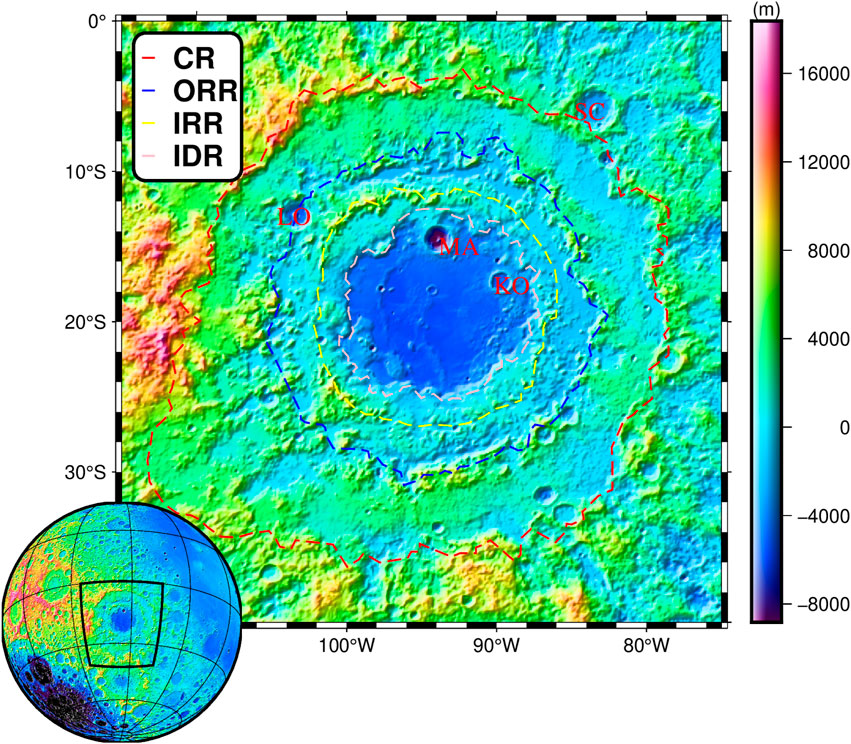
Figure 1. Topography of MO; data from Lunar Orbiter Laser Altimeter (LOLA; Neumann, 2011). MA: Maunder; KO: Kopff; LO: Lowell; SC: Schlüter; CR: Cordillera Ring; ORR: Outer Rook Ring; IRR: Inner Rook Ring; IDR: Inner Depression Ring.
3.2 Bouguer gravity anomaly
The gravity anomaly data used in this paper is the GRGM1200A gravity field model, which covers the whole Moon (Goossens et al., 2020). Based on the LOLA data, the topographic effects in the gravity anomaly data are deducted to obtain the Bouguer gravity anomaly of MO as shown in Figure 2. The gravity anomalies in the study area range from −186 to 472 mGal. As in other Moon basins, such as Mare Crisium and Mare Imbrium, the centre of MO yields a significant positive gravity anomaly, above 400 mGal in most areas. Negative gravity anomalies in the study area are predominantly distributed near ORR, generally below −150 mGal. There are two main negative gravity anomalies: one occurs in the northwestern portion of MO, and it appears as a quarter-circle arc; the other one occurs in the southern part of MO, at longitude 93°W and latitude 31°S. The gravity anomaly of MO shows a ring-like decreasing from the centre toward the surrounding. In addition, IRR and IDR, as two rings in the interior, overlap most of the changing boundaries of the gravity anomalies.
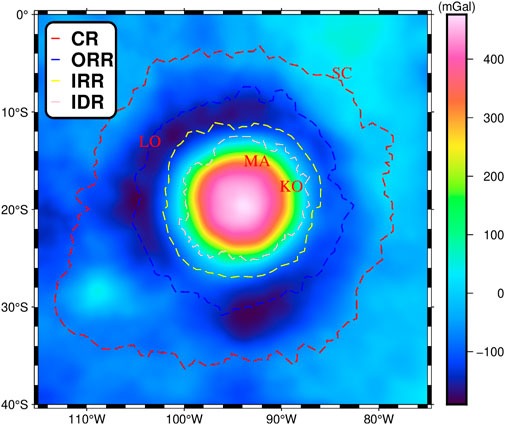
Figure 2. Bouguer gravity anomaly of MO. Data from the GRGM1200A gravity field model (Goossens et al., 2020).
4 Results and discussion
4.1 Separated gravity anomalies
The Bouguer gravity anomaly contains all the signals from inside MO. Here, we use Equation 1 to separate the Bouguer gravity anomaly of MO to obtain the first eight orders of wavelet details (high-frequency signals), as shown in Figure 3. The top left corner of Figure 3 has labels (a) to (f), representing the first to eighth order wavelet details, respectively. Since each order of the signal corresponds to a different frequency band, its corresponding depth varies according to the power spectrum theory (Spector and Grant, 1970). We plot the power spectrum image corresponding to the first eight orders of wavelet details, as shown in Figure 4. The horizontal coordinate of Figure 4 is the wave number and the vertical coordinate is the power. Based on Equation 7, we calculate the curvature of different power spectrums (as shown by the red line in Figure 4) to estimate the corresponding average field source depth, and the results are shown in Table 1. Based on the average field source depths corresponding to different signals, we reconstruct the layered internal structure of MO, and the depth range and thickness of each layer as shown in Table 1.
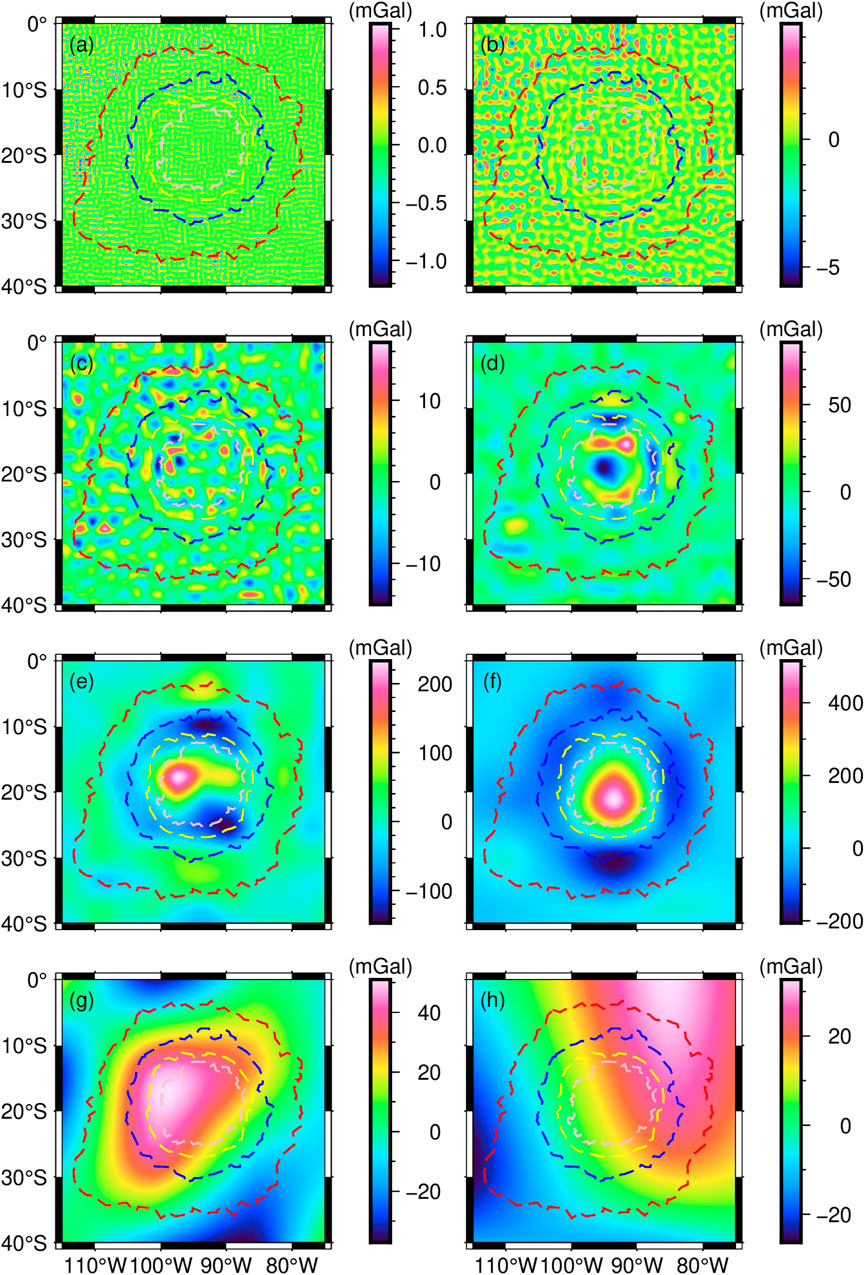
Figure 3. Decomposed gravity anomalies in MO. From (a–h): the first to eighth order wavelets from D1 to D8.
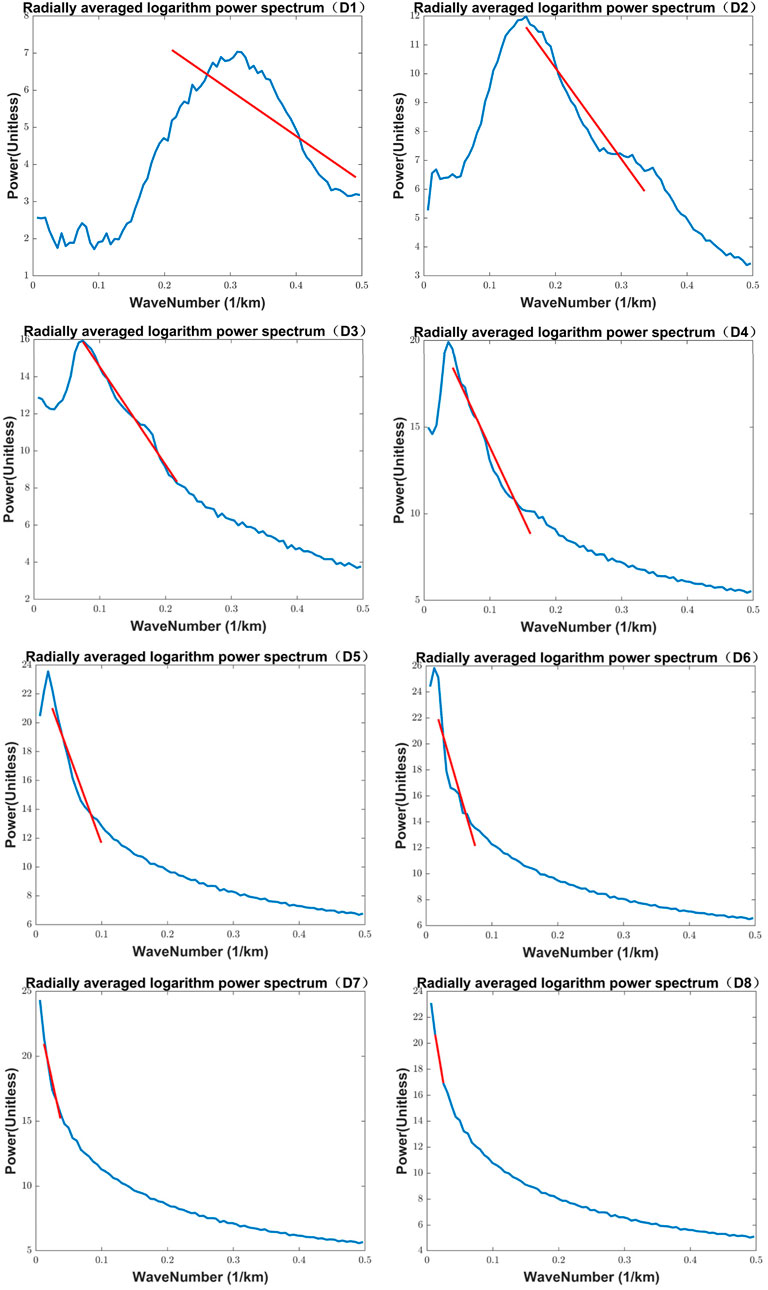
Figure 4. Radial logarithm Power spectrum of the decomposed gravity anomalies D1 to D8. The horizontal coordinate is the wave number and the vertical coordinate is the power.
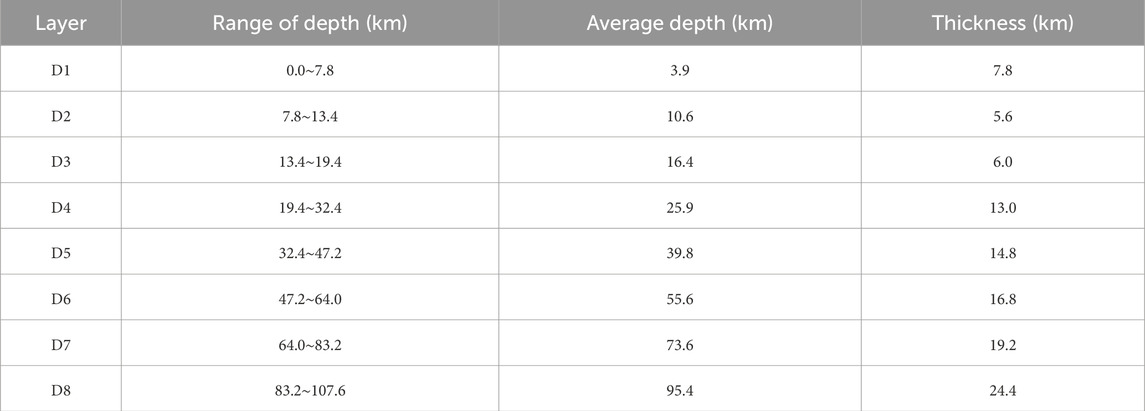
Table 1. The layered model of MO.
In Figure 3, the gravity anomaly signals of D1 are small, ranging from −1.22 to 1.05 mGal, and we presume that they may be due to disturbances from data source. D2’s depths ranges from 7.8 to 13.4 km, and its gravity anomaly values range from −5.8 to 4.5 mGal. The main area corresponding to the anomalous signals lies in CR, showing a similar ring-like distribution. The corresponding depth of D3 is between 13.4 and 19.4 km, and its gravity anomaly ranges between −12.5 and 13.5 mGal. The main areas of the anomalous signals begin to contract into the basin and are distributed in IRR and IDR. Compared to D2, the boundary features of the anomalous signals in D3 are clearer. This phenomenon may be due to tectonic evolution or differences in the compositional features of the lunar crust. The depth of D4 is between 19.4 and 32.4 km, where the gravity anomaly signal is significantly enhanced, ranging from −64 to 84 mGal. Combined with previous studies on the lunar crustal thickness (Wieczorek et al., 2013; Liang et al., 2024), we suggest that the anomalous signals here originate from the crust-mantle interface beneath MO. Among them, the negative anomalies are mainly concentrated in the centre of the basin, in part between IRR and IDR. The positive anomalies are mainly located at the inner margin of IDR, showing a ring-like distribution. The depth of D5 is between 19.4 and 32.4 km. The results of Wieczorek et al. (2013) showed that the crustal thickness of MO is basically less than 20 km. From D5 to D8, we interpret the gravity anomaly signals to originated mainly from the lunar mantle. The gravity anomaly values of D5 range from −146 to 228 mGal. Compared to D4, D5 begins to show a clear signal of anomalous bodies. The anomalous body here is located in the western part of the basin, and its western side borders IDR. The anomalies are largely above 150 mGal and are centred at 98°W longitude and 18.5°S latitude. The depth of D6 is between 32.4 and 47.2 km, and its gravity anomaly ranges between −205 and 510 mGal, with the most drastic variations. Compared to D5, the anomaly of D6 is significantly enhanced. It is located in the centre of the basin and its southern side borders IDR. Most anomalies are above 300 mGal and are centred at 93°W longitude and 21°S latitude. The depth of D7 is between 64.0 and 83.2 km, and its gravity anomaly ranges between −37 and 51 mGal. There is a large-scale anomalous signal on the north-western side of the basin, but it is not as strong as to D5 and D6. The depth of D8 is between 83.2 and 107.6 km, and its gravity anomaly ranges between −25 and 32 mGal. Compared to D5 and D6, there is a substantial decrease in the values of gravity anomalies. Here, the gravity anomaly signals within MO are not obvious, which indicates that structural deformation is present but not significant.
In summary, the first three orders of wavelet details reflect more the gravity anomaly features of the crust beneath MO. As depth increases, the gravity anomalies are gradually enhanced, possibly due to increasing differences in lunar crustal composition. The fourth order wavelet detail reflects the gravity anomaly feature at the crust-mantle interface beneath MO, and the anomalies range more abruptly. The fifth and sixth order wavelet details seem to show the morphology of the anomalous body beneath MO, with its top located in the west side of MO and the bottom of the anomalous body in the centre. The values of the seventh and eighth order wavelet details tend to be stable. Compared to D5 and D6, the gravity anomaly decreases by more than 200 mGal. This large decrease could indicate that the signal from the anomalous body is very weak in D7 and D8. Therefore, in D7 and D8, we judged that the signal of the anomalous body has been largely absent.
4.2 The density structure of MO
Based on the results after layering (Table 1), we modelled each layer of the structure using Tesseroid bodies, with each Tesseroid body having a latitude/longitude interval of 0.5° × 0.5°, and the thickness of the Tesseroid body is the thickness of the structure layer. After modelling, we calculated the density anomalies at different layers using Equation 10, as shown in Figure 5.
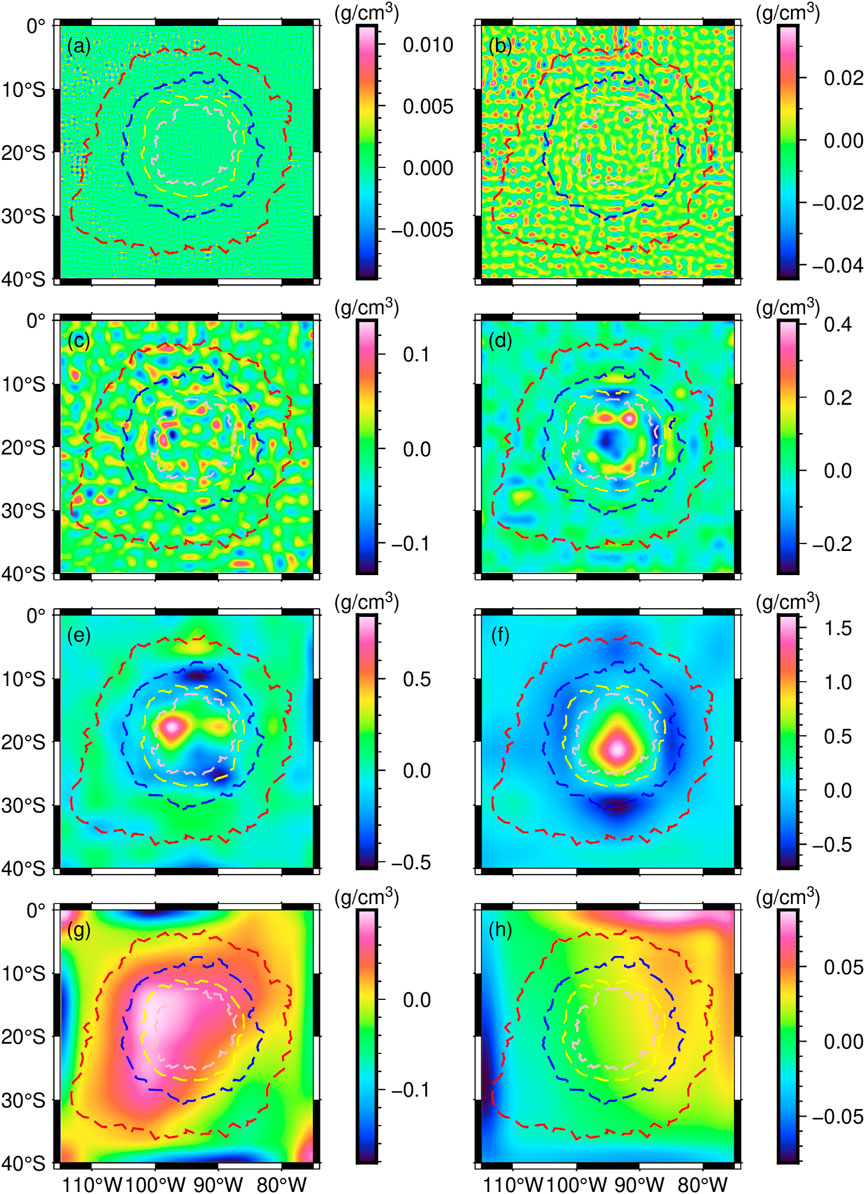
Figure 5. Results of stratified density inversion. Letter/number in the upper left corner (D1 to D8) indicates the corresponding density anomalies. (a) Density anomalies between 0 and 7.8 km depth, (b) Density anomalies between 7.8 and 13.4 km depth, (c) Density anomalies between 13.4 and 19.4 km depth, (d) Density anomalies between 19.4 and 32.4 km depth, (e) Density anomalies between 32.4 and 47.2 km depth, (f) Density anomalies between 47.2 and 64 km depth, (g) Density anomalies between 64 and 83.2 km depth, (h) Density anomalies between 83.2 and 107.6 km depth.
In Figure 5, the density anomalies of D1 and D2 have relatively weak variations, with values ranging from −0.043 to 0.035 g/cm3, and are mainly distributed near CR. D3 reflects density anomalies at an average depth of 16.4 km beneath MO, with values ranging from −0.13–0.138 g/cm3. Here, the density anomalies are clustered in the centre of the basin. Combined with previous impact simulation experiments (Stewart, 2011; Potter et al., 2013; Johnson et al., 2016), we suggest that this is the result of post-impact magma infilling. D4 reflects the density anomalies at an average depth of 25.9 km beneath MO, with values ranging from −0.28–0.41 g/cm3. The anomalies here mainly originate from the crust-mantle interface beneath MO. The positive density anomalies are mainly circularly distributed in the inner IDR, while the basin centre shows negative density anomalies. This suggests that the uplift of the lunar mantle around it is more pronounced compared to the basin centre. The results of Zuber et al. (2016) also showed that there is an uplift and rebound in the basin centre of MO, which is more consistent with the distribution of the density anomalies. D5 reflects the density anomalies at an average depth of 39.8 km beneath MO, with values ranging from −0.53–0.83 g/cm3. We interpret this as a high-density body with a diameter of ∼108 km, laying on the western side of MO, centred at longitude of 98°W and a latitude of 18.5°S. D6 reflects the density anomalies at an average depth of 55.6 km beneath MO, with values ranging from −0.73–1.62 g/cm3. Below this depth, a high-density body with a diameter of about 135 km lies at the centre of MO, centred at longitude 93°W, latitude 21°S. D7 reflects the density anomalies at an average depth of 73.6 km beneath MO, with values ranging from −0.18 to 0.09 g/cm3. In particular, a large positive density anomaly appears in the northwestern corner of the IDR. D8 reflects the density anomalies at an average depth of 95.4 km beneath MO, with values ranging from −0.081–0.085 g/cm3. At this depth, the density variations are very weak. This suggests that the structural deformation is not significant, resulting in small horizontal density differences.
In summary, there are two unexplored phenomena within MO. One is that there are positive density anomalies surrounding the basin centre at depths near the crust-mantle interface, which may be lunar mantle material uplifted within the basin. The other is that the upper mantle exhibits a significant high-density body. As it can be seen from D5 and D6, the depth range of the high-density body is 32.4∼64.0 km, with a diameter of ∼108 km at the top and ∼135 km at the bottom. Previously, other scholars have also proposed the existence of high-density anomalies beneath MO. For example, the results of Liang et al. (2014) showed that there is a high-density anomaly inside MO at a depth of 20–40 km, and the results of Zhao et al. (2021) showed that there is a high-density anomaly inside MO at a depth of 18–70 km. The depth range of the high-density body differs from previous studies, but the results obtained by either method demonstrate the presence of a high-density body. As can be seen in Figures 5E,F, the density of this high-density body is generally 0.8 g/cm3 higher compared to other lunar mantle regions within MO. The density contrast is extraordinary, greater than that between the lunar crust and mantle, suggesting that there is a high probability that the high-density body is not native to the region. This phenomenon is similarly observed in studies of other impact basins (Yu et al., 2023; Yu et al., 2024). Here, we suggest that the high-density body may be a meteorite residue. Combined with the positive density anomalies in D7, we have a hypothesis. The impact that formed MO was tilted downward from the west, and the final hit point of the meteorite was centered at 93°W in longitude and 21°S in latitude. Because the impact led to the destruction of the original structure in the western part of MO, the lunar mantle below the fall point was extruded towards the western part of MO after being subjected to pressure. The density of the extruded uplifted mantle is also different from that of the original mantle, which explains the source of the positive density anomalies in D7.
4.3 The crust-mantle interface of MO
To show a more richer structure of MO’s crust and upper mantle, a fine model of the crust-mantle interface is needed in addition to the density structure. Before inverting the model, we need to subtract the influence brought by the lunar crust from the Bouguer gravity anomaly. Based on the results of the wavelet multi-scale analysis, we believe that D1∼D3 are gravity signals originating from the lunar crustal material. Using Equation 1, the third order wavelet approximation A3 can be obtained as the deducted gravity anomaly, as shown in Figure 6. Here, we believe that it mainly originates from the crust-mantle interface.
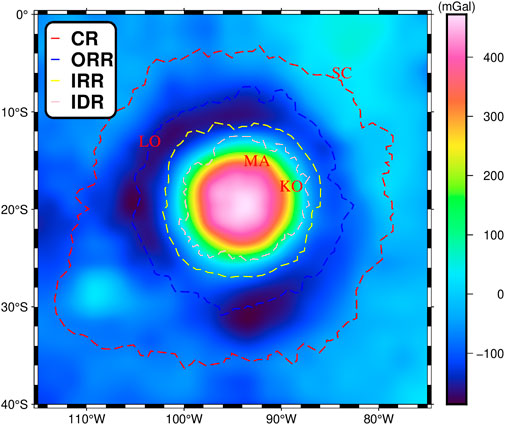
Figure 6. The 3th-order wavelet approximation A3 of the Bouguer gravity anomaly.
After determining the gravity data required for the inversion, the inversion parameters (average crust-mantle interface depth and crust-mantle density contrast) need to be determined next. Based on the model of Wieczorek et al. (2013), the average crust-mantle interface depth and crust-mantle density contrast used in this paper are 35 km and 0.81 g/cm3, respectively. To reduce the edge effects from the inversion, the gravity data here are expanded by 5° in all directions (i.e., the range is 70°W∼120°W, 45°S∼5°N). Based on Equation 12, we invert the depth of crust-mantle interface beneath MO, as shown in Figure 7.
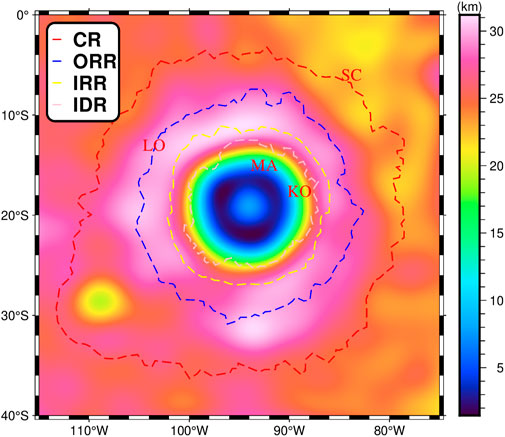
Figure 7. Depth of the crust-mantle interface beneath MO.
In Figure 7, the crust-mantle interface in the study area ranges from 1.5 to 31.2 km. It can be seen that, compared with the outer region surrounding the study area, a marked mantle uplift appears within MO (inner IDR). Such uplift feature shows an evident multi-ring structure, with most of the crust-mantle interfaces at depths within 10 km. Specifically, the mantle uplift at the centre of the basin exhibits a shape hinting at an rebound phenomenon, and its depth of crust-mantle interface is around 8 km. This feature is relatively consistent with the density anomaly in Figure 5D, and the uplift rebound at the centre is the main cause of the negative density anomaly. The shallowest depth of the crust-mantle interface is close to 1.5 km, and it is mainly distributed in two regions, in the northwestern and southern parts of MO. Quite coincidentally, this highly overlaps with the locations of the high-density bodies in Figures 5F,G. This feature also seems to support our previous speculation about the location of meteorite impact. Having underwent direct impact, these two regions also appear to exhibit the remains of the most intense mantle uplift. Between IRR and CR, around the basin centre, the depth of the crust-mantle interface increases dramatically in a large annular region (the width of the ring is about 162 km), generally around 30 km. In addition, the crust-mantle interface is around 15 km in MA and KO, around 22 km in SC, and around 28 km in LO. Unlike the basin centre, the crust-mantle interface in these craters is not significantly uplifted. This suggests that the impacts which caused these craters essentially caused their topographic structure and did not significantly affect their deep-seated internal structure.
5 Discussion
To better show the overall morphology of the lunar crust, the high-density bodies, and the residual lunar mantle beneath MO, we merged D1 to D4 in Figure 3 and regarded them as the total signals of the lunar crust, as shown in Figure 8A. By merging D5 and D6 in Figure 3, we regarded them as the total signals of the high-density bodies, as shown in Figure 8B. By merging D7 and D8 in Figure 3, we regarded them as the total signal of the residual lunar mantle, as shown in Figure 8C.
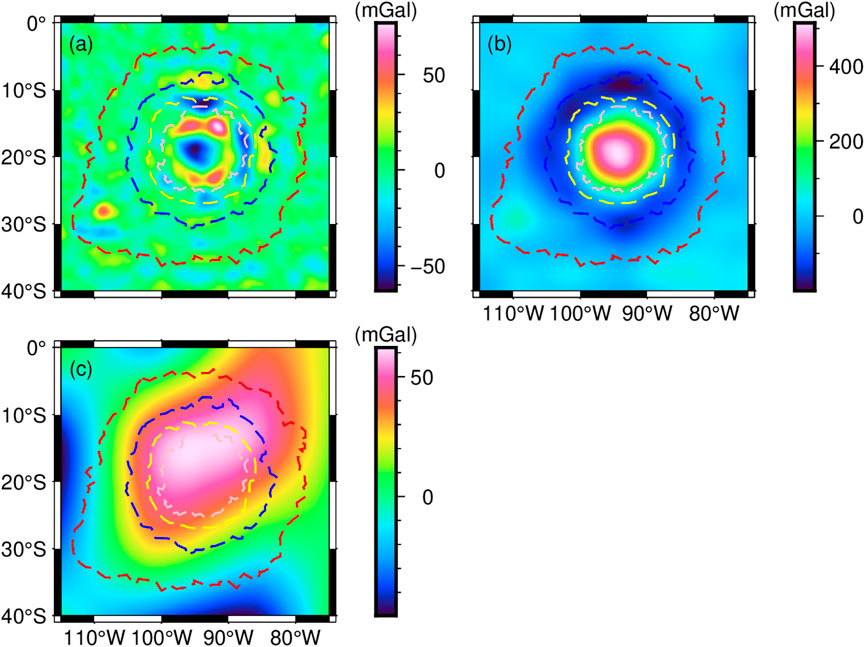
Figure 8. Gravity signatures of the lunar crust (a), high-density bodies (b) and residual lunar mantle (c).
The gravity anomalies in Figure 8A range from −62 to 75 mGal. In particular, the centre of MO shows a large negative gravity anomaly around −60 mGal. Combined with the inferences from previous meteorite impacts, we suggested that this could be the result of the filling of the original surrounding lunar crustal material after the impact, which is less dense than the new structure after the melt, resulting in the formation of a mass hollow. Between IDR and the centre of the basin, there is a clear positive gravity anomaly with a circular shape. Combined with Figure 7, we suggested that this is most likely melted lunar crustal material. The gravity anomalies in Figure 8B range from −190 to 508 mGal. The gravity anomalies at the centre of MO are generally higher than 400 mGal, and the high gravity anomalies are closely related to the high-density bodies beneath the basin. Figure 8C shows the gravity anomalies of the residual lunar mantle with values ranging from −48 to 62 mGal. The positive gravity anomaly in the study area is much larger, covering almost the entire inner region of ORR. We maintain that there are two possible reasons for this phenomenon: one is that some of the high-density body signals are not completely separated. Since the separation of the high and low frequency signals is relatively constant, this also leads to the possibility that some of the signals from the high-density bodies (D5 and D6) are left behind in D7 and D8. The other one is material from the upwelling beneath the meteorite. Roberts and Arkani-Hamed (2012) propose that an impact would promote the formation of an upwelling beneath the impact site. As a result of the upwelling, deeper mantle material was brought up, which is the probable cause of the high density in Figure 8C.
6 Conclusion
Based on the GRGM1200A gravity field model, we invert the density structure and crust-mantle interface model of MO’s interior. We report two main findings about the internal structure of MO. In the upper mantle of MO (depth range 32.4–64 km), a large high-density body was found with anomalous densities generally greater than 0.8 g/cm3. The top and bottom of the high-density body are similarly rounded. The centre of the top is at 98°W longitude and 18.5°S latitude, with a diameter of ∼108 km, while the centre of the bottom is at 93°W longitude and 21°S latitude, with a diameter of ∼135 km. In addition, the crust-mantle interface of MO (inner IDR) has a pronounced uplift, with the shallowest point close to 1.5 km. Both the density structure and the crust-mantle interface model confirmed that the uplift of the crust-mantle interface beneath MO is not regular. Compared with the surrounding area, the uplift at the centre is not the largest, with a depth of about 8 km. By analysing the density structure and the crust-mantle interface model, we concluded that the formation of MO was mainly due to a tilted large impact feature. This large impact reached a maximum depth of nearly 64 km with a maximum diameter of nearly 135 km. The impact left meteorite remnants, which are the mentioned high-density bodies. At the same time, there was significant uplift of the lunar mantle in the direct impact area.
Data availability statement
The original contributions presented in the study are included in the article/supplementary material, further inquiries can be directed to the corresponding authors.
Author contributions
HY: Conceptualization, Methodology, Writing – original draft, Software, Investigation. MW: Writing – review and editing, Supervision, Formal Analysis, Project administration, Funding acquisition. CX: Resources, Visualization, Validation, Writing – review and editing, Project administration, Data curation. QH: Writing – review and editing, Investigation.
Funding
The author(s) declare that financial support was received for the research and/or publication of this article. This study was supported by the National Key Research and Development Program of China (Grant nos. 2024YFC2813305), the National Natural Science Foundation of China (Grant No. 42476080, 42274004), the Director General’s Scientific Research Fund of Guangzhou Marine Geological Survey (Grant No. 2024GMGS-QN-19), and the Open Fund of National Precise Gravity measurement Facility, Huazhong University of Science and Technology (grant PGMF-2024-P011).
Acknowledgments
The lunar gravity field GRGM1200A spherical harmonic coefficient model is provided by NASA, which can be downloaded from https://pgda.gsfc.nasa.gov/products/50 (Goossens et al., 2020). The topography of MO is downloaded from http://imbrium.mit.edu/BROWSE/LOLA_GDR/CYLINDRICAL/ELEVATION/ (Neumann, 2011). We are very grateful to NASA for providing the data for this experiment and the figures in this paper were produced using Generic Mapping Tools (GMT). We thank both reviewers for their valuable comments.
Conflict of interest
The authors declare that the research was conducted in the absence of any commercial or financial relationships that could be construed as a potential conflict of interest.
Generative AI statement
The authors declare that no Generative AI was used in the creation of this manuscript.
Publisher’s note
All claims expressed in this article are solely those of the authors and do not necessarily represent those of their affiliated organizations, or those of the publisher, the editors and the reviewers. Any product that may be evaluated in this article, or claim that may be made by its manufacturer, is not guaranteed or endorsed by the publisher.
References
Andrews-Hanna, J. C., Head, J. W., Johnson, B. C., Keane, J. T., Kiefer, W. S., McGovern, P. J., et al. (2018). Ring faults and ring dikes around the Orientale basin on the Moon. Icarus 310, 1–20. doi:10.1016/j.icarus.2017.12.012
Goossens, S., Sabaka, T. J., Wieczorek, M. A., Neumann, G. A., Mazarico, E., Lemoine, F. G., et al. (2020). High-resolution gravity field models from GRAIL data and implications for models of the density structure of the Moon's crust. J. Geophys. Res. Planets 125 (2), e2019JE006086. doi:10.1029/2019je006086
Hansen, P. C., and O’Leary, D. P. (1993). The use of the L-curve in the regularization of discrete ill-posed problems. SIAM J. Sci. Comput. 14 (6), 1487–1503. doi:10.1137/0914086
Head, J. W. (2010). Transition from complex craters to multi-ringed basins on terrestrial planetary bodies: scale-dependent role of the expanding melt cavity and progressive interaction with the displaced zone. Geophys. Res. Lett. 37 (2). doi:10.1029/2009gl041790
Heck, B., and Seitz, A. (2007). A comparison of the tesseroid, prism and point-mass approaches for mass reductions in gravity field modelling. J. Geod. 81 (2), 121–136. doi:10.1007/s00190-006-0094-0
Hou, Z. Z., Yang, W. C., and Liu, J. Q. (1998). Multiscale inversion of the density contrast within the crust of China. Acta Geophys. Sin. 41, 641–651.
Ji, J., Head, J. W., and Liu, J. (2021). Pre-Orientale southwest peak-Ring Basin: gravity structure, geologic characteristics, and influence on Orientale Basin ring formation and ejecta emplacement. Remote Sens. 13 (13), 2635. doi:10.3390/rs13132635
Jiang, W., Zhang, J., Tian, T., and Wang, X. (2012). Crustal structure of Chuan-Dian region derived from gravity data and its tectonic implications. Phys. Earth Planet. Interiors 212, 76–87. doi:10.1016/j.pepi.2012.07.001
Johnson, B. C., Blair, D. M., Collins, G. S., Melosh, H. J., Freed, A. M., Taylor, G. J., et al. (2016). Formation of the Orientale lunar multiring basin. Science 354 (6311), 441–444. doi:10.1126/science.aag0518
Jolliff, B. L., Gillis, J. J., Haskin, L. A., Korotev, R. L., and Wieczorek, M. A. (2000). Major lunar crustal terranes: surface expressions and crust-mantle origins. J. Geophys. Res. Planets 105 (E2), 4197–4216. doi:10.1029/1999je001103
Kattoum, Y. N., and Andrews-Hanna, J. C. (2013). Evidence for ring-faults around the Orientale basin on the Moon from gravity. Icarus 226 (1), 694–707. doi:10.1016/j.icarus.2013.06.025
Li, Y., and Oldenburg, D. W. (1998). 3-D inversion of gravity data. Geophysics 63 (1), 109–119. doi:10.1190/1.1444302
Li, Y., and Oldenburg, D. W. (2003). Fast inversion of large-scale magnetic data using wavelet transforms and a logarithmic barrier method. Geophys. J. Int. 152 (2), 251–265. doi:10.1046/j.1365-246x.2003.01766.x
Liang, Q., Chen, C., and Li, Y. (2014). 3-D inversion of gravity data in spherical coordinates with application to the GRAIL data. J. Geophys. Res. Planets 119 (6), 1359–1373. doi:10.1002/2014je004626
Liang, X., Ye, Z., Liu, L., and Liu, J. (2024). Recovering crustal thickness of the Moon from an extended Vening Meinesz-Moritz inversion. Adv. Space Res. 73 (4), 2232–2242. doi:10.1016/j.asr.2023.09.037
Mallat, S. G. (1989). A theory for multiresolution signal decomposition: the wavelet representation. IEEE Trans. pattern analysis Mach. Intell. 11 (7), 674–693. doi:10.1109/34.192463
Melosh, H. J., and McKinnon, W. B. (1978). The mechanics of ringed basin formation. Geophys. Res. Lett. 5 (11), 985–988. doi:10.1029/gl005i011p00985
Neumann, G. A. (2011). LRO moon laser altimeter 4 GDR V1. 0. NASA Planetary Data System, 13. doi:10.17189/1520642
Oldenburg, D. W. (1974). The inversion and interpretation of gravity anomalies. Geophysics 39 (4), 526–536. doi:10.1190/1.1440444
Parker, R. L. (1973). The rapid calculation of potential anomalies. Geophys. J. Int. 31 (4), 447–455. doi:10.1111/j.1365-246x.1973.tb06513.x
Potter, R. W. K., Kring, D. A., Collins, G. S., Kiefer, W. S., and McGovern, P. J. (2013). Numerical modeling of the formation and structure of the Orientale impact basin. J. Geophys. Res. Planets 118 (5), 963–979. doi:10.1002/jgre.20080
Roberts, J. H., and Arkani-Hamed, J. (2012). Impact-induced mantle dynamics on Mars. Icarus 218 (1), 278–289. doi:10.1016/j.icarus.2011.11.038
Schultz, P. H., Orphal, D. L., Miller, B., Borden, W. F., and Larson, S. A. (1981). Multi-ring basin formation: possible clues from impact cratering calculations. Pergamon Press.
Smith, D. E., Zuber, M. T., Neumann, G. A., Lemoine, F. G., Mazarico, E., Torrence, M. H., et al. (2010). Initial observations from the lunar orbiter laser altimeter (LOLA). Geophys. Res. Lett. 37 (18). doi:10.1029/2010gl043751
Spector, A., and Grant, F. S. (1970). Statistical models for interpreting aeromagnetic data. Geophysics 35 (2), 293–302. doi:10.1190/1.1440092
Stewart, S. T. (2011). “Impact basin formation: the mantle excavation paradox resolved,” in 42nd annual lunar and planetary science conference, The Woodlands, Texas, March 7–11, 2011, 1633.
Whitten, J., Head, J. W., Staid, M., Pieters, C. M., Mustard, J., Clark, R., et al. (2011). Lunar mare deposits associated with the Orientale impact basin: new insights into mineralogy, history, mode of emplacement, and relation to Orientale Basin evolution from Moon Mineralogy Mapper (M3) data from Chandrayaan-1. J. Geophys. Res. Planets 116 (E6), E00G09. doi:10.1029/2010je003736
Wieczorek, M. A., Neumann, G. A., Nimmo, F., Kiefer, W. S., Taylor, G. J., Melosh, H. J., et al. (2013). The crust of the Moon as seen by GRAIL. Science 339 (6120), 671–675. doi:10.1126/science.1231530
Xu, C., Liu, Z., Luo, Z., Wu, Y., and Wang, H. (2017). Moho topography of the Tibetan Plateau using multi-scale gravity analysis and its tectonic implications. J. Asian Earth Sci. 138, 378–386. doi:10.1016/j.jseaes.2017.02.028
Xu, C., Luo, Z., Sun, R., Zhou, H., and Wu, Y. (2018). Multilayer densities using a wavelet-based gravity method and their tectonic implications beneath the Tibetan Plateau. Geophys. J. Int. 213 (3), 2085–2095. doi:10.1093/gji/ggy110
Yu, H., Wang, G., Xu, C., Chai, Y., Bie, L., and Cui, L. (2024). Insight into three-dimensional structure of the lunar crust and upper mantle in the Mare Crisium from gravity imaging. Adv. Space Res. 74, 1378–1391. doi:10.1016/j.asr.2024.04.061
Yu, H., Xu, C., Wu, Y., Li, J., Jian, G., and Xu, M. (2023). Fine structure of the lunar crust and upper mantle in the mare serenitatis derived from gravity multi-scale analysis. Front. Astronomy Space Sci. 10, 1109714. doi:10.3389/fspas.2023.1109714
Zhao, G., Liu, J., Chen, B., Kaban, M. K., and Du, J. (2021). 3-D density structure of the lunar mascon basins revealed by a high-efficient gravity inversion of the GRAIL data. J. Geophys. Res. Planets 126 (5), e2021JE006841. doi:10.1029/2021je006841
Keywords: density structure, crust-mantle interface, gravity, Mare Orientale, multi-ring basin
Citation: Yu H, Wen M, Xu C and He Q (2025) The three-dimensional structure of crust and upper mantle in Mare Orientale from gravity inversion. Front. Earth Sci. 13:1592835. doi: 10.3389/feart.2025.1592835
Received: 13 March 2025; Accepted: 19 May 2025;
Published: 18 June 2025.
Edited by:
Jinsong Ping, Chinese Academy of Sciences (CAS), ChinaReviewed by:
Umberto Fracassi, National Institute of Geophysics and Volcanology (INGV), ItalyDale Bird, Consultant, Houston, TX, United States
Copyright © 2025 Yu, Wen, Xu and He. This is an open-access article distributed under the terms of the Creative Commons Attribution License (CC BY). The use, distribution or reproduction in other forums is permitted, provided the original author(s) and the copyright owner(s) are credited and that the original publication in this journal is cited, in accordance with accepted academic practice. No use, distribution or reproduction is permitted which does not comply with these terms.
*Correspondence: Mingming Wen, MzI3MzE4NTVAcXEuY29t; Chuang Xu, Y2h1YW5neHVAZ2R1dC5lZHUuY24=