 Wenkun Wu
 Huajie Yang2
- 1College of Horticulture and Landscape Architecture, Zhongkai University of Agriculture and Engineering, Guangzhou, China
- 2Institute of Urban and Sustainable Development, City University of Macau, Macau, China
- 3College of Architectural Engineering, Guangdong Baiyun University, Guangzhou, China
Ecosystem services (ESs) in rapidly urbanizing regions are undergoing significant spatiotemporal changes driven by urban sprawl. However, existing studies have insufficiently addressed the heterogeneity of ESs, particularly the dynamic interactions between ecological processes and regional environmental conditions. This study focuses on eastern Guangdong, China, and quantifies four key ESs—carbon storage (CS), habitat quality (HQ), soil retention (SR), and water retention (WR)—from 2000 to 2020 using the InVEST model. The spatial heterogeneity of natural and socioeconomic drivers was examined through a multi-scale geographically weighted regression (MGWR) model. Ecological zones were delineated using Self-Organizing Map—Fuzzy C-Means (SOM-FCM) clustering, followed by zonal statistical analysis. Overall, ESs exhibited a declining trend over two decades, with SR and WR decreasing by 23.4% and 18.6%, respectively, while CS and HQ remained relatively stable. A distinct north–south gradient was identified, with stronger ES performance in the mountainous north. NDVI consistently showed the strongest positive influence in central regions; precipitation (PRE) and temperature (TEMP) fluctuated sharply in the north; population pressure peaked in the north and turned negative in the south by 2020; GDP had a positive effect in the east but a negative effect in the west; slope exerted the greatest influence in eastern areas; and the east–west elevation difference gradually weakened. Four ecological zones were identified: Protection, Conservation, Improvement, and Control. Between 2000 and 2020, Control Zones expanded significantly due to intensified urbanization, while the other three zones contracted. These findings highlight the urgent need for zone-specific strategies: strict conservation in Protection Zones, ecosystem restoration in Conservation Zones, ecological connectivity and low-impact use in Improvement Zones, and compact urban development in Control Zones. The proposed framework provides a transferable approach for capturing the spatial dynamics of ESs and supporting adaptive ecological management in fast-urbanizing regions.
1 Introduction
Ecosystem services (ES) refer to the products and benefits that ecosystems continuously provide to human society through their structures and processes (Daily et al., 2000). Specifically, ecosystems satisfy diverse human needs for environmental conditions, resources, and spiritual wellbeing by providing food, water resources, climate regulation, and cultural values (Costanza et al., 1997). Therefore, ES are not only vital links between natural ecosystems and human societies but also essential components for achieving sustainable development (Liu et al., 2020). However, rapid economic growth and accelerated urbanization have significantly altered land use patterns, thereby affecting the structure and functions of ecosystems (Bryan, 2013; Aslam et al., 2024a). Overexploitation of land resources and habitat fragmentation have led to a decline in the capacity of ecosystems to provide services, further aggravating ecological vulnerability in urbanizing regions (Xie et al., 2024a). In urban areas, the competition for land and resources among stakeholders often intensifies trade-offs between different ES, undermining synergies and further threatening the health and stability of ecosystem (Cord et al., 2017). Additionally, the combined effects of human activities and climate change impose more complex uncertainties and risks on ecosystems (Huang et al., 2024; Naz et al., 2024). How to utilize ES as a basis for ecological zoning and implement region-specific management strategies has become a critical issue in sustainable development research (Dai et al., 2024).
To address the complexity of ES assessment and the diversity of their driving mechanisms, research has evolved from single-variable analyses to integrated, multi-factor, and multi-scale spatial approaches, leading to the development of various quantitative models and technical tools. Among these, the InVEST model has gained prominence for its high accuracy and versatility in ES evaluation (Veerkamp et al., 2023; Wang et al., 2023). This modular tool excels in multi-scale and multi-scenario analyses, finding wide application in regional ecological assessments, urban ecosystem management, and land-use planning. For instance, InVEST has been employed to quantify water supply and yield (Liu et al., 2024; Zhang et al., 2024), predict carbon storage changes (Gao et al., 2023), evaluate the impacts of land-use changes on carbon emissions and storag (Li et al., 2023), assess urban cooling and regulatory services (Lan et al., 2025), and develop decision-support frameworks for ecosystem protection (Córdoba Hernández and Camerin, 2024). These applications underscore InVEST’s role in providing a robust scientific foundation to tackle challenges posed by urbanization, climate change, and ecological degradation. Concurrently, rapid socioeconomic development has profoundly altered ecosystem structure and function, prompting a shift in driving mechanism studies from linear to spatial perspectives to capture the spatiotemporal heterogeneity of ES. Early studies using linear methods highlighted the dominant role of natural factors, such as precipitation driving ES relationships in arid regions (Hao et al., 2019) and forest and cropland expansion positively influencing net primary productivity and soil conservation (Li et al., 2021). However, linear approaches often failed to capture the heterogeneity of driving factors. Subsequent research adopted spatial analyses, revealing the growing influence of socioeconomic factors and their regional variations. For example, socioeconomic factors indirectly affected urban green space ES, while ES in suburban Nanjing exhibited trade-off/synergy dynamics (Yang et al., 2023). In the Pearl River Delta, human factors like population exerted stronger effects (Wang et al., 2023), whereas in Guangdong, urbanization reduced carbon storage and habitat quality, yet northern water yield increased due to higher precipitation (Wu et al., 2024). Multi-Scale Geographically Weighted Regression (MGWR) models further confirmed the spatial heterogeneity of ES relationships driven by topography and urbanization (Zhang et al., 2020). Overall, while natural factors consistently influence ES dynamics, human-induced factors exhibit varying impacts across regions and scale (Wang et al., 2023; Aslam et al., 2024b), providing critical scientific insights for ecological management and spatial planning. The marked spatiotemporal heterogeneity of ES in rapidly urbanizing regions underscores the need for region-specific management strategies. While natural drivers—precipitation regimes, vegetation dynamics, and topography—continue to shape ES patterns, their influence is increasingly overshadowed by socioeconomic forces in urban contexts. Population expansion, land-use intensification, and urban sprawl have emerged as dominant and spatially variable factors, introducing complex interactions that challenge traditional ecological planning frameworks.
ES are subject to long-term differentiation and formation due to the combined influence of socio-ecological factors, resulting in spatially heterogeneous patterns of functionality and provisioning capacity across region (Liu et al., 2019). This differentiation arises from the interplay of natural factors and human activities, driving distinct ecological characteristics in different areas (Aslam et al., 2023; Zeng et al., 2023). Consequently, ecological zoning has emerged as a pivotal spatial planning tool to identify and manage the supply-demand dynamics and spatial distribution of ES. From a technical perspective, ecological zoning fundamentally involves clustering spatial units, serving as a critical approach in geographical partitioning (Lin et al., 2024). Among the simplest methods is K-means clustering, which delineates functional zones by minimizing intra-cluster variance (Liu et al., 2019). More advanced techniques, such as Self-Organizing Maps with Fuzzy C-Means (SOM-FCM), leverage neural network algorithms to capture nonlinear relationships within ES bundles, as demonstrated by Li C. et al. (2024); Li J. et al. (2024); Li K. et al. (2024) in delineating supply-demand patterns in Hangzhou. Additionally, the Natural Breaks (Jenks) method, valued for its high aggregation and low diversity, is often employed to refine zoning outcomes (Liu et al., 2020), while the four-quadrant model elucidates spatial heterogeneity through two-dimensional supply-demand classification (Jiang et al., 2024). Regression-based approaches, such as those defining zoning thresholds via the relationship between the ecological supply-demand ratio and land use proportion, are also prevalent. Ecological zoning not only facilitates ecological conservation and restoration but also provides a foundation for achieving supply-demand balance and sustainable spatial governance (Zeng et al., 2023). Technologically, zoning methodologies are evolving from basic clustering to sophisticated frameworks incorporating multi-scale and multidimensional data, offering robust support for refined ecological management.
Although ecological zoning has been widely studied, there remains a critical gap in integrating ES with their spatiotemporal heterogeneity (Xu et al., 2022). Most existing studies conduct zoning based on a single time point or static snapshots (Chen et al., 2024), neglecting the evolving nature of ecological processes and their interactions with diverse environmental conditions, which limits the ability to diagnose dynamic regional ecological issues (Liu et al., 2024). Moreover, traditional zoning approaches often rely on linear models, which fail to capture the complex, non-stationary effects of heterogeneous natural and socioeconomic drivers (Xiong et al., 2024). Addressing these limitations, this study introduces a combined framework using Multi-Scale MGWR and SOM-FCM to analyze the spatiotemporal non-stationarity of ES and identify ecological zones based on both temporal dynamics and spatial differentiation. This approach not only improves the scientific rigor of ecological zoning but also provides a robust decision-support basis for adaptive ecological management in rapidly urbanizing regions such as eastern Guangdong.
To address the aforementioned research gaps, this study focuses on eastern Guangdong Province as a case study, quantifying the spatiotemporal dynamics of four ES—soil retention (SR), water retention (WR), habitat quality (HQ), and carbon storage (CS)—from 2000 to 2020. Initially, the MGWR model is employed to investigate the spatially and temporally varying impacts of influencing factors on ES. Subsequently, SOM-FCM clustering approach is applied to delineate ecological zones based on the four ES, uncovering zoning evolution patterns over the study period. Finally, MGWR regression coefficients are analyzed within these zones to quantify regional differences in driving factor influences. This study pursues three objectives: (1) to quantify the spatiotemporal variations of ES from 2000 to 2020 and identify their dominant natural and socioeconomic drivers using InVEST and MGWR; (2) to investigate the spatial delineation and temporal transformation of ecological zones, and reveal how different drivers shape zonal differentiation through clustering and comparative analysis; and (3) to integrate ecological characteristics and driver profiles of each zone to formulate region-specific, evidence-based policy recommendations for ecological zoning management.
2 Materials and methods
2.1 Study area
Eastern Guangdong (22°30′N–25°05′N, 114°50′E−117°20′E), located in the eastern part of Guangdong Province, China, encompasses four prefecture-level cities: Chaozhou, Shantou, Jieyang, and Meizhou. The region serves as a crucial ecological barrier for the province, owing to its mountainous terrain, high forest coverage, and diverse ecological functions (Figure 1). The area features a subtropical monsoon climate with 1,500–2000 mm annual precipitation and rising elevation from coastal plains to inland mountains (up to 1,500 m). The region is ecologically significant, with extensive forest coverage, rich biodiversity, and key ES. This study focuses on four key ES—CS, HQ, SR, and WR—as they represent the region’s most ecologically sensitive and policy-relevant functions (Chen et al., 2021). They are directly impacted by land use change and are central to regional conservation and compensation strategies. Rapid urbanization over the past two decades has transformed land use patterns, leading to built-up expansion, forest degradation, and biodiversity loss (Wu et al., 2024). Eastern Guangdong exhibits strong spatial contrasts in socioeconomic development. While Shantou and Jieyang have experienced rapid industrialization and urban expansion, Meizhou remains relatively underdeveloped with a predominantly agricultural economy. The population density and GDP per capita vary considerably across the region, resulting in uneven ecological pressures and land-use demands. A systematic assessment of ES and their drivers is essential for managing ecological risks, guiding compensation mechanisms, and supporting sustainable planning (Jiang et al., 2024).
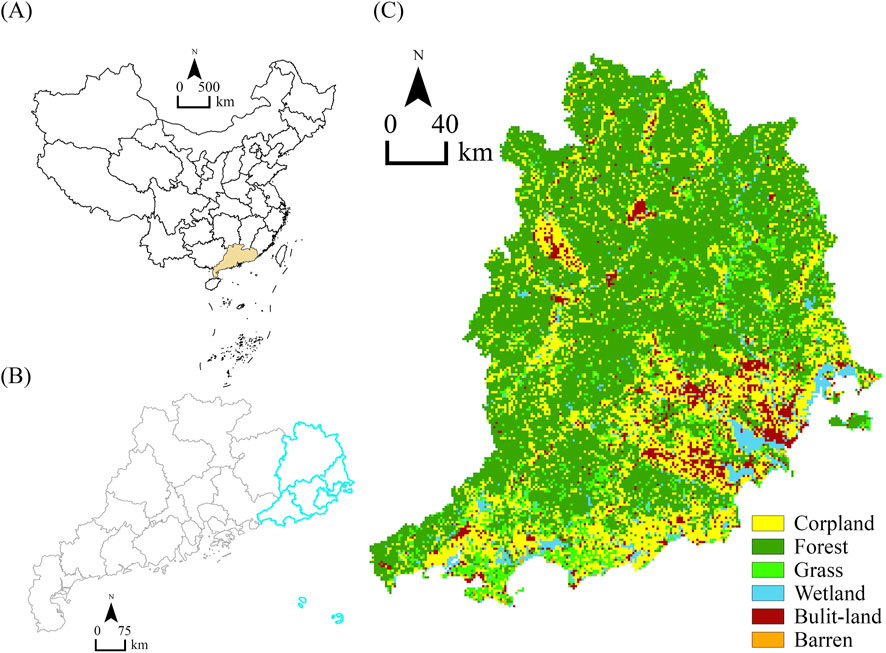
Figure 1. Geography of the study region. (A) Location of the Guangdong in China; (B) Study Area Location of Guangdong; (C) Land use map of eastern Guangdong in 2020.
2.2 Data sources
This study integrates multi-source datasets to support the spatiotemporal modeling of ES from 2000 to 2020 in eastern Guangdong. The datasets used in this study are summarized in Table 1. Land use/land cover (LUCC) maps were derived from Landsat imagery and provided as 1 km raster files. DEM data from NASA’s SRTM was used to derive topographic attributes such as slope and flow accumulation using terrain analysis tools. Climate variables, including precipitation (PRE), temperature (TEMP), and potential evapotranspiration (PET), were interpolated to 1 km resolution. Soil texture and organic matter content were retrieved from national soil databases and processed into continuous raster surfaces. NDVI data from MODIS were smoothed and corrected to capture vegetation dynamics over time. Socioeconomic variables (POP and GDP) were provided as 1 km resolution gridded data, preprocessed by RESDC-CAS based on statistical records. All datasets were projected to WGS84 and resampled to a consistent spatial resolution using ArcGIS Pro for spatial alignment.
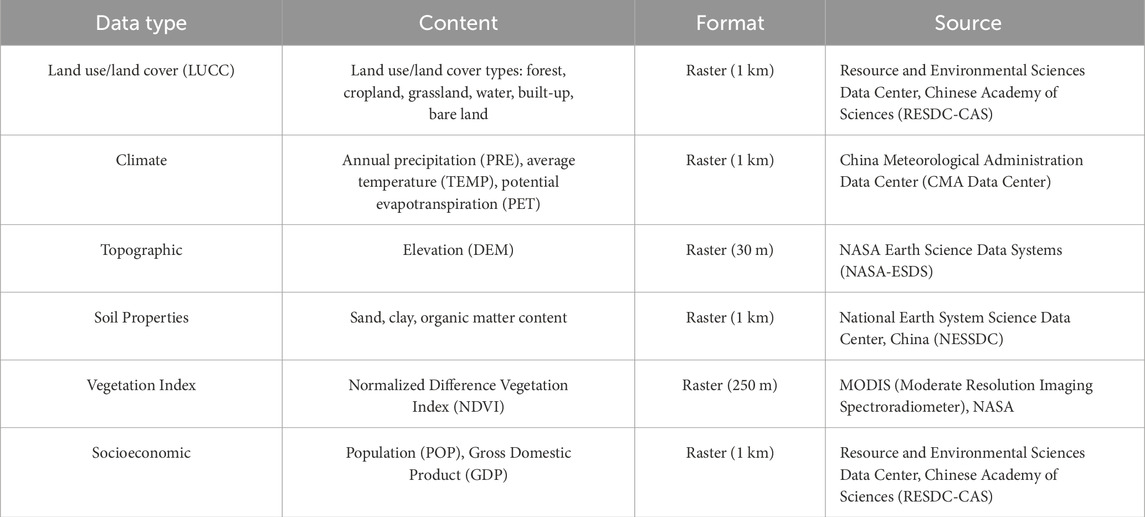
Table 1. Data description and sources.
2.3 Research methodology
2.3.1 Study design
This study investigates the spatiotemporal dynamics of ES and their influencing factors in eastern Guangdong from 2000 to 2020 (Figure 2), aiming to inform ecological zoning and spatial management. The research framework consists of three sequential stages. First, four key ES—CS, HQ, SR, and WR—were quantified using the InVEST and RUSLE model. These services were then normalized and integrated to construct a composite ES index. Second, the MGWR model was employed to explore the spatial heterogeneity of influencing factors on the integrated ES, incorporating meteorological variables (PRE and TEMP), topographic features (SLOPE and DEM), vegetation cover (NDVI), and socioeconomic indicators (POP and GDP). Third, the SOM-FCM clustering approach was applied to classify regional ES response patterns based on driving factor characteristics, enabling the delineation of ecological zones. Subsequently, a zonal statistics tool was used to summarize and compare the MGWR-derived coefficients of each influencing factor across the different ecological zones, thereby identifying dominant drivers and regional management priorities.
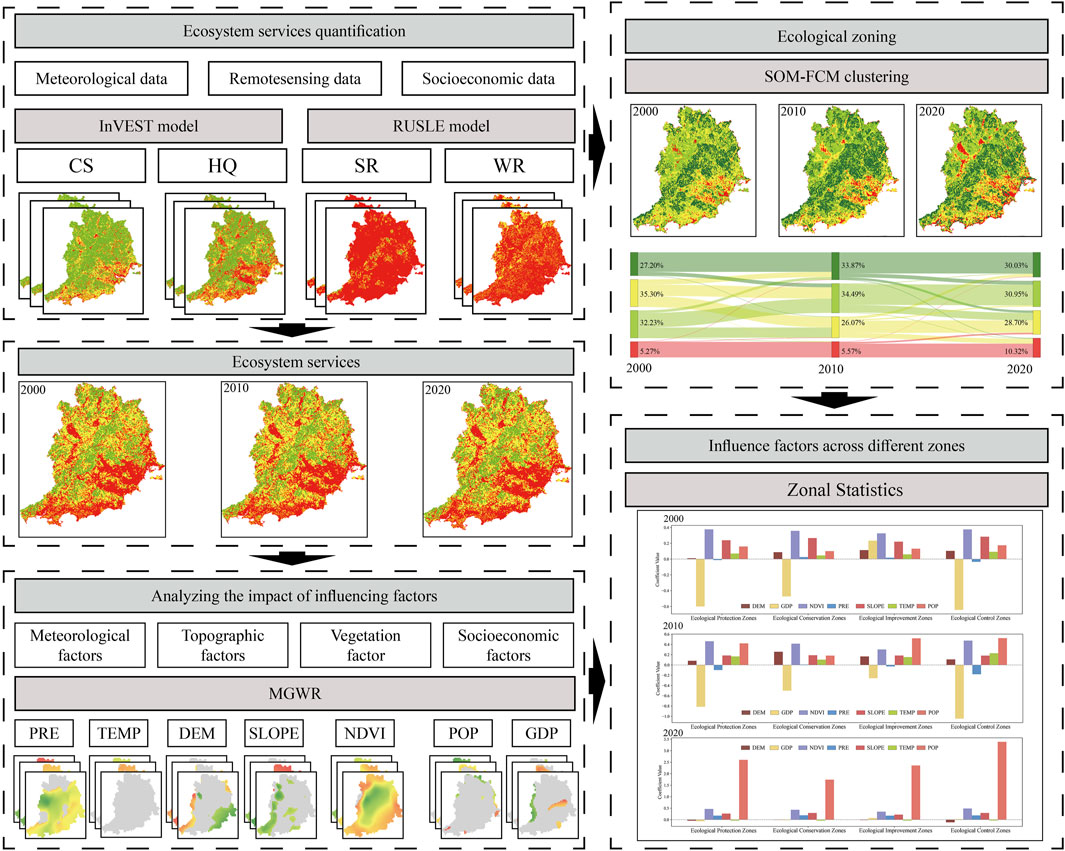
Figure 2. Analysis scheme of the study. (CS: carbon storage; HQ: habitat quality; SR: Soil retention; WR: Water retention and ES: Ecosystem services; PRE: Precipitation; TEMP: Temperature; DEM: Elevation; SLOPE: Slope; POP: Population; GDP: Gross Domestic Product; NDVI: Normalized Difference Vegetation Index).
2.3.2 Ecosystem service quantification
2.3.2.1 Carbon storage (CS)
CS was estimated using the carbon module of the InVEST model, based on land use/land cover (LULC) raster data and carbon density parameters. The total carbon storage consists of four components: aboveground biomass, belowground biomass, soil, and dead organic matter) The calculation formula is as follows (Equation 1):
where
2.3.2.2 Habitat quality (HQ)
HQ was assessed using the habitat quality module of the InVEST model to analyze the impact of land use changes on biodiversity. HQ was calculated based on habitat suitability and ecological threat pressure as follows (Equation 2):
where
2.3.2.3 Soil retention (SR)
SR was estimated using a simplified approach based on the Universal Soil Loss Equation (USLE), calculated as the difference between potential soil erosion (RKLS) and actual soil erosion (USLE) (Rong et al., 2022). The calculation formula is as follows (Equations 3–5):
Where
Where
Where
Where
Where
Where
2.3.2.4 Water retention (WR)
Water retention was estimated using a hydrological model combining annual water yield and topographic correction factors (Nguyen et al., 2015) (Equation 12):
where Retention is water retention (mm);
where
where
2.3.3 Driving factor analysis
Considering the spatial heterogeneity of factors influencing ES, a single spatial scale is inadequate to fully capture the complex interactions involved. Therefore, this study adopts the MGWR model to analyze the spatially variable impacts of different factors on key (Fotheringham et al., 2017). Previous studies have demonstrated that MGWR outperforms Ordinary Least Squares and traditional Geographically Weighted Regression in capturing spatial heterogeneity of influencing factors on ES (Wu et al., 2025), offering deeper insights into underlying ecological processes. By allowing each variable to have its own optimal bandwidth, MGWR better reflects the spatially varying mechanisms and ecological processes underlying ES dynamics. This multiscale heterogeneity is essential for understanding localized versus regional influences, thereby enhancing the ecological interpretability of the results. The MGWR model’s strength lies in allowing explanatory variables to exert influence across different spatial scales, thereby providing a more nuanced understanding of the spatial relationships between factors and ES. The model is expressed as follows (Equation 15):
where:
2.3.4 Ecological zoning approach
The ecological zoning in this study employs a hybrid clustering framework integrating the Self-Organizing Map (SOM) neural network with the Fuzzy C-Means (FCM) algorithm, termed SOM-FCM, to achieve robust and refined partitioning of ecological units. The optimal number of ecological zones was determined prior to clustering by evaluating clustering quality using the fuzzy partition coefficient (FPC) and the silhouette coefficient (SC), which are widely used to assess cluster separation and compactness. This method unfolds in three key phases (Li C. et al., 2024). First, a dataset of zoning indicators is compiled from raster inputs, followed by preprocessing using z-score standardization. This normalization step ensures equitable weighting of all variables by mitigating the influence of disparate scales, thereby preventing bias toward any single indicator during clustering. Second, the standardized dataset is processed through a SOM neural network to group ecological units based on the similarity of their indicator profiles. The SOM is structured with a two-dimensional grid of neurons, where various topological configurations are tested and trained independently. The optimal topology is determined by minimizing both topological and quantization errors, with a neuron grid identified as the most effective structure in this analysis. Third, the resulting SOM weight vectors serve as inputs to the FCM algorithm, which enhances cluster delineation by accommodating overlapping boundaries and assigning fuzzy memberships. This step refines the clustering output, producing a raster-based result that is subsequently post-processed in ArcGIS using majority filtering to remove minor speckles and improve map interpretability. The SOM computations and visualizations were implemented using the SOMPY Python library, offering a versatile and efficient platform for executing this hybrid SOM-FCM approach. This methodology ensures a scientifically sound and spatially explicit representation of ecological zones, suitable for advanced environmental analysis.
3 Results
3.1 Spatiotemporal analysis of ecosystem services
The analysis revealed that the distribution of ES in eastern Guangdong exhibited pronounced spatial heterogeneity from 2000 to 2020, with the spatial distribution pattern remaining relatively stable overall (Figure 3; Table 2). Specifically, CS demonstrated significant spatial heterogeneity, with the total decreasing from 1.11 × 10⁶ t in 2000 to 1.10 × 10⁶ t in 2020, a decline of approximately 0.9%. The mean CS fluctuated slightly from 35.98 to 35.80 t/km2. Spatially, CS values were higher in the northern mountainous regions, attributed to approximately 50% forest coverage and diverse vegetation types, while they were lower in the southern coastal plain, primarily due to the adverse effects of urbanization and cropland expansion. In terms of HQ, the values remained relatively stable but showed a slight decline, with the mean decreasing from 0.79 in 2000 to 0.78 in 2020, a reduction of approximately 1.3%, while the median consistently remained at 0.89. Geographically, HQ was higher in the northern mountains, benefitting from well-preserved forests and grasslands, and lower in the southern coastal areas, driven by habitat degradation from urbanization.SR exhibited a significant declining trend, with the total reducing from 4.67 × 10⁶ t to 3.58 × 10⁶ t, a decrease of approximately 23.4%, while the mean dropped from 150.86 to 116.16 t/km2. This pattern was consistent with topographic and land cover variations: SR was higher in the northern mountains due to steep terrain and robust vegetation cover, and lower in the southern plains, influenced by rainfall erosion and land development. Similarly, WR showed a continuous decline, with the total decreasing from 2.79 × 106 mm to 2.27 × 106 mm, a reduction of approximately 18.6%; the mean WR declined from 90.51 to 73.71 mm/km2. WR was higher in the northern mountains, driven by abundant annual precipitation and topographic regulation, and lower in the southern coastal areas, affected by evapotranspiration and urbanization pressures. Finally, the integrated ES exhibited minimal variation, with the mean ranging from 0.42 to 0.40 over 2000–2020, and the median and maximum remaining stable. Nevertheless, a consistent spatial gradient persisted, with higher values in the northern mountainous regions and lower values in the southern coastal areas, indicating stronger ecological functionality in the north compared to the south.
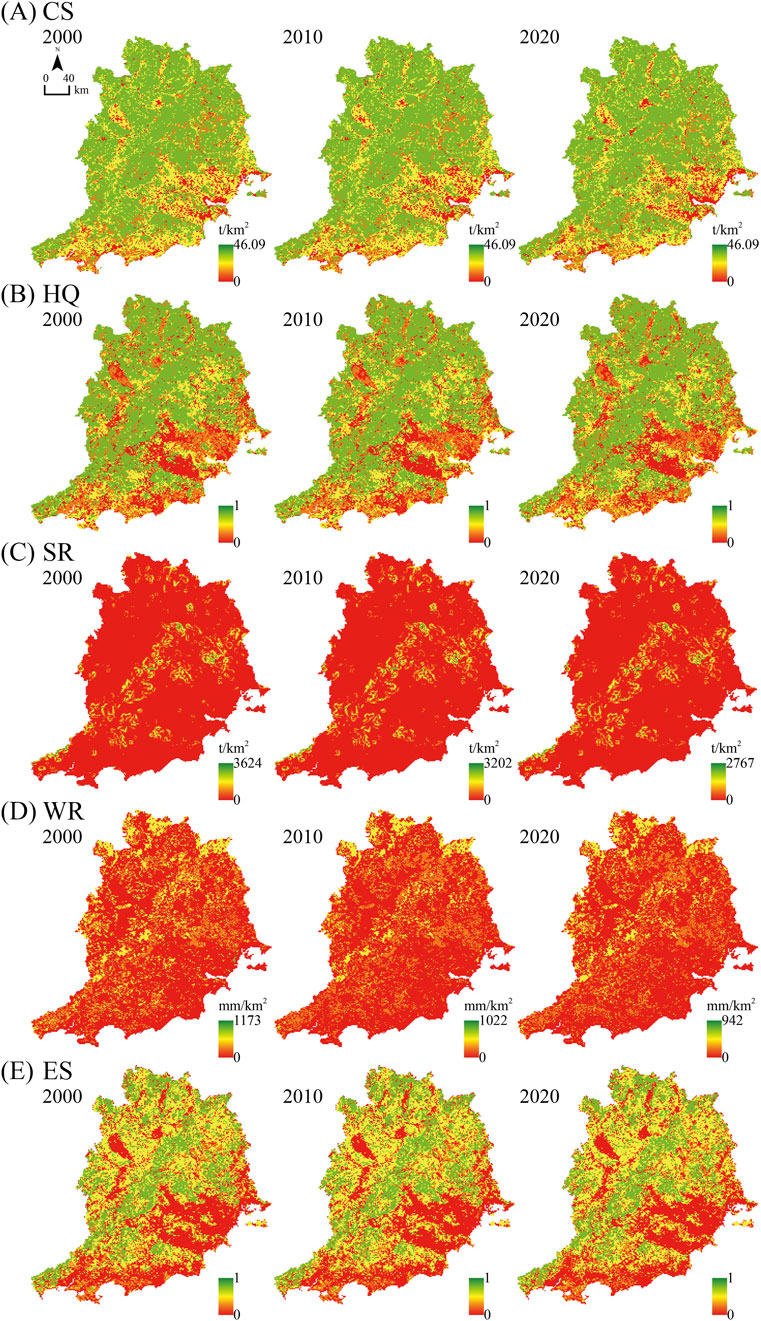
Figure 3. Spatial distribution of ES between 2000 and 2020. (A) CS; (B) HQ; (C) SR; (D) WR; (E) ES (CS: carbon storage; HQ: habitat quality; SR: Soil retention; WR: Water retention and ES: Ecosystem services).
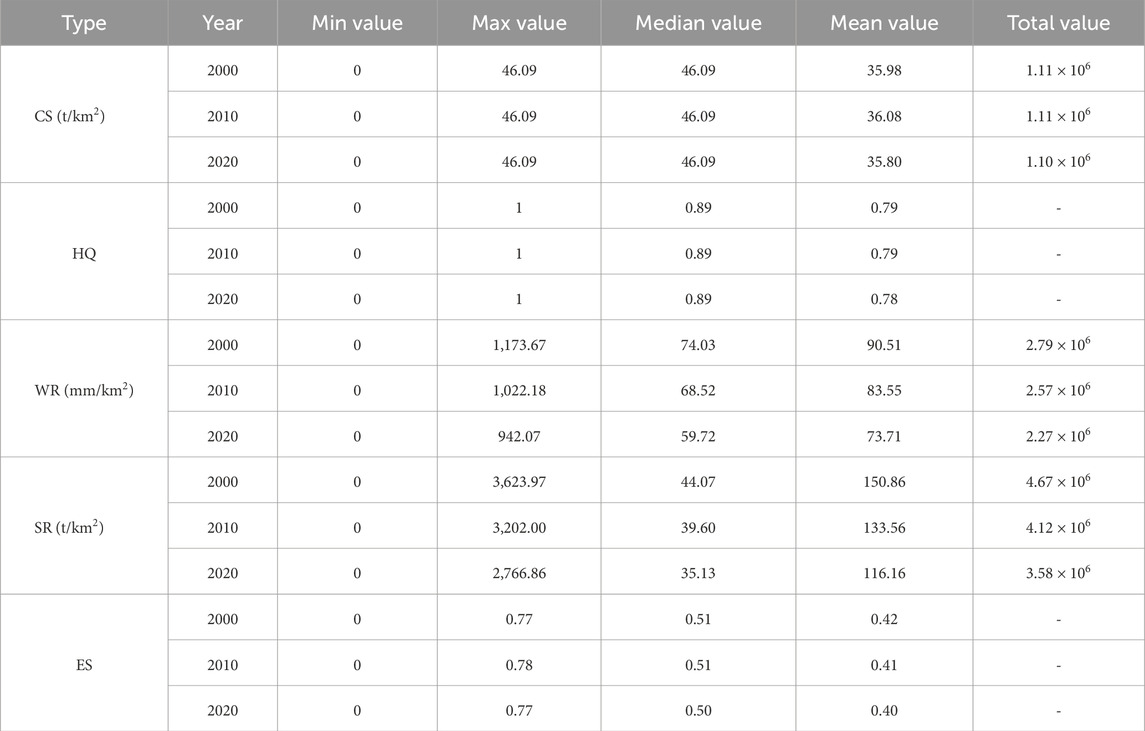
Table 2. Temporal statistics of ES.
3.2 Spatial heterogeneity of driving factors
3.2.1 Model performance and validation
To investigate the driving factors of ES changes in eastern Guangdong from 2000 to 2020, this study employed the MGWR model, analyzing spatial heterogeneity of natural and socioeconomic factors at a 5 km grid resolution. MGWR captures spatial non-stationarity through localized regression, making it suitable for assessing the spatial variability of ES drivers. Model performance was evaluated using the Akaike Information Criterion (AIC) and R2 (Table 3), demonstrating that MGWR significantly OLS model and effectively reveals spatial heterogeneity. Over 2000–2020, the MGWR AIC decreased from 2,847.729 to 2,786.046, while R2 increased from 0.557 to 0.576, indicating an enhanced ability to explain spatial variations in ES drivers. In 2010, the AIC was 2,831.03 with an R2 of 0.562; by 2020, the AIC further improved to 2,786.046, and R2 reached 0.576, suggesting improved stability and precision in capturing spatial heterogeneity. The lower AIC and higher R2 confirm MGWR model suitability for ES analysis in eastern Guangdong, unveiling the spatially heterogeneous impacts of natural factors and human activities on ES, thereby providing a scientific basis for subsequent zoning management.
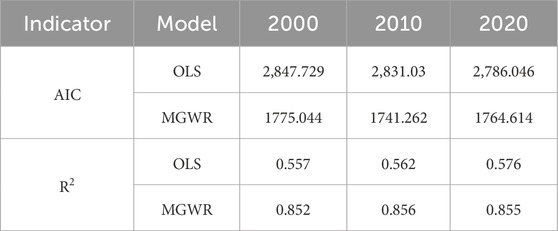
Table 3. Fitting results of the OLS and MGWR model.
Furthermore, MGWR bandwidth parameters quantify spatial non-stationarity for each driving factor (Table 4), reflecting their local influence range and variability. In 2000, NDVI (533) and PRE (458) exhibited larger bandwidths, indicating broader spatial impacts, whereas POP (362) and TEMP (222) showed narrower bandwidths, suggesting stronger local variability. By 2010, the SLOPE bandwidth increased significantly to 1,273, indicating heightened spatial non-stationarity, while PRE (268) and POP (50) bandwidths decreased, reflecting narrower influence ranges. In 2020, the TEMP bandwidth rose markedly to 1,359, while NDVI and SLOPE stabilized at 146 and 50, respectively, and POP and GDP bandwidths further narrowed to 22, revealing a concentration of socioeconomic factors spatial variability. These shifts validate MGWR model effectiveness in capturing spatial non-stationarity of ES drivers, providing a scientific foundation for refined ecological management.
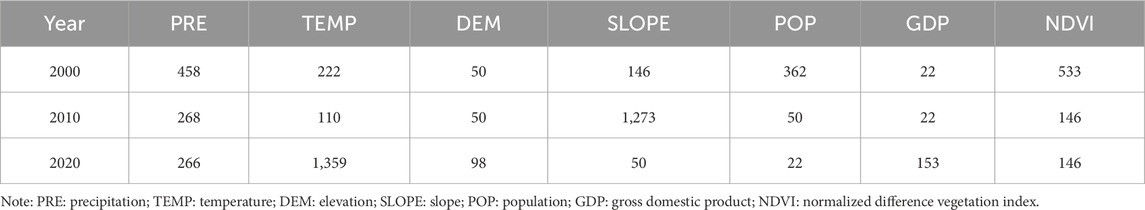
Table 4. Bandwidth of ES driving factors.
3.2.2 Spatiotemporal variability of drivers
Table 5 presents the changes in influence coefficients of various factors on ES in eastern Guangdong from 2000 to 2020. Over this period, natural factors exhibited increasingly complex impacts, socioeconomic factors demonstrated strengthened positive drives, and spatial non-stationarity was pronounced, with the NDVI consistently serving as a stable positive driver. The influence directions and intensities of PRE and TEMP fluctuated over time. PRE’s mean effect evolved from 0 in 2000 to −0.09 in 2010, then to 0.18 in 2020, reflecting its spatially non-stationary and temporally variable impact on ES. TEMP’s mean shifted from 0.07 in 2000 to 0.17 in 2010, then to −0.04 in 2020, transitioning from positive to negative, indicative of climate change’s complex influence. Among topographic factors, SLOPE maintained a positive effect but with varying variability, exhibiting spatial non-stationarity and temporal nonlinearity; DEM shifted from a positive mean of 0.08 in 2000 to a negative mean of −0.05 in 2020, with its standard deviation decreasing from 0.34 to 0.28, suggesting reduced variability. POP showed a progressive increase in influence, with its mean rising from 0.14 to 2.55 and standard deviation increasing from 0.20 to 2.83, indicating escalating pressure on ES from population growth and heightened spatial variability. GDP’s effect peaked at −0.72 in 2010, then turned neutral (mean 0) by 2020, with reduced variability (STD 0.29), suggesting that economic restructuring may mitigate its negative impacts on ES. NDVI’s positive influence consistently strengthened over the two decades, with its mean increasing from 0.36 to 0.44 and standard deviation rising from 0.06 to 0.14, demonstrating a stable and minimally non-stationary supportive role of vegetation cover on ES.
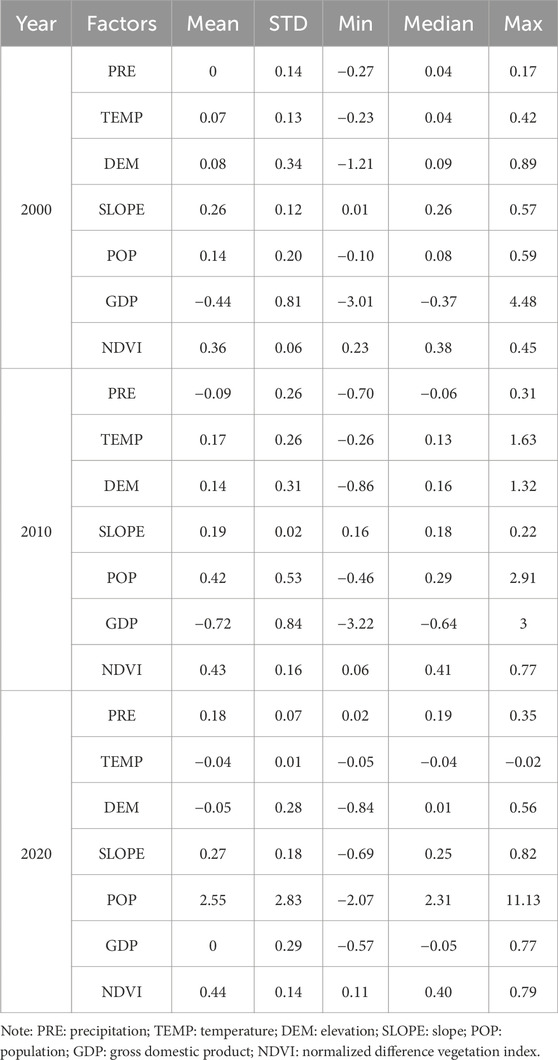
Table 5. The MGWR coefficients between ES driving factors.
From a spatial perspective (Figure 4), the driving factors of ES in eastern Guangdong exhibited pronounced spatial heterogeneity from 2000 to 2020. PRE showed a northern negative and southern positive influence pattern in 2000 and 2010, reflecting its suppression of ecological functions in the north and enhancement of water-related services in the south; by 2020, PRE shifted to a globally positive influence, though its effect became non-significant in the northern regions, indicating dynamic adjustments in the spatial scope and intensity of precipitation’s impact on ES. TEMP displayed considerable variation, with a positive correlation in the north and a negative correlation in the south in 2000, highlighting regional climatic disparities in ES drivers; by 2010, the positive influence in the north weakened and transitioned to negative, and by 2020, it became globally non-significant, reflecting nonlinear temporal changes in TEMP’s spatial influence on ES. DEM exhibited east-west differences, with negative correlations in the west and northeast and positive correlations in the south from 2000 to 2020, though this influence gradually weakened, suggesting a decreasing spatial non-stationarity of topographic effects on ES. SLOPE showed a predominantly positive influence in 2000, decreasing in intensity from southeast to northwest; in 2010, its influence was globally significant, consistent with the 2000 pattern; by 2020, the impact was concentrated in eastern areas, indicating dynamic spatial variability in slope’s effect on ES. POP exhibited a positive effect in the north from 2000 to 2010, decreasing toward the central region and remaining non-significant in the south; by 2020, the south developed a significant negative effect, while the north reached peak positive values, reflecting intensified regional pressures from population growth. GDP showed its largest significant negative effect in 2010; by 2020, it displayed east-west differences, with positive effects in the east and negative effects in the west, indicating spatially variable economic impacts on ES. NDVI remained globally significant with a positive influence from 2000 to 2020, decreasing in intensity from the central region outward, demonstrating a stable supportive role of vegetation cover on ES.

Figure 4. Quantitative effects of drivers in ES through MGWR between 2000 from 2020. (A) 2000; (B) 2010; (C) 2020. (PRE: Precipitation; TEMP: Temperature; DEM: Elevation; SLOPE: Slope; POP: Population; GDP: Gross Domestic Product; NDVI: Normalized Difference Vegetation Index).
3.3 Ecological zoning results
3.3.1 Spatial delineation and temporal dynamics
This study utilized the SOM-FCM clustering approach to analyze ES in eastern Guangdong from 2000 to 2020, identifying four ecological zones. The optimal number of clusters was determined based on two widely used clustering validation metrics, the fuzzy partition coefficient (FPC = 0.81) and the silhouette coefficient (SC = 0.65), indicating a clear and stable clustering structure. Figure 5’s stacked bar chart quantifies the mean ES values for each zone, revealing their functional characteristics. Cluster 1 zone maintained the highest ES levels over 2000–2020, with mean values of SR, WR, HQ, and CS significantly exceeding those of other zones, primarily distributed in the northern mountainous and central hilly areas. Its superior ecological functionality makes it suitable for priority conservation, thus named “Ecological protection zones.” Cluster 2 zone exhibited intermediate ES mean values, with robust SR but overall ES capacity lower than the cluster 1, distributed in the transitional areas between the north and central regions. Reflecting sub-optimal ecological functionality and influenced by partial land development, it is designated as “Ecological conservation zones” requiring maintenance of its ecological roles. Cluster 3 exhibited lower mean ES values and was primarily located in the central-southern plains, where ecological functionality is constrained by intensive urbanization and agricultural activities. However, it maintains a relatively high level of internal coordination among ES components, and is therefore designated as “Ecological improvement zones.” Cluster 4 exhibited the lowest mean ES values, indicating the weakest ecological service capacity. It is primarily located in southern coastal urbanized areas, where extensive land use change and rapid urban expansion have led to significant ecological degradation. Accordingly, it is designated as “Ecological control zones,” with a focus on ecological restoration.
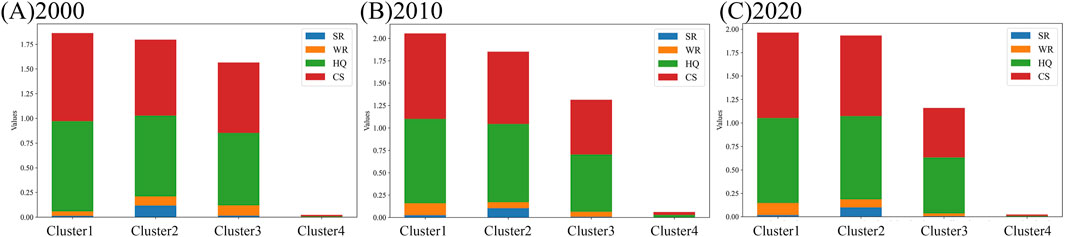
Figure 5. Mean ES values for each zone between 2000 from 2020. (A) 2000; (B) 2010; (C) 2020.
The spatiotemporal evolution of ecological zones, as illustrated in Figure 6, reveals significant structural transitions in eastern Guangdong from 2000 to 2020. Notably, Ecological control zones expanded continuously, increasing from 5.27% in 2000 to 10.32% in 2020, with their spatial pattern evolving from scattered to more reticulated and connected distributions. This expansion primarily occurred at the expense of Ecological improvement zones, indicating intensified anthropogenic disturbance and urban encroachment in previously moderate-function areas. Ecological improvement zones remained relatively stable in spatial position but decreased in area—from 32.23% to 28.70%—largely due to transformation into control zones in the southern and central regions. In the north, portions of Ecological conservation zones were downgraded to improvement zones, forming more cohesive but ecologically weakened patches. Consequently, the total area of Ecological conservation zones declined from 35.30% to 30.95%, accompanied by increased fragmentation caused by land development and ecological degradation. In contrast, Ecological protection zones showed notable expansion from 27.20% in 2000 to 33.87% in 2010, before stabilizing at 30.03% in 2020. This trend reflects enhanced ecological functionality in central and mountainous regions, where improved land management and ecological restoration efforts may have contributed to consolidated ecological integrity and increased spatial continuity.
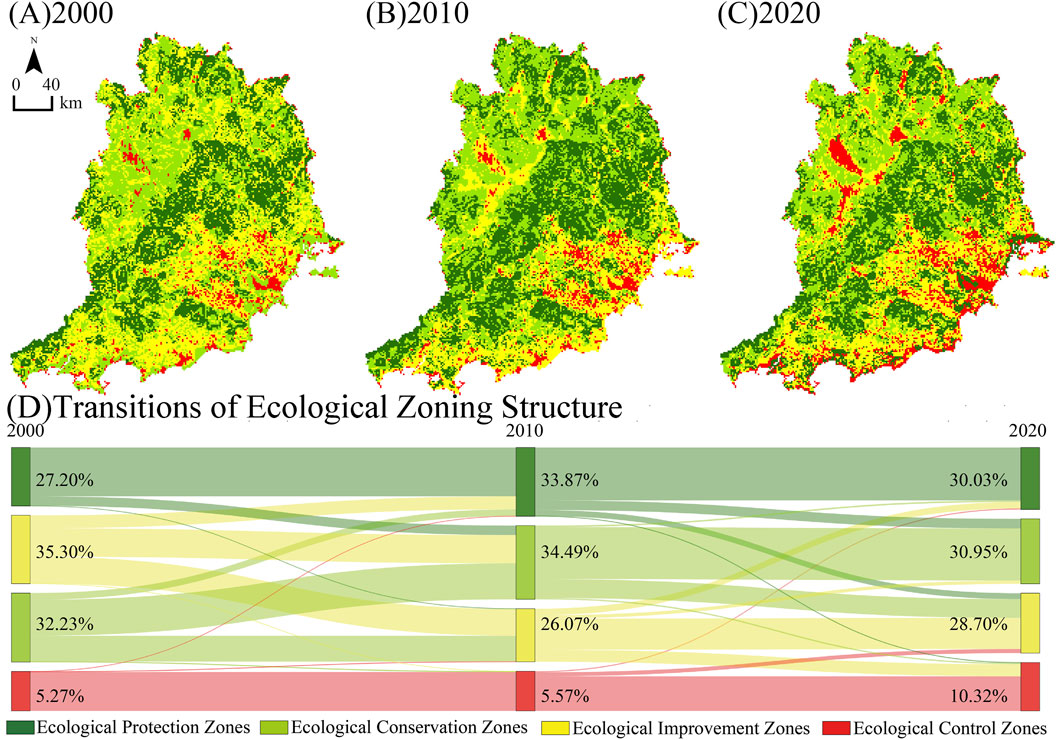
Figure 6. Spatiotemporal changes and structural transitions of ecological zones in eastern Guangdong from 2000 to 2020. (A) 2000; (B) 2010; (C) 2020; (D) Transitions of Ecological Zoning Structure.
3.3.2 Zonal differences in influencing factors
Figure 7 presents the mean influence coefficients of major driving factors across ecological zones using raster maps and bar charts, illustrating spatial distribution and temporal variation from 2000 to 2020. In 2000, the Ecological Protection Zones showed the highest positive NDVI coefficient (0.376), negative PRE (−0.013), and a strong negative GDP effect (−0.601). In the Ecological Conservation Zones, NDVI was 0.357, DEM was 0.087, and GDP was −0.473. The Ecological Improvement Zones had the highest DEM effect (0.114), NDVI at 0.326, and a positive GDP coefficient (0.233). The Ecological Control Zones displayed strong NDVI (0.375), DEM (0.104), and the most negative GDP (−0.644). In 2010, NDVI increased across all zones (0.302–0.474). POP became a positive factor, ranging from 0.182 to 0.519. GDP coefficients declined further, ranging from −0.258 to −0.815. In 2020, PRE turned positive across all zones (0.176–0.192). NDVI remained positive (0.349–0.487). POP values increased significantly (1.741–3.386), and GDP values moved toward neutrality or weakly positive (−0.063–0.074). NDVI remained a consistently positive factor (0.326–0.487) throughout the study period. PRE shifted from negative to positive. TEMP was mostly negative or non-significant. POP influence increased annually. GDP transitioned from negative to near-neutral or slightly positive. Driving factors varied significantly between zones, showing pronounced spatial non-stationarity.
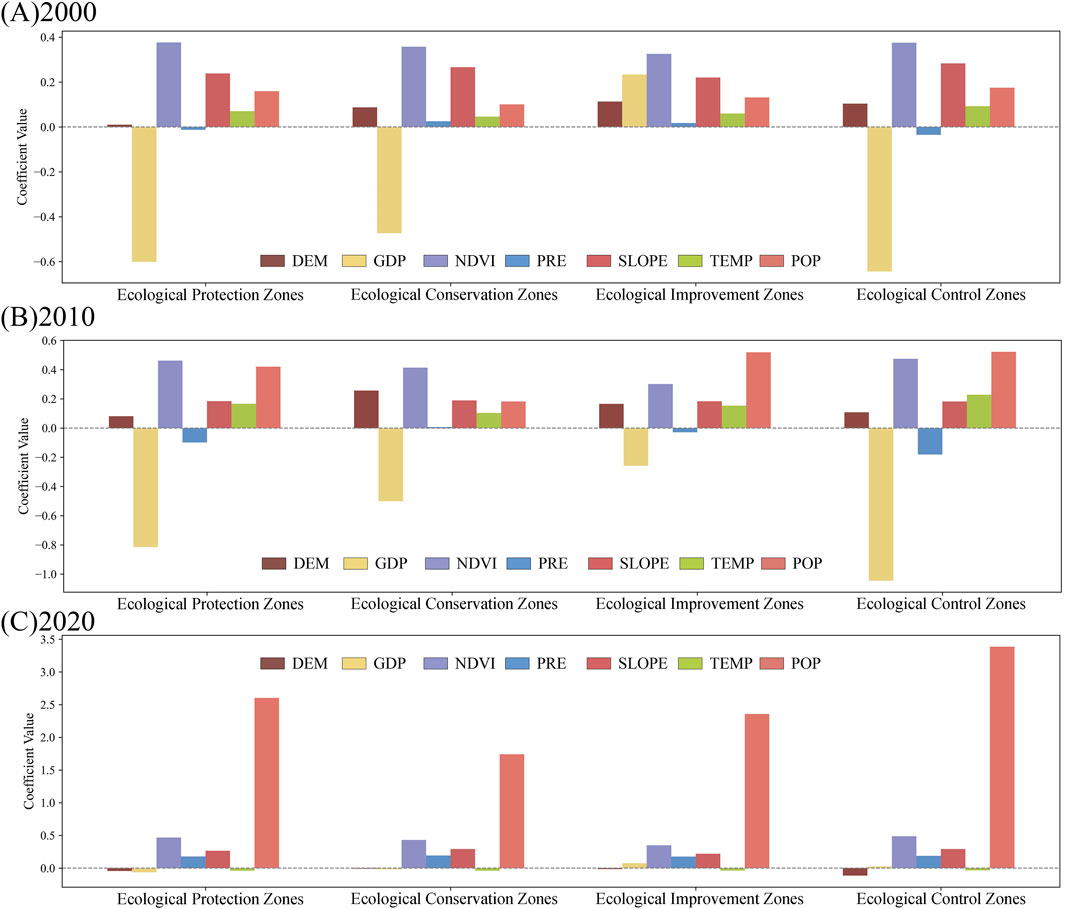
Figure 7. The driving factors of different ecological functional regions. (A) 2000; (B) 2010; (C) 2020. (PRE: Precipitation; TEMP: Temperature; DEM: Elevation; SLOPE: Slope; POP: Population; GDP: Gross Domestic Product; NDVI: Normalized Difference Vegetation Index).
4 Discussion
4.1 Interpreting spatiotemporal patterns and driving mechanisms
ES exhibit pronounced spatiotemporal heterogeneity, as this study revealed the dynamic changes and regional disparities in eastern Guangdong from 2000 to 2020 using the InVEST model. CS, HQ, SR, and WR declined by approximately 0.9%, 1.3%, 23.0%, and 18.6%, respectively, while the integrated ES remained stable at 0.41–0.42, indicating an overall declining trend. This finding aligns with global trends of ES decline in urbanizing areas (Yuan et al., 2024). Additionally, the study demonstrated that ES distribution exhibits significant spatial heterogeneity (Li C. et al., 2024), with stronger ecological functionality in the northern mountainous regions compared to the southern coastal plains. Northern SR and WR far exceed those in the south, highlighting substantial north-south disparities. Nonetheless, it should be noted that the 1 km spatial resolution used in this study may obscure fine-scale ecological dynamics, such as small-area fragmentation or edge effects. Future research may benefit from incorporating higher-resolution datasets to capture more localized processes and improve spatial precision.
Natural factors not only serve as critical baseline conditions for ES variations but also contribute significantly to their spatial heterogeneity across the region. Natural factors serve as critical baseline conditions for ES variations. Climatic variables (PRE, TEMP), were incorporated into the MGWR model to capture the hydrothermal conditions. These factors exhibited a clear north–south gradient in influence. PRE showed a negative effect in northern mountainous areas, likely due to steep slopes and shallow soils intensifying surface runoff and erosion, which reduced soil retention and nutrient availability. In contrast, PRE contributed positively in the southern plains where flatter terrain facilitates infiltration and agricultural utilization. TEMP had a weaker and more variable impact, with modest positive influence in cooler northern areas and neutral to negative effects in the south due to evapotranspiration stress. NDVI was integrated as a proxy for vegetation cover and ecological productivity, and consistently showed a significant positive effect across regions. This result confirms the stabilizing role of vegetation in supporting ES, particularly regulating and supporting services. Topographic factors such as DEM and SLOPE played a vital role in shaping ES spatial patterns. DEM showed positive effects in elevated regions by reducing urban encroachment and maintaining landscape integrity. SLOPE was especially influential, with steeper areas associated with stronger ES due to limited accessibility and preserved natural land cover. These variables reflect the constraining force of terrain on human activities and the protective effect of complex landscapes.
Socioeconomic factors (POP, GDP) have shown increasing influence over time, particularly population growth exerting the greatest pressure on urban areas, accelerating ES decline (Wang et al., 2023). In the MGWR model, POP was included as a proxy for human disturbance intensity, capturing the effects of land conversion, settlement expansion, and ecological fragmentation. POP, entered into the MGWR model as a proxy for anthropogenic disturbance, showed strong negative coefficients in high-density urban belts, illustrating how urban expansion erodes natural land cover and weakens ecological functioning. GDP, representing economic intensity and development pressure, was incorporated to reflect the dual role of economic activity—both as a potential stressor and as a possible driver of ecological restoration under optimized development paths. Economic development exhibits localized positive effects, with GDP shifting to positive in parts of the northern and central regions, suggesting that optimized economic structures may support ecological enhancement. While GDP initially exerted negative ecological impacts, its later positive association in some areas may reflect transitions toward greener development models, such as investment in ecological restoration or sustainable land use planning. The pronounced spatial non-stationarity of influencing factors drives ES distributional heterogeneity, underscoring the necessity of ecological zoning to optimize management. While this study provides valuable insights, the limited scope of socioeconomic variables may overlook complex human–environment dynamics, calling for broader indicator integration. Furthermore, coupling MGWR with nonlinear models could help reveal threshold effects and lagged ecological responses more effectively.
4.2 Insights from zonal transitions and heterogeneity
This study employed the SOM-FCM clustering method to delineate Core, Important, Ecological Coordination, and Ecological control zones in eastern Guangdong from 2000 to 2020, revealing distinct spatiotemporal patterns of ecological heterogeneity (Qi et al., 2019). Core zones, predominantly located in the northern mountainous regions (Fenghuang-Lianhua Mountain area), exhibited a consistent and contiguous expansion, reflecting their ecological resilience due to favorable natural conditions and minimal human disturbance (Xie et al., 2024b). In contrast, Important and Ecological improvement zones, such as the transitional areas near the Hanjiang Estuary, experienced significant contraction and fragmentation, driven by encroachment from Ecological control zones (Li K. et al., 2024). Ecological control zones expanded continuously since 2000, particularly forming reticulated patches in the southern coastal plains, which encroached upon ecological lands of Important and Ecological improvement zones, resulting in substantial declines in SR and WR (Xu et al., 2022).
From a policy perspective, eastern Guangdong, as an integral part of Guangdong Province, faces land-use challenges consistent with provincial trends. Since the 1980s, rapid economic development has intensified demand for construction land, exacerbating supply-demand conflicts and accelerating urban expansion at the expense of ecological lands (Zeng et al., 2023). Influenced by the economic spillover from the Pearl River Delta, economic activities in the coastal plains of eastern Guangdong have intensified, while land tenure issues, such as restrictions on rural collective land transfer, have further contributed to the reduction of Important zones (Xu et al., 2022). Around 2010, the Guangdong Land Use Master Plan (2006–2020) introduced measures to mitigate urban pressures, including revitalizing existing construction land stocks and enforcing spatial controls. The establishment of terrestrial ecological control zones, such as the Fenghuang-Lianhua Mountain area, has effectively safeguarded the ecological integrity of Core zones, ensuring the stability of the regional ecological framework (Li C. et al., 2024).
Analysis of driving factors indicates that the expansion of Core zones was primarily influenced by natural factors, with NDVI (0.33–0.49) and PRE acting as stable positive drivers, sustaining high levels of SR, WR, and HQ through enhanced vegetation cover (Luo et al., 2024). Conversely, Ecological control zones were significantly impacted by socioeconomic pressures, notably population (POP, 0.16–3.39) and GDP (−0.64–0.07), exhibiting strong spatial non-stationarity (Wang X. et al., 2024). From 2000 to 2020, the Guangdong Land Use Master Plan’s restrictions on construction land increments proved insufficient, failing to effectively curb rapid urbanization in the coastal plains of eastern Guangdong, where surging population and intensified economic activities led to increased land development and pollution, reducing SR and WR to their lowest level. Important and Ecological improvement zones were influenced by both natural and socioeconomic factors, with the positive effects of NDVI being partially offset by the negative pressures from POP and GDP, resulting in growing fragmentation and shrinkage of these zones over time. These trends reflect a growing spatial polarization between ecologically stable inland areas and socioeconomically dynamic coastal zones, highlighting the trade-off between urbanization and ecological conservation (Liu and Tang, 2024). Overall, the spatiotemporal dynamics of ecological zones in eastern Guangdong underscore the heterogeneous impacts of land-use changes and urbanization, emphasizing the role of shifting socioeconomic gradients over the two decades and necessitating strengthened policy enforcement and targeted zoning strategies to balance ecological protection with developmental needs.
4.3 Policy implications for region-specific ecosystem services management
Eastern Guangdong exhibits diverse ES, with significant regional variations in natural conditions and uneven ecological development, underscoring the importance of delineating ecological zones for sustainable urban and ecological development (Zeng et al., 2023). Therefore, differentiated management strategies are essential and should be tailored for regional planning departments (del Carmen Sabatini et al., 2007). Based on the characteristics of different ecological zones and the analysis of influencing factors, the following recommendations are proposed:
Ecological protection zones should be designated as core areas of nature reserves, where human activities are prohibited in principle. An appropriate buffer zone should be established, prioritizing the creation of ecological reserves with native species to preserve natural habitats and ensure ecosystem succession (Xie et al., 2024b). Ecological conservation zones require integrated protection and restoration of mountains, rivers, forests, farmlands, lakes, grasslands, and deserts. Ecological restoration projects, such as reforestation and grassland restoration, should be implemented, with defined targets for soil erosion control and flood defense standards for soil conservation infrastructure, while selecting suitable plant species (trees, shrubs, or grasses as appropriate) to enhance ecological functionality (Luo et al., 2024). Ecological improvement zones should establish ecological corridors to connect core and important zones, facilitating species migration and genetic exchange. Low-impact activities compliant with regulations, such as ecotourism, may be permitted, but any new construction land must be approved by provincial authorities to ensure no ecological harm (Liu et al., 2019). Ecological control zones should promote smart, compact development by controlling development intensity and optimizing existing land stocks. Urban renewal should be leveraged to achieve regional integration of industry and residential areas, balancing employment and housing needs, while adding green spaces along rivers and high-quality habitat areas to enhance urban ecological restoration capacity (Li J. et al., 2024).
To support zoning management, compensation policies and land-use trade-off measures are recommended. A scientific framework for assessing the value of ecological products should be established, alongside a robust ecological compensation mechanism (Zeng et al., 2023). The integrated ecological zoning and management framework developed in this study—combining spatially explicit ecosystem service modeling (InVEST), spatial heterogeneity analysis (MGWR), and ecological function zoning using SOM-FCM clustering—has strong transferability and can be applied to other rapidly urbanizing regions. Stakeholders in Ecological protection and conservation zones, such as farmers, should receive compensation to incentivize the protection of arable land and ecological spaces (Li K. et al., 2024). Ecological control zones should provide cross-regional compensation to ecological improvement zones, with funds allocated to support water-retention forest establishment and biodiversity conservation (Liu and Tang, 2024). Regarding land-use trade-offs, ecological control zones should strictly limit new construction land, prioritizing the revitalization of unutilized and idle land through diverse redevelopment models. Arable land supplementation should be achieved by rehabilitating low-efficiency orchards and slopes to meet land balance requirements, minimizing impacts on high-quality ecological areas (Wang S. et al., 2024).
5 Conclusion
This study quantified ecosystem services (ES) in Eastern Guangdong from 2000 to 2020 using the InVEST model, explored their spatially heterogeneous drivers through MGWR, and identified ecological zones using SOM-FCM clustering. The findings highlight notable spatiotemporal variations in ES under rapid urbanization, offering a scientific basis for region-specific ecological governance.
1. ES declined significantly, with clear spatial disparities. From 2000 to 2020, the overall ES in the region showed a downward trend: soil retention (SR) and water retention (WR) declined by 23.4% and 18.6%, respectively, while carbon storage (CS) and habitat quality (HQ) slightly decreased by 0.9% and 1.3%. Spatially, higher ES values were concentrated in the mountainous northern areas with greater elevation, forest cover, and lower urbanization levels, while lower values were observed in the southern coastal plains, indicating a clear spatial gradient.
2. Natural factors remain dominant, with increasing socioeconomic influence. NDVI remained the most stable and significant positive factor, particularly in central and northern mountainous regions. Precipitation (PRE) and temperature (TEMP) exhibited dynamic spatial patterns, with PRE shifting from negative to positive in the northern mountains and consistently positive in the south; TEMP’s influence in the north weakened over time. DEM and SLOPE showed marked spatial non-stationarity. Meanwhile, the influence of socioeconomic factors intensified over time, with population (POP) and GDP displaying significant spatial heterogeneity. Urbanization accelerated the complex interaction between natural and human-induced drivers.
3. Urbanization exerted uneven pressure across ecological zones. From 2000 to 2020, ecological protection zones expanded in area and spatial continuity due to policy support; ecological control zones increased significantly from 5.27% to 10.32% due to mounting population and economic pressures; meanwhile, conservation and improvement zones were compressed and became increasingly fragmented. Differentiated strategies are proposed: ecological protection zones should be strictly conserved with restricted human activity; conservation zones require integrated restoration of natural systems; improvement zones should develop ecological corridors and allow limited low-impact uses such as ecotourism; control zones should adopt compact development and land renewal strategies to support green transformation.
These findings provide evidence to support adaptive ecological planning in rapidly urbanizing regions like Eastern Guangdong. However, the MGWR model is limited in capturing nonlinear responses and threshold effects. Future studies should consider integrating machine learning methods to explore complex interactions—such as delayed responses of ES to economic activities or abrupt ecological tipping points. In addition, testing management strategies through land-use simulation models under various development and climate scenarios would strengthen the practical relevance and resilience of policy recommendations.
Data availability statement
The original contributions presented in the study are included in the article/supplementary material, further inquiries can be directed to the corresponding author.
Author contributions
WW: Conceptualization, Methodology, Resources, Writing – review and editing, Writing – original draft. HY: Writing – original draft, Writing – review and editing. LW: Writing – review and editing, Writing – original draft. ZF: Writing – review and editing, Writing – original draft. XL: Writing – review and editing, Writing – original draft.
Funding
The author(s) declare that financial support was received for the research and/or publication of this article. This research was supported by the Macau Science and Technology Development Fund (grant number 0027/2022/A).
Conflict of interest
The authors declare that the research was conducted in the absence of any commercial or financial relationships that could be construed as a potential conflict of interest.
Generative AI statement
The author(s) declare that no Generative AI was used in the creation of this manuscript.
Any alternative text (alt text) provided alongside figures in this article has been generated by Frontiers with the support of artificial intelligence and reasonable efforts have been made to ensure accuracy, including review by the authors wherever possible. If you identify any issues, please contact us.
Publisher’s note
All claims expressed in this article are solely those of the authors and do not necessarily represent those of their affiliated organizations, or those of the publisher, the editors and the reviewers. Any product that may be evaluated in this article, or claim that may be made by its manufacturer, is not guaranteed or endorsed by the publisher.
References
Aslam, R. W., Shu, H., Yaseen, A., Sajjad, A., and Abidin, S. Z. U. (2023). Identification of time-varying wetlands neglected in Pakistan through remote sensing techniques. Environ. Sci. Pollut. Res. 30, 74031–74044. doi:10.1007/s11356-023-27554-5
Aslam, R. W., Naz, I., Quddoos, A., and Quddusi, M. R. (2024a). Assessing climatic impacts on land use and land cover dynamics in Peshawar, Khyber Pakhtunkhwa, Pakistan: a remote sensing and GIS approach. GeoJournal 89, 202. doi:10.1007/s10708-024-11203-6
Aslam, R. W., Naz, I., Shu, H., Yan, J., Quddoos, A., Tariq, A., et al. (2024b). Multi-temporal image analysis of wetland dynamics using machine learning algorithms. J. Environ. Manag. 371, 123123. doi:10.1016/j.jenvman.2024.123123
Bryan, B. A. (2013). Incentives, land use, and ecosystem services: synthesizing complex linkages. Environ. Sci. and POLICY 27, 124–134. doi:10.1016/j.envsci.2012.12.010
Chen, X., Li, F., Li, X., Liu, H., Hu, Y., and Hu, P. (2021). Integrating ecological assessments to target priority restoration areas: a case study in the Pearl River Delta urban agglomeration, China. Remote Sens. 13, 2424. doi:10.3390/rs13122424
Chen, D., Duan, Y., Jiang, P., and Li, M. (2024). Spatial zoning to enhance ecosystem service co-benefits for sustainable land-use management in the Yangtze River economic Belt, China. Ecol. Indic. 159, 111753. doi:10.1016/j.ecolind.2024.111753
Cord, A. F., Bartkowski, B., Beckmann, M., Dittrich, A., Hermans-Neumann, K., Kaim, A., et al. (2017). Towards systematic analyses of ecosystem service trade-offs and synergies: main concepts, methods and the road ahead. Ecosyst. Serv. 28, 264–272. doi:10.1016/j.ecoser.2017.07.012
Córdoba Hernández, R., and Camerin, F. (2024). The application of ecosystem assessments in land use planning: a case study for supporting decisions toward ecosystem protection. Futures 161, 103399. doi:10.1016/j.futures.2024.103399
Costanza, R., d’Arge, R., De Groot, R., Farber, S., Grasso, M., Hannon, B., et al. (1997). The value of the world’s ecosystem services and natural capital. Nature 387, 253–260. doi:10.1038/387253a0
Dai, E., Zhao, Z., Jia, L., and Jiang, X. (2024). Contribution of ecosystem services improvement on achieving Sustainable development Goals under ecological engineering projects on the Qinghai-Tibet Plateau. Ecol. Eng. 199, 107146. doi:10.1016/j.ecoleng.2023.107146
Daily, G. C., Söderqvist, T., Aniyar, S., Arrow, K., Dasgupta, P., Ehrlich, P. R., et al. (2000). The value of nature and the nature of value. Science 289, 395–396. doi:10.1126/science.289.5478.395
del Carmen Sabatini, M., Verdiell, A., Rodríguez Iglesias, R. M., and Vidal, M. (2007). A quantitative method for zoning of protected areas and its spatial ecological implications. J. Environ. Manag. 83, 198–206. doi:10.1016/j.jenvman.2006.02.005
Fotheringham, A. S., Yang, W., and Kang, W. (2017). Multiscale geographically weighted regression (MGWR). Ann. Am. Assoc. Geogr. 107, 1247–1265. doi:10.1080/24694452.2017.1352480
Gao, M., Xu, R., Huang, J., Su, B., Jiang, S., Shi, P., et al. (2023). Increase of carbon storage in the Qinghai-Tibet Plateau: perspective from land-use change under global warming. J. Clean. Prod. 414, 137540. doi:10.1016/j.jclepro.2023.137540
Hao, R., Yu, D., Sun, Y., and Shi, M. (2019). The features and influential factors of interactions among ecosystem services. Ecol. Indic. 101, 770–779. doi:10.1016/j.ecolind.2019.01.080
Huang, H., Xue, J., Feng, X., Zhao, J., Sun, H., Hu, Y., et al. (2024). Thriving arid oasis urban agglomerations: optimizing ecosystem services pattern under future climate change scenarios using dynamic Bayesian network. J. Environ. Manag. 350, 119612. doi:10.1016/j.jenvman.2023.119612
Jiang, X., Wang, B., Fang, Q., Bai, P., Guo, T., and Wu, Q. (2024). Ecological zoning management strategies in China: a perspective of ecosystem services supply and demand. Land 13, 1112. doi:10.3390/land13071112
Lan, H., Zhang, Y., Yang, Y., Zhao, X., Yu, T., Li, X., et al. (2025). Analyzing inequities in vegetation cooling services along the urban-rural gradient using the LAI-integrated InVEST urban cooling model. Urban For. and Urban Green. 104, 128665. doi:10.1016/j.ufug.2024.128665
Li, Z., Xia, J., Deng, X., and Yan, H. (2021). Multilevel modelling of impacts of human and natural factors on ecosystem services change in an oasis, Northwest China. Resour. Conservation Recycl. 169, 105474. doi:10.1016/j.resconrec.2021.105474
Li, P., Chen, J., Li, Y., and Wu, W. (2023). Using the InVEST-PLUS model to predict and analyze the pattern of ecosystem carbon storage in Liaoning Province, China. Remote Sens. 15, 4050. doi:10.3390/rs15164050
Li, C., Qiao, W., Gao, B., and Chen, Y. (2024a). Unveiling spatial heterogeneity of ecosystem services and their drivers in varied landform types: insights from the Sichuan-Yunnan ecological barrier area. J. Clean. Prod. 442, 141158. doi:10.1016/j.jclepro.2024.141158
Li, J., Hu, D., Wang, Y., Chu, J., Yin, H., and Ma, M. (2024b). Study of identification and simulation of ecological zoning through integration of landscape ecological risk and ecosystem service value. Sustain. Cities Soc. 107, 105442. doi:10.1016/j.scs.2024.105442
Li, K., Yan, X., Hou, Y., Lv, B., Huang, Y., Liu, J., et al. (2024c). Can ecological zoning act as an environmental management tool for protecting regional habitat quality: causal evidence from the national key ecological function zone in China. J. Clean. Prod. 475, 143623. doi:10.1016/j.jclepro.2024.143623
Lin, Y., Xu, X., Tan, Y., and Chen, M. (2024). Multi-scalar assessment of ecosystem-services supply and demand for establishing ecological management zoning. Appl. Geogr. 172, 103435. doi:10.1016/j.apgeog.2024.103435
Liu, H., and Tang, D. (2024). Ecological zoning and ecosystem management based on landscape ecological risk and ecosystem services: a case study in the Wuling Mountain Area. Ecol. Indic. 166, 112421. doi:10.1016/j.ecolind.2024.112421
Liu, Y., Li, T., Zhao, W., Wang, S., and Fu, B. (2019). Landscape functional zoning at a county level based on ecosystem services bundle: methods comparison and management indication. J. Environ. Manag. 249, 109315. doi:10.1016/j.jenvman.2019.109315
Liu, L., Chen, X., Chen, W., and Ye, X. (2020). Identifying the impact of landscape pattern on ecosystem services in the middle reaches of the yangtze river urban agglomerations, China. IJERPH 17, 5063. doi:10.3390/ijerph17145063
Liu, W., Tian, H., Xu, X., and Yang, G. (2024). Evaluation of water supply function in the economic belt of the northern slope of the tianshan mountains based on the InVEST model. Clim. Serv. 36, 100519. doi:10.1016/j.cliser.2024.100519
Luo, M., Jia, X., Zhao, Y., Zhang, P., and Zhao, M. (2024). Ecological vulnerability assessment and its driving force based on ecological zoning in the Loess Plateau, China. Ecol. Indic. 159, 111658. doi:10.1016/j.ecolind.2024.111658
Naz, I., Fan, H., Aslam, R. W., Tariq, A., Quddoos, A., Sajjad, A., et al. (2024). Integrated geospatial and geostatistical multi-criteria evaluation of urban Groundwater quality using water quality indices. Water 16, 2549. doi:10.3390/w16172549
Nguyen, P. M., De Pue, J., Le, K. V., and Cornelis, W. (2015). Impact of regression methods on improved effects of soil structure on soil water retention estimates. J. Hydrology 525, 598–606. doi:10.1016/j.jhydrol.2015.04.014
Qi, J., Liu, H., Liu, X., and Zhang, Y. (2019). Spatiotemporal evolution analysis of time-series land use change using self-organizing map to examine the zoning and scale effects. Comput. Environ. Urban Syst. 76, 11–23. doi:10.1016/j.compenvurbsys.2019.03.002
Rong, Y., Li, K., Guo, J., Zheng, L., Luo, Y., Yan, Y., et al. (2022). Multi-scale spatio-temporal analysis of soil conservation service based on MGWR model: a case of Beijing-Tianjin-Hebei, China. Ecol. Indic. 139, 108946. doi:10.1016/j.ecolind.2022.108946
Veerkamp, C. J., Loreti, M., Benavidez, R., Jackson, B., and Schipper, A. M. (2023). Comparing three spatial modeling tools for assessing urban ecosystem services. Ecosyst. Serv. 59, 101500. doi:10.1016/j.ecoser.2022.101500
Wang, B., Oguchi, T., and Liang, X. (2023). Evaluating future habitat quality responding to land use change under different city compaction scenarios in Southern China. Cities 140, 104410. doi:10.1016/j.cities.2023.104410
Wang, S., Shi, H., Xu, X., Huang, L., Gu, Q., and Liu, H. (2024a). County zoning and optimization paths for trade-offs and synergies of ecosystem services in Northeast China. Ecol. Indic. 164, 112044. doi:10.1016/j.ecolind.2024.112044
Wang, X., Wang, X., Jin, X., Kou, L., and Hou, Y. (2024b). Evaluation and driving force analysis of ecological environment in low mountain and hilly regions based on optimized ecological index. Sci. Rep. 14, 24570. doi:10.1038/s41598-024-76913-w
Wu, W., Zeng, H., Guo, C., You, W., Xu, H., Hu, Y., et al. (2024). Spatial heterogeneity and management challenges of ecosystem service trade-offs: a case study in Guangdong Province, China. Environ. Manag. 73, 378–394. doi:10.1007/s00267-023-01851-8
Wu, W., Ding, B., Zhu, G., Fang, L., Liu, S., Guo, B., et al. (2025). Unlocking the ecological blueprint: strategic zoning and policy guidelines for ecosystem services in Guangdong province, China. J. Urban Plan. Dev. 151, 04025003. doi:10.1061/JUPDDM.UPENG-5315
Xie, Y., Dai, W., Xiang, S., Deng, H., Wang, Z., Li, Y., et al. (2024a). Supply and demand of ecosystem services and their interaction with urbanization: the case of Chengdu-Chongqing urban agglomeration. Urban Clim. 55, 101978. doi:10.1016/j.uclim.2024.101978
Xie, Y., Wang, S., Xiang, S., Wang, Z., Li, Y., Wang, Z., et al. (2024b). Ecological zoning and dynamic assessment of effectiveness in the three gorges reservoir area, China. Ecol. Model. 487, 110563. doi:10.1016/j.ecolmodel.2023.110563
Xiong, C., Xu, H., and Tian, Y. (2024). Assessment of ecosystem service value in China from the perspective of spatial heterogeneity. Ecol. Indic. 159, 111707. doi:10.1016/j.ecolind.2024.111707
Xu, Z., Peng, J., Dong, J., Liu, Y., Liu, Q., Lyu, D., et al. (2022). Spatial correlation between the changes of ecosystem service supply and demand: an ecological zoning approach. Landsc. Urban Plan. 217, 104258. doi:10.1016/j.landurbplan.2021.104258
Yang, S., Zhang, L., and Zhu, G. (2023). Effects of transport infrastructures and climate change on ecosystem services in the integrated transport corridor region of the Qinghai-Tibet Plateau. Sci. Total Environ. 885, 163961. doi:10.1016/j.scitotenv.2023.163961
Yuan, S., Mei, Z., Zhu, C., Cao, R., Li, S., Yang, L., et al. (2024). Investigating the spatio-temporal interactive relationship between land use structure and ecosystem services in urbanizing China. Ecol. Indic. 158, 111315. doi:10.1016/j.ecolind.2023.111315
Zeng, J., Cui, X., Chen, W., and Yao, X. (2023). Ecological management zoning based on the supply-demand relationship of ecosystem services in China. Appl. Geogr. 155, 102959. doi:10.1016/j.apgeog.2023.102959
Zhang, Z., Liu, Y., Wang, Y., Liu, Y., Zhang, Y., and Zhang, Y. (2020). What factors affect the synergy and tradeoff between ecosystem services, and how, from a geospatial perspective? J. Clean. Prod. 257, 120454. doi:10.1016/j.jclepro.2020.120454
Keywords: ecosystem services (ES), urban sprawl, spatial non-stationarity, ecological management, InVEST model, SOM-FCM clustering
Citation: Wu W, Yang H, Wei L, Fang Z and Liu X (2025) Spatiotemporal dynamics of ecosystem services and ecological zoning in rapidly urbanizing eastern Guangdong. Front. Earth Sci. 13:1593217. doi: 10.3389/feart.2025.1593217
Received: 13 March 2025; Accepted: 25 August 2025;
Published: 09 September 2025.
Edited by:
Chong Jiang, Guangdong Academy of Science (CAS), ChinaReviewed by:
Rana Waqar Aslam, Wuhan University, ChinaDmitry Ruban, Southern Federal University, Russia
Muniyandi Balasubramanian, Institute for Social and Economic Change, India
Eskinder Gidey, University of the Witwatersrand, South Africa
Copyright © 2025 Wu, Yang, Wei, Fang and Liu. This is an open-access article distributed under the terms of the Creative Commons Attribution License (CC BY). The use, distribution or reproduction in other forums is permitted, provided the original author(s) and the copyright owner(s) are credited and that the original publication in this journal is cited, in accordance with accepted academic practice. No use, distribution or reproduction is permitted which does not comply with these terms.
*Correspondence: Xiaodong Liu, bGl1eGlhb2RvbmdAemhrdS5lZHUuY24=