 Amal Maou1,2Sabrina Souadnia1,2Khadeijah Faqeih3Afaf AlAmri4
 Riheb Hadji1,2*Somayah moshrif Alamri3Khaled Harizi5Eman Alamery3Griche Sonia1,2Boubazine Leila1,2Jamilah Altwaiher3
- 1Department of Earth Sciences, Institute of Architecture and Earth Sciences, Ferhat Abbas University, Setif, Algeria
- 2Laboratory of Applied Research in Engineering Geology, Geotechnics, Water Sciences, and Environment, Ferhat Abbas University, Setif, Algeria
- 3Department of Geography and Environmental Sustainability, College of Humanities and Social Sciences, Princess Nourah bint Abdulrahman University, Riyadh, Saudi Arabia
- 4Department of Geography, College of Humanities and Social Sciences, King Saud University, Riyadh, Saudi Arabia
- 5Laboratory of Mobilization and Water Resources Management, University of Batna 2, Batna, Algeria
Flash floods represent one of the most destructive forms of natural hazards, frequently resulting in severe property damage and loss of life. Their occurrence has intensified in recent decades, largely driven by climate change, unregulated urban expansion, and increased development in flood-susceptible downstream areas. The Wadi Saf Saf basin, located in northeastern Algeria, is particularly prone to such events. Flash flood hazard is investigated based on statistical morphometric analysis. This study explores the influence of morphometric characteristics on flash flood susceptibility within the basin. The implementation of GIS allows the automated extraction of morphometric parameters from digital elevation models (DEMs) for quantitative analyses, updating, and morphometric study of drainage basins. 22 key morphometric parameters; including stream order, drainage density, bifurcation ratio, elongation ratio, slope, and relief; were derived from remote sensing data and processed through empirical equations tailored to each parameter. The sub-watersheds were evaluated using an index-based scoring system to reflect their relative contribution to flood risk, and the linear overlay technique was employed to produce a comprehensive flash flood hazard (FFH) map. The resulting classification delineates five flood risk categories, from very low (e.g., sub-watershed 10) to very high (e.g., sub-watersheds 1, 2, 16, and 19). This integrated approach highlights the spatial variability of flood vulnerability across the Saf Saf watershed and offers essential support for disaster risk reduction, structural mitigation planning, and informed land-use management in Mediterranean catchments.
1 Introduction
Flash floods represent a recurring and destructive natural hazard in the Middle East and North Africa (MENA) region, leading to significant human, economic, and environmental losses (Chen et al., 2020; Nasir et al., 2020; Bashir, 2023; Ghosh et al., 2022; Taib et al., 2024a). In Algeria, the national ORSEC Plan highlights not only the risks posed to human life and infrastructure but also the potential damage to historical heritage such as the Roman ruins and rock paintings of Tassili. Flash floods are particularly hazardous due to their sudden onset and high intensity, frequently resulting from intense rainfall or rapid water release from upstream catchments (Mahleb et al., 2022). These events have become increasingly frequent and severe, driven by the effects of climate change and rapid land-use transformations (Mahmood et al., 2016; Abdel-Fattah et al., 2017).
In North Africa, especially in arid and semi-arid regions such as Algeria, flash floods typically affect wadis; ephemeral channels that remain dry for much of the year. These regions are especially vulnerable due to limited observational networks and a lack of real-time monitoring systems. The growing incidence of urbanization within flood-prone wadi channels further exacerbates the risk, diminishing the resilience of local communities and increasing their exposure to hazards.
In northern Algeria, the interplay of rugged topography, intense convective storms, and anarchic land use heightens flash flood vulnerability. However, flood hazard assessments remain scarce. By consulting the existing works in this region an evident gap is concerning the rapid urban expansion and climate-induced increases in extreme weather events are apparent.
Watershed-scale morphometric analysis offers a compliant framework for assessing flash flood susceptibility, especially in data-scarce mountainous regions. Morphometric parameters (such as quantitative attributes describing catchment relief, shape, and drainage network) play a pivotal role in controlling surface water flow. Relief influences runoff velocity, while basin geometry governs the dispersion and convergence of water. The structure and connectivity of the drainage network determine the efficiency of runoff evacuation, all of which directly affect the timing and intensity of flash floods.
Several studies have explored various models for runoff estimation, including the Rational Method (Abdelkader et al., 2021; Youssef et al., 2011), water balance techniques (Jasrotia et al., 2009), and artificial neural networks (Sarkar, and Gayen, 2024). However, morphometric-based methods remain particularly effective in mountainous terrains where conventional hydrological models often falter due to complex landforms and limited hydrometric data (Basahi et al., 2016). Despite their potential, few studies have comprehensively analyzed the relationship between morphometric parameters and flash flood dynamics in Algeria’s mountainous watersheds.
This research addresses the critical need for localized flash flood risk assessments in the Saf Saf basin, located in northeastern Algeria. The basin, situated within the Southern Mediterranean climatic zone, holds strategic economic importance with over 40% of its land dedicated to agriculture, as well as significant industrial infrastructure. Its geomorphological setting; (marked by steep slopes, variable elevation, and impervious lithologies) makes it especially prone to rapid runoff and limited infiltration during heavy rainfall events. These physical characteristics, combined with deforestation and unplanned urban expansion, heighten both the frequency and severity of flash floods in the region.
Hydrological modeling in this context faces significant challenges due to the rugged terrain and the lack of continuous discharge data. Consequently, this study applies a morphometric-based, multi-criteria approach integrating Geographic Information Systems (GIS) and Remote Sensing (RS) to evaluate flash flood hazard across all sub-basins within the Saf Saf watershed. This method allows for the extraction, classification, and analysis of key watershed morphometric parameters, supporting spatially explicit hazard assessments even in ungauged basins. Recent research highlights the growing utility of geospatial methods and DEMs in environmental studies. Serwa et al. (2024) improved interferometric DEM accuracy using neural networks and GPS data. Isazade et al. (2023) combined active and passive remote sensing with spatial filters to assess urban extension.
By applying Strahler’s stream ordering technique, this study derives essential drainage network metrics, including stream number and stream length. These parameters inform the degree of dissection and hydrological maturity of the basin. The bifurcation ratio reveals structural influences on stream development, while basin shape indices such as elongation ratio and form factor offer insights into runoff concentration dynamics (Taib et al., 2024b). High values of these indices typically correspond to rapid runoff accumulation and increased flood potential.
Drainage density and stream frequency are also analyzed as indicators of surface runoff potential and infiltration capacity. Their integration into an infiltration number provides a comprehensive measure of the watershed’s response to rainfall. The constant of channel maintenance, as the inverse of drainage density, further indicates the land area required to sustain stream flow, reflecting overall terrain resistance to erosion and infiltration characteristics.
Ultimately, this study aims to establish a practical and realistic research for identifying high-hazard flash flood zones within the Saf Saf basin. The approach is designed not only to enhance local flood risk management and mitigation strategies but also to serve as a transferable methodology applicable to other data-scarce, mountainous catchments in arid and semi-arid regions. The findings are expected to support decision-makers in developing adaptive land-use plans and early warning systems that are critical for long-term flood resilience in this vulnerable region.
In this study while no new algorithm was introduced, the research focuses on strategically refining existing analytical workflows to improve the precision and contextual relevance of hydrological outputs. The enhancements primarily involved geopreprocessing of the DEM, and the transformation of to the UTM Zone 32N system. Hydrological conditioning, such as depression removal and correction of flow direction artifacts, was specifically adapted to the dynamics of the terrain. To refine stream network classification, the Strahler ordering method was recalibrated, and automated GIS outputs were systematically validated and corrected using high-resolution satellite imagery and topographic maps. In addition, morphometric parameters were computed using zonal statistics, and critical indices like bifurcation ratio and infiltration number were calculated manually in Excel to supplement the automated GIS analyses. These methodological adaptations allowed for improved stream delineation, more reliable flow accumulation models, and greater sensitivity to terrain-specific characteristics often overlooked by default tools. The proposed approach not only strengthens the scientific reliability of flood susceptibility assessments but also enhances reproducibility by using freely available data, ensures practical applicability through a balance of automation and manual quality control, and provides a scalable framework for application in other arid or semi-arid regions facing similar topographic and data constraints.
2 Materials and methods
2.1 Study area
Wadi Saf Saf, situated within the Constantine coastal basin is a significant sub watershed of Northeastern Algeria. Its geographical coordinates range between longitudes 6°30′to 7° E and latitudes 36° to 37°N. The hydrological network within this basin is notably dense, averaging between two and 3.5 km/km2, predominantly comprising the Saf Saf wadi and its principal tributaries (Figure 1). The perimeter (P) of the Wadi Saf Saf basin is approximately 270 km, outlining an area (A) of about 1,162 km2.
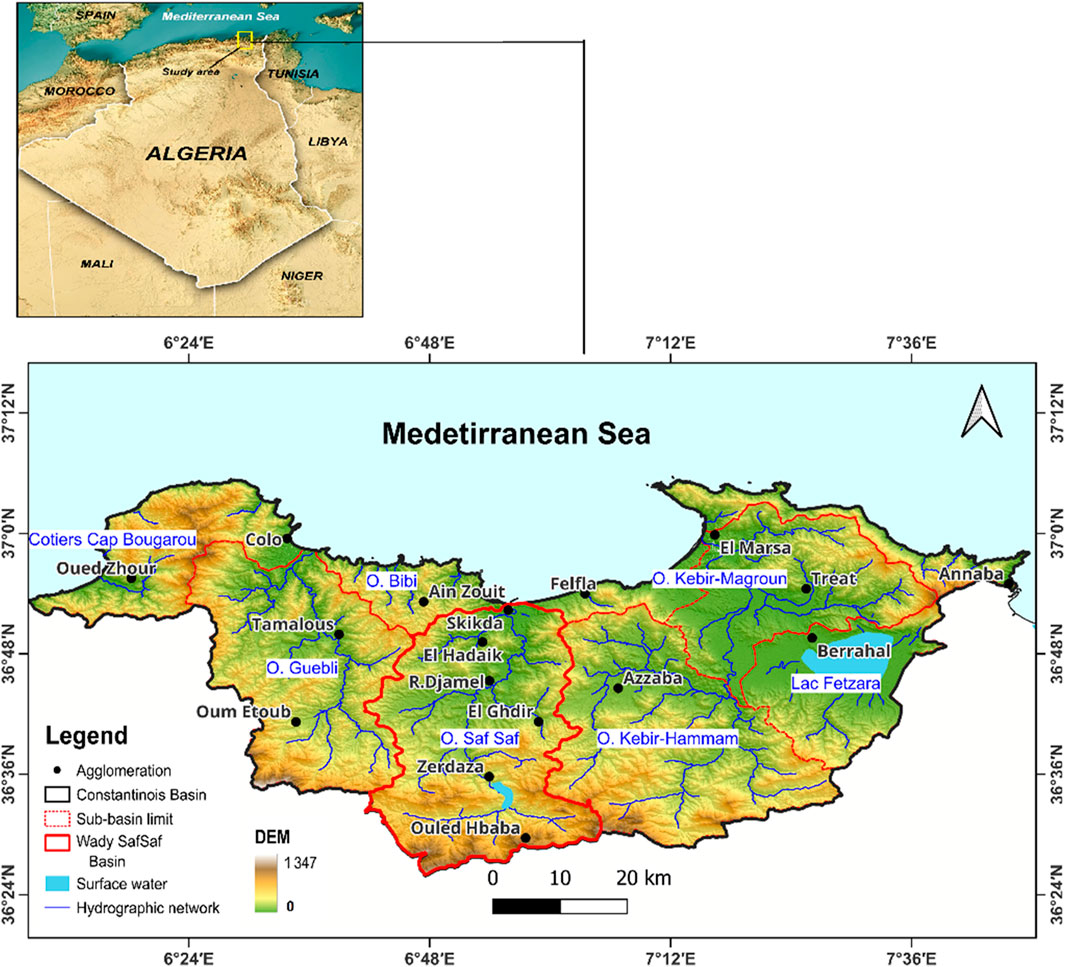
Figure 1. Map of the geographical location of the Wady Saf Saf watershed.
Geologically, the region exhibits distinct features, with resilient formations prevalent on the slopes and alluvial formations predominantly found in the valleys (Figure 2). The soil’s absorption capacity ranges from 2 mm/h to 10 cm/h, indicating varying degrees of permeability.
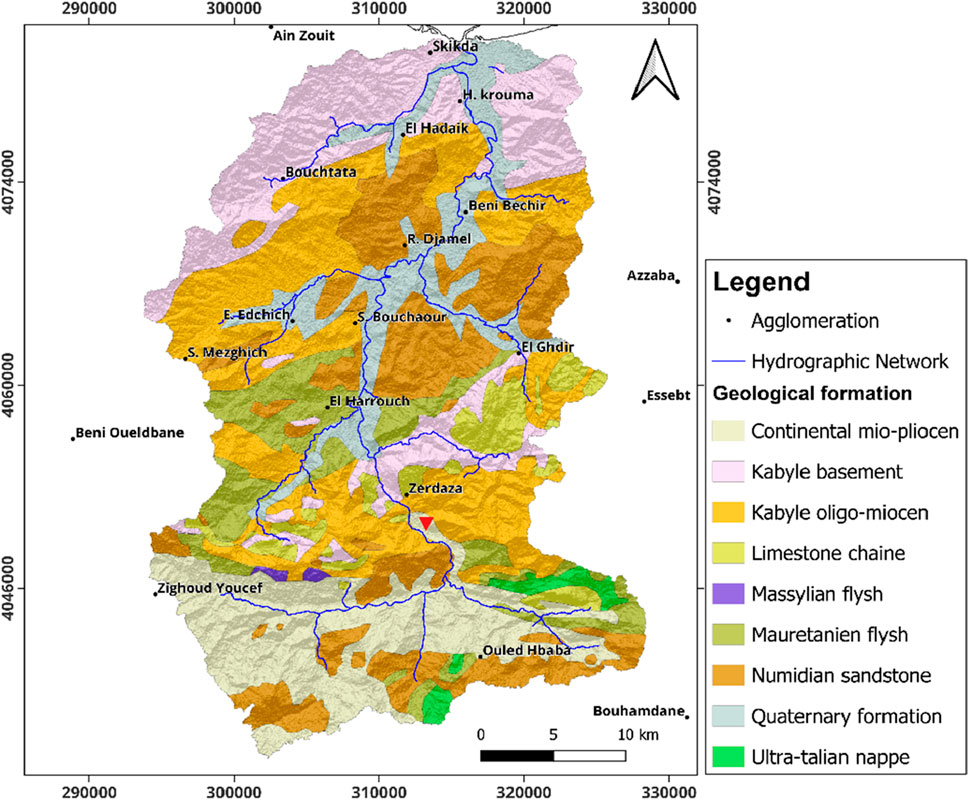
Figure 2. Geology of the Wady Saf Saf watershed.
Topographically, the area fosters rapid runoff on steep slopes, characterized by short response times. Conversely, the subflat plain is prone to sediment accumulation and stagnation. The prevailing Mediterranean climate is typified by erratic rainfall patterns and occasional rainstorms, with an average temperature of approximately 15.8°C.
Vegetation cover in the region is notably degraded, featuring cork oak and Zeen oak scrub at high altitudes, while vegetation, primarily reeds, thrives along the banks and beds of the wadi.
Over the past few decades, the Wadi Saf Saf region has experienced several severe flash flood events, resulting in significant damage to infrastructure and the loss of human lives. Notable occurrences include the devastating flood of December 1984, during which the area received 452.5 mm of rainfall over 16 days, with an exceptional 137 mm recorded on December 29th alone at the Zardezas Dam rain gauge. Subsequent major flood events were recorded in November 2004 February 2011, and most recently in November 2023, each contributing to the growing vulnerability of the region and underscoring the urgent need for improved flood risk assessment and mitigation strategies.
Field reconnaissance missions conducted across the Saf-Saf basin have provided crucial insights into the region’s geomorphological characteristics and the primary factors contributing to recurrent flooding. The landscape is notably irregular, marked by pronounced elevation differences; (steep, rugged slopes contrast sharply with the flatter, low-lying valley bottoms, especially within the Saf-Saf channel). Vegetation is particularly dense along wadi banks and channels, with reed beds often dominating these riparian zones.
The terrain geology is composed mainly of soft, unconsolidated formations such as clay and clayey silt from Quaternary alluvium, which rest atop a harder substratum. These sediments contribute to limited water infiltration and increased surface runoff. Furthermore, the natural flow of torrents has been significantly disrupted in various locations due to the development of transportation infrastructure, including roads and railways. Several wadis, such as Zéramna in Skikda and Zerga in Ramdane Jamel, have been artificially modified or partially obstructed, while numerous secondary tributaries have been similarly impacted within urban centers.
Hydraulic structures and drainage networks suffer from inadequate maintenance; drains are frequently clogged by domestic waste and plastic debris, while wadi beds are increasingly obstructed by rubble and construction residues, further exacerbating flood risks. Urban expansion has also encroached upon areas traditionally known to act as natural accumulation basins—zones that not only lie adjacent to two or more rivers but are now densely built-up without sufficient regard for hydrological safety or the protection of life and property.
Taken together, these observations underscore how the lower Saf-Saf valleys; (characterized by their alluvial fans) naturally facilitate the pooling and stagnation of stormwater and runoff from adjacent slopes. These geomorphological predispositions, combined with the increasing frequency and intensity of extreme rainfall events, significantly heighten the risk of flash flooding and mudflows. Consequently, both the local population and essential infrastructure are increasingly vulnerable to hydrometeorological hazards within the basin.
2.2 Material and methods
Numerous recent studies have demonstrated the effectiveness of geospatial technologies and Digital Elevation Models (DEMs) in environmental analysis. For instance, Serwa et al. (2024) utilized artificial neural networks combined with GPS control points to refine interferometric DEM accuracy. In a different context, (Mahmoud Shaaban Mabrouk et al., 2022) applied DEM-based analysis to evaluate geomorphological hazards along the eastern coastline of Egypt, underscoring the value of elevation data in risk assessment. In this study, the integration of Remote Sensing (RS) and Geographic Information System (GIS) techniques formed the methodological foundation for the morphometric analysis aimed at assessing flash flood hazards in the Saf Saf basin. A key element of this approach was the use of Shuttle Radar Topography Mission (SRTM) data, obtained from the USGS Earth Explorer. The dataset, captured in November 2024, offers a Digital Elevation Model (DEM) at 30-m resolution, providing detailed and reliable elevation data essential for accurate topographic and hydrological modeling. However, as the SRTM DEM is referenced to the WGS84 ellipsoid, while Algerian datasets typically use local geographic system, vertical and horizontal adjustments were necessary. To ensure spatial consistency and analytical accuracy, the data were transformed and projected using the WGS84 UTM Zone 32N coordinate system. Prior to analysis, several preprocessing steps were applied to the DEM, including the filling of voids, resampling to harmonize resolution, and hydrological conditioning to support flow direction and flow accumulation modeling. These operations were conducted using QGIS version 3.16, which provided a comprehensive environment for spatial analysis. Within QGIS, the DEM served as the basis for watershed delineation, stream network extraction, and the computation of crucial morphometric parameters such as slope gradients, basin relief, drainage density, and runoff pathways.
The careful preprocessing and georeferencing of SRTM data significantly enhanced the reliability of hydrological assessments and enabled the accurate spatial identification of areas prone to flash flooding. This process underscores the critical role of precise elevation data and proper geospatial calibration in flood risk mapping, particularly in semi-arid and data-scarce regions.
The hydrological processing workflow began with GIS preprocessing DEMs to generate flow direction and accumulation grids, which in turn facilitated the extraction and segmentation of stream networks. Stream hierarchy was classified using the Strahler method, enabling the identification of stream orders and their spatial distribution (Strahler, 1964). These stream segments were further analyzed to determine parameters such as stream number and stream length, both of which were automatically extracted within the attribute tables using GIS tools. The bifurcation ratio, a key indicator of drainage complexity, was subsequently calculated using hierarchical stream data exported to Excel for further analysis.
Basin dimensions were derived through flow path modeling. The longest flow path was used to define basin length, while basin width was estimated by dividing the total area by the basin length. Watershed boundaries were delineated based on flow accumulation and outlet points, allowing for precise computation of drainage area and perimeter using spatial geometry tools. These delineations provided the basis for calculating a suite of shape indices, including the form factor, elongation ratio, circularity ratio, and texture ratio. Each index contributed to understanding the basin’s geometry and its hydrological response, with elongated basins typically suggesting greater susceptibility to flash floods due to prolonged concentration times and rapid flow convergence.
To further explore runoff behavior, parameters such as drainage density and stream frequency were derived. These indices provided insight into surface permeability and the basin’s capacity to convey water. The constant of channel maintenance and infiltration number complemented this analysis by describing the balance between surface runoff and infiltration. The length of overland flow was also determined, offering valuable data on how far precipitation travels before contributing to channelized flow. Topographic variables, including basin relief and slope, were computed using zonal statistics to determine elevation extremes, which are essential for evaluating energy gradients and terrain ruggedness. These parameters collectively helped characterize the basin’s potential for high-velocity flow and sediment transport during flash flood events.
Validation of spatial outputs was conducted through a multi-source approach. Topographic maps were consulted to cross-check watershed boundaries and stream networks, while high-resolution satellite imagery from Landsat and Sentinel-2 served to verify landform patterns and refine delineations. Supplementary software, including Global Mapper, supported DEM preprocessing task. Where GIS functionalities were limited, Excel was employed for the calculation of derived indices, ensuring completeness of the morphometric dataset.
Despite the systematic nature of this approach, certain limitations were recognized. The precision of extracted parameters is dependent on DEM resolution and the accuracy of hydrological modeling algorithms. While the integration of satellite imagery and cartographic validation improved reliability, the lack of field-based verification introduces some uncertainty, particularly in areas with complex topography or indistinct drainage features. However, the application of consistent georeferencing standards, notably the WGS84-UTM 32N coordinate system, and the use of globally accepted methodologies mitigate potential discrepancies and enhance the comparability of results with other regional studies.
The classification of stream networks provides a structured view of drainage complexity across the basin. To facilitate spatially detailed analysis, the principal watershed was subdivided into 22 sub-basins, enabling the identification of zones with distinct morphometric profiles and varying levels of flash flood susceptibility. The comprehensive list of parameters extracted is summarized in Table 1. These indicators provided a robust foundation for interpreting hydrological behavior and for mapping areas prone to flash flood risk, contributing to a better understanding of the interplay between terrain morphology and flood dynamics (O’Callaghan, and Mark, 1984).
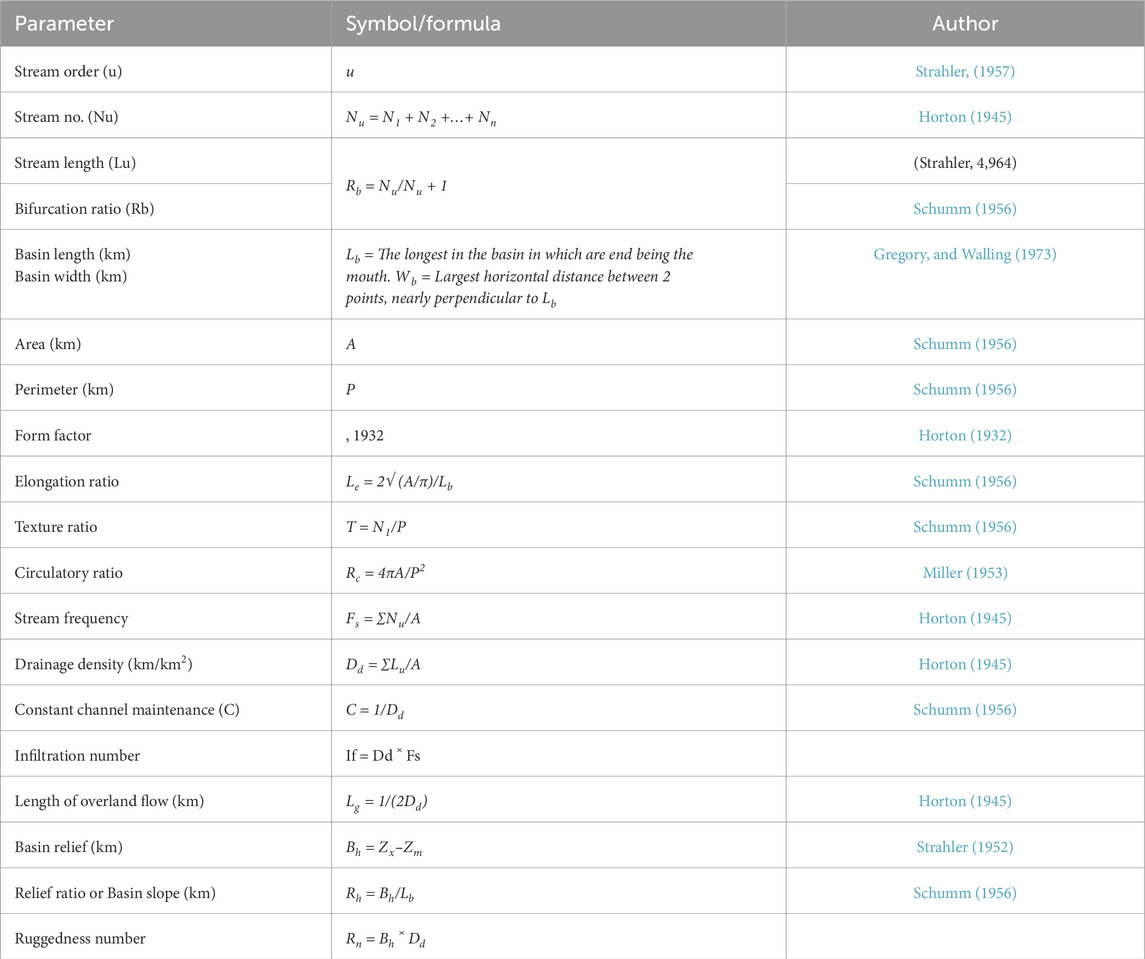
Table 1. Morphometric parameters and the expressed formula adopted in the study.
Our methodology involves the analysis and integration of a range of geomorphic and morphometric parameters. (Buccolini et al., 2012; Wakode et al., 2013). We employed the linear equations method and statistical analysis to evaluate the drainage basin characteristics, aiming to calculate the hydrological conditions and forecast areas susceptible to flood hazards (Figure 3).

Figure 3. Flow chart showing the data and methods adopted in the present study.
Furthermore, these analyses offer insights into the surface and subsurface geological features and structural attributes of the basin, providing valuable information for understanding hydrological processes and mitigating flood risks.
The division of the main watershed into 22 sub-basins was embedded in both hydrological logic and the area’s geomorphological variety. This segmentation was not random; (it followed a clear drainage hierarchy identified through stream order and flow accumulation models). Each sub-basin was delineated at points where noticeable shifts in slope, drainage configuration, or terrain roughness occurred, often reflecting underlying geological or structural controls that influence how runoff behaves and concentrates.
The chosen sub-basins reflect a wide spectrum of physical features, including elevation, slope steepness, drainage density, and surface form. This diversity is essential for comparing morphometric traits and detecting local zones more prone to flash flooding; (such as areas with dense drainage networks, steep gradients and poor water absorption). Analyzing smaller, distinct units makes it easier to detect patterns and vulnerabilities that might be lost when examining the entire watershed as a whole.
By examining these sub-basins individually, the study could highlight differences in form and function that relate directly to flood risk. This refined perspective not only enhances the scientific understanding of flood dynamics but also provides practical value. It allows for more targeted planning, especially in communities with limited resources, by identifying zones where quick runoff and heavy rainfall are most likely to cause damage.
3 Results and discussion
3.1 Analysis of morphometric parameters
The morphometric analysis of the Wadi Saf Saf basin underscores a complex and diverse geomorphological structure that exerts a pronounced influence on the hydrodynamics of the region. The altitudinal variation, ranging from 8 m to 1,148 m above sea level, is especially prominent in the northeastern zone of the basin, directing surface runoff primarily from east to west (Figure 4). This pronounced gradient initiates rapid flow in the upper reaches, while in the downstream portion, the terrain flattens noticeably. Here, the main drainage axis stretches roughly 51 km in length and broadens to 33 km in width, creating a comparatively gentle topographic gradient. Such flattening is likely to decelerate surface flow, thereby encouraging sediment deposition and groundwater infiltration.
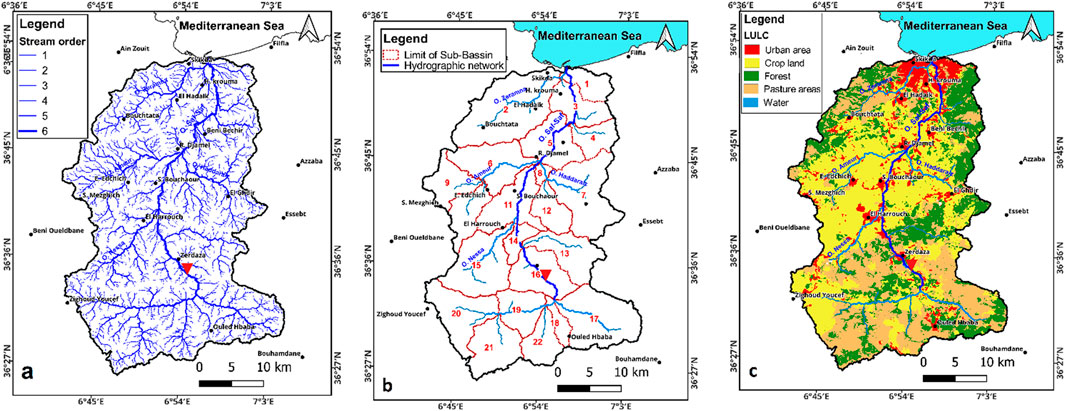
Figure 4. (a) Stream order of the study area; (b) Saf Saf sub basins; (c) Land use and land cover of the investigated basin.
Detailed morphometric measurements across the 22 identified sub-basins show considerable spatial variability in fundamental attributes, including area (6–130 km2), perimeter (16–75 km), and total stream length (3.2–21 km), as detailed in Table 2. The basin as a whole is characterized by a sixth-order drainage hierarchy (Figure 4b), with a rectangular network pattern. This configuration, particularly the near-perpendicular convergence of northwest-trending tributaries with the main channel, suggests tectonic or lithological control. The alignment closely corresponds with known regional structural features, supporting the inference that faulting and jointing significantly influence drainage development—a conclusion aligned with earlier interpretations of structurally guided drainage systems.
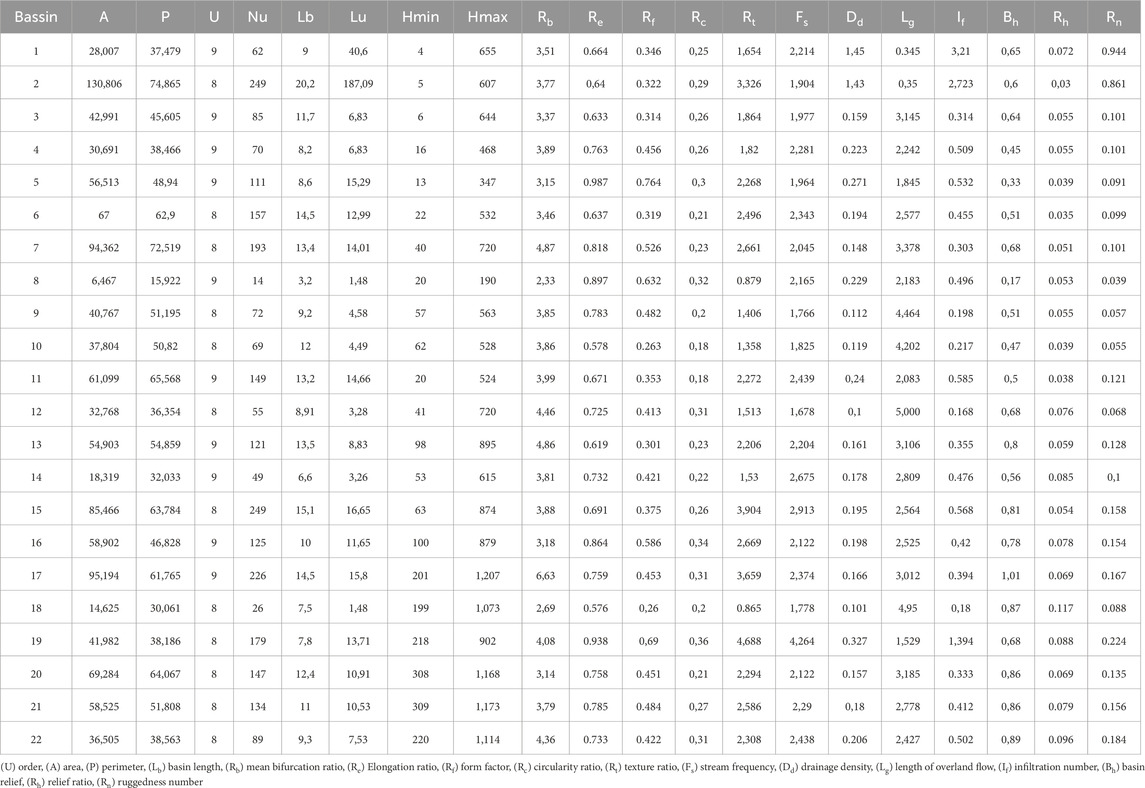
Table 2. Results of the morphometric parameters of Saf Saf sub basin.
One of the most diagnostic parameters in this study is the bifurcation ratio (BR), which varies between 2.33 and 6.63 among the sub-basins, with an average value of 3.56 (Table 2). These results broadly corroborate Strahler’s observation that BR values between 3.0 and 5.0 typically indicate mature, undisturbed drainage systems with minimal structural interference. Sub-basins exhibiting higher BR values, such as sub-basin #17, reflect a well-developed and dissected network with fewer first-order streams. This configuration leads to prolonged travel times for runoff, diminished peak discharges, and a lower likelihood of flash flooding. Such dynamics favor increased groundwater recharge, particularly in alluvial areas (Withanage et al., 2014). Conversely, sub-basins like #8, #18, #20, #5, and #16, which display lower BR values, are likely to have less structurally controlled drainage development and a greater propensity for high-intensity runoff and flash flood occurrence (Figure 4a).
The elongation ratio (ER), form factor (FF), and circularity ratio (CR) further illustrate the hydrological implications of basin geometry. ER values, ranging from 0.578 in sub-basin #10 to 0.987 in sub-basin #5, highlight a predominantly elongated to oval basin shape (Figure 4b), resonating with Schumm’s classification, which links elongation to longer lag times and lower peak flows. Similarly, FF values, which vary between 0.26 and 0.764, reinforce the elongated nature of the basin (Figure 4c), a morphological trait known to mitigate the risk of sudden and intense hydrological responses (Hussein et al., 2019). These geometric indices suggest that many sub-basins have an extended form, which disperses runoff over longer periods and enhances flood attenuation.
Taken together, these morphometric findings not only confirm earlier theoretical and empirical frameworks proposed by Strahler and Schumm but also provide site-specific insights into how geomorphological configurations influence hydrological risks and aquifer recharge potential in the Wadi Saf Saf basin. The variation among sub-basins offers a nuanced understanding of how local structural and topographical controls modulate surface water behavior, with direct implications for flood management, land use planning, and sustainable water resource development.
In contrast, sub-basins like #8, #18, #20, #5, and #16 display lower BR values, indicating a more dendritic and highly branched network with rapid runoff concentration. Such patterns are typically associated with increased flood potential due to reduced infiltration and higher stream density, especially when combined with steep slopes or impermeable surface materials. These areas, as highlighted in Figure 5a, may require targeted interventions in land use planning, such as controlled urban expansion, reforestation, or soil conservation measures, to mitigate hydrological risks and support ecological resilience.
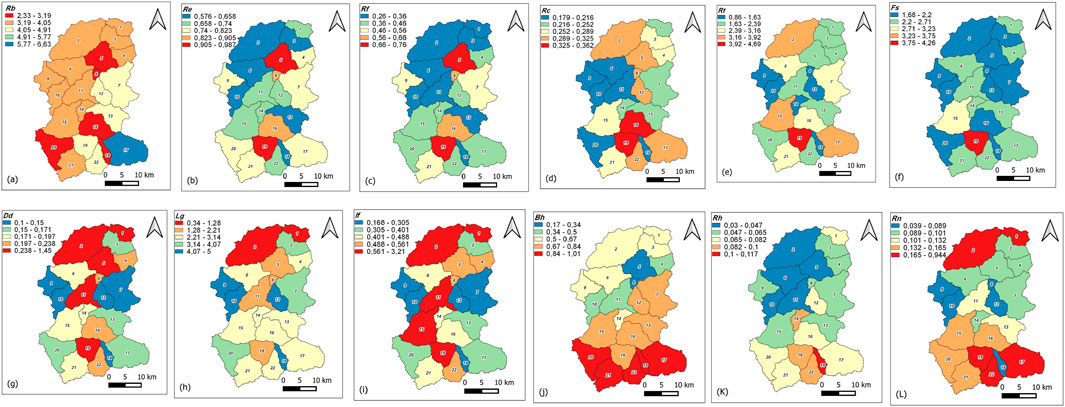
Figure 5. (a) Morphometric parameters of W. Saf Saf: Bifurcation ratio (Rb). (b) Morphometric parameters of W. Saf Saf: elongation ratio (Re). (c) Morphometric parameters of W. Saf Saf: form factor (Rf). (d) Morphometric parameters of W. Saf Saf: circularity ratio (Rc), (e) Morphometric parameters of W. Saf Saf: texture ratio (T), (f) Morphometric parameters of W. Saf Saf: stream frequency (fs), (g) Morphometric parameters of W. Saf Saf: drainage density (Dd), (h) Morphometric parameters of W. Saf Saf: length of overland flow (lg), (i) Morphometric parameters of W. Saf Saf: infiltration number (if), (j) Morphometric parameters of W. Saf Saf: basin relief (Bh), (k) Morphometric parameters of W. Saf Saf: relief ratio (Rh), (l) Morphometric parameters of W. Saf Saf: ruggedness number (Rn).
Beyond hydrological implications, the variation in BR and other morphometric indices has broader environmental and planning relevance. High drainage density and low bifurcation ratios can lead to greater soil erosion and sediment yield, impacting agricultural productivity and aquatic habitats. Conversely, sub-basins with more dispersed networks and higher BR values tend to support more stable landforms, which can be advantageous for sustainable land management, especially in semi-arid zones where water resource conservation is paramount.
The analysis underscores the importance of interpreting morphometric variables not in isolation but as interconnected indicators of both natural landscape evolution and practical planning challenges. In the context of Wadi Saf Saf, understanding these geomorphometric controls is essential for guiding flood management strategies, informing land use zoning, and promoting long-term ecological and hydrological balance in the region.
The analysis of elongation ratio (ER), form factor (FF), and circularity ratio (CR) reveals that the Wadi Saf Saf sub-basins predominantly exhibit elongated morphologies, indicative of their geomorphic and hydrological behavior (Table 2). ER values range between 0.578 in sub-basin #10 and 0.987 in sub-basin #5 (Figure 5b), suggesting a transition from distinctly oval to nearly linear shapes. These findings align with Schumm’s classification, wherein elongated basins are associated with prolonged flow durations and a more diffused peak discharge during storm events. Such basin geometry contributes to reduced flood peaks, enhanced groundwater recharge, and increased ecological resilience in alluvial landscapes.
Similarly, form factor (FF) values span from 0.26 to 0.764 across the sub-basins (Figure 5c) (Hussein et al., 2019), further confirming the elongated nature of the catchments. The low FF values suggest extended concentration times and delayed runoff responses, which are crucial in flood mitigation strategies. Circularity ratio (CR), based on Miller’s approach, ranges from 0.18 in sub-basins #10 and #11 to 0.36 in sub-basin #19, with a mean of 0.259 (Figure 5d). These values imply a significant deviation from circular basin geometry, often associated with less efficient drainage systems and prolonged surface runoff pathways. The strong positive correlations observed among ER, FF, and CR further support the predominance of elongated shapes across the catchment, indicating favorable hydrological behavior characterized by moderate flow accumulation and reduced flash flood susceptibility (Altaf et al., 2013).
To deepen the understanding of surface flow behavior and soil permeability, we analyzed additional morphometric indices such as texture ratio (TR), stream frequency (SF), drainage density (DD), and length of overland flow (Lg). Texture ratio, defined as the number of first-order streams per unit basin perimeter (Mishra, and Rai, 2020), ranges from 0.865 in sub-basin #18 to 4.688 in sub-basin #19 (Figure 5e), with a mean of 2.282. According to Smith’s drainage texture classification (1950), these values correspond to a coarse to moderate drainage texture. Coarse textures are indicative of permeable surface materials and less resistant substrata, which typically support vegetation cover and minimize erosion; essential factors in sustaining land productivity and ecological diversity.
Stream frequency (SF), the number of streams per unit area, varies between 1.678 (sub-basin #12) and 4.264 (sub-basin #19) (Figure 5f). The overall low SF values, averaging 2.262, suggest gently sloping terrains and limited structural control, consistent with fluvial processes dominating surface runoff. These low SF values are also indicative of relatively stable surface conditions, where lower stream intensities allow greater infiltration and potential for aquifer recharge.
Drainage density (DD), a measure of total stream length per unit area, offers insights into runoff potential and lithological characteristics. In Wadi Saf Saf, DD values range from 0.1 km/km2 (sub-basin #12) to 1.45 km/km2 (sub-basin #1), with an average of 0.297 km/km2 (Figure 5d). Such low drainage densities imply that the basin is underlain by permeable soils or sediments, potentially composed of coarse-grained alluvium that facilitates infiltration. This characteristic not only reduces the risk of rapid surface runoff but also enhances the ecological services of aquifers, such as sustaining base flow and supporting riparian vegetation.
The length of overland flow (Lg), computed as the reciprocal of twice the drainage density (Lg = 1/2DD), varies significantly across the study area—from 0.345 km in sub-basin #1–5.0 km in sub-basin #12, with a mean of 2.759 km (Figure 5h). Basins with lower Lg values exhibit faster surface water convergence, increasing their vulnerability to intense runoff and flash flooding. Conversely, sub-basins with longer Lg values demonstrate greater capacity for infiltration and groundwater recharge, which is critical in semiarid climates like that of northeastern Algeria.
An important derivative of SF and DD is the infiltration number (If), introduced by Faniran and further applied by Sahu et al. (Sahu et al., 2017), which quantifies infiltration potential. Values range from 3.21 in sub-basin #1 to 0.168 in sub-basin #12, with an average of 0.67 (Figure 5i). Higher infiltration numbers typically correspond to areas with low infiltration capacity and high runoff, while lower values indicate better infiltration, enhancing subsurface water availability—a key factor for land use planning and sustainable agriculture in dryland contexts.
Relief characteristics offer additional insight into runoff energy, erosion potential, and terrain ruggedness. The total basin relief (Bh), calculated as the difference between the highest (Z) and lowest (z) elevations in the catchment, is 1.142 km for the Wadi Saf Saf basin. Among the sub-basins, Bh ranges from 0.17 km (sub-basin #8) to 1.01 km (sub-basin #17), with an average of 0.65 km (Figure 5j). Relief ratio (Rh), representing the gradient of the basin (Rh = Bh/basin length), is about 0.022 for the overall basin and ranges between 0.03 (sub-basin #2) and 0.117 (sub-basin #18), averaging 0.0632 (Figure 5k). These values suggest that the catchment is relatively low in relief, with moderate slopes that generally reduce the kinetic energy of surface runoff, lowering erosion risk and sediment yield.
To further explore the interaction between slope steepness and drainage intensity, the ruggedness number (Rn), defined as the product of Bh and DD, was calculated. Rn values range from 0.039 in sub-basin #8 to 0.944 in sub-basin #1, with a mean of 0.187 (Figure 5l). Higher Rn values reflect areas of steep slopes combined with dense drainage networks, conditions typically associated with high runoff potential, accelerated erosion, and limited land usability. Conversely, sub-basins with lower ruggedness numbers are more favorable for agricultural development and urban expansion due to their milder terrain and lower risk of degradation.
These morphometric parameters collectively provide an integrative understanding of how topography, geology, and drainage geometry influence hydrological dynamics, ecological functions, and land use suitability in the Wadi Saf Saf basin. The interplay of elongated basin shapes, low drainage density, moderate relief, and high infiltration potential underscores a landscape that, while susceptible to localized runoff in some areas, generally favors water retention and sustainable land management under semiarid conditions.
3.2 Mapping flash flood potentials and regional implications
Flash flood potential is strongly influenced by a suite of geomorphometric parameters, particularly those reflecting basin shape, drainage characteristics, and terrain steepness (Zare et al., 2013). In this study, twelve morphometric indices; ranging from bifurcation ratio (Rb) to drainage network ruggedness number (Rn); were analyzed to delineate sub-basins with heightened susceptibility to flash flooding (Table 2).
High relief ratios and drainage densities were observed to correspond with areas of steep slopes and tightly spaced stream networks, both of which accelerate runoff and reduce infiltration capacity. These hydrological dynamics amplify surface flow velocity and volume, thereby increasing flash flood hazard, especially during high-intensity storm events. Similarly, elevated stream slopes and rugged terrain intensify downstream energy, contributing to rapid water accumulation and channel overflow.
Basin geometry also emerged as a critical determinant of flood behavior. Sub-basins with near-circular forms are hydrologically efficient in channeling runoff toward outlets in a short period. These geometric features translate into shorter lag times and more concentrated discharge peaks, which collectively elevate flash flood risk. By contrast, elongated basins distribute runoff over longer durations, often mitigating peak flow magnitude.
The role of drainage density extends beyond surface runoff generation; it also reflects the degree of surface permeability and subsurface infiltration potential (Bangira, 2013). In areas where form factor (Rf), elongation ratio (Re), and circularity ratio (Rc) are high, infiltration is limited and surface water accumulates quickly, exacerbating flood vulnerability.
An inverse relationship was found between bifurcation ratio (Rb) and flood risk. Low Rb values indicate a more branched and integrated stream system, which can rapidly convey runoff from higher elevations to valley floors, leaving minimal time for absorption or attenuation (Abdel Ghaffar et al., 2015). This has direct implications for regions where land development near river mouths and floodplains persists despite hydrological constraints.
To refine the mapping of flood-prone zones, we integrated morphometric data with rainfall intensity, land cover types, and terrain properties. This integrative approach enabled a more robust estimation of flash flood potential, accounting for both physiographic and anthropogenic influences.
3.2.1 Quantitative estimation using linear equations
Linear normalization was employed to standardize ten positively correlated parameters (e.g., Dd, Rc, Rh, etc.) across sub-basins (Table 3). The degree of hazard (HD) for each parameter was computed using Equation 1, allowing for comparative analysis across varying hydrological conditions (Davis, 1975; Pirkhofer et al., 2009):
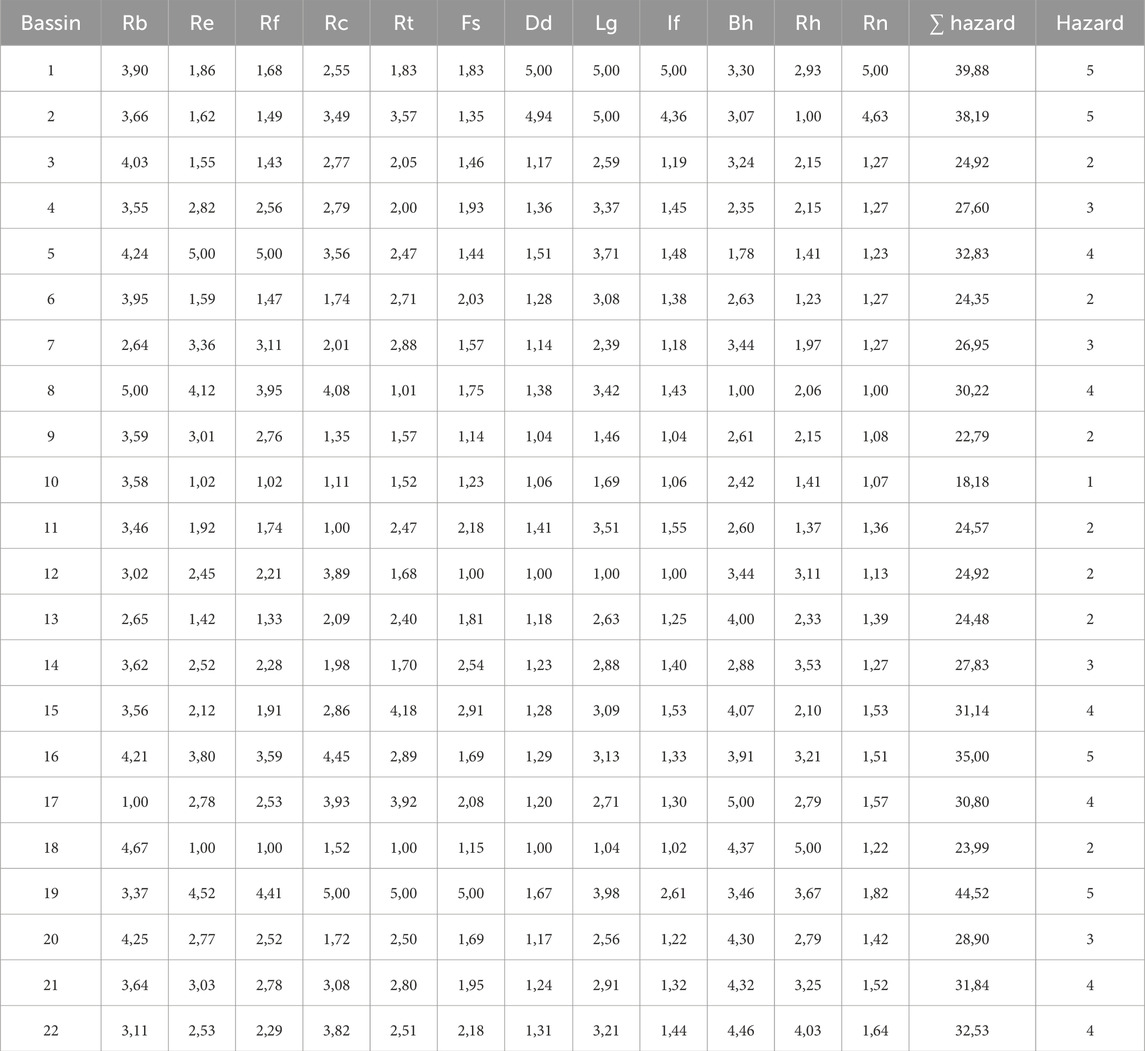
Table 3. Hazard degree for morphometric parameters.
Here, x denotes the individual morphometric value, and xmin and xmax are the minimum and maximum observed values, respectively (Bajabaa et al., 2014).
This standardization facilitated the identification of extreme hazard zones, particularly in sub-basins #19, 1, 2, and 16, which consistently exhibited the highest hazard degrees. Sub-basin #10, by contrast, revealed minimal hazard potential (Table 3). These findings were translated into a hazard potential classification map, stratified into five risk categories using a GIS-based quantitative classifier (Abdelkareem et al., 2012), (Figures 6, 7).
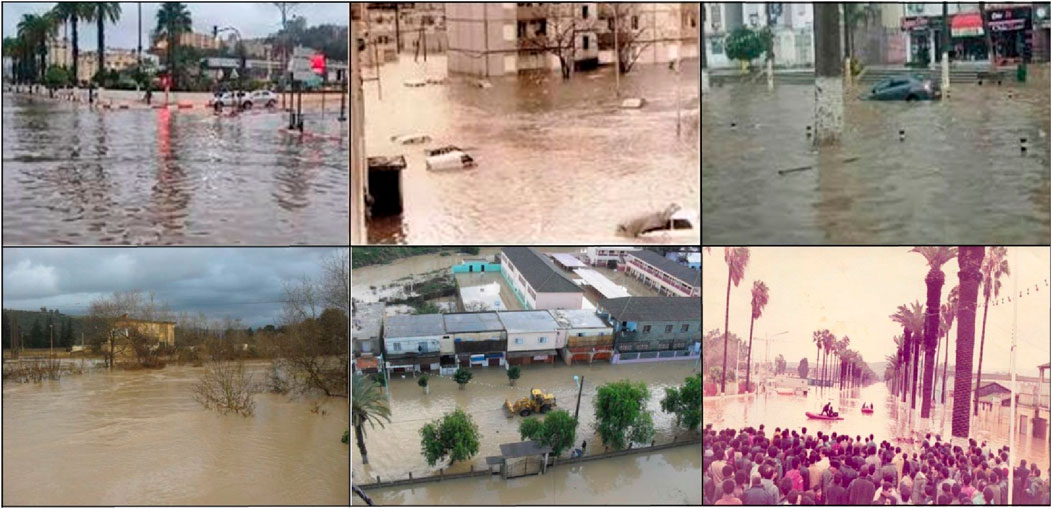
Figure 6. Photographic image of flood hazards in the study area.
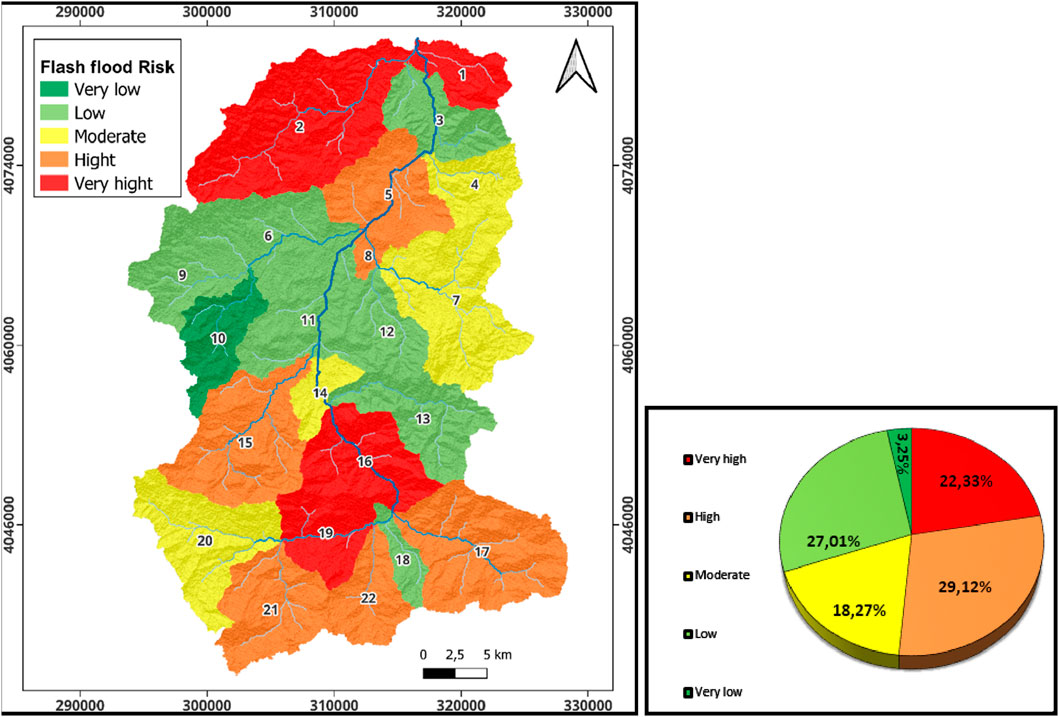
Figure 7. Flash flood Risk map of Saf Saf watershed.
3.2.2 Spatial integration and sub-watershed ranking
A weighted overlay analysis was conducted to integrate morphometric rankings into a unified hazard map (Erfan et al., 2022). GIS raster layers were constructed for each parameter—such as relief ratio, stream frequency, infiltration number, and overland flow length—and ranked into hierarchical classes (Figure 7). This multilayered integration permitted a nuanced depiction of spatial variability in runoff generation potential.
The final hazard map categorized sub-basins into five distinct flash flood potential classes. Sub-basins #16, 1, 2, and 19 were consistently flagged as high-risk zones, while sub-basin #10 ranked lowest in flood susceptibility. High hazard areas were predominantly located in the upstream portion of the watershed (Figures 6, 7), where steeper slopes, shallow soils, and minimal vegetation cover prevail.
3.2.3 Correlation with regional hydrology and land use
The spatial pattern of flood potential revealed in this study aligns closely with the region’s hydrological regime and evolving land use practices. The high-risk upstream zones often coincide with overgrazed or deforested slopes, where vegetation loss has diminished natural infiltration capacity. Additionally, expanding agricultural activities and urbanization in mid- and downstream areas have disrupted traditional drainage patterns, further accelerating runoff and reducing basin resilience.
Furthermore, unregulated land development along riverbanks and alluvial fans increases exposure to flooding events, especially in sub-basins with low bifurcation ratios and high drainage density. These anthropogenic modifications not only heighten vulnerability but also complicate water management, as surface sealing through construction diminishes the natural buffering role of soils.
This correlation between morphometric vulnerability and land use pressures underscores the importance of integrating geomorphological assessments into regional planning and watershed management. By identifying zones of natural hydrological stress and overlaying them with human-induced risks, more effective flood mitigation strategies—such as reforestation, zoning regulations, and early warning systems—can be tailored to the specific vulnerabilities of each sub-basin.
The findings of this study offer practical insights that go well beyond the initial scope of flood risk and infiltration analysis. By evaluating key morphometric parameters, it becomes possible to identify zones suited for the construction of hydraulic structures, such as small reservoirs and water retention basins. These features play a crucial role in regulating surface runoff, reducing peak flow during intense rainfall, and contributing to the recharge of underlying aquifers. Such strategies are particularly relevant for regions facing irregular precipitation or seasonal water scarcity, supporting a more efficient and sustainable approach to water resource management.
In urban and territorial planning, morphometric indicators can inform decisions that reduce exposure to hydrological hazards. The delineation of flood-prone areas provides essential guidance for avoiding risky zones during future development and for improving conditions in already vulnerable urban spaces. Measures such as reinforcing drainage networks, adopting green infrastructure solutions, or adjusting land-use policies can be implemented to enhance urban resilience. This spatially informed planning helps mitigate the impact of extreme weather events and supports the creation of safer living environments.
From an environmental perspective, the study also contributes to conservation efforts by identifying zones that function as natural buffers. Preserving features like vegetated slopes, riverbanks, and undeveloped corridors helps control erosion, slow runoff, and maintain critical habitats. These areas not only reduce the intensity of flooding but also sustain biodiversity and ecosystem stability, both of which are increasingly threatened by land degradation and climate change.
Furthermore, the integration of morphometric data into local risk management systems can strengthen early warning mechanisms. Knowing which sub-basins are more susceptible to rapid runoff helps authorities anticipate critical events and take timely preventive action. Such preparedness not only reduces human and economic losses but also reinforces public safety and institutional response capacity.
The findings of this study open several avenues for future research that could deepen understanding of hydromorphometric influences on flood dynamics in semi-arid and structurally complex regions. One promising direction involves the integration of higher-resolution topographic data, such as LiDAR or UAV-derived DEMs, to improve the precision of watershed delineation and the calculation of sensitive morphometric indices. Enhanced elevation datasets would be particularly beneficial in dissecting minor drainage features and micro-reliefs that are often missed with coarser-resolution DEMs. This refinement would contribute to a more accurate delineation of sub-basins and better representation of surface runoff paths.
Further exploration could also focus on temporal analyses that examine how seasonal or interannual variations in land use, vegetation cover, and rainfall patterns influence morphometric parameters and flood susceptibility. Incorporating multi-temporal satellite imagery, particularly indices like NDVI, could help assess land cover dynamics and their impact on infiltration rates and surface runoff, enriching the predictive value of morphometric models.
In parallel, a deeper integration of geotechnical and subsurface data would enhance the understanding of hydrological responses linked to soil permeability, lithology, and structural discontinuities. Embedding such subsurface information into hydromorphometric models could bridge the gap between surface geometry and subsurface hydraulic behavior, especially in basins influenced by tectonic structures or karst features.
Modeling-based research that couples morphometric findings with hydrological simulations would also be valuable. Utilizing rainfall-runoff models, such as HEC-HMS or SWAT, calibrated with local precipitation and discharge data, could validate morphometric interpretations and translate them into quantifiable flood risks. These models, when driven by parameters derived from morphometric analyses, would not only confirm spatial vulnerability but also forecast temporal dynamics, including flood peaks and lag times.
Another critical direction lies in comparative studies across neighboring or geologically analogous basins. Applying the same methodology in different physiographic and climatic contexts would test the transferability of the current approach and highlight regional distinctions in drainage behavior. Such comparative frameworks could lead to the development of morphometric thresholds or typologies that aid in the rapid assessment of flood-prone areas.
Moreover, future research could benefit from participatory approaches that link morphometric findings with community-based flood perception and response capacity. Incorporating local knowledge about historical flood events and integrating these insights with GIS-based hazard maps could strengthen the social relevance of scientific outputs and inform early warning systems tailored to community-specific vulnerabilities.
Finally, as climate variability increasingly alters rainfall intensity and duration, integrating climate model outputs into morphometric-based flood assessments will become essential. Scenario analysis under projected climate conditions would allow researchers and planners to anticipate shifts in flood behavior, offering a more dynamic risk evaluation framework that evolves with environmental change.
Collectively, these research pathways underscore the value of morphometric analysis not only as a diagnostic tool for present-day hazard assessment but also as a foundational layer for multi-scalar, interdisciplinary, and forward-looking studies in hydrological science.
4 Conclusion
Flash floods represent a significant natural hazard, particularly in regions with limited infrastructure for risk management, such as many developing areas. This study addresses this challenge by developing an integrated methodology to assess and predict flash flood hazards within the Saf Saf basin in Eastern Algeria. The approach combines Geographic Information Systems (GIS), Remote Sensing (RS), and detailed morphometric analysis, offering a reliable tool for identifying flood-prone zones with enhanced spatial precision.
A key innovation of this research lies in the integration of diverse datasets; SRTM DEM, precipitation data, and Landsat eight imagery) to calculate and interpret a wide range of morphometric parameters across 22 sub-basins. These parameters, encompassing linear, areal, and relief characteristics, provided valuable insights into the basin’s hydrological dynamics. Notably, the relief analysis revealed a westward plateau tilt, which appears to play a significant role in directing surface runoff and sediment transport.
The study further distinguishes itself by employing composite morphometric indices; (such as the bifurcation ratio, elongation ratio, form factor, circularity ratio, and ruggedness number) to classify the basin into five hazard zones: very high (22.33%), high (29.12%), moderate (18.27%), low (27.01%), and very low (3.25%). This stratification offers a clear framework for prioritizing areas at greater risk and guiding targeted mitigation strategies.
By overlaying additional spatial variables; (such as rainfall distribution, slope gradients, and stream density) the analysis enabled precise mapping of zones vulnerable to flash flooding, particularly along the main drainage channels. Validation with Landsat eight imagery confirmed the model’s reliability in delineating flood-affected areas.
Overall, this work illustrates the effectiveness of integrating geomorphological analysis with geospatial technologies to assess flood hazards in semi-arid, data-scarce environments. The proposed framework not only supports hydrological modeling and flood risk mapping but also serves as a practical reference for early warning systems and disaster mitigation planning. The study’s findings contribute to building more resilient landscapes through informed, evidence-based decision-making in flash flood management.
Data availability statement
The original contributions presented in the study are included in the article/supplementary material, further inquiries can be directed to the corresponding authors.
Author contributions
AM: Formal Analysis, Data curation, Conceptualization, Writing – review and editing, Writing – original draft. SS: Resources, Investigation, Writing – original draft, Data curation, Methodology. KF: Funding acquisition, Project administration, Visualization, Resources, Validation, Writing – review and editing. AA: Data curation, Writing – original draft, Methodology. RH: Writing – review and editing, Writing – original draft, Visualization, Project administration, Validation, Supervision. SA: Writing – original draft, Methodology, Data curation. KH: Conceptualization, Writing – original draft, Software. EA: Writing – original draft, Data curation, Conceptualization. GS: Data curation, Writing – original draft, Investigation. BL: Writing – original draft, Conceptualization, Investigation. JA: Data curation, Writing – original draft.
Funding
The author(s) declare that financial support was received for the research and/or publication of this article. Princess Nourah bint Abdulrahman University Researchers Supporting Project number (PNURSP 2025R673), Princess Nourah bint Abdulrahman University, Riyadh, Saudi Arabia.
Acknowledgments
Princess Nourah bint Abdulrahman University Researchers Supporting Project number (PNURSP 2025R673), Princess Nourah bint Abdulrahman University, Riyadh, Saudi Arabia.
Conflict of interest
The authors declare that the research was conducted in the absence of any commercial or financial relationships that could be construed as a potential conflict of interest.
Generative AI statement
The author(s) declare that no Generative AI was used in the creation of this manuscript.
Publisher’s note
All claims expressed in this article are solely those of the authors and do not necessarily represent those of their affiliated organizations, or those of the publisher, the editors and the reviewers. Any product that may be evaluated in this article, or claim that may be made by its manufacturer, is not guaranteed or endorsed by the publisher.
References
Abdel-Fattah, M., Saber, M., Kantoush, S. A., Khalil, M. F., Sumi, T., and Sefelnasr, A. M. (2017). A hydrological and geomorphometric approach to understanding the generation of wadi flash floods. Water 9 (7), 553. doi:10.3390/w9070553
Abdel Ghaffar, M. K., Abdellatif, A. D., Azzam, M. K., and Riad, M. H. (2015). Watershed characteristic and potentiality of wadi el-arish, sinai, Egypt. Int. J. Adv. Remote Sens. GIS 4 (1), 1070–1091. doi:10.23953/cloud.ijarsg.99
Abdelkader, M. M., Al-Amoud, A. I., El Alfy, M., El-Feky, A., and Saber, M. (2021). Assessment of flash flood hazard based on morphometric aspects and rainfall-runoff modeling in Wadi Nisah, central Saudi Arabia. Remote Sens. Appl. Soc. Environ. 23, 100562. doi:10.1016/j.rsase.2021.100562
Abdelkareem, M., El-Baz, F., Askalany, M., Akawy, A., and Ghoneim, E. (2012). Groundwater prospect map of Egypt's Qena Valley using data fusion. Int. J. Image Data Fusion 3 (2), 169–189. doi:10.1080/19479832.2011.569510
Altaf, F., Meraj, G., and Romshoo, S. A. (2013). Morphometric analysis to infer hydrological behaviour of Lidder watershed, Western Himalaya, India. Geogr. J. 2013 (1), 178021–14. doi:10.1155/2013/178021
Bajabaa, S., Masoud, M., and Al-Amri, N. (2014). Flash flood hazard mapping based on quantitative hydrology, geomorphology, and GIS techniques (case study of Wadi Al Lith, Saudi Arabia). Arabian J. Geosciences 7, 2469–2481. doi:10.1007/s12517-013-0941-2
Bangira, T. (2013). Mapping of flash flood potential areas in the Western Cape (South Africa) using remote sensing and in situ data. Enschede, Netherlands: M.Sc. Thesis.
Basahi, J., Masoud, M., and Zaidi, S. (2016). Integration between morphometric parameters, hydrologic model, and geo-informatics techniques for estimating WADI runoff (case study WADI HALYAH—Saudi Arabia). Arabian J. Geosciences 9, 610–618. doi:10.1007/s12517-016-2649-6
Bashir, B. (2023). Morphometric parameters and geospatial analysis for flash flood susceptibility assessment: a case study of jeddah city along the red sea coast, Saudi Arabia. Water 15 (5), 870. doi:10.3390/w15050870
Buccolini, M., Coco, L., Cappadonia, C., and Rotigliano, E. (2012). Relationships between a new slope morphometric index and calanchi erosion in northern Sicily, Italy. Geomorphology 149, 41–48. doi:10.1016/j.geomorph.2012.01.012
Chen, W., Li, Y., Xue, W., Shahabi, H., Li, S., Hong, H., et al. (2020). Modeling flood susceptibility using data-driven approaches of naïve Bayes tree, alternating decision tree, and random forest methods. Sci. Total Environ. 701, 134979. doi:10.1016/j.scitotenv.2019.134979
Erfan, M., Mahmood, A., and Mohamad Taghi, D. (2022). Comparison of different objective weighting methods in a multi-criteria model for watershed prioritization for flood risk assessment using morphometric analysis. J. Flood Risk Manag. 16, e12894. doi:10.1111/jfr3.12894
Ghosh, A., Dey, P., and Ghosh, T. (2022). Integration of RS-GIS with frequency ratio, fuzzy logic, logistic regression and decision tree models for flood susceptibility prediction in lower Gangetic plain: a study on Malda district of West Bengal, India. J. Indian Soc. Remote Sens. 50 (9), 1725–1745. doi:10.1007/s12524-022-01560-5
Gregory, K. J., and Walling, D. E. (1973). Drainage basin form and process—a geomorphological approach. London: Edward Arnold.
Horton, R. E. (1932). Drainage basin characteristics. Trans. Am. Geophys Union 13, 350–361. doi:10.1029/TR013i001p00350
Horton, R. E. (1945). Erosional development of streams and their drainage basins—hydrophysical approach to quantitative morphology. Geol. Soc. Am. Bull. 56 (3), 275–370. doi:10.1130/0016-7606(1945)56[275:edosat]2.0.co;2
Hussein, S., Abdelkareem, M., Husseina, R., and Askalanya, M. (2019). Using remote sensing data for predicting potential areas to flash flood hazards and water resources. Remote Sens. Appl. Soc. Environ. 16, 100254. doi:10.1016/j.rsase.2019.100254
Isazade, V., Isazade, V., Isazade, E., Isazade, E., Qasimi, A. B., Qasimi, A. B., et al. (2023). Integrating passive and active remote sensing data with spatial filters for urban growth analysis in urmia, Iran. Russ. J. Earth Sci. 23 (5), 1–16. doi:10.2205/2023es000861
Mahleb, A., Hadji, R., Zahri, F., Boudjellal, R., Chibani, A., and Hamed, Y. (2022). Water-borne erosion estimation using the revised universal soil loss equation (RUSLE) model over a semiarid watershed: case study of meskiana catchment, Algerian-Tunisian border. Geotechnical Geol. Eng. 40 (8), 4217–4230. doi:10.1007/s10706-022-02152-3
Mahmood, S., Khan, A. U. H., and Mayo, S. M. (2016). Exploring underlying causes and assessing damages of 2010 flash flood in the upper zone of Panjkora River. Nat. Hazards 83, 1213–1227. doi:10.1007/s11069-016-2386-x
Mahmoud Shaaban Mabrouk, M., Mohamed Wafaie Abdel-Salam, E., and Serwa, A. (2022). Geomorphological hazard analysis using dem along the eastern coast between marsa alam and ras gharib, Egypt. Eng. Res. J. 174, 1–21. doi:10.21608/erj.2022.240856
Miller, V. C. (1953). A quantitative geomorphic study of drainage basin characteristics in the Clinch Mountain area, Virginia and Ten-nessee, Project NR 389042, 3. ONR, Geography Branch, New York: Columbia University, Department of Geology.
Mishra, A. K., and Rai, S. C. (2020). Geo-hydrological inferences through morphometric aspects of the Himalayan glacial-fed river: a case study of the Madhyamaheshwar River basin. Arabian J. Geosciences 13 (13), 533–18. doi:10.1007/s12517-020-05571-9
Nasir, M. J., Iqbal, J., and Ahmad, W. (2020). Flash flood risk modeling of Swat river sub-watershed: a comparative analysis of morphometric ranking approach and El-Shamy approach. Arabian J. Geosciences 13 (20), 1082. doi:10.1007/s12517-020-06064-5
O’Callaghan, J. F., and Mark, D. M. (1984). The extraction of drainage networks from digital elevation data. Comput. Vis. Gr Image Process 28, 323–344. doi:10.1016/s0734-189x(84)80011-0
Pirkhofer, E., Czigány, S., and Geresdi, I. (2009). Impact of rainfall pattern on the occurrence of flash floods in Hungary. Z. Für Geomorphol. 53, 139–157. doi:10.1127/0372-8854/2009/0053S3-0139
Sahu, N., Reddy, G. O., Kumar, N., Nagaraju, M. S. S., Srivastava, R., and Singh, S. K. (2017). Morphometric analysis in basaltic terrain of Central India using GIS techniques: a case study. Appl. Water Sci. 7 (5), 2493–2499. doi:10.1007/s13201-016-0442-z
Sarkar, P., and Gayen, S. K. (2024). Prioritization and regionalisation of sub-watershed for flash flood susceptibility in the upper teesta river basin, North Sikkim, India. J. Indian Soc. Remote Sens. 53, 1627–1645. doi:10.1007/s12524-024-02051-5
Schumm, S. A. (1956). Evaluation of drainage systems and slopes in badlands at Perth Amboy, New Jersey. Bull. Geol. Soc. Am. 67, 597–646. doi:10.1130/0016-7606(1956)67[597:eodsas]2.0.co;2
Serwa, A., Qasimi, A. B., and Isazade, V. (2024). Registration of interferometric DEM by deep artificial neural networks using GPS control points coordinates as network target. Int. J. Eng. Geosciences 9 (2), 292–301. doi:10.26833/ijeg.1467293
Strahler, A. N. (1952). Dynamic basis of geomorphology. Geol. Soc. Am. Bull. 63 (9), 923–938. doi:10.1130/0016-7606(1952)63[923:dbog]2.0.co;2
Strahler, A. N. (1957). Quantitative analysis of watershed geomorphology. Trans. Am. Geophys Union 38, 913–920. doi:10.1029/TR038i006p00913
Strahler, A. N. (1964). “Part II. Quantitative geomorphology of drainage basins and channel networks,” in Handbook of applied hydrology (New York: McGraw-Hill), 439–476.
Taib, H., Hadji, R., Bedri, K., Defaflia, N., Hamed, Y., Gentilucci, M., et al. (2024a). Morphometric analysis and risk assessment of flash floods in the Atlas chain of eastern Algeria and the Algerian–Tunisian borders. Euro-Mediterranean J. Environ. Integration 10, 749–763. doi:10.1007/s41207-024-00617-w
Taib, H., Hadji, R., Hamed, Y., Bensalem, M. S., and Amamria, S. (2024b). Exploring neotectonic activity in a semiarid basin: a case study of the Ain Zerga watershed. J. Umm Al-Qura Univ. Appl. Sci. 10 (1), 20–33. doi:10.1007/s43994-023-00072-3
Wakode, H. B., Dutta, D., Desai, V., Baier, K., and Azzam, R. (2013). Morphometric analysis of the upper catchment of Kosi River using GIS techniques. Arab. J. Geosci. 6, 395–408. doi:10.1007/s12517-011-0374-8
Withanage, N. S., Dayawansa, N. D. K., and De Silva, R. P. (2014). Morphometric analysis of the Gal Oya river Basin using spatial data derived from GIS. Trop. Agric. Res. 26 (1), 175–188. doi:10.4038/tar.v26i1.8082
Youssef, A. M., Pradhan, B., and Hassan, A. M. (2011). Flash flood risk estimation along the St. Katherine road, southern Sinai, Egypt using GIS based morphometry and satellite imagery. Environ. Earth Sci. 62 (3), 611–623. doi:10.1007/s12665-010-0551-1
Zare, M., Pourghasemi, H. R., Vafakhah, M., and Pradhan, B. (2013). Landslide susceptibility mapping at Vaz Watershed (Iran) using an artificial neural network model: a comparison between multilayer perceptron (MLP) and radial basic function (RBF) algorithms.Arabian J. Geosciences 6, 2873–2888. doi:10.1007/s12517-012-0610-x
Keywords: flash flooding, morphometric parameters, geohazard, mapping, disaster
Citation: Maou A, Souadnia S, Faqeih K, AlAmri A, Hadji R, Alamri Sm, Harizi K, Alamery E, Sonia G, Leila B and Altwaiher J (2025) Assessing flash flood occurrences and hazard zones along the mediterranean coasts: a GIS and mapping techniques approach in the Wadi Saf Saf Basin, Northeast Algeria. Front. Earth Sci. 13:1594364. doi: 10.3389/feart.2025.1594364
Received: 15 March 2025; Accepted: 26 May 2025;
Published: 12 June 2025.
Edited by:
Chong Xu, National Institute of Natural Hazards, Ministry of Emergency Management), ChinaReviewed by:
Heba El-Bagoury, Port Said University, EgyptA. Serwa, Helwan University, Egypt
Mohamed Alkhuzamy Aziz, Fayoum University, Egypt
Copyright © 2025 Maou, Souadnia, Faqeih, AlAmri, Hadji, Alamri, Harizi, Alamery, Sonia, Leila and Altwaiher. This is an open-access article distributed under the terms of the Creative Commons Attribution License (CC BY). The use, distribution or reproduction in other forums is permitted, provided the original author(s) and the copyright owner(s) are credited and that the original publication in this journal is cited, in accordance with accepted academic practice. No use, distribution or reproduction is permitted which does not comply with these terms.
*Correspondence: Riheb Hadji, aGFkamkucmloYWJAdW5pdi1zZXRpZi5keg==