 Chao Li1,2
 Qiang Yuan
 Mingtian Zhang
- 1Chongqing Institute of Surveying and Mapping Science and Technology, Chongqing, China
- 2Technology innovation Center for Spatio-temporal Information and Equipment of Intelligent City, Ministry of Natural Resources, Chongqing, China
- 3State Key Laboratory of Coal Mine Disaster Dynamics and Control, National Innovation Center for Industry-Education Integration of Energy Storage Technology, School of Resources and Safety Engineering, Chongqing University, Chongqing, China
In order to explore the support pressure distribution law in the coal and rock mass around the stope and rock masses under an extremely thick conglomerate layer and evaluate the feasibility of different monitoring techniques, the study established the geometric size of a similar physical model as 3.6 m (length) × 2.0 m (width) × 2.0 m (height) in the laboratory. The test used pulse pre-pumped Brillouin optical time domain analysis (PPP-BOTDA) and pressure sensor technology to monitor distribution law. We placed pressure sensors and sensing elements at the bottom plate of the model to simulate the support pressure distribution around the stope under the thick conglomerate layer. And used theoretical calculations and numerical simulations to conduct comparative analysis. The test results showed that the distributed optical fiber support pressure test system can be used to characterize the variation law of support pressure in the model test. Compared with the pressure sensor, it had a good corresponding relationship. Both of them were basically consistent with the theoretical calculation results and simulation. The optical fiber test had the advantages of high precision and strong anti-interference ability, which were not available in the electric sensor. It provided a new idea for the support pressure test of the model experiment.
1 Introduction
Coal had long served as the core pillar of China’s energy structure (Figure 1). It would continue to play a key role in economic growth for the foreseeable future (Yuan et al., 2013). While the advancement of energy transformation and carbon neutralization processes was reshaping the energy landscape, coal remains irreplaceable in China’s energy consumption mix in the short term. Nevertheless, this reliance on coal poses significant environmental challenges, with mining operations causing substantial surface ecosystem damage and combustion processes releasing massive amounts of greenhouse gases, particularly carbon dioxide (Jing et al., 2025). And proportion was dominant in the energy structure. As shown in Figure 1, the use of coal decreased from 2010 to 2022, but its overall share occupied a high level. This indicated that in the process of energy structure optimization and diversification, coal played an important role in China’s economic development. However, with the increase of coal mining depth, the stability of deep surrounding rock had gradually emerged. It became a key factor restricting mine production safely and efficiently in areas with significant tectonic stress. While the stress level increased, the support became more difficult accordingly. It can lead to the increasingly prominent support problem in the mine operation. Therefore, it was necessary to continuously optimize the support design and strengthen the mine management to deal with the instability of deep surrounding rock.
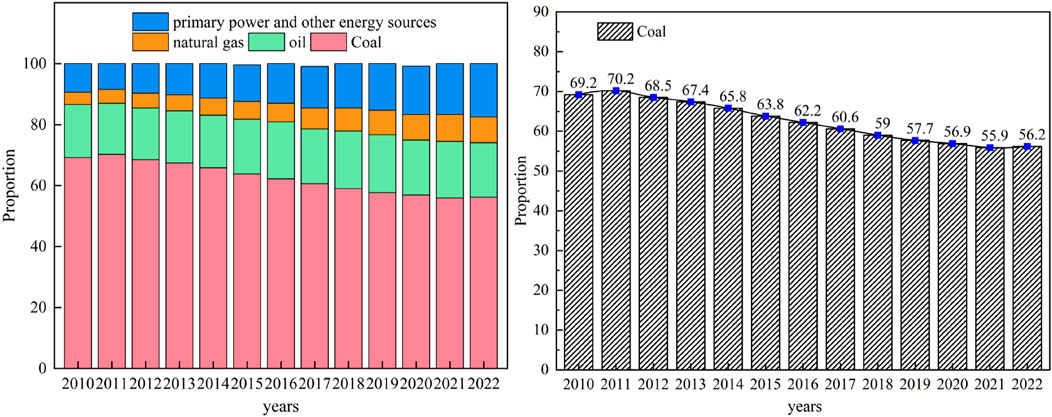
Figure 1. China’s energy consumption priorities and priorities from 2010 to 2022. Note: The data was in China statistical yearbook (2010–2022).
Domestic and foreign scholars had carried out a lot of research on the stability of surrounding rock and rock control. Zhang et al. (2024) used Comsol Multiphysics to simulate and analyze the influence of the layout, burial depth and temperature of the underground liquified natural gas (LNG) storage on the stability of the surrounding rock of the storage. Through theoretical analysis, similar material model tests, numerical simulation, field measurement and intelligent prediction, Hongwen et al. (2020). Studied the stability of the surrounding loose rock circle in deep roadway and the corresponding support technology. Yuan et al. (2011) discussed the stability of surrounding rock of deep rock roadways in Huainan mining area under the condition of “three high” by means of laboratory test, numerical simulation and theory, and put forward the classification standard of surrounding rock and the corresponding stability control technology. Wang S. et al. (2024) proposed an innovative excavation method of “excavation-filling-retaining”, and applied it to the stability of surrounding rock in large-section roadway excavation. Xiao et al. (2014) analyzed the distribution law of surrounding rock displacement, stress and plastic zone by means of numerical simulation, and revealed the failure mechanism of coal roadway deformation in deep structural areas. Wang F. et al. (2024) applied the shear slider theory to explore the deformation mechanism of coal pillars under mining disturbance. Wu et al. (2019) explored the initiation, expansion and failure of cracks during the formation of coal pillars on the goaf side, and simulated the failure deformation and fracture distribution in the coal pillars. Frith and Reed (2019) analyzed the accident cases in the past 50 years and pointed out that the application of the empirical design method to the design of coal pillars under different conditions would lead to the instability of coal pillars. Wu et al. (2024) used a combination of theoretical analysis, numerical simulation and field tests to qualitatively analyze the failure characteristics of narrow coal pillars and the evolution law of damage degree, instability mechanism and size effect. Xie et al. (2019) used the borehole image method taken by the digital panoramic borehole camera to measure the surrounding rock cracks, and proposed a simple and fast support system. Shen (2014) found out that the main cause of roadway instability was the high-level stress and low strength of coal and surrounding rock strata, and put forward a new design method of roadway support. Tian et al. (2021) used field investigations, geological boreholes, numerical simulations, and so on to study the deformation characteristics of the Xiamaixi tunnel and slope. Wang H. Z. et al. (2024) used field monitoring and numerical simulations to investigate the formation pressure and deformation evolution. The above scholars’ research methods on the stability of surrounding rock mainly include numerical simulation, theoretical analysis and field tests. In addition, some scholars have studied the mine pressure and strata control after coal seam mining by combining optical fiber technology with a similar model test. For example, Du et al. (2021a) used optical fiber sensing technology and a physical similarity test model to explore the deformation law and internal stress evolution characteristics of overlying strata after coal seam mining. Chai et al. (2018) used the method of combining distributed optical fiber sensing technology with three-dimensional tests to explore the deformation and failure law of overlying strata in coal mines by analyzing the relationship between the Brillouin frequency shift value of the sensing fiber in the working face and the deformation and fracture of the overlying strata. Hao et al. (2024) studied the influence of non-uniform strain distribution on the measurement accuracy in the process of coal pillar deformation by using distributed optical fiber technology combined with FEM-DEM coupling numerical simulation, and verified the feasibility of the method through an indoor model test. Application of optical fiber sensing technology in a similar model test of shallow thick coal seam mining. Zhu et al. (2021) used Brillouin optical time-domain analysis (BOTDA) technology to carry out a physical similarity model test, analyzed the deformation and damage state of overlying strata above goaf, and deduced the partition interaction relationship of the optical monitoring strain curve. Chai et al. (2011) monitored the deformation of uncompacted strata by the optical fiber and physical model test. Based on distributed optical fiber and information entropy theory, Chai et al. (2023) analyzed the dynamic evolution law of mining overburden separation and water seepage fracture based on similar experiments. Chai et al. (2022) analyzed the mechanical properties and strain response of rock strata in elastic deformation and elastoplastic stage by establishing a mechanical model of the optical fiber and rock strata. Chai et al. (2023) proposed a method based on Brillouin optical time domain distributed optical fiber sensing technology combined with a similar model test to analyze the deformation law and pressure relief effect of overlying coal and rock mass during the mining of the upper protective layer and realized the accuracy analysis of optical fiber sensing monitoring system and the spatial positioning of sensors. Du et al. (2021b) used the method of fiber Bragg grating (FBG) and distributed optical fiber (BOTDA) to carry out a similar model test on the stability of mining overburden and analyzed the stability of the waterproof key layer in a shallow coal seam.
This study investigates the distribution law of the support pressure of the stope and the feasibility of technical methods in monitoring methodologies under the thick conglomerate layer.
We innovatively introduced distributed Pulse-PrePump Brillouin Optical Time Domain Analysis (PPP-BOTDA) fiber sensing technology to physical similarity simulation experiments. Fiber optic sensors were embedded in the hard coal seam floor. By monitoring the relationship between abutment pressure in the floor and the frequency shift of the optical fiber, thereby analyzing the evolution of pressure distribution beneath thick gravel strata. It contributes to achieving monitoring abutment pressure evolution in real time and continuously. This study integrates theoretical analysis, numerical simulation and similar indoor physical tests to analyze comprehensively. The research results could provide a theoretical basis and technical support for the analysis of support pressure of floor coal seams in similar projects.
2 Calculation of inclined support force
2.1 Theoretical analysis of support pressure model
In the process of coal seam mining in the stope, the key strata of the roof strata of the coal seam move in the basic unit of the strata group, and the key strata play a leading role in controlling the overall movement in the strata group. With the mining of the coal seam, the original uniform load state of the roof strata was destroyed, which led to the transfer of load to both sides of the goaf. According to the key stratum theory and the load transfer characteristics of overlying strata, the calculation model of inclined support pressure was established (Zhang, 2017), as shown in Figure 2.
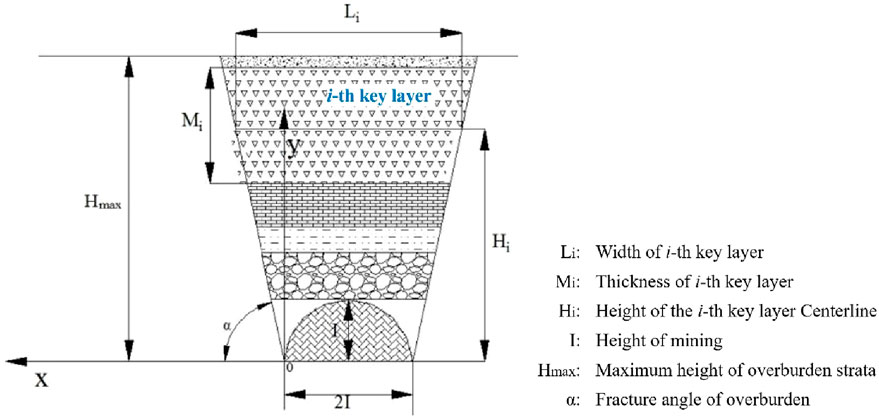
Figure 2. Tendency bearing pressure model.
Suppose that the weight of the ith key layer transferred to the front of one side of the work was half of its weight, and the key layer was broken or incompletely broken. It was characterized by a hanging or hinged state, the stress increment transferred to the inclined coal body was approximately an isosceles triangle distribution, and the isosceles triangle moved forward with the advance of the working face, then the i key layer was transferred to the stress in front of one side of the working face. The force increment was shown in Formula 2. If there were multiple key strata in the overlying strata of the stope roof, the stress increment generated by each key stratum could be superimposed to obtain
In the formula,
The support pressure
The model established that the key layers were in an ideal overhang or hinged state during their establishment, and ignored the uncertainty of geological structures such as weak interlayers and faults. In actual engineering, due to the complexity of rock structure, changes in coal-rock mechanical parameters, and the diversity of roof failure modes, the model predict during on results might deviate from the field measurements. Therefore, the applicability of the model should be verified and modified in combination with specific geological conditions to improve its engineering promotion value.
2.2 Project profile and rated conditions
The main coal seam of a coal mine in Henan Province was the No. 2 coal seam. The thickness of the coal seam was 15–24 m, and the total thickness of the overlying strata was 805.32 m. The thick conglomerate was developed at 209.5 m above the coal seam, with a total thickness of 410.2 m. It was divided into two groups: the upper group was 250 m thick and the lower group was 160 m thick. There was a weak interlayer of 0.2 m between the two groups. The conglomerate had high strength and hardness characteristics. The average elastic modulus was 32 × 103 MPa, the tensile strength was 5.5 MPa, the average compressive strength was 75 MPa, and the maximum compressive strength can reach 95 MPa. It was a typical hard rock layer. The specific characteristics of the roof strata of the coal seam were detailed in Table 1. The geographical location of the coal mine was shown in Figure 3.
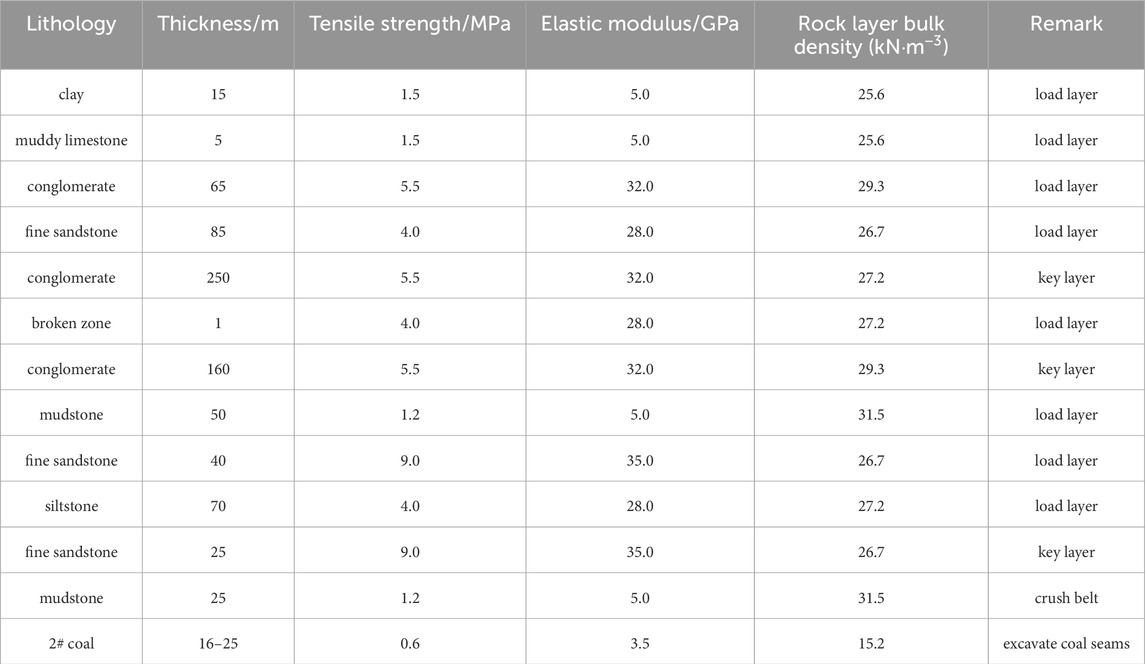
Table 1. Coal seam roof rock layer characteristics and key layer identification results.
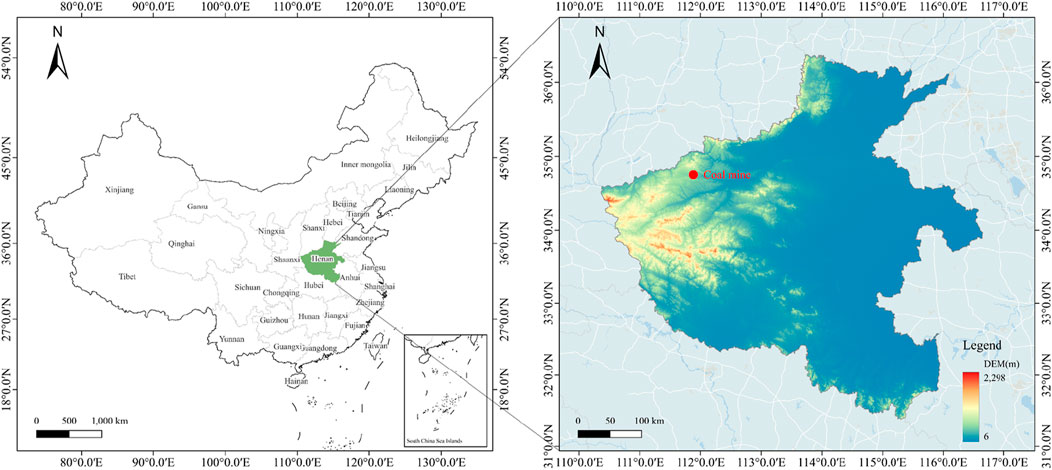
Figure 3. Coal mine location.
According to the parameters of each layer in Table 1, the conditions were calculated as follows:
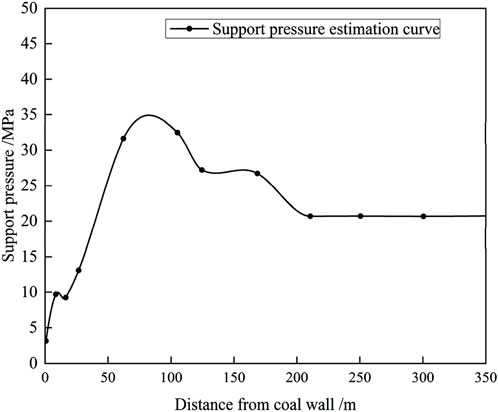
Figure 4. Working surface inclination support pressure change curve.
We observed the peak value of the inclined support pressure of the stope under the extremely thick conglomerate was about 35 MPa, the distance from the peak point to the coal wall was about 85 m, and the peak influence range was about 200 m. Compared with the traditional inclined support pressure, the distribution of inclined support pressure in the extremely thick conglomerate layer had the characteristics of a large distance from the peak position to the coal wall and a large influence range.
3 Numerical simulation analysis
Based on the theoretical analysis of the inclined support pressure distribution, it is necessary to further verify and visualize the stress evolution process in a more detailed and quantitative manner. Therefore, we use numerical simulation as a supplementary tool in order to better understand the distribution law of the support pressure and rock mass around the stope after excavating the working face. This study used FLAC3D software to simulate the distribution of the tendency support pressure and the plastic zone characteristics of the working face during advancement. The Mohr-Coulomb elastoplastic yield criterion was adopted in the simulation, as it is widely used in rock mechanics to model the failure behavior of geological materials under shear and normal stress conditions. The diagram showed the stress distribution and plastic distribution of the model in the Z-axis direction. The specific analysis was as follows:
We observed the above simulation from Figures 5–8. When the working face advances to 240 m, 480 m and 960 m, the surrounding rock stress of the working face was redistributed. The stress state at the top of the floor and directly above the working face was tensile. The peak values of support pressure were 33 MPa, 30 MPa and 38 MPa respectively, and the influence range was very large. The corresponding plastic distribution law was as follows: the plastic zone distribution indicated that plastic failure had occurred in roof strata. The maximum development height of the plastic zone was 40 m from the coal seam floor. The plastic zone of the roof had developed to the upper conglomerate layer. The lower conglomerate layer and the lower part of the upper conglomerate layer had serious and slight damage. The plastic zone of the roof had developed to the upper conglomerate layer, and the upper and lower conglomerate layers had been completely destroyed. At the same time, the surface had shown the plastic failure. When it was pushed to 720 m, the top of the working face and the model were still in the tensile stress state. The peak value of the support pressure was 31 MPa, and the influence range was still large. The corresponding plastic zone distribution was that the plastic failure of the roof had been extended to the upper conglomerate layer. The lower conglomerate layer and the upper conglomerate layer appeared seriously damaged.
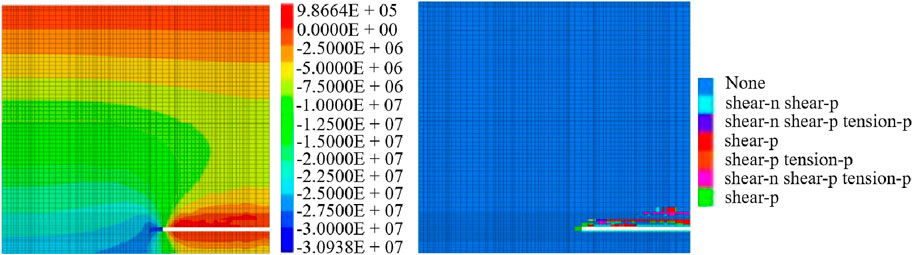
Figure 5. Stress and plastic zone distribution of the 240 m model with working face advancement.
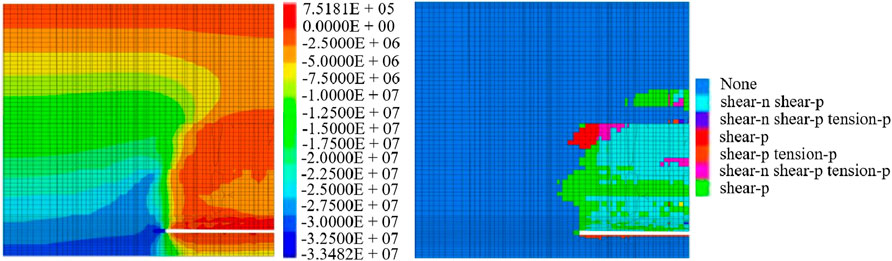
Figure 6. The stress and plastic zone distribution of the model working face after the working face is advanced 480 m.
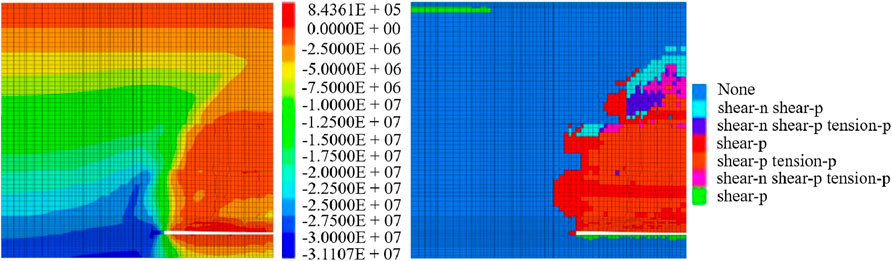
Figure 7. The stress and plastic zone distribution of the model working face after the working face is advanced 720 m.
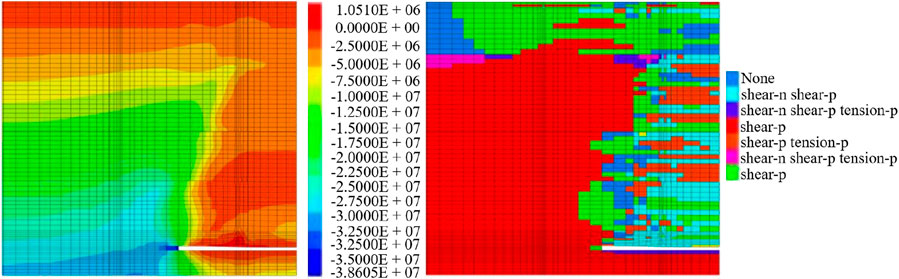
Figure 8. Distribution status of stress and plastic zone of model with working face advancing 960 m.
In summary, with the gradual advancement of the working face, the peak value of the support pressure and the development of the plastic zone showed significant changes. The peak support pressure fluctuates at different advancing distances, gradually decreasing from 33 MPa to 30 MPa and then rising to 38 MPa. It indicated that the support pressure was obviously affected by the advancing of the working face. At the same time, the range of the plastic zone also gradually expanded with the increase of advancing distance, which eventually led to the complete destruction of the upper and lower conglomerate layers and extended to the surface. This process revealed the complex evolution law of surrounding rock stress in the mining process, indicating that in different advancing stages. It was necessary to take targeted support measures according to the stress distribution to ensure the safety of the mining process. After the coal seam was mined, the lower conglomerate layer and the upper conglomerate layer in the overlying strata played a controlling role in the rock failure. In the process of model mining, the development of the plastic zone inhibited the expansion of overlying strata stress to the upper strata to a certain extent.
4 Similar physical models
4.1 Test survey
To validate the simulation results and further explore the stress evolution process, a physical model experiment was carried out under similar geological conditions. The thick shale layer was a hard and special coal-bearing stratum structure. It is distributed mainly in provinces such as Shanxi and Shandong. In this study, the experiments’ geological conditions were based on the coal-bearing strata of a mine in Henan Province. The experiment selected the maximum thickness of the main coal seam in this coal mine, which was 24 m. Above the coal seam developed a 209.5 m thick schistose stratum, and it contained a 0.2 m thick weak interlayer in the middle. The scaling law or similarity theory, was the basis for conducting physical model experiments on stope support pressure. Based on the similarity theory, the results of the physical model could better reflect the pressure distribution law of thick shale formation. Therefore, the size of the test model was 3.6 m × 2.0 m × 2.0 m (length × width × height), the geometric similarity ratio of the model was 1:400, the length of the simulated single working face was 60 cm, the thickness of the coal seam was 6 cm, and the thickness of the overlying rock layer was 174 cm. River sand, gypsum and calcium carbonate were used as similar materials to build a three-dimensional physical model of the working surface and overlying rock strata. The model was built to a similar scale. The model materials were mixed proportionally, stirred thoroughly with water, and then placed in layers into the mold for compaction. The on-site physical picture of the model was shown in Figure 9. Due to the model not simulating the surface, other rock layers were converted into a uniformly distributed load and loaded with sandbags. The characteristics and proportions of the roof rock strata in the model experiment were shown in Table 2.
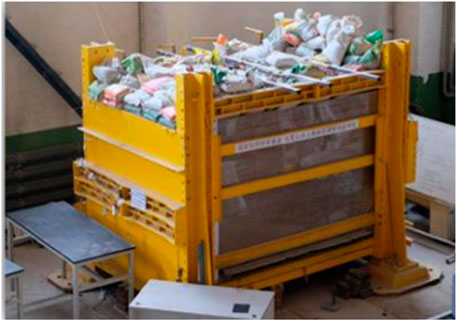
Figure 9. Model site physical map.
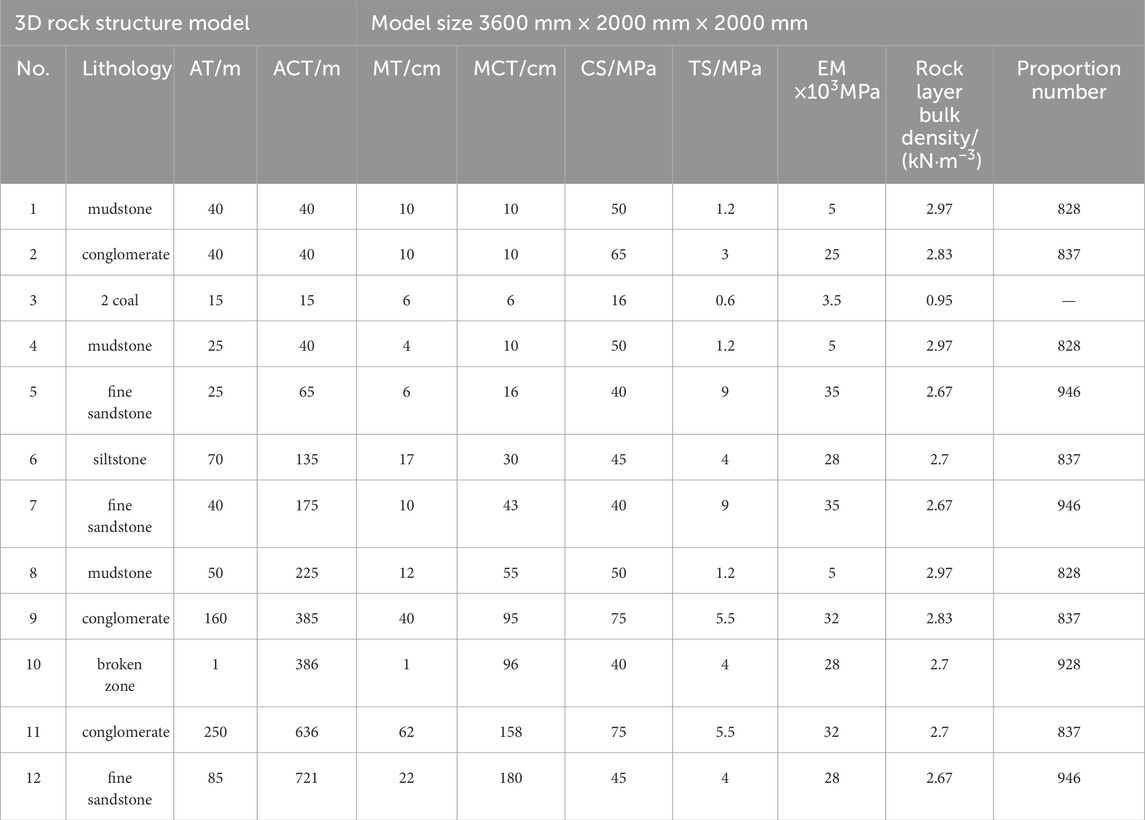
Table 2. Model laying layers and ratio table (AT, Actual thickness; ACT, Actual Cumulative Thickness; MT, Model Thickness; MCT, Model Cumulative Thickness; CS, Compressive Strength; TS, Tensile Strength; EM, Elastic Modulus).
4.2 Model excavation and test process
In the trial phase, the coal seam was replaced by a galvanized square tube. The size of the galvanized square tube was (40 mm × 60 mm) length × height. The excavation step was 40 mm. One galvanized square tube was removed each time. The advancement direction was shown in Figure 10.
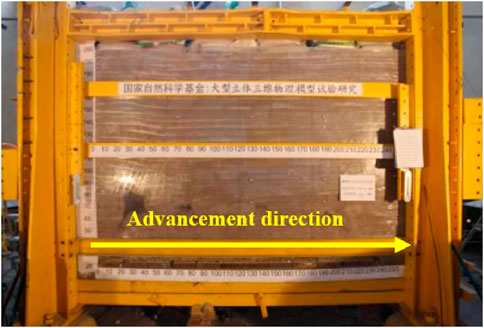
Figure 10. Model excavation advancement direction.
According to similarity theory, to ensure that the test model was comparable to the actual project. This study used the geometric similarity ratio for conversion. The advancing distance was set to 300 cm. The mining of 60 times was selected based on the preliminary experimental results, under the premise of satisfying the sensor response frequency and data continuity. The inclination length of the simulated excavation working face was 80 cm, the excavation step distance was 5 cm, In the experiment, as the overlying rock strata deformed and destroyed as the working face advanced, the working face experienced initial pressure and periodic pressure a total of 15 times, of which the initial pressure step was 550 mm and the average periodic pressure step was 115 mm, as shown in Figure 11.
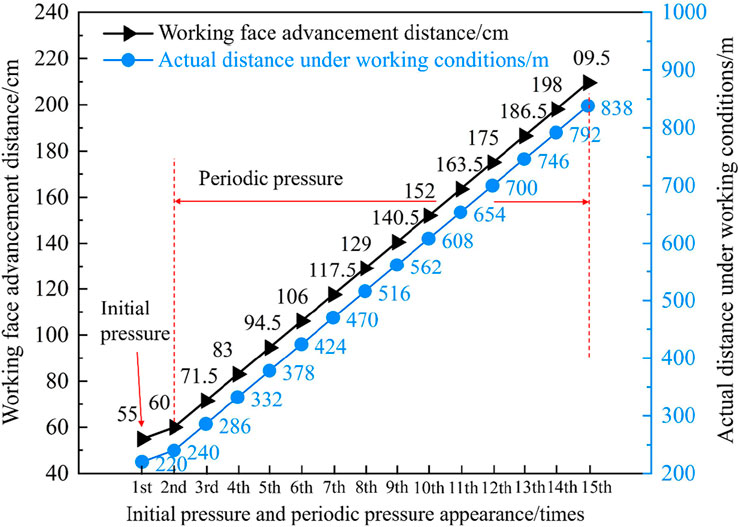
Figure 11. Comparison chart between model pressure step distance and actual working conditions.
4.3 Experimental test system
4.3.1 Pressure sensor
The test used CL-YB-116B pressure sensor to test the support pressure change of the model floor. The sensors were arranged in two columns at different positions of the coal seam floor. The first column was No. 1 to No. 48, and the second column was No. 4 9 to No. 96. The numbers were arranged in turn. The total length of the sensor was the same as that of the coal seam excavation distance. The size of each sensor was 20 cm × 5 cm × 5 cm, and the range was 0–200 kg. Due to the physical dimensions and deployment configurations of sensors, potential limitations in spatial resolution may arise, accompanied by measurement inaccuracies induced by stress concentration phenomena or dispersion effects. Furthermore, the measurement fidelity could be affected by stability issues associated with prolonged loading conditions and progressive deformation of model materials. In order to avoid the interference of the mining process to the sensor, a 2 cm thick model material was covered above the sensor. And this shielding layer serves dual functions: preserving sensor integrity during dynamic stress redistribution while maintaining measurement continuity in the excavation simulation phase. The arrangement was shown in Figure 12.
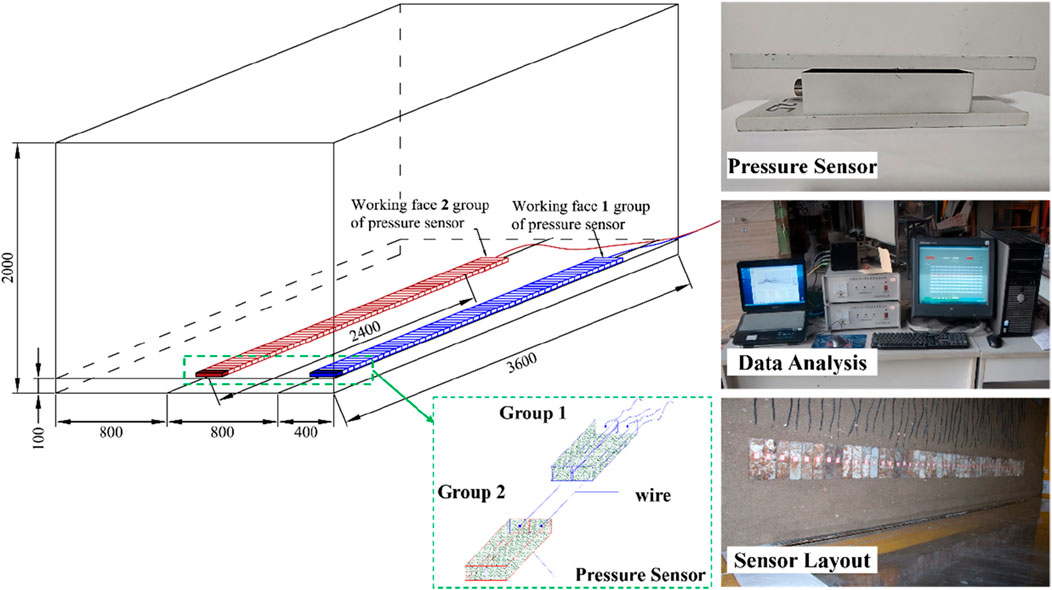
Figure 12. Floor pressure sensor layout.
4.3.2 Sensing fiber support pressure test
In the unexcavated coal seam floor, three horizontal sensing optical fibers were arranged along the inclination of the coal seam to test the distribution of support pressure. The fiber numbers were D1, D2 and D3, which were 0.6 m, 1.2 m and 1.8 m away from the open off-cut, respectively. We chose a tight-sleeve single-mode fiber with a cross-section diameter of 2 mm. During the laying process of the test, it was necessary to ensure that the optical fiber was closely bonded to the model material and appropriate tensile prestress was applied.
In order to reduce errors, we could fix the optical fiber with a positioning fixture. It could enable its position in three-dimensional space. However, the uneven shrinkage of the model material during the curing process might affect strain transfer due to a slight separation occurring between the optical fiber and the medium. Meanwhile, uneven prestressing or the device being affected by the coal seam inclination might cause some errors. Thus, researchers should check the fiber continuity and signal strength before and after the test to eliminate interference factors. Some instruments and equipment were shown in Figure 13. From left to right, they represented optical fiber, the NBX-6055 Photonic Nanoanalyzer, and the connecting line. The arrangement was shown in Figure 14.
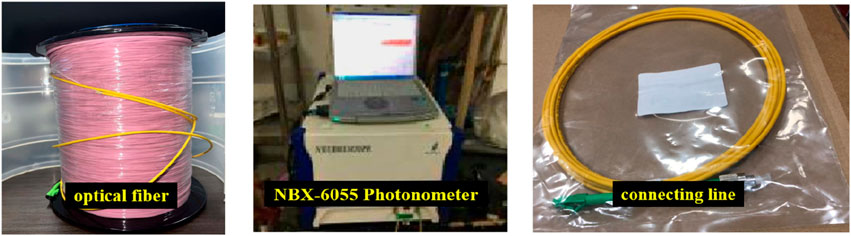
Figure 13. Sensing optical fiber equipment.
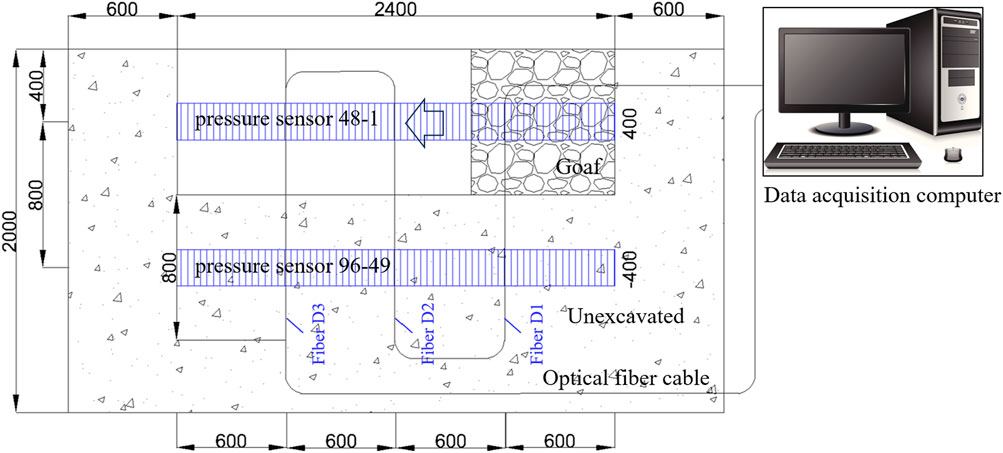
Figure 14. Coal seam floor inclination optical fiber and pressure sensor arrangement (mm).
4.4 Distributed fiber optic testing principle sensing principle
4.4.1 Fiber optic sensing principle
This experiment used the Pulse-PrePump Brillouin Optical Time Domain Analysis (PPP-BOTDA) (Kishida and Li, 2006), which had more advantages than traditional technology. PPP-BOTDA was different from BOTDA (Horiguchi and Tateda, 1989; Fang et al., 2023; Yin et al., 2023) distributed optical fiber sensing technology in that it had higher frequency resolution, high-accuracy Brillouin frequency shift and good Brillouin spectrum morphology. When the strain and temperature of the measured object change, the principle of Brillouin frequency shift change was shown in Equation 5.
In the formula,
The so-called “strain” referred to the strain change in the axial direction of the optical fiber, which was actually produced by the joint action of axial strain and radial strain. Within a small deformation range, the two were directly proportional and related to Poisson’s ratio (Gu, 2013; Zuo et al., 2024). By monitoring changes in optical fiber transmission power, the Brillouin frequency shift of each section could be obtained, and then the strain or temperature information of the optical fiber could be obtained. This method had high measurement accuracy and small spatial resolution. The principles diagram of PPP-BOTDA distributed optical fiber sensing technology and optical fiber stimulated Brillouin scattering were shown in Figures 15, 16.
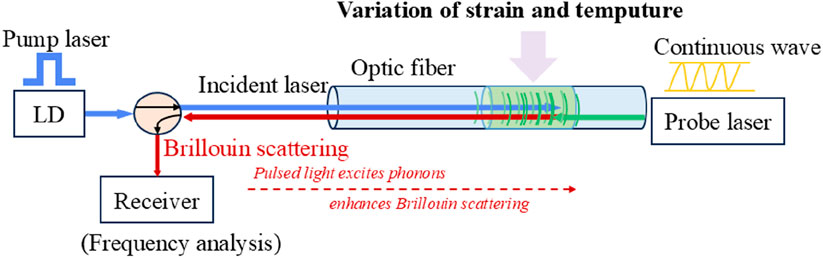
Figure 15. PPP-BOTDA schematic diagram.
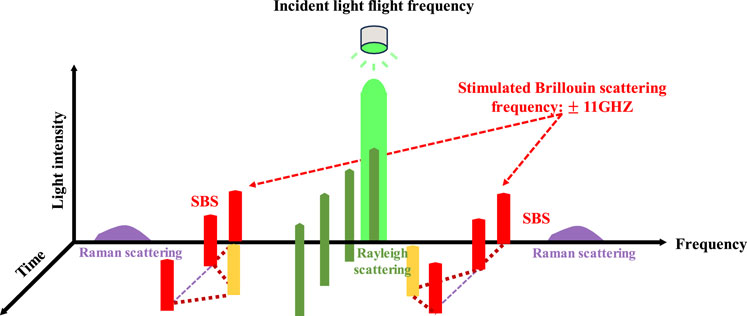
Figure 16. Stimulated Brillouin scattering principle diagram.
Although PPP-BOTDA technology has high spatial resolution and stability, there may still be systematic deviations in long-term or complex environments. For example, temperature fluctuations may cause frequency shift errors, and the device itself may also have signal drift and connection port reflection loss and optical path bending, which will also affect the signal-to-noise ratio. In order to reduce the impact of errors, prestress control and signal verification measures were taken. In the future, it would still be necessary to strengthen error compensation and stability evaluation to improve data reliability.
4.4.2 Linear relationship between brillouin scattering frequency shift and strain
The optical fiber sensor monitored the axial strain based on the Brillouin scattering principle. When the fiber was subjected to axial stress, its Brillouin frequency shift changed. It was assumed that the Brillouin frequency shift was
The variation
Among them,
Among them, the change of the Brillouin frequency shift was proportional to the strain, and its proportional coefficient was 4.88 times the initial Brillouin frequency shift. Which
Among them, σ was the local stress; E was the elastic modulus of the optical fiber. In general, the Brillouin frequency shift was mainly caused by the axial strain of the optical fiber, which in turn comes from the externally applied stress or support pressure. When the optical fiber was tightly bonded to the medium, the local pressure was transmitted to the optical fiber through the medium, generating axial strain, which leads to the change of the Brillouin frequency shift.
5 Test results and analysis
5.1 Working surface bottom plate support pressure distribution
The peak value of support pressure can reflect the dynamic change process of support pressure around the working face. In the process of working face advancing, the first column (1 # ∼ 48 #) was arranged in the bottom plate pressure sensor and the second column (49 # ∼ 96 #) was arranged in the side of the sensor. The maximum value of the supporting pressure of the bottom plate and the corresponding stress concentration coefficient are recorded respectively. The results are shown in Figure 17, and the abscissa was the advancing distance of the working face.
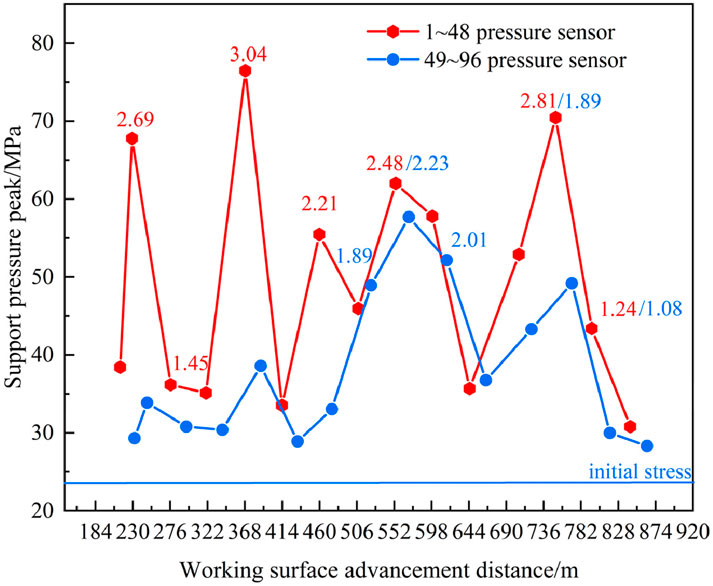
Figure 17. The peak change of support pressure on working face.
It can be seen that the support pressure concentration factor measured by the first column sensor was between 1.24 and 3.04. When the working face was advanced to 240 m, 378 m, 470 m, 608 m, 700 m and 746 m, the concentration coefficient exceeded 2.0, indicating that there was a significant increase in the strike support pressure at these locations, reflecting the large-scale violent movement of the rock strata and leading to serious damage to the model rock strata. In this process, the overlying strata repeatedly rotate and sink, and the load is transferred to the front of the working face, resulting in a large pressure on the working face and a significant increase in the frequency of pressure.
When the advancing distance of the working face is less than 470 m, the support pressure concentration coefficient measured by the No. 49–96 pressure sensor was less than 1.3, indicating that the excavation at this stage has little effect on the inclined support pressure. However, when the propulsion distance reaches 470–746 m, the stress concentration factor increases significantly, ranging from 1.44 to 2.23, and there are four times of pressure during this period in which the stress concentration factor exceeded 1.9. This shows that after the working face advances to the middle and rear part of the model, the range of rock movement expands, the overlying rock layer rotates and sinks many times, and the load gradually shifts to the inclined side of the coal body, resulting in a significant increase in the inclined support pressure. In addition, the measured peak value of the inclined support pressure was mainly located behind the working face, which was in line with the expectation of the traditional mine pressure theory.
5.2 Optical fiber frequency shift distribution of support pressure on working face floor
The experiment revealed the evolution law of the support pressure in the different advancing processes of the working face by monitoring the Brillouin frequency shift distribution of the inclined support pressure under different advancing distances. The monitoring resulted of D1, D2 and D3 optical fiber sensors were shown in (a) ∼ (c) of Figure 17. It reflected the changing trend of Brillouin frequency shift of support pressure monitored by optical fiber sensors at different positions when the working face advances.
Figure 18a showed that the D1 optical fiber sensor was located 60 cm (240 m) in front of the open-off cut of the working face. The curve didn’t change significantly before advancing to 42 cm (168 m). However, as the working face further advances to 94.5 cm (378 m) 96 cm (384 m), the Brillouin frequency shift reached a maximum. This showed that the support pressure reached the peak value at this time. It meant that the support pressure began to concentrate during the propulsion stage, and the rock structure had undergone significant deformation and failure.
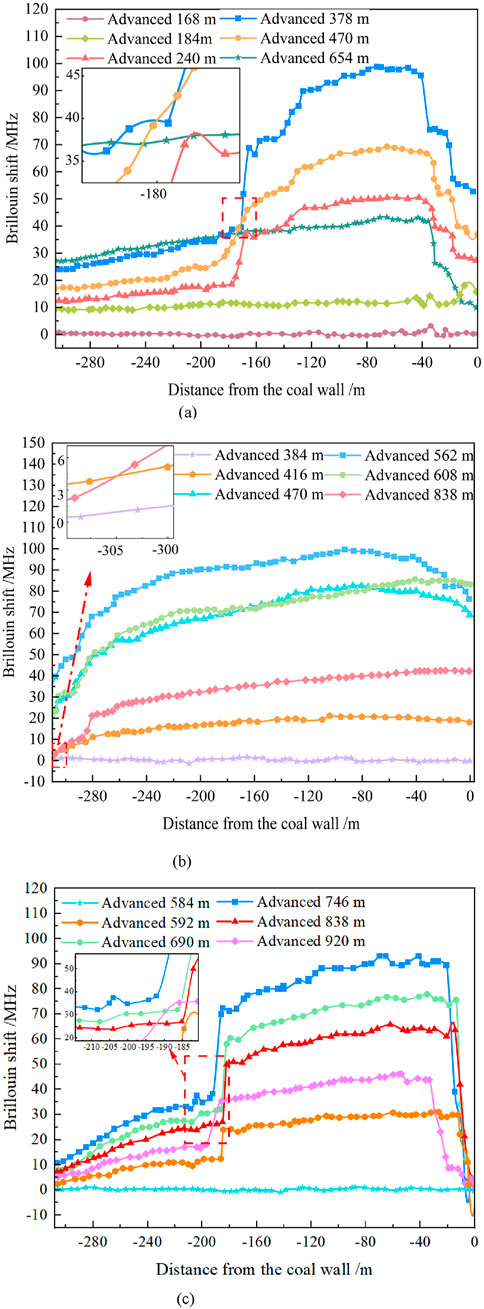
Figure 18. Brillouin frequency shift distribution of fiber D1, D2 and D3 inclined to support pressure. (a) optical fiber D1, (b) optical fiber D2, (c) optical fiber D3.
Figure 18b showed that the D2 fiber optic sensor was located 117.5 cm (470 m) in front of the working face. It was used to monitor the bearing pressure. Before advancing to 96 cm (384 m), the curve did not change significantly, and there was no obvious fluctuation. However, at this stage, the Brillouin frequency shift increased significantly and reached a maximum at 140.5 cm (562 m). This showed that the stress of the rock layer was significant. The bearing pressure was further concentrated. At the same time, the peak position of the support pressure in front of the working face was moved forward. It reflected that the goaf was gradually expanding, and the damage and collapse range of the rock stratum was developing to the high level.
Figure 18c showed that when the D3 sensing fiber was located 180 cm (720 m) in front of the open-off cut, the Brillouin frequency shift curve didn’t change much before the working face advanced to 146 cm (584 m). As the working face advances to 186.5 cm (746 m), the Brillouin frequency shift of the optical fiber reached a peak. The main reason was that the second group of conglomerate layers in the overlying strata breaks for the fourth time during this advancement process, which made the support pressure peak on the side of the coal pillar behind the goaf increase significantly. Combined with the comprehensive analysis of the data, it could be seen that the influence range was about 43 cm (172 m), and the distance to the peak support pressure was about 17.5 cm (70 m).
Furthermore, the sensor responses across three monitored positions (D1–D3) were systematically analyzed in Table 3. In Table 3, the onset and peak positions of Brillouin frequency shifts were quantitatively extracted and compared with the advancing distances of the working face. The overall performance of the Brillouin frequency shift curve was as follows: a stable frequency shift in early stages, followed by a significant increase and eventual peak, corresponding to concentrated support pressure zones. The spatial ranges of influence were estimated to be approximately 43–54 cm (172–216 m), and the distances to peak stress zones gradually increased with the sensor’s distance from the initial cut-off. In general, these monitoring data showed that the change of Brillouin frequency shift could accurately identify the concentrated area of support pressure and its change law. This had important reference value for predicting and controlling the stability of rock strata in the process of coal seam mining.
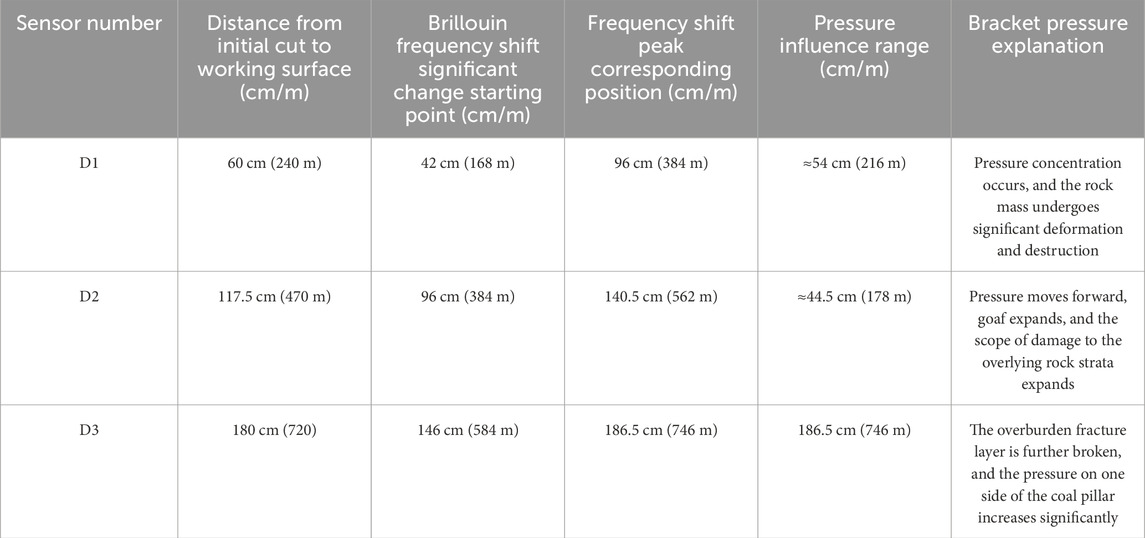
Table 3. Relationship between power sensor and bracket pressure.
5.3 Comparative analysis
5.3.1 Comparative analysis of optical fiber frequency shift and sensor support pressure
In the test system, the sensing fiber D1 corresponded to the pressure sensor 2#60, the sensing fiber D2 corresponds to the pressure sensor 2#72, and the sensing fiber D3 corresponds to the pressure sensor 2#84. The average Brillouin frequency shift of the length (200 mm) of the pressure sensor corresponding to the sensing fiber and the change of the inclined support pressure measured by the pressure sensor are plotted as shown in Figure 19. It indicated that the Brillouin frequency shift measured by the D1, D2 and D3 sensing fibers was consistent with the change trend of the support pressure measured by the pressure sensor.
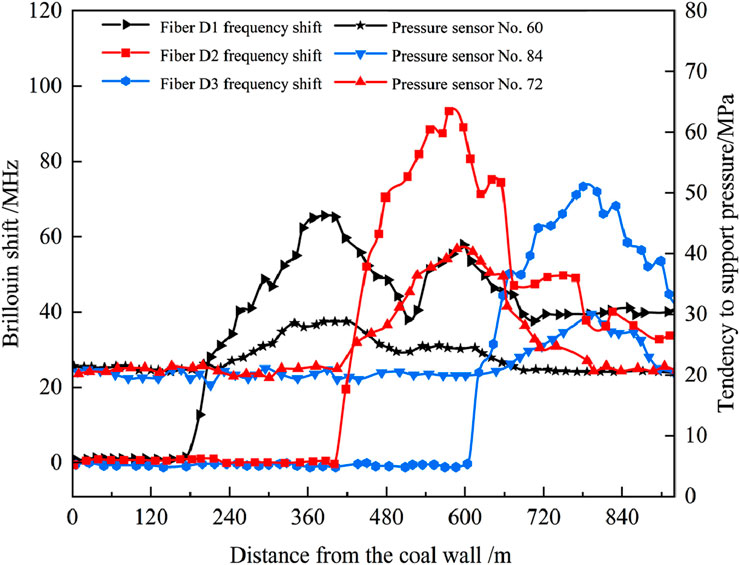
Figure 19. Fiber frequency shift and sensor support pressure curve.
When the working face was advanced to 182 m, the Brillouin frequency shift value of the D1 sensing fiber began to increase. The working face was advanced to 363 m and the frequency shift value of the D1 sensing fiber reached the maximum value. When the working face was advanced to 693 m, the frequency shift value of the fiber was basically stable. Along the advancing direction of the working face, the advanced influence range of the support pressure measured by the D1 sensing fiber was 74 m, the peak point was 133 m behind the working face, and the lag influence distance reached 443 m. The corresponding No. 60 pressure sensor had tendency to advance the influence range of 60 m, the peak point was 177 m away from the rear of the working face, and the lag influence distance reached 450 m.
The working face advanced to 400 m, the Brillouin frequency shift value of the D2 sensing fiber began to increase. The working face advances to 551 m, the Brillouin frequency shift value of the D2 sensing fiber reached the maximum. When advancing to 858 m, the Brillouin frequency shift value of the D2 sensing fiber was basically stable. Along the advancing direction of the working face, the advance influence range of the support pressure measured by the D2 sensing fiber was 77 m, the peak point was 126 m away from the rear of the working face, and the lag influence range reached 347 m. The advanced influence range of the tendency measured by the No. 72 pressure sensor was 49 m, the peak point was 114 m behind the working face, and the lag influence distance was 258 m.
The working face advanced to 595 m, the frequency shift value of the D3 sensing fiber began to increase. At 748 m, the frequency shift value of the fiber reached the maximum value. When the working face advanced to 873 m, the frequency shift value of the fiber was basically stable, and excavation was completed at 920 m. The advance influence range of support pressure measured by the D3 sensing fiber was 93 m, the peak point was 85 m behind the working face, and the lag influence distance was 113 m. Corresponding to the No. 84 pressure sensor, the advanced influence range was 41 m, the peak point was 41 m away from the rear of the working face, and the lag influence distance was 150 m. The mentioned discrepancy suggests that fiber optic sensors might be more sensitive to micro-strain accumulation, capable of capturing earlier and more subtle stress variations in the surrounding rock. In contrast, pressure sensors could detect stress concentration at localized contact points and might underrepresent broader deformation fields. These differences might contribute to knowing the importance of support pressure distribution and rock behavior.
Fiber optic monitoring was based on the principles of light interference and scattering and had the advantages of high precision and strong anti-interference, while traditional pressure sensors relied on changes in electrical signals such as resistance and capacitance to achieve measurement. The fundamental difference in the measurement principles between the two made fiber optic monitoring more suitable for continuous monitoring over long distances and in plasma environments, while traditional sensors were more suitable for local monitoring.
5.3.2 Comparative analysis of optical fiber frequency shift and numerical simulation
By comparing the fiber frequency shift with the numerical simulation, it can be seen that the consistency of the two was mainly reflected in the evolution law of support pressure and the dynamic process of rock failure. First of all, both show that with the advancement of the working face, the pressure at different stages shows a peak change: the support pressure was not obvious at the initial stage, then gradually concentrated and reached the peak value, and finally the regression was stable. This process reflects the significant influence of working face advance on stress distribution. Secondly, both of them emphasize the destructive control of conglomerate layers. In the process of rock failure, the failure of the lower and upper conglomerate layers not only affects the concentration of support pressure but also leads to the complex evolution of stress transfer, which ultimately affects the surface deformation and the stability of the goaf. The above commonality shows that the optical fiber frequency shift monitoring method has good consistency with the numerical simulation, which can more comprehensively grasp the stress change and rock failure law in the process of coal seam mining and provide a scientific basis for support design and mine safety management. These monitoring data not only verify the reliability of the theoretical model but also provide more detailed pressure distribution information, which has important reference value for predicting rock damage and pressure concentration areas in the process of coal seam mining and helps to improve the accuracy and safety of support design.
5.3.3 Comparative analysis of optical fiber frequency shift and theoretical calculation value
In this section, we adopted a complementary analytical approach combined with theoretical calculation and testing. Fiber optic monitoring was mainly used to capture internal responses, such as internal strain or deformation. However, pressure sensors were used to record pressure changes outside the structure. This combination of internal and external monitoring methods helps to verify and supplement the theoretical analysis results from different angles. It helps to enhance the reliability of the conclusions. The influence distance of advance mining support pressure and the influence range of lag tendency support pressure/MPa Brillouin frequency shift/MHz 64 measured by D1, D2 and D3 sensing optical fibers and pressure sensors were drawn in Table 4. The comparative analysis of the data in the table showed that the average mining influence distance measured by the optical fiber was 81.3 m, while the result measured by the pressure sensor was 50 m. The average lag influence distance measured by the optical fiber was 301 m, while the result measured by the pressure sensor was 286 cm. The resulted measured by the two are basically the same. Among them, the mining influence distance measured by optical fiber D3 was 14 m different from that of pressure sensor, and the lag influence distance measured by optical fiber D2 was 89 m different from that of pressure sensor. The reason was that after the working face advances to 516 m, the pressure on the working face was more severe, the load of overlying strata was transferred in a large range, and the overlying strata behind the goaf are rebalanced many times.
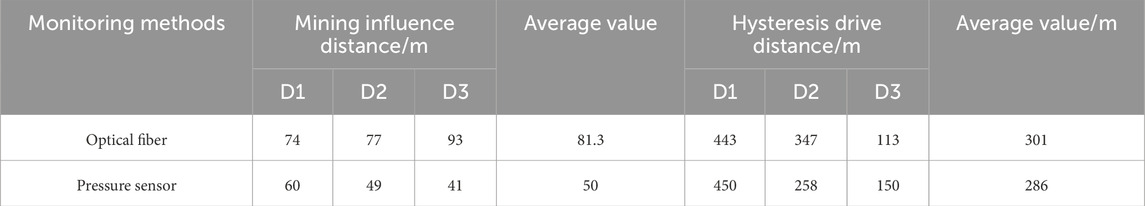
Table 4. Comparative analysis of optical fiber monitoring and pressure sensor monitoring.
Tables 4, 5 are the comparative analysis of the optical fiber tendency support pressure data and the theoretical calculation values. It can be seen that there was a high consistency between the optical fiber monitoring and the theoretical calculation results. Among them, the data in Table 4 prove the stability of optical fiber monitoring on different monitoring indicators. In the monitoring of the mining influence range and lag influence range, there was a certain gap between the results of optical fiber monitoring and the pressure sensor. But the trend of the two was consistent. This indicated that the relationship between theoretical calculations and on-site monitoring was not antagonistic but complementary: the theoretical model provides reliable expectations for monitoring, while on-site monitoring captures more dynamic changes due to the complexity of geological conditions.
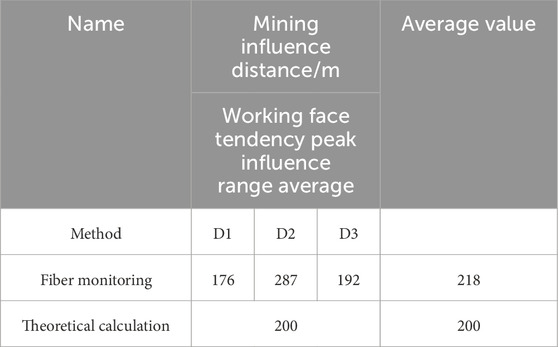
Table 5. Comparison of optical fiber monitoring results and theoretical calculations.
Accordingly, the optical fiber monitoring results of D1 and D3 points in Table 5 were basically consistent with the influence range of the theoretical calculation of the peak value of the inclined support pressure, which indicated that the theoretical model can accurately predict the distribution of pressure during mining in these areas. Although the monitoring value of the D2 point (218 m) was higher than the theoretical calculation value (200 m), which was about 1.09 times, this deviation also had a reasonable explanation. Since the working face was mined to the middle of the model, the movement range of the rock stratum in the process of continuous rotary sinking was expanded, and the transfer of the load to the inclined side of the coal body was enhanced, so the influence range of the support pressure was increased. At the same time, this result showed that in the actual working conditions, the influence of the complexity of geological conditions and the non-uniformity of stress transfer on the pressure range may exceed the prediction of the theoretical model, that was, the theoretical calculation will have certain limitations, but the basic trends of the two were still consistent. This provided a strong verification for the reliability of optical fiber monitoring in practical engineering applications.
In addition, combined with the comprehensive analysis of Tables 4, 5, it can be seen that the optical fiber monitoring technology had high reliability and sensitivity in the monitoring of mining, hysteresis effect and support pressure range. Optical fiber monitoring technology had obvious advantages in long-distance monitoring and was more suitable for long-distance monitoring in complex geological environments.
Optical fiber monitoring showed significant advantages over traditional pressure sensors and theoretical calculations in the monitoring of mining influence and support pressure peak influence. In terms of mining influence range, the average value of optical fiber monitoring (81.3 m) was higher than that of pressure sensor (50 m). At D3 point, the optical fiber monitoring range (93 m) was significantly higher than that of pressure sensor (41 m). This showed that optical fiber monitoring technology had obvious advantages in long-distance monitoring, and was more suitable for long-distance monitoring in complex geological environment. In addition, the performance of optical fiber monitoring in the lag influence range was better than that of the pressure sensor, with an average value of 301 m, while the pressure sensor was 286 m, indicating that optical fiber monitoring was more sensitive and stable in capturing the lag response.
6 Conclusion
1 The theoretical model indicated that the characteristics of the support pressure under the thick conglomerate are as follows: The peak pressure was high; the peak value was far away from the coal wall, and the influence range was wide.
2 Numerical simulation analysis showed that after coal mining, the lower and upper conglomerate layers in the overlying strata played a controlling role in rock failure, and the development of plastic zone inhibited the expansion of stress to the upper strata to a certain extent.
3 The trend of the frequency shift curve of the inclined support pressure of the working face was “constant → increase → peak → decrease → constant”; the monitoring results had a good correspondence with the results of the pressure sensor test and were basically consistent with the theoretical calculation results. Optical fiber monitoring was suitable for long-distance monitoring in complex geological environments.
7 Discussion and outlook
1. This study used PPP-BOTDA technology, which was more suitable to apply in high spatial resolution and long-distance measurement. But there were some limitations in dynamic response capability and demodulation accuracy under complex stress fields. In the future, multimodal sensing or optimized demodulation algorithms would be combined with the optical fiber to improve its adaptability and reliability in non-uniform stress environments.
2. This study was based on thick conglomerate conditions and was thus representative to a certain extent; however, stress transfer characteristics may vary across different geological settings. To improve the method’s applicability, fiber layout density and orientation can be adjusted according to lithological differences, and the frequency shift–stress relationship can be calibrated using parameters such as elastic modulus. Additionally, prestress control and signal verification can be implemented in future work to enhance error compensation and improve data stability and reliability.
Data availability statement
The original contributions presented in the study are included in the article/supplementary material, further inquiries can be directed to the corresponding authors.
Author contributions
CL: Methodology, Writing – original draft, Investigation. JZ: Conceptualization, Writing – review and editing, Formal Analysis. YC: Writing – original draft, Investigation, Software. YH: Conceptualization, Writing – original draft, Supervision. YS: Writing – original draft, Formal Analysis, Investigation. YQ: Writing – original draft, Investigation, Validation. QY: Supervision, Conceptualization, Writing – review and editing. MZ: Resources, Conceptualization, Writing – review and editing.
Funding
The author(s) declare that financial support was received for the research and/or publication of this article. This work was funded in part by the National Natural Science Foundation of China, grant number 51804052; Chongqing Municipal Key Projects for Innovation and Application Development, grant number CSTB2022TIAD-KPX0105; Research Projects of Chongqing Planning and Natural Resources Bureau, grant number KJ2022-044.
Conflict of interest
The authors declare that the research was conducted in the absence of any commercial or financial relationships that could be construed as a potential conflict of interest.
Generative AI statement
The author(s) declare that no Generative AI was used in the creation of this manuscript.
Any alternative text (alt text) provided alongside figures in this article has been generated by Frontiers with the support of artificial intelligence and reasonable efforts have been made to ensure accuracy, including review by the authors wherever possible. If you identify any issues, please contact us.
Publisher’s note
All claims expressed in this article are solely those of the authors and do not necessarily represent those of their affiliated organizations, or those of the publisher, the editors and the reviewers. Any product that may be evaluated in this article, or claim that may be made by its manufacturer, is not guaranteed or endorsed by the publisher.
References
Brown, K., Brown, A. W., and Colpitts, B. G. (2005). Characterization of optical fibers for optimization of a brillouin scattering based fiber optic sensor. Opt. Fiber Technol. 11 (2), 131–145. doi:10.1016/j.yofte.2004.08.004
Chai, J., Liu, J., Qiu, B., Li, Y., Zhu, L., Wei, S. m., et al. (2011). Detecting deformations in uncompacted strata by fiber bragg grating sensors incorporated into GFRP. Tunn. Undergr. Space Technol. 26 (1), 92–99. doi:10.1016/j.tust.2010.06.009
Chai, J., Xue, Z., Guo, R., Zhang, D., Yuan, Q., Li, Y., et al. (2018). Experimental study on distributed optical fiber detection of stope overburden collapse morphology and evolution. J. China Univ. Min. Technol. 47 (06), 1185–1192. doi:10.13247/j.cnki.jcumt.000941
Chai, J., Ouyang, Y., Liu, J., Zhang, D., and Du, W. (2022). Experimental evaluation of precise monitoring of multi-scale deformation failure of rock mass based on distributed optical fiber. Measurement 199, 111381. doi:10.1016/j.measurement.2022.111381
Chai, J., Ma, Z., Du, W., Gao, J., Huang, Z., Zhang, D., et al. (2023). Dynamic evolution law analysis of overburden separation and water flowing fracture under mining based on distributed optical fiber and information entropy theory. Opt. Fiber Technol. 80, 103408. doi:10.1016/j.yofte.2023.103408
Du, W., Chai, J., Zhang, D., and Lei, W. (2021a). Application of optical fiber sensing technology in similar model test of Shallow-buried and thick coal seam mining. Measurement 181, 109559. doi:10.1016/j.measurement.2021.109559
Du, W., Chai, J., Zhang, D., and Lei, W. (2021b). The study of water-resistant key strata stability detected by optic fiber sensing in shallow-buried coal seam. Int. J. Rock Mech. Min. Sci. 141, 104604. doi:10.1016/j.ijrmms.2020.104604
Fang, K., Miao, M., Tang, H., Jia, S., Dong, A., An, P., et al. (2023). Insights into the deformation and failure characteristic of a slope due to excavation through multi-field monitoring: a model test. Acta Geotech. 18 (2), 1001–1024. doi:10.1007/s11440-022-01627-0
Frith, R., and Reed, G. (2019). Limitations and potential design risks when applying empirically derived coal pillar strength equations to real-life mine stability problems. Int. J. Min. Sci. Technol. 29 (1), 17–25. doi:10.1016/j.ijmst.2018.11.024
Gu, H. (2013). Research on liquid pressure detection technology based on distributed optical fiber brillouin frequency shift [D]. Harbin: Harbin Institute of Technology. doi:10.1109/JSEN.2013.2255270
Hao, H., Chai, J., Ouyang, Y., Zhang, D., Gao, J., Wang, J., et al. (2024). Accurate monitoring of coal pillar deformation based on distributed optical fiber. Opt. Fiber Technol. 84, 103748. doi:10.1016/j.yofte.2024.103748
Hongwen, J., Qingbin, M., Junfu, Z., Bo, M., and Liyuan, W. (2020). Progress in stability control theory and technology of loosening zone of surrounding rock in deep tunnels. Trans. Min. Saf. Eng. 37 (03), 429–442. doi:10.13545/j.cnki.jmse.2020.03.001
Horiguchi, T., and Tateda, M. (1989). BOTDA-Nondestructive measurement of single-mode optical fiber attenuation characteristics using brillouin interaction: theory. J. Light. Technol. 7 (8), 1170–1176. doi:10.1109/50.32378
Jing, Z., Min, X., Li, S., Li, J., and Song, W. (2025). Trade-off or synergy? The impacts of coal energy consumption on compound system vulnerability: a perspective from coal resource base assessment. Ecol. Indic. 170, 113124. doi:10.1016/j.ecolind.2025.113124
Kishida, K., and Li, C. H. (2006). Pulse pre-pump-BOTDA technology for new generation of distributed strain measuring system[M]//Structural health monitoring and intelligent infrastructure, 1. London, UK: Taylor and Francis, 471–477.
Shen, B. (2014). Coal mine roadway stability in soft rock: a case study. Rock Mech. Rock Eng. 47, 2225–2238. doi:10.1007/s00603-013-0528-y
Tian, X., Song, Z., and Zhang, Y. (2021). Monitoring and reinforcement of landslide induced by tunnel excavation: a case study from xiamaixi tunnel. Tunn. Undergr. Space Technol. 110, 103796. doi:10.1016/j.tust.2020.103796
Wang, S., Lang, L., Zhu, M., Shen, Y., Shi, Q., Sun, Q., et al. (2024). Scientific issues and technologies integrating interfacial coal pillars and “excavation-filling-retention” along the channel. J. Coal Sci. 49 (08), 3291–3315. doi:10.13225/j.cnki.jccs.2024.0592
Wang, F., Qu, Y., Zhang, Y., Liu, C., Hao, W., and Jiang, Z. (2024). Coal pillar shear slide motion mechanism and collaborative control technology in soft and thick coal seam sections. J. Coal Sci. 49 (03), 1332–1344. doi:10.13225/j.cnki.jccs.2023.0712
Wang, H. Z., Song, Z. P., Tian, X. X., Wen, B., and Zhang, Y. (2024). Investigation of the stress and strain distribution in the surrounding soil of a tunnel induced by the double-heading at bottom method. Int. J. Civ. Eng. 22 (7), 1271–1289. doi:10.1007/s40999-024-00958-1
Wu, W., Bai, J., Wang, X., Yan, S., and Wu, S. x. (2019). Numerical study of failure mechanisms and control techniques for a gob-side yield pillar in the sijiazhuang coal mine, China. Rock Mech. Rock Eng. 52, 1231–1245. doi:10.1007/s00603-018-1654-3
Wu, C., Wang, Z., Liu, Y., Li, J., Geng, X., Lin, L., et al. (2024). Stability and control technology of surrounding rock in narrow coal pillars in vertically layered sections of extra-thick coal seams. J. Coal Sci. 49 (09), 3728–3744. doi:10.13225/j.cnki.jccs.2023.1233
Xiao, T., Wang, X., and Zhang, Z. (2014). Stability control of surrounding rocks for a coal roadway in a deep tectonic region. Int. J. Min. Sci. Technol. 24 (2), 171–176. doi:10.1016/j.ijmst.2014.01.005
Xie, Z., Zhang, N., Feng, X., Liang, D., Wei, Q., and Weng, M. (2019). Investigation on the evolution and control of surrounding rock fracture under different supporting conditions in deep roadway during excavation period. Int. J. Rock Mech. Min. Sci. 123, 104122. doi:10.1016/j.ijrmms.2019.104122
Yin, Y., Deng, Q., Li, W., He, K., Wang, Z., Li, H., et al. (2023). Insight into the crack characteristics and mechanisms of retrogressive slope failures: a large-scale model test. Eng. Geol. 327, 107360. doi:10.1016/j.enggeo.2023.107360
Yuan, L., Qin, Y., Cheng, Y., Meng, J., and Shen, J. (2013). Scenario prediction of medium to long-term drainage scale of coalbed methane mines in my country. J. Coal Sci. 38 (04), 529–534. doi:10.13225/j.cnki.jccs.2013.04.007
Yuan, L., Xue, J., Liu, Q., and Liu, B. (2011). Surrounding rock control theory and support technology in deep coal mine tunnels. J. Coal Eng. 36 (04), 535–543. doi:10.13225/j.cnki.jccs.2011.04.014
Zhang, K. (2017). Research on impact rock pressure in mining tunnels under the coupling condition of structure and huge entrance rock. Trans. Rock Mech. Eng. 36 (04), 1040. doi:10.13722/j.cnki.jrme.2016.1654
Zhang, C., Duan, P., Cheng, Y., Chen, N., Huang, H., Xiong, F., et al. (2024). A 2D stability analysis of the rock surrounding underground liquified natural gas storage cavern based on COMSOL Multiphysics. Energy Geosci. 5 (3), 100301. doi:10.1016/j.engeos.2024.100301
Zhu, L., Gu, W., Pan, H., Liu, Z., Chai, J., and Ouyang, Y. (2021). Calculation model of overburden rock failure volume in mined-out area based on Brillouin optical time-domain analysis technology. Opt. Fiber Technol. 66, 102640. doi:10.1016/j.yofte.2021.102640
Keywords: thick conglomerate layer, similar physical modeling, stope support pressure, fiber optic sensing, pressure sensor
Citation: Li C, Zhang J, Chen Y, Hou Y, Shi Y, Qu Y, Yuan Q and Zhang M (2025) Innovative application of optical fiber sensing technology for monitoring stope support pressure distribution in similar model tests. Front. Earth Sci. 13:1595035. doi: 10.3389/feart.2025.1595035
Received: 17 March 2025; Accepted: 05 August 2025;
Published: 29 August 2025.
Edited by:
Xin Yin, City University of Hong Kong, Hong Kong SAR, ChinaReviewed by:
Zhanping Song, Xi’an University of Architecture and Technology, ChinaShaoke Feng, SINOPEC, China
Copyright © 2025 Li, Zhang, Chen, Hou, Shi, Qu, Yuan and Zhang. This is an open-access article distributed under the terms of the Creative Commons Attribution License (CC BY). The use, distribution or reproduction in other forums is permitted, provided the original author(s) and the copyright owner(s) are credited and that the original publication in this journal is cited, in accordance with accepted academic practice. No use, distribution or reproduction is permitted which does not comply with these terms.
*Correspondence: Qiang Yuan, cWlhbmd5dWFuQGNxdS5lZHUuY24=; Mingtian Zhang, Y29rZXhpYW90aWFuQDEyNi5jb20=