 Lijun Wang
 Linxiao Xing
 Wenjing Lin
 Lu Liu
- 1Institute of Hydrogeology and Environmental Geology, Chinese Academy of Geological Sciences, Shijiazhuang, China
- 2Innovation Center of Geothermal and Dry Hot Rock Exploration and Development Technology, Ministry of Nature Resources, Shijiazhuang, China
- 3State Key Laboratory of Biogeology and Environmental Geology, China University of Geosciences Wuhan, Wuhan, Hubei, China
Introduction: The lithospheric thermal structure, which reflects the thermal evolution of the lithosphere, serves as a critical scientific basis for the development of deep geothermal resources.
Methods: Using geothermal well logging and the tests of rock thermophysical properties in the Gaoyang geothermal field, this study preliminarily determined the characteristics of the terrestrial heat flow and lithospheric thermal structure in the southern Jizhong Depression. Furthermore, this study established a conceptual model for the lithospheric thermal structure in the study area and estimated the deep geothermal distribution in the area.
Results: The results indicate that the Gaoyang geothermal field exhibits a terrestrial heat flow value of 67.19 mW/m2, Moho temperatures ranging from 697.16 °C to 774.54 °C, Curie point depths varying from 22.38 km to 24.09 km, and thermal lithosphere thicknesses ranging from 58.14 km to 75.16 km. The results of this study are largely consistent with previous findings, verifying the accuracy of the established model. Regional deep-seated faults penetrate the lithosphere, creating favorable conditions for deep mantle-derived materials and magmas to intrude into the crust.
Discussion: Consequently, heat flow from sags with low thermal conductivity converges into uplifts with high thermal conductivity. Deep groundwater circulation along these faults enhances heat convection, resulting in heat accumulation within fractured carbonate rocks. Furthermore, the overlying sandy mudstones with low thermal conductivity act as cap rocks with effective thermal insulation. The combined effects of these favorable factors contribute to the formation of high-temperature geothermal reservoirs in the southern Jizhong Depression.
Introduction
The lithospheric thermal structure reflects the thermal evolution of the lithosphere in a sedimentary basin at various stages, making it a critical indicator for understanding the evolutionary processes of the continental lithosphere (Wang et al., 2024; Duan et al., 2023). Currently, studies on the lithospheric thermal structure focus primarily on terrestrial heat flow, geothermal gradient, the partition of crustal and mantle heat flows, thermophysical parameters (e.g., radioactive heat production rates and thermal conductivity), temperature distributions in various lithospheric layers, and lithospheric thickness. Among these, terrestrial heat flow is the most intuitive indicator of the present-day thermal state of the lithosphere reflected at the surface, providing insights into the equilibrium among various dynamic processes within the Earth (Roy et al., 1969; Birch et al., 1968; Lachenbruch, 1970; Chen et al., 2017; Luo et al., 2019). The lithospheric thermal structure involves the ratio between the crustal and mantle heat flows and the thickness of the thermal lithosphere in a region, reflecting the lithospheric temperature distribution and influencing the present-day activity and temperature conditions of the crust and upper mantle (Qiu et al., 2019; Wang, 1996; Baumann and Rybach, 1992; Wang, 1992). The crustal and mantle heat flows, as well as the temperature distribution at depth, can be calculated based on the thicknesses and thermophysical parameters of different lithospheric layers (Lachenbruch, 1970; Qiu, 1998). This will help reveal the tectonic implications of crustal and mantle heat flows and offer insights into the genesis and evolution of geothermal fields.
The Jizhong Depression is rich in geothermal resources. Previous researchers have studied the lithospheric thermal structure of the Bohai Bay Basin, where the Jizhong Depression is located, and found that mantle heat flow contributes to 49%–62% of the terrestrial heat flow in the Bohai Bay Basin (Wang, 1996; Chen, 1988; Qiu, 1998; Gong et al., 2005; Wang et al., 2015), which exceeds the global average (46%). Current studies on the lithospheric thermal structure in the Jizhong Depression focus primarily on the central depression area (Cui et al., 2020; Wang et al., 2021). However, there is a lack of fundamental studies on the terrestrial heat flow and lithospheric thermal structure in the southern Jizhong Depression. This gap restricts both theoretical research on the genetic mechanisms and geothermal exploration in this region. Hence, this study analyzes the terrestrial heat flow value of the Gaoyang geothermal field in the southern Jizhong Depression through temperature measurements in geothermal wells, tests of rock thermophysical properties, and regional geophysical exploration. By combining the regional geothermal setting and available deep geothermal borehole data, this study reveals the lithospheric thermal structure in the southern Jizhong Depression and elucidates the mechanisms of thermal anomalies in regional geothermal resources. The findings of this study are significant for exploring the geodynamic processes involved in the formation and evolution of the Jizhong Depression, laying a foundation of geothermal data to inform theoretical frameworks and supporting the high-quality exploitation of geothermal resources.
Regional geological setting
The Jizhong Depression is located in the Bohai Bay Basin, a Meso-Cenozoic basin situated in the eastern portion of the North China Craton (Figure 1a). It has experienced multiple stages of tectonic activity since the Archean: a regionally stable depositional stage from the Meso-to Neoproterozoic and then to the Paleozoic, a folding and uplift stage during the Mesozoic, a fault development stage during the Paleogene, and a regional depression stage from the Neogene to the present. Consequently, this basin contains Archaean metamorphic rocks, Meso-to Neoproterozoic Middle Ordovician marine carbonate rocks, Permian marine-lacustrine transitional clastic rocks interbedded with carbonate rocks, and Paleogene to Quaternary marine and fluvial sandy mudstones from bottom to top. The Gaoyang geothermal field, located in the southern Jizhong Depression, exhibits a banded distribution in the NE direction. It comprises two tectonic units: the Gaoyang low uplift and the Lixian slope. It borders the Raoyang Depression to the east, the Baoding Sag to the west, the Jinxian Sag and Wuji-Gaocheng low uplift to the south, and the Baxian Sag to the north (Figure 1b) (Gong, 2003; Qi et al., 2003; Zuo et al., 2013; Chen, 1994; Qiu et al., 2004; Wu et al., 2007; Zhang et al., 2008; Guo et al., 2020).
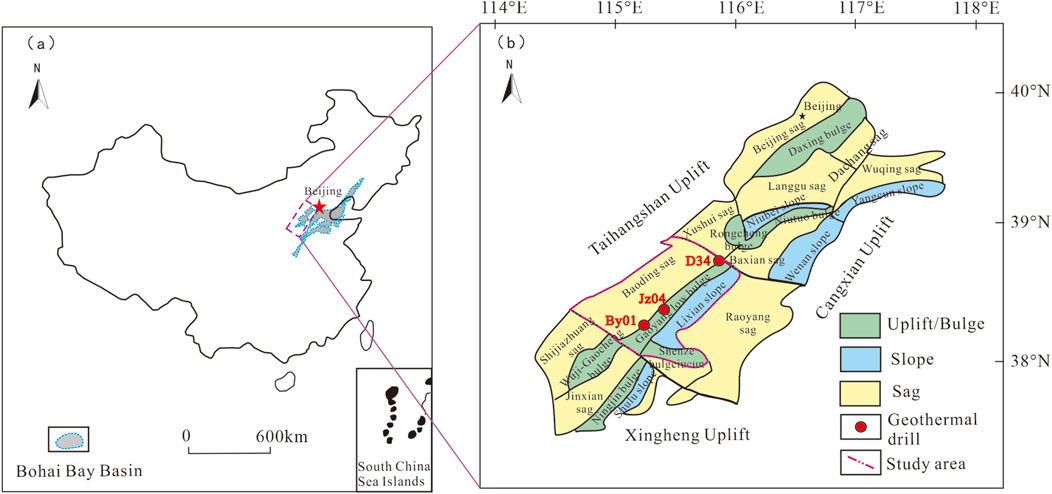
Figure 1. (a) Location of the Bohai Bay Basin (modified after Liao et al., 2021); (b) Tectonic units in the Jizhong Depression.
Artificial seismic and magnetotelluric data reveal a multi-layered structure of the basement crust of the Jizhong Depression. The basement crust consists of a high-velocity, low-electrical-conductivity upper crust, a low-velocity, high-electrical-conductivity middle crust, and a high-velocity and low-electrical-conductivity lower crust (Figure 2). The high-electrical-conductivity layer in the crust, located between the middle and lower crust, exhibits burial depths ranging from 15 km to 22 km and Moho depths from about 30 km to 40 km, approximating the average section depth (Liu et al., 1984; Lu et al., 1997; Sun et al., 2004).
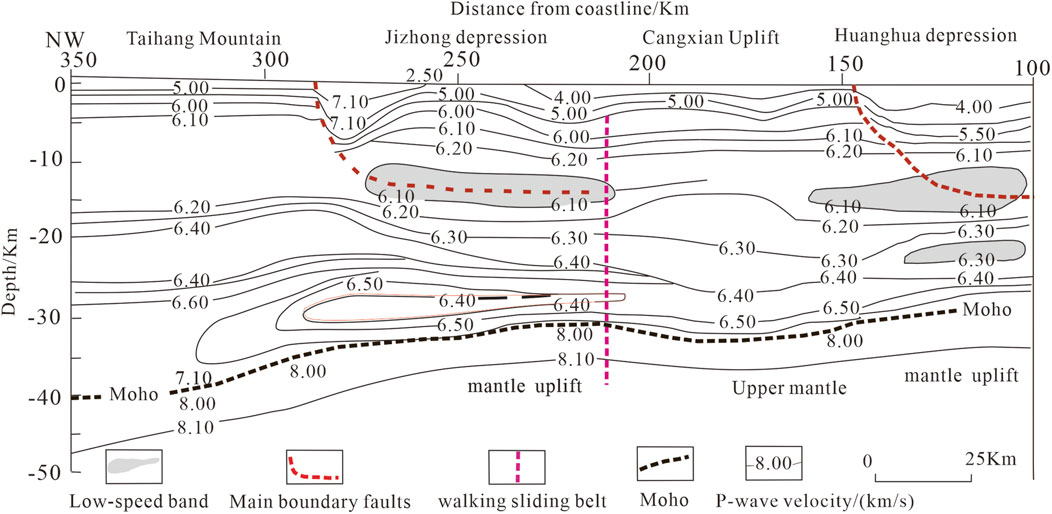
Figure 2. Profile showing the deep structures in the North China Craton (modified after Liu et al., 1984).
Methodology
Temperature measurements in boreholes
Temperature measurements in boreholes are an important method for acquiring data on deep geothermal fluids. This method reflects the temperatures of deep rock layers by measuring the temperatures of drilling fluids within the boreholes. The state in which the temperature of drilling fluids is consistent with that of the surrounding rocks is known as thermal equilibrium. The quality of temperature data obtained from boreholes depends on the relationship between the temperatures of the drilling fluid and the surrounding rocks, as well as the time required to achieve thermal equilibrium between them. Based on the time intervals between drilling completion and temperature measurements in boreholes, temperature measurements can be categorized as steady-state, quasi-steady-state, and instantaneous. Steady-state measurements are acquired after thermal equilibrium has been achieved in the boreholes, providing the most reliable data that accurately reflects the temperature conditions in the study area. Quasi-steady-state measurements are conducted when thermal equilibrium is nearly reached. In this case, the obtained temperatures are close to the actual formation temperature. Instantaneous measurements are performed shortly after drilling is completed. Since thermal equilibrium is not reached in this case, the measured temperatures do not truly represent the formation temperature (Rao et al., 2013; Zuo et al., 2013; Duan et al., 2023). The temperatures in borehole JZ04 were measured in a quasi-steady state with thermal equilibrium nearly achieved after an undisturbed period of 60 h. The temperatures obtained from borehole JZ04 were thus close to the actual formation temperature. The KH-3S integrated computerized logging system was used, with a test speed set at 10 m/min. This system allowed automatic measurements at a constant speed from the bottom upward. The borehole recorded a bottom-hole temperature of 135 °C, establishing it as the geothermal well with the highest temperature at a depth of 4,000 m among geothermal carbonate reservoirs in the Beijing-Tianjin-Hebei region.
Thermal conductivity tests
The thermal conductivity of rocks, which measures the heat conduction capacity of rock masses, is an important parameter for characterizing variations in geothermal fields and fluid distribution in deep strata within sedimentary basins (Zhu, 1990; Wang et al., 2015; Ma et al., 2019). Because rocks are porous and have multiple facies, their thermal conductivity is influenced by various factors such as mineral composition, grain size, density, porosity, temperature, and pressure (Zhang and Jiang, 1984; Brigaud and Vasseur, 1989; Xu, 1992; Yang et al., 1993; Cheng et al., 2017; Chen et al., 2020). Previous studies indicate that the thermal conductivity of rocks within sedimentary layers is inversely proportional to the temperature; in other words, thermal conductivity decreases as temperature increases (Anand et al., 1973). It has been found that the results of thermal conductivity tests conducted at 25 °C differ significantly from the formation temperature in boreholes. Therefore, the thermal conductivity of borehole cores can be corrected based on their measured in situ temperatures. Gong et al. (2011) found that for formations buried at depths of several kilometers in the Chinese continent, the thermal conductivity of rocks can be corrected using the empirical thermal conductivity-temperature equations developed by Sass et al. (1992). As a result, the measured thermal conductivity of cores from borehole JZ04 was corrected using the following equations:
where T is the in situ temperature of the borehole core, °C; K(0) and K(25) denote the thermal conductivities of rocks at 0 °C and 25 °C, respectively, W/(m·K), and K(T) is the corrected thermal conductivity of rocks.
In this study, the thermal conductivity of rocks was determined using a thin film analyzer based on unsteady heat transfer. The analyzer can yield the thermal conductivities of dry rocks under a film thickness of 0.2 mm and operating voltages between 1.5 V and 2.0 V. The sampling depths and test results are presented in Table 1.
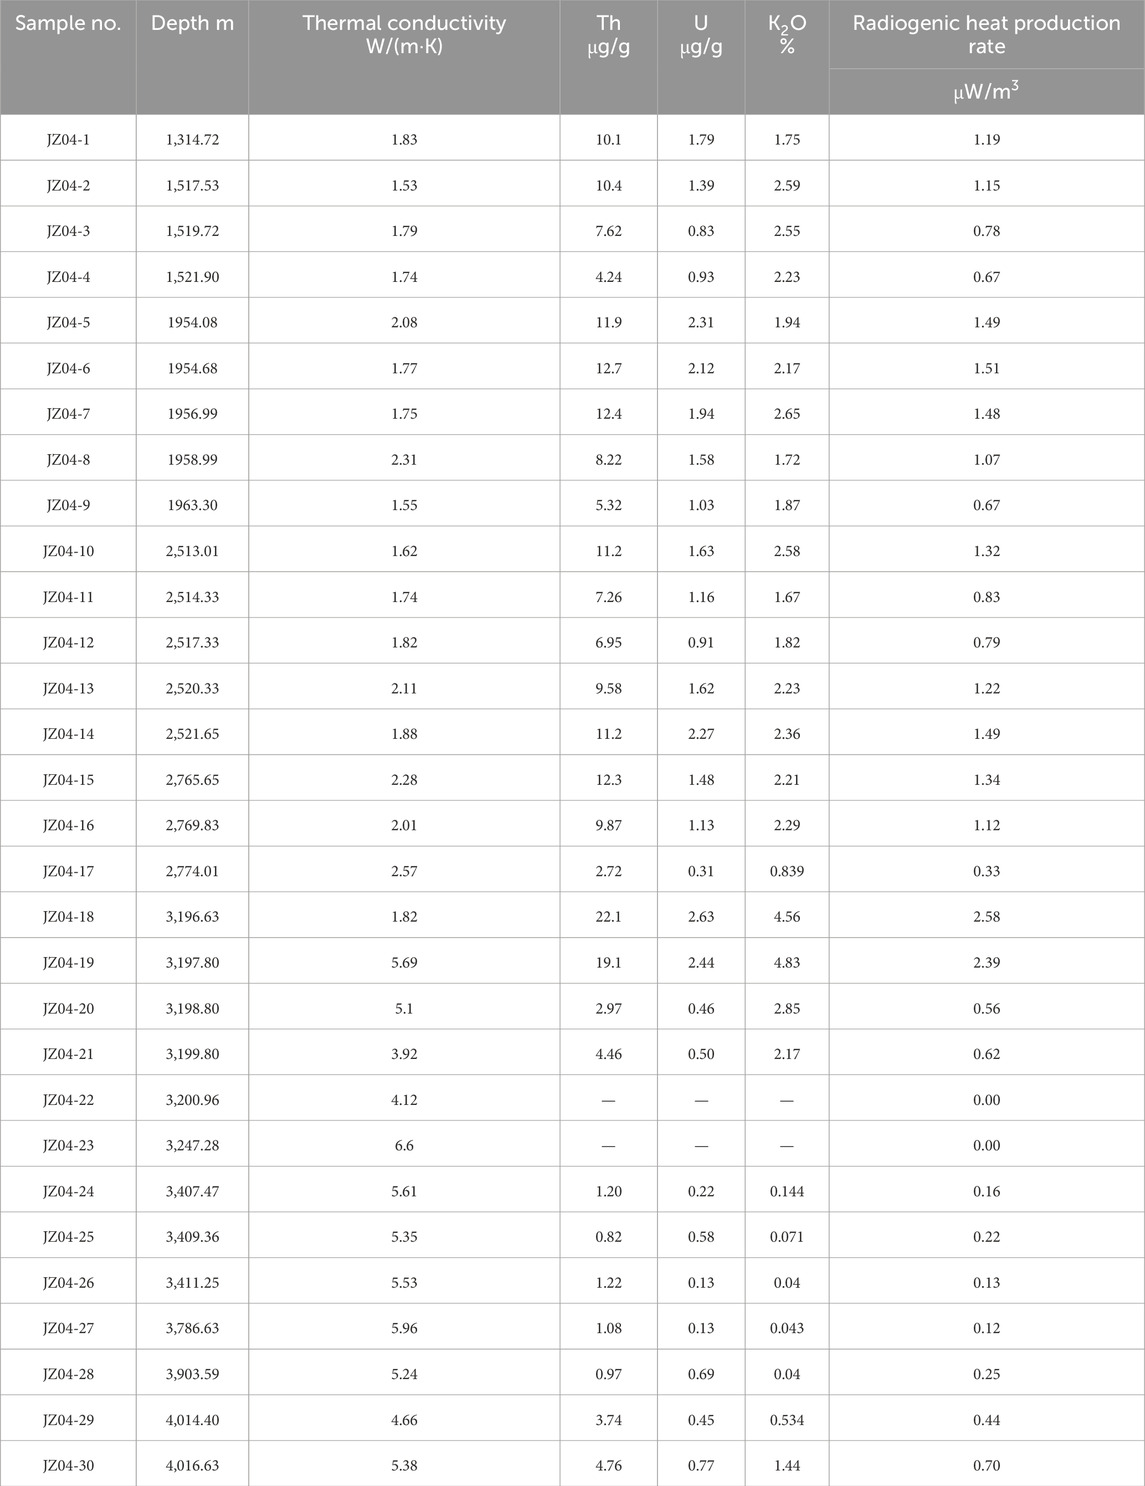
Table 1. Test results of thermal conductivity and radioactive heat production rates of core samples from borehole JZ04.
Calculation of the terrestrial heat flow value
Terrestrial heat flow refers to the heat transferred from the Earth’s interior to its surface, which is then radiated into space over a specific unit of time and area. This parameter is crucial to investigating the thermal conditions within a particular region (Birch et al., 1968; Hu and Huang, 2015).
Under one-dimensional (1D) steady-state conditions, regional terrestrial heat flow can be determined by multiplying the geothermal gradient by the thermal conductivity of rocks.
According to Fourier’s law, the terrestrial heat flow value can be calculated using Equation 3.
where Q is the terrestrial heat flow, mW·m-2; k is the thermal conductivity of rocks, W/(m·K); dT/dZ is the geothermal gradient, °C/km, and the negative sign indicates that the direction of terrestrial heat flow conduction is opposite to that of the geothermal gradient. For boreholes dominated by heat conduction, terrestrial heat flow values can generally be considered constant. The values can be calculated based on one or more borehole sections with relatively homogeneous lithologies. First, the thermal conductivity of a borehole section is determined by testing as many rock samples as possible from the selected borehole section. Then, the terrestrial heat flow value is obtained by multiplying the thermal conductivity by the geothermal gradient calculated from the measured temperatures in that section (Wang et al., 2019).
In this study, temperature measurements in boreholes primarily involve the Quaternary, Neogene, and bedrock strata. However, due to their shallow burial depths, the geothermal gradient of the Quaternary strata is more prone to be affected by surface factors such as air temperature, atmospheric precipitation, and human activities (Duan et al., 2023). Meanwhile, the bedrock strata cannot maintain steady-state heat conduction because of groundwater convection within the geothermal reservoirs. Therefore, the Quaternary and bedrock strata were excluded from the calculation of terrestrial heat flow values.
Tests of radioactive heat production rates of rocks
The radioactive heat production rate of rocks (A; unit: μW/m3) refers to the heat generated from the decay of radioactive elements in rocks per unit of volume and time (Shen et al., 1989; Zhang et al., 2010; Rybach, 1976; 1986; Bucker and Rybach, 1996; Norden and Forster, 2006). Among all natural radioactive elements in rocks, only uranium (U), thorium (Th), and potassium (K) are considered primary heat-producing elements, owing to their high abundance, long half-lives, and significant heat production rates (Norden and Forster, 2006; Bucker et al., 2001; Yang, 2016). The radioactive heat production rates of rocks in the shallow crust can be determined by analyzing sampled borehole cores. Currently, the equation proposed by Rybach (1976) is widely used to calculate the radioactive heat production rates of rocks, as follows Equation 4:
where A is the radiogenic heat production rate of rocks, μW/m3; ρ is the rock density (g/cm3), and Cu, CTh, and Ck are the contents of U (µg/g), Th (µg/g), and K (%) in rocks, respectively. The radioactive heat production rates of rocks in the deep crust can be obtained using two methods. One method involves testing rock samples from the surface or boreholes, provided that various rock layers in the crust have been identified. The other method is to calculate the radioactive heat production rates of rocks in different crustal layers using the Vp-A equation (Equation 5) developed by Rybach (1986):
where Vp is the seismic p-wave velocity, and A is the radioactive heat production rate of rocks.
In this study, 28 rock samples were collected from borehole JZ04. The sampling depths and corresponding calculated radioactive heat production rates are shown in Table 1.
Calculation of lithospheric thermal structure
The purpose of research on the lithospheric thermal structure is to determine the partition ratio between crustal heat flow (qc) and mantle heat flow (qm) the two components of terrestrial heat flow (qs) based on the thermophysical parameters of rocks (i.e., thermal conductivity and radioactive heat production rate) and a lithosphere stratification model. Crustal heat flow can be obtained by summing the heat produced from the decay of radioactive elements within all crustal layers beneath the surface. Therefore, based on the thicknesses of various crustal layers below the surface and the radioactive heat production rates of rocks in these layers, the heat flow produced from the decay of radioactive elements in various layers was calculated using the planar method (Rybach, 1976). The calculation equation is as follows:
where qm is the mantle heat flow; qc is the crustal heat flow; qs is the terrestrial heat flow of the lithosphere; Di is the thickness of the crustal layer, and Ai is the radioactive heat production rate of that layer. Concurrently, the partition ratio (
Calculation of temperatures at depth and the thickness of the thermal lithosphere
Based on the temporal and spatial variations in thermal conductivity and radioactive heat production rates in rocks, the temperatures at depth in a sedimentary basin can be expressed as follows:
where Tz and T0 are the temperatures at a depth of Z and on the top surface of the calculated section, respectively, °C; q is the heat flow at the top surface of the calculated section, mW/m2; D is the thickness of the calculated section, km; k is the thermal conductivity of rocks in the calculated section, W/(m·K), and A is the radioactive heat production rate of rocks in the calculated section, μW/m3.
The thermal conductivity of shallow strata is typically measured using samples and then corrected for temperature using Equations 1, 2. In contrast, the thermal conductivities of the deep upper crust and the layers beneath it are corrected using the equation developed by Cermak and Rybach (1982) as follows:
where c is the experimentally determined temperature coefficient, and k0 is the thermal conductivity of rocks at the top surface of the calculated section, W/(m·K). According to previous studies (Duan et al., 2023), the value of c is set at 0.001 for the upper crust, 0 for the middle crust, and −0.000256 for the lower crust and the mantle. The value of k0 is set at 3.0 W/(m·K) for the upper crust, 2.3 W/(m·K) for the middle crust, and 2.5 W/(m·K) for the lower crust and the mantle (Cermak and Rybach, 1982; Gong et al., 2011).
The thermal lithosphere refers to the outermost layer of the Earth’s lithosphere, which allows for heat conduction. Beneath the thermal lithosphere lies the asthenosphere, where thermal convection occurs due to prolonged high temperatures (Morgan, 1984; White, 1988). It is widely recognized that the thickness of the thermal lithosphere can be defined based on changes in the petrophysical properties of rocks caused by variations in the temperature field (Artemieva and Mooney, 2001; Artemieva et al., 2017). Rudnick et al. (1998) defined the base of the thermal lithosphere as the depth at which the temperature curve intersects with the solidus line of dry basalt or the mantle adiabat. This depth represents the thickness of the thermal lithosphere. Heat conduction within the lithosphere follows 1D heat conduction Equations 6, 8. In this study, two adiabats were used as the upper and lower limits (Equations 9, 10, respectively) of the bottom boundary temperature of the thermal lithosphere (Artemieva et al., 2017). The thickness of the thermal lithosphere is calculated as the arithmetic mean of the depths at which the upper- and lower-limit temperature curves intersect (Figure 3).
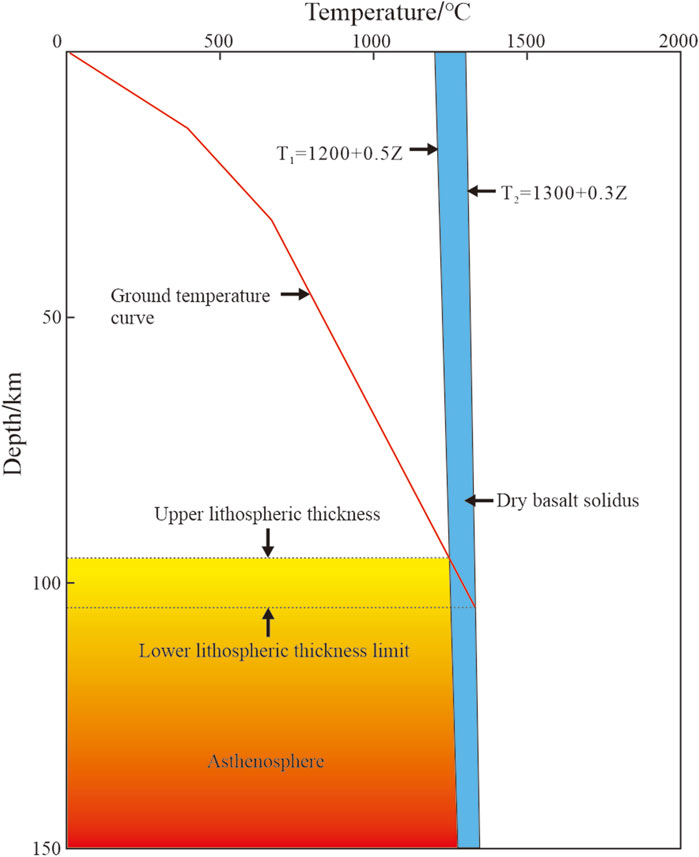
Figure 3. Model diagram illustrating the calculation of the thickness of the thermal lithosphere.
Results and discussion
Distribution of the geothermal field
Influenced by convective effects from water conduction by faults, the temperature-depth curves varied significantly across different geothermal boreholes in the Gaoyang geothermal field (Figure 4). The geothermal gradients in these boreholes were obtained using the least squares method (Figures 5–7). In boreholes JZ04, D34, and BY01, the geothermal gradients of the shallow sandstone layers were determined to be 16.3, 37.1, and 12.5 °C/km, respectively. These values are all considerably higher than those of the deeper dolomite layers (6.4, 11.1, and 24.1 °C/km, respectively). This discrepancy can be attributed to two main factors. First, the sedimentary cover, consisting primarily of sandstones, conglomerates, and mudstones, has lower thermal conductivity compared to the underlying geothermal dolomite reservoir. Second, due to factors like groundwater convection within shallow faults, the geothermal gradient in the sedimentary cover fluctuates significantly, even exhibiting negative values at certain depths. In contrast, the lower geothermal reservoir, primarily composed of dolomites, manifests high permeability and strong water-bearing properties, enabling efficient heat transfer within the rocks. Consequently, temperatures in this geothermal reservoir show only slight variations, leading to lower geothermal gradients. Additionally, the geothermal gradient of borehole JZ04 decreases at depths ranging from 3,000 m to 3,200 m. The analysis reveals that the cores from these depths are composed of Qingbaikouan sandstones, with noticeable red iron rust staining observed. The high iron content in this section leads to relatively high thermal conductivity and an enhanced heat transfer capacity of the sandstones, which result in lower geothermal gradients (Song et al., 2023).
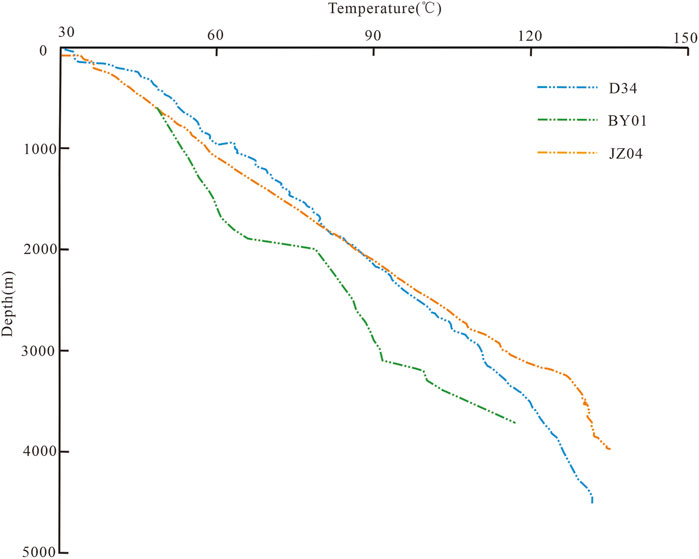
Figure 4. Temperature measurement curves of boreholes JZ04, D34, and BY01.
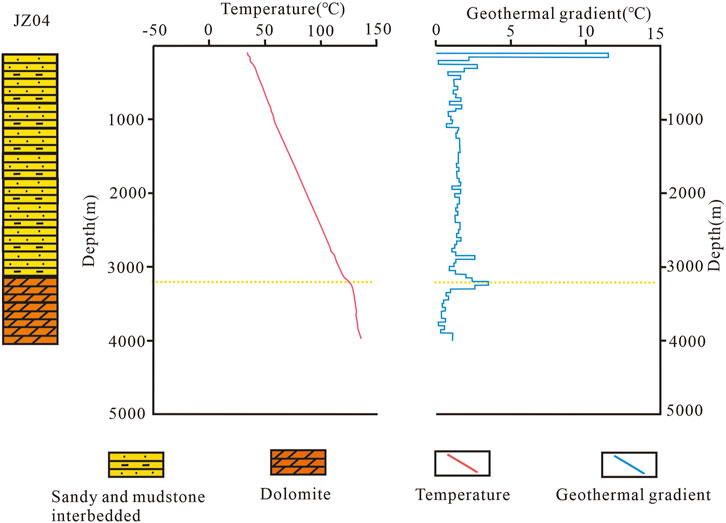
Figure 5. Geothermal gradient-depth profile of borehole JZ04.
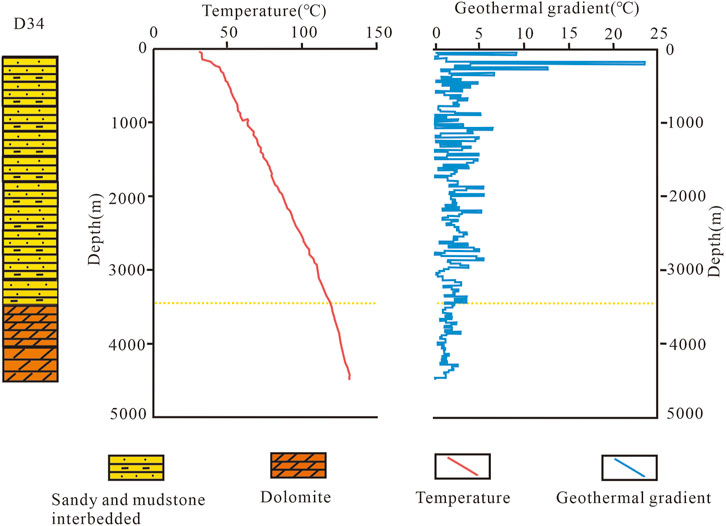
Figure 6. Geothermal gradient-depth profile of borehole D34.
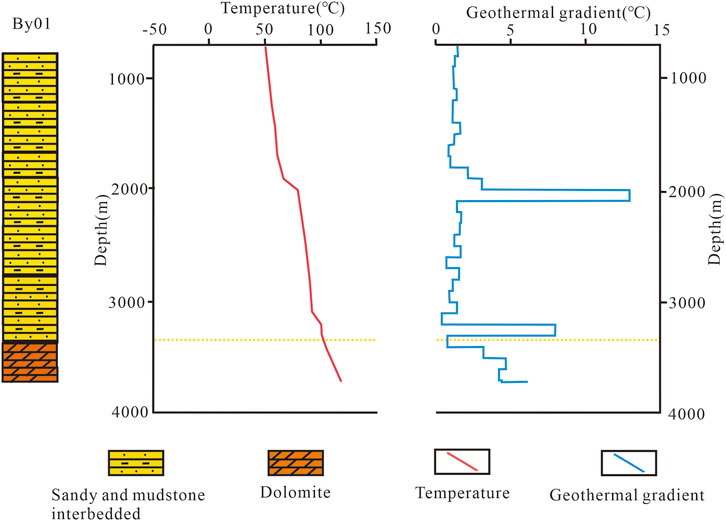
Figure 7. Geothermal gradient-depth profile of borehole BY01.
Variations of thermal conductivity
This study tested 30 core samples formed from the Cenozoic to the Proterozoic, including Cenozoic sandstones, conglomerates, and mudstones, as well as Mesoproterozoic dolomites, conglomeratic dolomites, and micritic dolomites. The depth variations in the thermal conductivity of rocks (Figure 8) reveal that the thermal conductivity of rocks in the study area is more closely associated with rock type than with depths. Specifically, dolomites exhibit higher thermal conductivity, while sandstones display lower thermal conductivity. The thermal conductivity values of rocks in the study area range from 1.53 W/(m·K) to 6.6 W/(m·K), with an average of 3.52 W/(m·K).
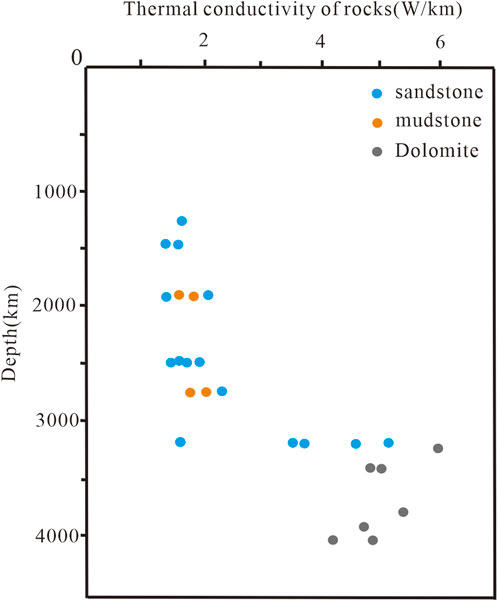
Figure 8. Scatter plot showing the depth variations of thermal conductivity.
Variations in radioactive heat production rates of rocks
Core samples from borehole JZ04 in the Jizhong Depression consisted primarily of sandstones, mudstones, and dolomites. As shown in Table 1, the radioactive heat production rates of rock samples from the study area ranged from μW/m3 0.22–2.58 μW/m3, with an average of 0.95 μW/m3. The core samples had U content ranging from 0.58 μg/g to 2.63 μg/g (average: 1.19 μg/g), Th content from 0.82 μg/g to 22.1 μg/g (average: 7.73 μg/g), and potassium oxide (K2O) content from 0.071% to 4.56% (average: 1.86%).
The relationships between the radioactive heat production rates of different lithologies and depth (Figure 9a) indicate that these rates are primarily associated with rock type but show a slight correlation with depth. The radiogenic heat production rates increase significantly with the concentrations of Th, U, and potassium (K) (Figures 9b‒d). Specifically, they exhibit strong positive correlations with Th and U concentrations but only a weak correlation with K concentration. This suggests that K contributes minimally to the overall radiogenic heat production of rocks.
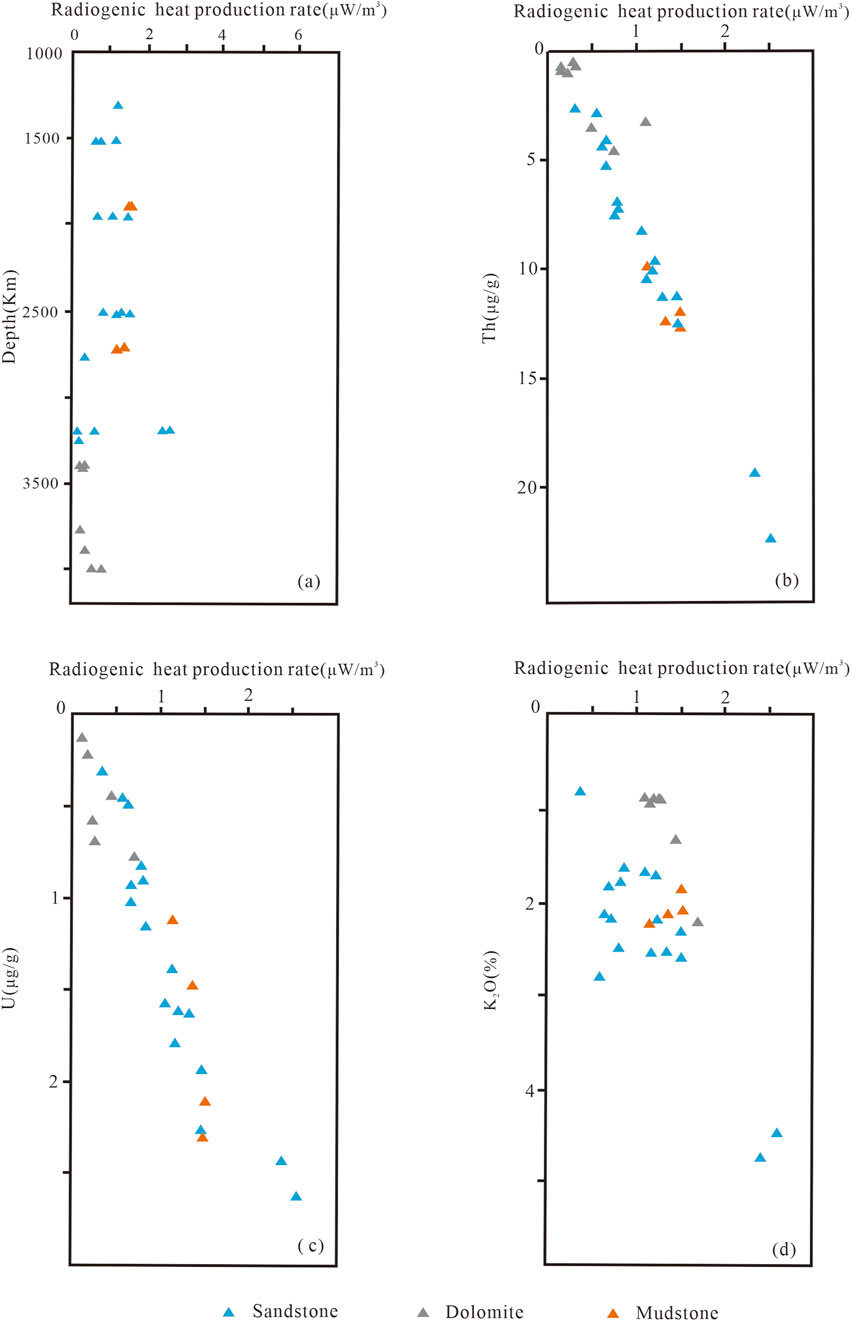
Figure 9. (a) Relationships of the radioactive heat production rates of rocks with depth and the abundance of radioactive elements. (b–d) The relationship between the radioactive heat production rate of rocks and the abundance of radioactive element Th, U, K.
Terrestrial heat flow value
Figure 4 shows a steadily increasing temperature trend in borehole JZ04. This reflects the characteristics of the Gaoyang geothermal field, as this borehole penetrates multiple sedimentary strata in the study area. Therefore, the terrestrial heat flow value in this study was calculated based on data from borehole JZ04. A linear fitting of the temperature-depth curves for the Paleogene-Neogene strata (depths: 500–2,500 m) using the least squares method yielded a correlation coefficient greater than 0.99, suggesting a strong linear correlation between the temperature and depth and ensuring a reliable calculation of the geothermal gradient. The terrestrial heat flow value of the Gaoyang geothermal field was calculated using an average thermal conductivity of 2.317 W/(m·K) for rocks in the Neogene strata (corrected using Equations 1, 2) and an average geothermal gradient of 29 °C/km for these strata. According to Equation 3, the terrestrial heat flow value was determined to be 67.19 mW/m2, which is roughly consistent with the result of Cui et al. (2020) and exceeds the average value (42.5 mW/m2) of the Jizhong Depression (Chen, 1988). The relatively high terrestrial heat flow value in the study area is attributed primarily to the close correspondence between changes in the lithospheric thickness during the destruction of the North China Craton and the Meso-Cenozoic lithospheric thermal structure of the Bohai Bay Basin. Specifically, significant lithospheric thinning caused by the destruction of the North China Craton facilitated the conduction of mantle-derived heat to shallower depths and created favorable conditions for the upward transfer of deep heat sources (Wang et al., 2017). Additionally, NNE-NE-trending deep-seated strike-slip faults in the Bohai Bay Basin serve as effective pathways for the upwelling of crustal materials (Qi and Yang, 2010). Thick sediments, dominated by sandy mudstones with low thermal conductivity, were deposited in the crust of the Jizhong Depression. Together with dolomites with high thermal conductivity in the bedrock, these sediments form a thermal refraction effect, leading to heat flow accumulation in uplifted parts (Rao et al., 2013). Consequently, the Gaoyang low uplift zone exhibits a high terrestrial heat flow value (Qiu et al., 2009; Gong et al., 2011).
Lithospheric thermal structure
Using results from deep geophysical exploration (Structural model for seismic velocities in the crust and upper mantle in North China (v2.0), http://www.craton.cn/data) and data from boreholes JZ04 (depth: 4,000 m) and D34 (depth: 4,500 m) in the study area, this study established a crustal structure model of the southern Jizhong Depression. The boundaries of the upper, middle, and lower crust in the Jizhong Depression were determined based on seismic velocities, which measured 6.1 km/s, 6.3 km/s, and 6.5 km/s, respectively. In the model, strata at depths within 4.5 km were determined using actual borehole data from the study area. In contrast, the deeper crustal layers were determined based on seismic velocities and previous studies, with the depths of the upper, middle, and lower crust determined at 10.6 km, 19.6 km, and 29.6 km, respectively. The thermal conductivities and radioactive heat production rates of rocks in the study area were measured data from borehole JZ04. In contrast, the thermal conductivities of various layers from the Mesoproterozoic Jixianian strata to the Moho were derived from the thermal conductivity column of rocks in the Jizhong Depression (unpublished data by the authors), and their radiogenic heat production rates were calculated using the Vp-A equation (Equation 5). Finally, the lithospheric thermal structure in the study area was calculated using Equation 6, with the results presented in Table 2.
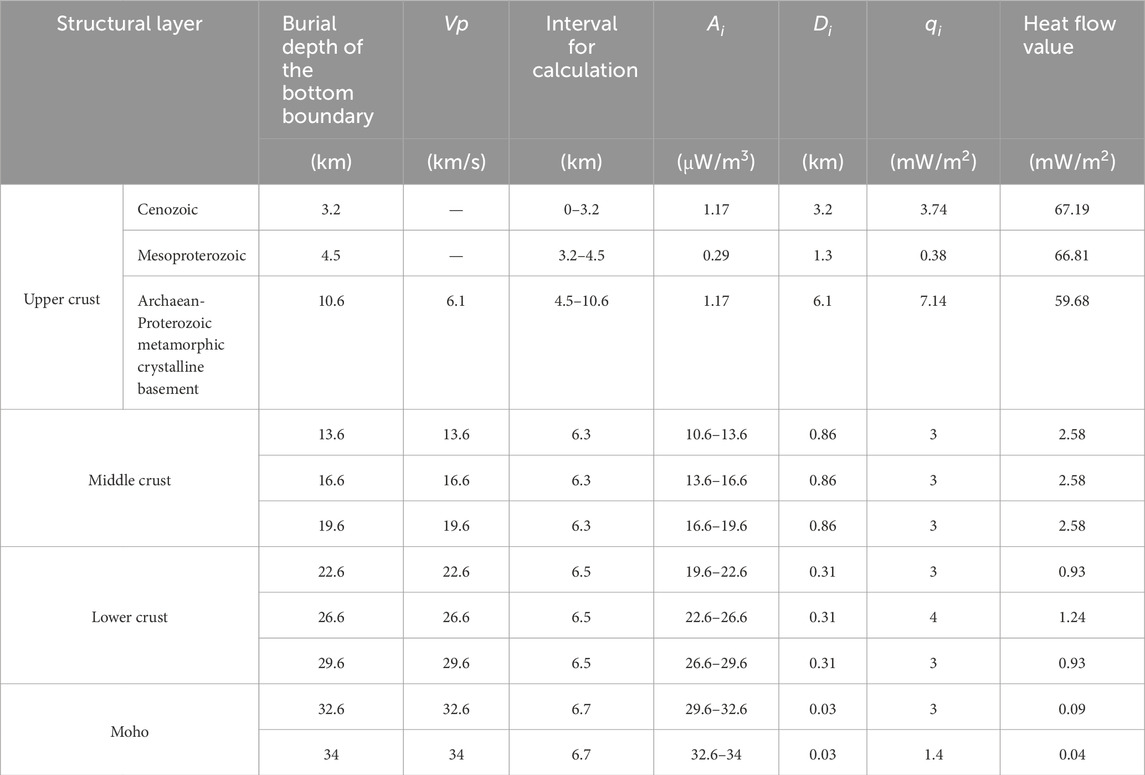
Table 2. Calculation results of the lithospheric thermal structure in the southern Jizhong Depression.
Table 2 shows that the crustal heat flow (
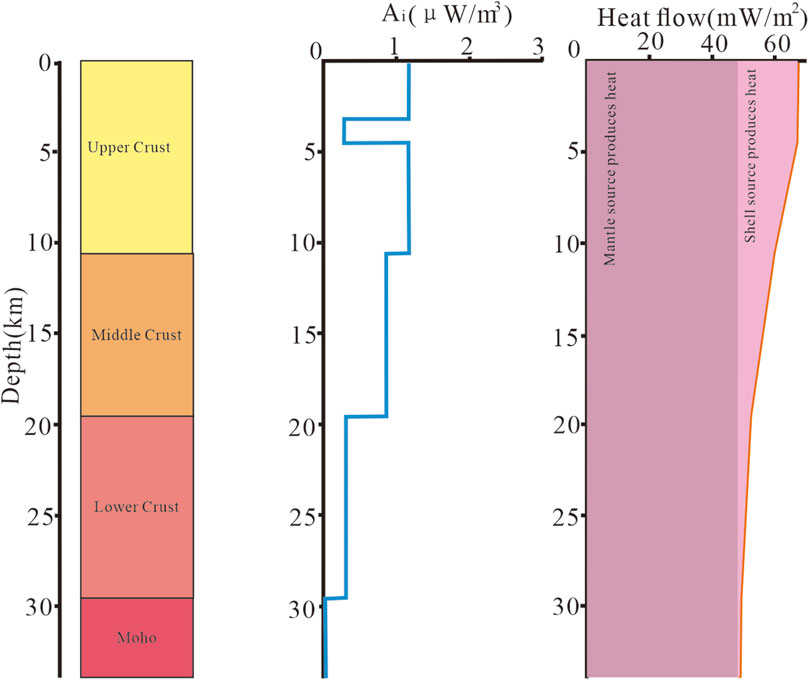
Figure 10. Conceptual model for the lithospheric thermal structure in the southern Jizhong Depression.
Earth’s temperatures at depth
Table 3 presents the distribution of calculated temperatures at depth in the study area, with the crustal structure above the Moho divided into five layers. For strata above the Jixianian strata, the temperatures were determined based on temperature measurements in boreholes. For strata beyond the reach of deep drilling, subsurface temperatures were calculated using Equation 7 after correcting thermal conductivities with Equation 2.
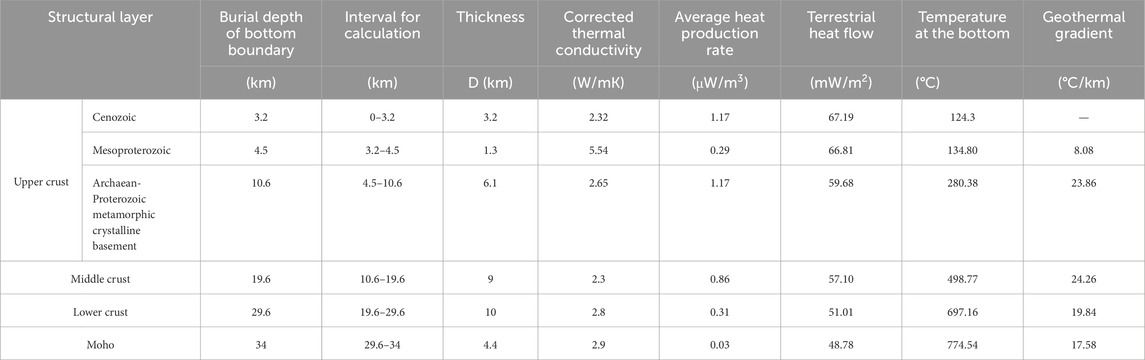
Table 3. Distribution of calculated temperatures at depths in the southern Jizhong Depression.
Based on the calculated temperatures at depth (Table 3) and the results of Rudnick et al. (1998), the lithospheric thickness in the southern Jizhong Depression was estimated to range from 58.14 km to 75.16 km. The demagnetization effect of subsurface materials occurs at a specific temperature known as the Curie point (Hemant et al., 2007). Calculated temperatures at depth shown in Table 3 reveal that the Curie point depths in the study area range from 22.38 km to 24.09 km, which substantially align with the results of previous studies (Cui et al., 2020; Wang et al., 2021). The analysis shows that the Jizhong Depression, located to the west of the Bohai Bay and adjacent to the Taihangshan uplift to the west, experienced multistage tectonic activity from the Mesozoic to the Cenozoic. As a result, the WN-directed compressive stress in the eastern continent transitioned into a WN-directed extensional stress field. From the Eocene to the Oligocene, the Bohai Bay Basin underwent an extensional process again, leading to lithospheric re-thinning (Qiu et al., 2015). Previous studies show that Moho temperatures are approximately 420 °C, 660 °C, and over 1,000 °C, respectively in Australia and the tectonically stable and active regions in the eastern United States (Hyndman et al., 1968; Lachenbruch, 1970). In comparison, the Moho temperature in the study area was calculated to be 607.11 °C, which falls between the values typical of tectonically stable and active regions. The lithospheric thinning caused by tectonic activity in the study area makes deep heat flow more prone to transfer into the shallow crust. Furthermore, since the Neogene and Quaternary periods, the presence of considerably thick cap rocks with low thermal conductivity has provided effective thermal insulation. These conditions together contribute to the geothermal anomalies observed in the study area.
Mechanisms behind geothermal anomalies
Heat-controlling effect of geological structures
This study calculates a lithospheric thickness range of 58.14–75.16 km and Curie interface depths of 22.38–24.09 km, indicating shallow burial depths of bedrock geothermal reservoirs in the Gaoyang Uplift. These findings are consistent with Lei et al. (2024)’s results derived from inversion and analysis of three magnetotelluric profiles (Figure 11). Furthermore, the inversion reveals multiple fault systems within the study area. Consequently, the shallow bedrock burial depths coupled with deep-seated faults establish favorable conduits for upward heat transfer from mantle sources.
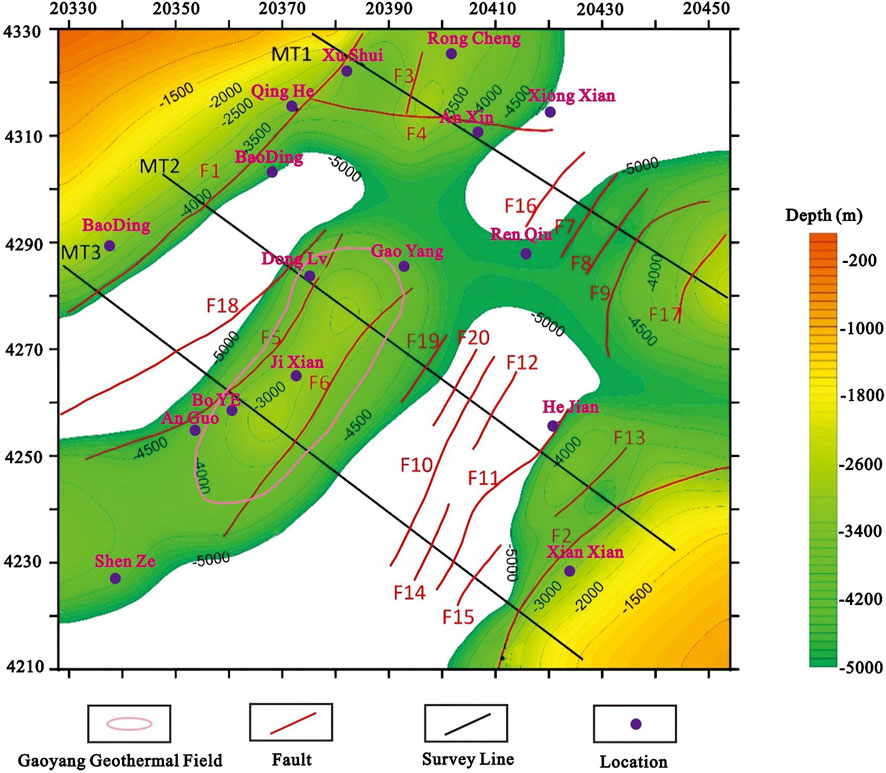
Figure 11. Depth map of basement top and Base (modified after Lei et al., 2024)
Favorable geothermal reservoirs and the thermal insulation of cap rocks
The geothermal reservoirs at the bottom of the Jizhong Depression consist of Jixianian dolomite geothermal aquifers with well-developed fractures. This, combined with the radioactive heat generation of the crust, enhances the heat productivity of the reservoirs. Additionally, the overlying significantly thick Cenozoic sandy mudstones with low thermal conductivity provide effective thermal insulation as cap rocks. The combined effects of these favorable factors contribute to the formation of high-temperature, high-productivity geothermal reservoirs in the Gaoyang geothermal field within the southern Jizhong Depression.
Conclusion
Based on tests of Earth’s temperatures at depth and the analysis of thermophysical properties of rocks in the Gaoyang geothermal field within the southern Jizhong Depression, this study investigated the terrestrial heat flow and lithospheric thermal structure in the southern part of the depression. Accordingly, the distribution of temperatures at depth and the thickness of the thermal lithosphere in the region were calculated. The findings lead to the following conclusions:
1. In the southern Jizhong Depression, rocks exhibit radioactive heat production rates ranging from 0.12 μW/m3 to 2.58 μW/m3, with sandstones showing higher values (average: 1.17 μW/m3) than dolomites (average: 0.29 μW/m3). The rocks have thermal conductivities ranging from 1.53 W/(m·K) to 6.61 W/(m·K), with dolomites showing higher values (average: 5.54 W/(m·K)) than sandstones (average: 2.49 W/(m·K)).
2. The crustal heat flow (
3. The southern Jizhong Depression exhibits Moho temperatures ranging from 697.16 °C to 774.54 °C, suggesting a tectonically stable region. Furthermore, its lithospheric thicknesses range from 58.14 km to 75.16 km, while Curie point depths vary from 22.38 km to 24.09 km. These results closely align with previous studies, confirming the validity of the lithospheric layer division and the parameter selection in this study. In addition, this consistency verifies the accuracy of the model of the regional lithospheric thermal structure developed in this study.
4. The deep-seated faults in the region cut through the lithosphere, facilitating the upward intrusion of deep mantle-derived materials and deep magmas into the crust. As a result, heat flow from sags with low thermal conductivity converges into uplifted zones with high thermal conductivity. Deep groundwater circulation along the fault zones further enhances heat convection, resulting in heat accumulation within fractured carbonate rocks. Furthermore, the overlying significantly thick sandy mudstones serve as cap rocks with effective thermal insulation. The combined effects of these favorable factors contribute to the formation of high-temperature geothermal reservoirs in the southern Jizhong Depression.
Data availability statement
The original contributions presented in the study are included in the article/Supplementary Material, further inquiries can be directed to the corresponding author.
Author contributions
LW: Writing – original draft, Writing – review and editing, Data curation, Formal Analysis, Methodology. LX: Writing – original draft. WL: Writing – review and editing. LL: Writing – original draft.
Funding
The author(s) declare that financial support was received for the research and/or publication of this article. This study was financially supported by the Basic scientific research expenses of the Chinese Academy of Geological Sciences (Grant No. SK202407), the National Key Research and Development Program of China (Grant No. 2021YFB1507300).
Conflict of interest
The authors declare that the research was conducted in the absence of any commercial or financial relationships that could be construed as a potential conflict of interest.
Generative AI statement
The author(s) declare that no Generative AI was used in the creation of this manuscript.
Any alternative text (alt text) provided alongside figures in this article has been generated by Frontiers with the support of artificial intelligence and reasonable efforts have been made to ensure accuracy, including review by the authors wherever possible. If you identify any issues, please contact us.
Publisher’s note
All claims expressed in this article are solely those of the authors and do not necessarily represent those of their affiliated organizations, or those of the publisher, the editors and the reviewers. Any product that may be evaluated in this article, or claim that may be made by its manufacturer, is not guaranteed or endorsed by the publisher.
Supplementary material
The Supplementary Material for this article can be found online at: https://www.frontiersin.org/articles/10.3389/feart.2025.1595595/full#supplementary-material
References
Anand, J., Somerton, W. H., and Gomma, E. (1973). Predicting thermal conductivities of formations from other known properties. Soc. Petroleum Eng. J. 13 (5), 267–273. doi:10.2118/4171-pa
Artemieva, I. M., and Mooney, W. D. (2001). Thermal thickness and evolution of Precambrian lithosphere:a global study. J. Geophys. Res. 106 (B8), 16387–16414. doi:10.1029/2000jb900439
Artemieva, I. M., Thybo, H., Jakobsen, K., Sørensen, N., and Nielsen, L. (2017). Heat production in granitic rocks: global analysis based on a new data comp.
Baumann, M., and Rybach, L. (1992). Temperature field modeling along the northern segment of the european geotraverse and the Danish Transition Zone. Tectonophysics 194, 387–407. doi:10.1016/0040-1951(91)90306-D
Birch, F., Roy, R. F., and Dwcker, E. R. (1968). Heat flow and thermal history in New York and New England. Interscience, 437–451.
Brigaud, F., and Vasseur, G. (1989).Mineralogy,porosity and fluid control on thermal conductivity of sedimentaryrocks. Geophys J. 98 (3) 525–542. doi:10.1111/j.1365-246x.1989.tb02287.x
Bucker, C., and Rybach, L. (1996). A simple method to determine heat production from gamma—ray logs. Mar. Petroleum Geol. 13 (4): 373–375. doi:10.1016/0264-8172(95)00089-5
Bucker, C., Jarrard, R. D., and Wonik, T. (2001). Downhole temperature, radiogenic heat production, and heat flow from the CRP一3 drillhole, victoria Land Basin, Antarctica. Terra Antarica, 8 (3): 151–160.
Cermak, V., and Rybach, L. (1982). “Thermal conductivity and specific heat of minerals and rocks,” in Physical properties of rocks. Berlin: Springer, 305–343.
Chen, A. H., Xu, X., Luo, X., Liao, K., and Peng, D. (2017). Heat flow characteristics Baikang basin and controlling factors of the in South China Sea. Acta Geol. Sin. 91 (8), 1720–1728.
Chen, C., Zhu, C. Q., Tang, B. N., and Chen, T. F. (2020). Research progress on the influencing factors of rock thermal conductivity. Adv. Geophys. 35 (6), 2047–2057.
Cheng, C., Yu, W. G., and Jia, W. T. (2017). Research progress and development trend of thermophysical properties of rocks. Adv. Earth Sci. 32 (10), 12. doi:10.11867/j.issn.1001-8166.2017.10.1072
Cui, Y., Zhu, C. Q., Qiu, N. S., Tang, B. N., and Gong, S. S. (2020). Discussion on the current thermolithospheric thickness and geothermal significance of the central Jizhong depression. Acta Geol. Sin. 94 (7), 10. doi:10.19762/j.cnki.dizhixuebao.2020213
Duan, H. X., Liu, Y. G., Wang, G. L., Bian, K., Niu, X. J., Niu, F., et al. (2023). Characteristics of the terrestrial heat flow and lithospheric thermal structure in central cangxian uplift: a case Study of xianxian geothermal field. Earth Sci. 48 (03), 988–1001. doi:10.3799/dqkx.2022.070
Gong, Y. L. (2003). Geothermal structure and thermal evolution of Bohai Bay Basin in Eastern China. Nanjing: Nanjing University.
Gong, Y. L., Wang, L. S., Liu, S. W., Li, C., Han, Y. B., li, H., et al. (2005). Mantle heat flow and deep temperature in the Jiyang depression. Earth Sci. 30 (1), 121–128.
Gong, Y. L., Wang, L. S., and Liu, S. W. (2011). Thermal structure and thermal evolution of the Bohai Bay Basin in eastern China. Beijing: Atomic Energy Press.
Guo, S. S., Zhu, C. Q., Qiu, N. S., Tang, B. N., and Cui, Y. (2020). Formation conditions of deep geothermal resources and prediction of favorable areas in Xiong’an. J. Geol 94 (07), 2026–2035. doi:10.19762/j.cnki.dizhixuebao.2020227
Hemant, K., Thebault, E., Mandea, M., Ravat, D., and Maus, S. (2007). Magnetic anomaly map of the world: merging satellite, airborne, marineand ground-based magnetic datasets. Earth Planet. Scinence Lett. 260 (1∼2), 56–71. doi:10.1016/j.epsl.2007.05.040
Hyndman, R. D., Lambert, I. B., and Heier, K. S. (1968). Heat flow and surface radioactivity measurementin the Precambrian shield of western Australia. Phys. Earth Planet. Interiors 1, 128–135. doi:10.1016/0031-9201(68)90057-5
Lachenbruch, A. H. (1970). Crustal temperature and heat procuction: w33 implications of the linear heat-flow relation. J. Geophys. Res. 75 (17), 3291300. doi:10.1029/JB075i017p03291
Lei, Q., Ye, G. F., Wu, X. F., Lin, X., Ma, W., Jia, X. Z., et al. (2024). Application of the magnetotelluric sounding method in the investigation and evaluation of deep carbonate rock heat storage in the Jizhong Depression. Geol. Rev. 69 (6), 2023060029. doi:10.16509/j.georeview.2023.12.021
Liao, Y. Z., Zhao, B., Zhang, D. H., Danyushevsky, L., Li, T. L., Wu, M. Q., et al. (2021). Evidence for temporal relationship between the late Mesozoic multistage Qianlishan granite complex and the Shizhuyuan w–sn–mo–bi deposit, SE China. Sci. Rep. 11 (1), 5828. doi:10.1038/s41598-021-84902-6
Liu, G. D., Shi, S. L., and Wang, B. J.(1984). The high conductive layer in the crust of North China and its relationship with crustal tectonic activity[J]. Sci. China: Series B, 14 (9): 839–848.
Lu, K. Z., Qi, J. F., and Dai, J. S. (1997). Structural model of Cenozoic petroliferous basin in Bohai Bay. Beijing: Geological Publishing House.
Luo, L., Zhu, X., He, C., Mao, X., Xu, Z., Wang, X., et al. (2019). Study on the genesis of geothermal fluid in Xianyang geothermal field. Geol. Rev. 65 (6), 1422–1430. doi:10.16509/j.georeview.2019.06.009
Ma, F., Wang, G. L., and Sun, Z. X. (2019). The logging data were used to obtain the deep thermal physical parameters of the Songliao Basin. Acta Geol. Sin. 40 (20), 11. doi:10.3975/cagsb.2019.021101
Morgan, P. (1984). The thermal structure and thermal evolution of the continental lithosphere. Phys. Chem. Earth 15, 107–193. doi:10.1016/0079-1946(84)90006-5
Norden, B., and Forster, A. (2006). Ther mal conductivity and radiogenic heat production of sedimentary and magmatic rocks in the Northeast German Basin. AAPG Bull. 90 (6): 939–962. doi:10.1306/01250605100
Qi, J. F., and Yang, Q. (2010). Cenozoic structural deformation and dynamic processes of the Bohai Bay basin province, China. Mar. Petroleum Geol. 27 (4), 757–771. doi:10.1016/j.marpetgeo.2009.08.012
Qi, J. F., Yu, F. S., Lu, K. Z., Zhou, J. X., Wang, Z. Y., and Yang, Q. (2003). Introduction to Mesozoic Basin structure in Bohai Bay area. Earth Sci. Front. 10, 199–206.
Qiu, N. S. (1998). Geothermal profile of a sedimentary basin in Chinese mainland. Adv. Earth Sci. 13 (5), 447–451. doi:10.11867/j.issn.1001-8166.1998.05.0447
Qiu, N. S., Li, S. P., and Zeng, J. H. (2004). Thermal history and tectonic thermal evolution characteristics of Jiyang depression in Bohai Bay Basin. J. Geol 78 (2), 7.
Qiu, N. S., Wei, G., Li, C. C., Zhang, Y., and Guo, Y. H. (2009). Characteristics of the current geothermal field distribution in the Bohai Sea. Oil and Gas Geol. 30 (4), 8. doi:10.11743/ogg20090404
Qiu, N. S., Zuo, Y. H., Chang, J., Xu, W., and Zhu, C. Q. (2015). Comparison of Meso-Cenozoic thermal regimes in typical basins in eastern and western China. Front. Geoscience 22 (1), 157–168. doi:10.13745/j.esf.2015.01.013
Qiu, N. S., Hu, S. B., and He, L. J. (2019). Geothermal science of sedimentary basins. Beijing: China University of Petroleum Press.
Rao, S., Hu, S. B., Zhu, C. Q., Tang, X. Y., Li, W. W., and Wang, J. Y. (2013). Geodetic heat flux characteristics and lithospheric thermal structure in Junggar Basin. Chin. J. Geophys. 056 (008), 2760–2770. doi:10.1002/cjg2.20061
Roy, R. F., Blackwell, D. D., and Birch, F. (1969). Heat generation of plutonic rocks and continental heat flow provinces. Earth Planet. Sci. Lett. 5 (1), 1–12. doi:10.1016/s0012-821x(68)80002-0
Rudnick, R. L., McDonough, W. F., and O’Connell, R. J. (1998). Thermal structure, thickness and composition of continental lithosphere. Chem. Geol. 145, 395–411. doi:10.1016/s0009-2541(97)00151-4
Rybach, L. (1976). Radioactive heat production in rocks and its relation to other petrophysical parameters. Pure Appl. Geophys. 114 (2): 309–317. doi:10.1007/bf00878955
Rybach, L. (1986). Amount and significance of radioactive heat sourcesin sediments. Collect. S 6 minares, (44): 311–322.
Sass, J. H., Lachenbruch, A. H., Moses, T. H., and Morgan, P. (1992). Heat flow from a scientific research well at cajon pass,california. J. Geophys. Res. 97 (B4), 5017–5030. doi:10.1029/91jb01504
Shen, X. J., Yang, S. Z., and Shen, J. Y. (1989). Experimental study on the radioactive heat generation rate of Tibetan magmatic rocks. Acta Petrol. Sin. (4), 83–92.
Song, J. J., Wang, G. L., Xing, L. L., Qian, J. Z., Dai, L., and Di, H. (2023). Influencing factors of rock thermal conductivity and applicability evaluation of its mixing law predictive models. Geothermics 110, 102680. doi:10.1016/j.geothermics.2023.102680
Sun, D. S., Liu, C. Y., and Yang, M. H. (2004). Evidences for the largescale detachment structure in middle area of Jizhong Depression in Mid-Late Mesozoic period. Geotect. Metallogenia 28 (2): 126–133.
Wang, J. A. (1992). Geothermal characteristics and oil and gas resources of Liaohe fault depression. Science Publishing House, 1–77.
Wang, J. Y., Pang, Z. H., and Hu, S. B. (2015). Geothermal science and its applications. Beijing: Science Press.
Wang, G. L., Zhang, W., Liang, J. Y., Lin, W. J., Liu, Z. M., and Wang, W. L. (2017). Evaluation of geothermal resources potential in china. Acta Geol. Sin. 38 (4), 449–459. doi:10.3975/cagsb.2017.04.02
Wang, Z. T., Zhang, C., and Jiang, G. Z. (2019). Characteristics and causal mechanism of geothermal field in Xiong'an New Area. Chin. J. Geophys. 62 (11), 4313–4322. doi:10.6038/cjg2019M0326
Wang, S. Q., Zhang, B. J., Li, Y. Y., Xing, Y. F., Yuan, W. Z., and li, J. (2021). Mechanism of deep paleoburied hills in the northeast of Gaoyang geothermal field in Xiong'an New Area. Geol. Sci. Technol. Inf. (003), 040. doi:10.19509/j.cnki.dzkq.2021.0319
Wang, C., Qu, M., and Yu, H. Y. (2024). Principle of Earth materials: a historical perspective of thermodynamics of the Earth. Bull. Geol. Sci. Technol. 43 (04), 191–204. doi:10.19509/j.cnki.dzkq.tb20230210
White, R. S. (1988). The earth,s crust and lithosphere. J. Petrology Special_Volume, 1–10. doi:10.1093/petrology/special_volume.1.1
Wu, Z. P., Hou, X. B., and Li, W. (2007). Discussion on Mesozoic Basin pattern and evolution process in Eastern North China. Tecton. Min. 4, 385–399. doi:10.16539/j.ddgzyckx.2007.04.001
Xu, Z. Z. (1992). Discuss the factors and mechanisms affecting the thermophysical properties of rocks. Petroleum Explor. Dev. 19 (6), 85–89.
Yang, Z. L. (2016). “Study on the radioactive heat generation characteristics of typical granite masses in Zhangzhou area and the potential of hot dry rock resources,” in Master's thesis of East China University of Technology.
Yang, S. Z., Zhang, W. R., and Li, G. H. (1993). Experimental study on water saturation and heat flux correction of rock thermal conductivity in Qaidam Basin. Acta Petrol. Sin. 02, 010.
Zhang, H. F., and Jiang, Z. C. (1984). Modern mineralogy lecture 18 - thermophysical properties of minerals. Geol. Geochem. 10, 60–66.
Zhang, W. C., Yang, D. X., Chen, Y. J., Qian, Z., Zhang, C. W., and Liu, H. F. (2008). Characteristics of Paleogene Sedimentary structures and distribution of oil and gas in Jizhong Depression. Acta Geol. Sin. 82 (08), 1103–1112.
Zhang, B. T., ling, H. F., and Shen, J. Y. (2010). Correction of paleoradioactive heat generation in rocks and its geochemical significance. Mineralogy, Petrology, Geochem. Bull. 29 (2), 181–184. doi:10.0000/j.issn.1007-2802.2010.29.10836
Keywords: Jizhong Depression, Gaoyang geothermal field, terrestrial heat flow, lithospheric thermal structure, deep geothermal temperature
Citation: Wang L, Xing L, Lin W and Liu L (2025) Crustal thermal structure and thermal anomaly mechanism in the southern part of the Jizhong Depression, China. Front. Earth Sci. 13:1595595. doi: 10.3389/feart.2025.1595595
Received: 18 March 2025; Accepted: 28 August 2025;
Published: 23 September 2025.
Edited by:
George Kontakiotis, National and Kapodistrian University of Athens, GreeceReviewed by:
Vlad Constantin Manea, National Autonomous University of Mexico, MexicoMumtaz Ali Khan, Bahria University, Pakistan
Raquel Negrete-Aranda, Center for Scientific Research and Higher Education in Ensenada (CICESE), Mexico
Imad Mahmood Ghafor, University of Sulaymaniyah, Iraq
Hamad Ur Rahim, Pakistan Museum of Natural History, Pakistan
Copyright © 2025 Wang, Xing, Lin and Liu. This is an open-access article distributed under the terms of the Creative Commons Attribution License (CC BY). The use, distribution or reproduction in other forums is permitted, provided the original author(s) and the copyright owner(s) are credited and that the original publication in this journal is cited, in accordance with accepted academic practice. No use, distribution or reproduction is permitted which does not comply with these terms.
*Correspondence: Linxiao Xing, eGluZ2x4QGZveG1haWwuY29t