 Mohanna Zarei
 Georgia Destouni
- 1Department of Physical Geography, Stockholm University, Stockholm, Sweden
- 2Department of Sustainable Development, Environmental Science and Engineering, KTH Royal Institute of Technology, Stockholm, Sweden
1 Introduction
Understanding and predicting water flows and storage changes on land is crucial for addressing water-related scientific and practical challenges across disciplines and geographical regions and scales. The degree to which various hydrological, environmental, ecological, biogeochemical, geological, atmospheric, and climate sciences consistently and realistically capture and represent analogous parts of the terrestrial water system and its spatio-temporal dynamics remains largely unknown and uncertain. Coherently addressing the terrestrial water and related knowledge gaps is essential for tackling the key scientific and practical questions (Zarei and Destouni, 2024a), for which we need to decipher the complex interactions between the water system, the climate system (Gudmundsson et al., 2017), and the land and water uses of various human activities in the landscape (Althoff and Destouni, 2023). The increasing availability of regional to global hydro-climatic data has expanded access to key water variables. However, purely observational datasets that can fully represent entire catchments and their total water balance closure still remain highly limited. Direct measurements of the lateral (horizontal) runoff water fluxes (R) through the landscape are particularly limited and especially needed for catchment-wise water balance closure; such measurements are available through stream discharge monitoring that integrates total runoff across a whole catchment and yields catchment-average R by division of the measured discharge with the contributing catchment area. With regard to the vertical water fluxes precipitation (P) and evapotranspiration (ET), precipitation data are available from relatively widespread meteorological monitoring stations, enabling measurement-based interpolation or extrapolation of catchment-average P. In contrast, ET measurements are much scarcer, often requiring model-based estimations due to the lack of sufficient direct flux measurements to cover whole hydrological catchments.
Different datasets are available for addressing the questions and deciphering the interactions involved in the hydrological processes, fluxes, storages, and their changes. Each discipline and sector may then use their preferred dataset, based on some selected combination of ground measurements, satellite observations, and model-based data, to represent, investigate, and predict changes in the terrestrial water system at the scale and world region in focus (Yang et al., 2019; Zhang et al., 2016). Ideally, the different datasets should be consistent, but major discrepancies often emerge (Bring et al., 2015; Ghajarnia et al., 2021; Zarei and Destouni, 2024b), making it essential to distinguish which (if any) specific datasets are realistic, and which datasets diverge considerably and thus are unrealistic and unreliable, and why.
Meeting this distinction challenge is key for selecting relevant and effective measures to mitigate and/or adapt to threatening water flux, storage, and quality changes and risks. The national and international measures required within the transboundary Baltic Sea Drainage Basin (BSDB) to protect and restore ecosystem health in the Baltic Sea is an important regional example where this challenge needs to be met. The BSDB includes national and transboundary hydrological catchments, where changes in the freshwater fluxes from land and the nutrient and pollutant loads these carry to the sea, and the related coastal-marine eutrophication impacts are management concerns with many associated knowledge gaps and uncertainties (Vigouroux and Destouni, 2022). Notably, two-thirds of the BSDB water management districts are delineated according to the Water Framework Directive of the European Commission, meaning that a substantial portion of the hydrological catchments draining into the Baltic Sea fall under international jurisdiction (Nilsson et al., 2004), requiring a coordinated and harmonized approach to address the gaps and uncertainties, and ensure effective management and policy implementation.
However, comprehensive harmonized and openly accessible hydro-climatic data with sufficient spatiotemporal coverage at the BSDB scale remain lacking, even though they are essential for relevant understanding and mitigation of the Baltic Sea eutrophication and pollution (Hannerz and Destouni, 2006; Destouni et al., 2017). Such data are needed to decipher and quantify the key drivers affecting the nutrient and pollutant loading from land to the coastal waters, as well as the variations and changes in the freshwater flows, quality, and inputs to the sea across the BSDB. The data are vital for the development, design, and evaluation of national and international management plans for water quality and ecosystem health improvements in the Baltic inland, coastal and marine waters, as well as for needed scientific knowledge advancements on crucial water resource dynamics in the changing regional climate and other environmental and societal conditions.
The BSDB covers ∼1.7 million km2 land, and is influenced by large spatial and temporal (seasonal and long-term) variations in hydro-climatic (e.g., precipitation and snowmelt), water quality, and anthropogenic conditions across the multiple countries that are encompassed within it (Hannerz and Destouni, 2006; Andersson et al., 2015). To meet the challenge of comprehensive open accessibility to relevant, quality-checked and harmonized hydro-climatic data across these diverse conditions, we here present such a regional dataset synthesis, entitled the Baltic Hydro-Climatic Data (BHCD), for 69 main hydrological catchments with continuous data time series availability over the 30-year period 1980-2020 within the BSDB (Figure 1). The Baltic catchments with relevant data availability included in the BHCD collectively cover approximately 722,235 km2 of land, accounting for nearly half of the total BSDB land area. This synthesis is derived by extraction of data for the Baltic catchments represented within the Global Hydro-Climatic Data (GHCD) compilation provided by Zarei and Destouni (2024b), and represents a broad range of hydrological and climatic conditions with multi-decadal temporal and widespread spatial BSDB data coverage.
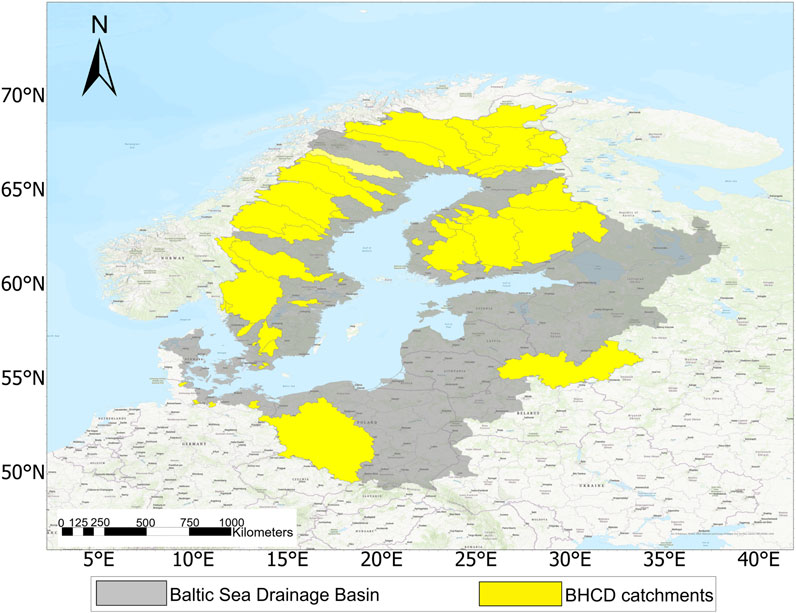
Figure 1. The catchments in the Baltic Hydro-Climatic Data synthesis and their spreading around the Baltic Drainage Basin. Map showing the location of the 69 catchments (yellow fields) and the Baltic Drainage Basin (grey fields). Catchment boundaries derived from GSIM (Do et al., 2018b; Gudmundsson et al., 2018b). Map created by the authors using ArcGIS Pro.
By comparing different datasets, the BHCD enables a comprehensive assessment of important hydro-climatic dataset consistencies, inconsistencies, and uncertainties for the BSDB region. This can support hydrological, coastal-marine, and climate studies, revealing important hydro-climatic and societal relationships, impacts and feedbacks across the catchments included in BHCD. Use of the BHCD can facilitate identification of spatial and temporal patterns, and key data gaps that need to be bridged within the BSDB, and distinction of consistency, realism, and accuracy among the comparative datasets. The BHCD is also a resource for calibration and validation of hydrological, climate, and related coastal-marine models regarding the multiple catchments included in this data synthesis across the Baltic region.
2 Materials and methods
2.1 Data sources and processing
The selection of catchments in the BHCD - as that globally in the GHCD - was based on strict criteria to ensure comprehensive and harmonized spatiotemporal data coverage, open accessibility, and direct comparability across several comparative datasets included in the synthesis. The main catchment selection criteria were: (i) a minimum of 300 non-missing monthly runoff values over the period of 30 years for all datasets, (ii) complete dataset consistency, and (iii) the largest spatial coverage as possible with non-overlapping catchments. Areas within the BSDB that did not meet these criteria across all datasets were excluded from this synthesis. While hydrological studies often consider nested catchments (i.e., including smaller sub-catchments within–and, as such, partly overlapping with - larger catchments), the requirement (iii) of non-overlapping catchments with the largest spatial coverage requirement was used for the BHCD to prevent redundancy in data representation and avoid over-representing the same hydrological signals for small sub-catchments inside the larger catchments in the aggregated statistics. Additionally, priority was given to selecting the largest possible catchments that met all other inclusion criteria, thereby maximizing the spatial data coverage while maintaining data integrity and consistency.
The BHCD–as also globally the GHCD - includes four comparative datasets for the same hydro-climatic variables. The datasets are: (i) Obs, which synthesizes in situ observational data for runoff (Do et al., 2018a; Gudmundsson et al., 2018a) and precipitation (Schneider et al., 2016) and modelled data for the associated average annual evapotranspiration, based on the simple model ET ˜ P-R assuming negligible average annual water storage change (DS = P-ET-R≈0); and, for direct comparison with this simple ET model and DS assumption, (ii) Mixed, which synthesizes the same observational R and P data as Obs but differs in the model used for ET, which for Mixed is the global model GLEAM (Martens et al., 2017; Miralles et al., 2011), based on which the implied water storage change can be calculated as DS = P-ET-R; and corresponding terrestrial water data extracted from the global reanalysis products (iii) GLDAS (Beaudoing and Rodell, 2019; Rodell et al., 2004) and (iv) ERA5 (Hersbach et al., 2017) that each provide a complete set of model-based data for P, ET and R, from which the implied storage change also can be calculated as DS = P-ET-R.
For each of these comparative datasets, the BHCD integrates the observational and model-based data for the main water flux (P, R, ET) and storage-change (DS) variables catchment-wise to ensure consistent and comprehensive variable and spatial-temporal hydro-climatic coverage between the datasets. The data sources in Obs and Mixed include observational P data from the “Global Precipitation Climatology Centre (GPCC-V7)” (Schneider et al., 2016) and R data from the “Global Streamflow Indices and Metadata (GSIM)” (Do et al., 2018a; Gudmundsson et al., 2018a). Mixed also includes model-based data for ET and soil moisture (SM) from the “Global Land Evaporation Amsterdam Model (GLEAM)” (Martens et al., 2017; Miralles et al., 2011), which combines satellite observations with its model algorithms. The observational R data from GSIM in Obs and Mixed define the contributing catchments, which are included consistently in all comparative datasets of the BHCD. Additionally, data for air temperature (T) are also included in Obs and Mixed from GHCN-CAMS (Fan and Van den Dool, 2008). In GLDAS and ERA5, the full sets of model-based T, P, R, ET, and SM data are obtained based on global land surface modeling from the “Global Land Data Assimilation System (GLDAS)” (Beaudoing and Rodell, 2019; Rodell et al., 2004), and on global climate modeling from the “ECMWF Reanalysis fifth Generation (ERA5)” (Hersbach et al., 2017), respectively. A main point of including the different comparative datasets for the same hydro-climatic variables in the BHCD is to facilitate assessment of uncertainty ranges, confidence intervals, and sensitivity analysis in further studies that use the data. That is, for the specific research purposes and catchment areas considered in each study, the results and implications of the different datasets in the BHCD can be directly compared, the consistency/divergence and uncertainty ranges between datasets can be determined, and the result/implication dependence on and sensitivity to dataset choices can be assessed.
The BHCD uses catchment-wise water balance closure (DS = P–ET–R) as a fundamental key (Lehmann et al., 2022; Berghuijs et al., 2014; Bring et al., 2015) to facilitate further investigation of consistency/divergence, uncertainty ranges, and realism of the comparative datasets. While the water balance closure in Obs is assumed to yield negligible storage change (DS ≈ 0), with ET thereby determined as ET ≈ P–R, the other comparative datasets include calculated DS = P–ET–R based on their available more elaborately modelled ET data. Obtaining consistent, high-resolution DS data across numerous catchments of various scales around the world is generally a major challenge. For some areas, however, a reliable combination of ground-based and remote sensing observation data may be available for DS, such that ET is alternatively estimated from catchment-wise water balance as ET = P-R-DS (Bhattarai et al., 2019). For such areas, both the independent DS data and the associated calculated ET data can be compared with the corresponding DS and ET data in the BHCD for further consistency/divergence, uncertainty range, and realism assessment across datasets.
In the BHCD, the temporal changes in SM (DSM) are also calculated for each dataset, so that further studies using the data can compare and check the internal dataset consistency in change directions of DS and DSM, as the latter is also a component of the former. That is, DSM is an integral part of and should be expected to change in the same direction as the total water storage change DS in each catchment (Destouni and Verrot, 2014). For Obs, however, in which DS = 0 by assumption, comparison with DSM is not meaningful. There is also no related set of ground-measured SM data to consistently include in the Obs dataset.
The measured stream discharge data from GSIM define the 69 catchments consistently included in all BHCD datasets. They also determine catchment-average R in the Obs and Mixed datasets and enable ET calculation in Obs (ET = P - R). Global gridded datasets provide the remaining variables, extracted within each catchment’s hydrological boundaries (i.e., water divides). Spatial interpolation generated aggregated catchment value, with an area-weighted averaging approach applied to grid cells intersecting catchment boundaries. Data were processed at the finest consistently available temporal resolution (monthly) to produce catchment-average time series. Additionally, annual and long-term averages were derived to support analysis of longer-term change trends.
To compare total average DS, as derived from water balance closure, with DSM, we separately calculated DSM for each catchment, expressed in fractional units per year, consistent with the relative area-normalized SM values (e.g., mm/mm). The calculation was based on average SM over a moving 3-year window, with DSM quantified as the change from one 3-year window to the next. The choice of a 3-year window allows for a balanced assessment of inter-annual variations while also capturing longer-term trends in DSM over the 30-year data period, as needed to facilitate meaningful comparisons with the corresponding trends in total DS. The comparison between DS and DSM serves as an independent test of the internal consistency and realism of the DS results implied by each dataset. This comparison is relevant and important because soil moisture and its changes are part of the subsurface water system and are directly hydraulically linked to the groundwater storage dynamics (Destouni and Verrot, 2014). Given that groundwater holds the largest share of liquid freshwater on Earth (Oki and Kanae, 2006) and extends beneath the entire land surface area of each catchment (and the world), the groundwater storage changes commonly dominate total DS compared to the surface water storage changes in lakes, wetlands, and streams that only extend over a tiny fraction of the land surface area.
The schematic flowchart in Figure 2 provides an overview of the data processing steps involved in developing the BHCD dataset, summarizing the approach used to create this Baltic multi-catchment and multi-dataset synthesis (Zarei and Destouni, 2025).
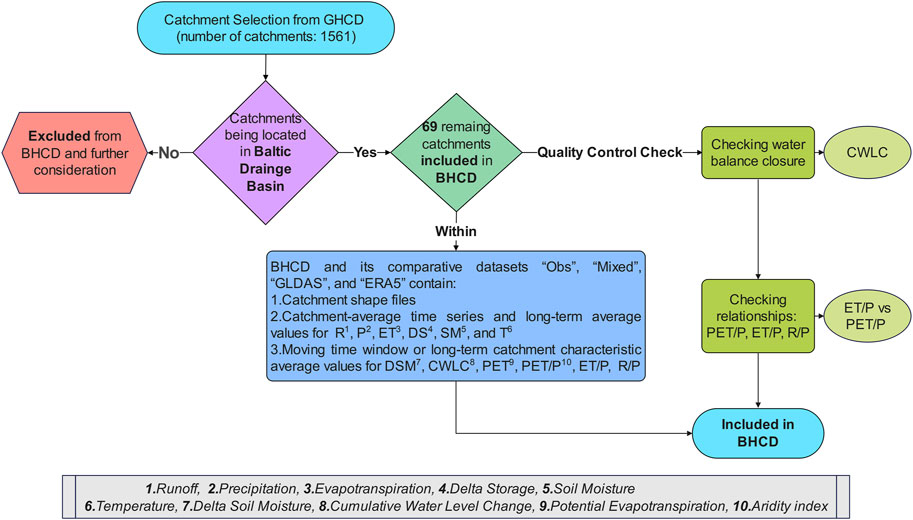
Figure 2. Schematic illustration of the process and steps for creating the Baltic Hydro-Climatic Data synthesis.
2.2 Data overview
The comparative datasets in the BHCD provide time series of monthly and annual average values for each included variable, along with their long-term averages over the 30-year climatological period (1980–2010). Only the Obs dataset does not include monthly ET and DS time series, as its assumptions of ET ≈ P - R and DS ≈ 0 are only physically meaningful when averaged over at least a full year or longer, rather than on a monthly basis. The 1980–2010 period follows the World Meteorological Organization (WMO) recommendation that 30 years of data should be used to represent climatic conditions (World Meteorological Organization, 2017); the BHCD can be further extended as more recent data become available and climatic reference periods change. All variables in the datasets are provided as catchment-average values and, in addition to the catchment-average water flux and total storage-change variables (P, ET, R, DS), the datasets also include: catchment-average T, SM, and DSM data, along with data for DS-implied catchment-average cumulative water level change (CWLC) over the total 30-year period, and the catchment-characteristic long-term aridity index PET/P (where PET is the fully temperature-dependent potential evapotranspiration), and flux partitioning indices of long-term ET/P and R/P.
The calculated DS data and their comparison with the corresponding DSM data in the BHCD can be used to reveal possible important internal inconsistencies within a dataset (in terms of different storage change directions implied for DS than observed in DSM), as well as divergent storage change implications and uncertainty ranges between the comparative datasets. Moreover, based on the average DS rate (mm/year) obtained from each dataset, the BHCD provides a calculated corresponding average CWLC example as an additional indicator of dataset realism. The CWLC indicator is calculated as the product of average DS and an average porosity example of 0.3 for the geological formations that contain the groundwater beneath the entire land surface area of each catchment. Globally, Zarei and Destouni, 2025 have illustrated the importance of such reality checks, especially for the Mixed and ERA5 datasets, for which CWLC values emerge as clearly unrealistic, with catchment-average groundwater level drops or rises by ±100 m and ±50 m, respectively, for some catchments around the global land area; particularly for ERA5, large and unrealistic water level drops (continuous drying) is seen for catchments in the southern hemisphere. Actual porosity values of course vary both within and between catchments depending on geological conditions. The calculated CWLC for a typical porosity value of 0.3 in the BHCD thus is not a specific hydrogeological quantification but just a comparative indicator for broad-scale assessment of DS realism across the datasets. Note also that Obs does not include CWLC data, since its DS ≈ 0 assumption inherently implies CWLC = 0; this specific DS assumption is instead tested by comparison with the DS implications that emerge as realistic from the other datasets.
The relationship of ET/P versus the aridity index PET/P facilitates further checks of dataset realism. Plotting this relationship for the various catchments in Budyko space (Koppa et al., 2021; Langbein, 1949) is a widely used approach to characterizing terrestrial water conditions (Berghuijs et al., 2014; Roderick and Farquhar, 2011; Wang et al., 2016; Xu et al., 2013). Globally, Zarei and Destouni, 2025 have shown that the Mixed and ERA5 datasets yield average ET/P that is considerably greater than the theoretical upper Budyko limit of long-term average ET/P ≤ 1 for many catchments around the world. This reflects an unrealistic water balance closure in these datasets, implying that a considerable amount of extra water, beyond that provided by P minus the part going to feed R, is needed to feed the large modelled ET fluxes; this extra water must then come from continuous water storage depletion (negative average DS), which is indeed what the Mixed and ERA5 datasets imply for some catchments around the world, and in ERA5 particularly so for southern hemisphere catchments (Zarei and Destouni, 2024b).
2.3 Dataset description
Folder 1 in the BHCD contains the catchment polygon shapefiles, which were used to extract data from global datasets and subsequently aggregate them over each Baltic catchment to generate associated catchment-average variable time series. These catchment polygons were sourced from GSIM (Do et al., 2018b; Gudmundsson et al., 2018b) and have been renamed to align with the naming conventions used in the BHCD dataset. A csv file named ‘Catchment_Info.csv’ in Folder 1 lists the BHCD catchment names, their corresponding name in GSIM, the country where the catchment outlet (hydrometric station) is located, and the catchment area in km2 as reported in GSIM (Do et al., 2018b; Gudmundsson et al., 2018b).
Folders 2–5 further contain catchment-average monthly and annual time series for the variables P, ET, R, DS, SM, and T across the 69 study catchments within BSDB for each dataset in BHCD: Obs, Mixed, GLDAS, and ERA5. The Obs dataset includes only annual time series and long-term average values for ET and DS, and no associated ground observation-based SM data. The data are provided as. csv files, organized separately for each variable and catchment. Each dataset folder contains: (i) an Annual folder that includes annual time series data, (ii) a Monthly folder that includes monthly time series data; (iii) a “DatasetX_AnnualDataSummary.csv” file that provides a concise summary of all data for the 69 catchments across the comparative datasets, including catchment-wise long-term average values for P, R, ET, DS, SM, DSM, T, and PET, the relative indices PET/P, ET/P, and R/P, and the DS-implied average CWLC for all catchments, and associated catchment metadata, including catchment names, country of the catchment outlet, latitude and longitude of the catchment outlet locations, and catchment areas (km2); and (iv) a “Readme_Data Columns and Variable Units. txt” file that contains comprehensive details about the variables in the Annual and Monthly folders, including their data source, origin, units of measurement, and column names in the csv time series files. For the SM variable, the readme file also specifies the rootzone depth for the soil moisture profile used in the associated datasets Mixed (based on GLEAM), ERA5, and GLDAS. Users of the BHCD are recommended to read the readme file before utilizing the variable time series in the Annual and Monthly folders.
3 Value and usage of the BHCD
The BHCD synthesis facilitates assessment of important agreements and discrepancies, and associated uncertainty ranges in the catchment-wise water balance closure and hydro-climatic conditions implied by the different comparative datasets. Understanding the reasons behind the dataset similarities, divergences, and uncertainties can significantly enhance research on the freshwater flux and storage change conditions contributing to and implying related changes for the Baltic Sea. Users should note that the comparative datasets are not fully independent, but share some data and methods with key distinctions that can help further studies identify the causes of discrepancies. For example, the Obs and Mixed datasets differ specifically in their ET modeling, while GLDAS and ERA5 variations stem from process representations beyond atmospheric forcing. Overall, the BHCD enables further research into the causes and significance of the dataset agreements, discrepancies, and uncertainties for the water fluxes, storage changes, and their balances in the BSDB and the associated implications for the Baltic Sea. It further allows users to determine the reliability of the comparative datasets for specific catchments and scales of interest, and thereby identify cases that require additional validation against independent data sources. Furthermore, the water balance checks and derived implication measures in the BHCD can be further tested using available ground-measured and satellite data for independent comparative estimates of catchment-average DS, CWLC, and ET/P. Such testing can enhance confidence in a dataset or highlight areas with particular need of further investigation.
Data availability statement
The datasets presented in this study can be found in online repositories. The names of the repository/repositories and accession number(s) can be found in the article/supplementary material.
Author contributions
MZ: Conceptualization, Formal Analysis, Investigation, Methodology, Software, Visualization, Writing – original draft. GD: Conceptualization, Funding acquisition, Methodology, Supervision, Visualization, Writing – original draft, Writing – review and editing.
Funding
The author(s) declare that financial support was received for the research and/or publication of this article. Funding support for this multi catchment and multi dataset synthesis has been provided by the Swedish Research Council (VR, project 2022-04672).
Acknowledgments
Part of the computations and data handling were enabled by resources provided by the National Academic Infrastructure for Supercomputing in Sweden (NAISS), partially funded by the Swedish Research Council through grant agreement no. 2022-06725.
Conflict of interest
The authors declare that the research was conducted in the absence of any commercial or financial relationships that could be construed as a potential conflict of interest.
Generative AI statement
The author(s) declare that no Generative AI was used in the creation of this manuscript.
Publisher’s note
All claims expressed in this article are solely those of the authors and do not necessarily represent those of their affiliated organizations, or those of the publisher, the editors and the reviewers. Any product that may be evaluated in this article, or claim that may be made by its manufacturer, is not guaranteed or endorsed by the publisher.
References
Andersson, A., Meier, H. M., Ripszam, M., Rowe, O., Wikner, J., Haglund, P., et al. (2015). Projected future climate change and Baltic Sea ecosystem management. Ambio 44, 345–356. doi:10.1007/s13280-015-0654-8
Althoff, D., and Destouni, G. (2023). Global patterns in water flux partitioning: Irrigated and rainfed agriculture drives asymmetrical flux to vegetation over runoff. One Earth 6 (9), 1246–1257.
Beaudoing, H., and Rodell, M. (2019). GLDAS noah land surface model L4 monthly 1.0× 1.0 degree V2. 0, greenbelt, Maryland, USA, goddard earth sciences data and information services center (GES DISC).
Berghuijs, W., Woods, R., and Hrachowitz, M. (2014). A precipitation shift from snow towards rain leads to a decrease in streamflow. Nat. Clim. Change 4 (7), 583–586. doi:10.1038/nclimate2246
Bhattarai, N., Mallick, K., Stuart, J., Vishwakarma, B. D., Niraula, R., Sen, S., et al. (2019). An automated multi-model evapotranspiration mapping framework using remotely sensed and reanalysis data. Remote Sens. Environ. 229, 69–92. doi:10.1016/j.rse.2019.04.026
Bring, A., Asokan, S. M., Jaramillo, F., Jarsjö, J., Levi, L., Pietroń, J., et al. (2015). Implications of freshwater flux data from the CMIP5 multimodel output across a set of Northern Hemisphere drainage basins. Earth’s Future 3 (6), 206–217. doi:10.1002/2014ef000296
Destouni, G., Fischer, I., and Prieto, C. (2017). Water quality and ecosystem management: data-driven reality check of effects in streams and lakes. Water Resour. Res. 53, 6395–6406. doi:10.1002/2016WR019954
Destouni, G., and Verrot, L. (2014). Screening long-term variability and change of soil moisture in a changing climate. J. Hydrology 516, 131–139. doi:10.1016/j.jhydrol.2014.01.059
Do, H. X., Gudmundsson, L., Leonard, M., and Westra, S. (2018a). The global Streamflow indices and metadata archive—Part 1: station catalog and catchment boundary. Bremen, Germany: PANGAEA. doi:10.1594/PANGAEA.887477
Do, H. X., Gudmundsson, L., Leonard, M., and Westra, S. (2018b). The Global Streamflow Indices and Metadata Archive (GSIM)–Part 1: the production of a daily streamflow archive and metadata. Earth Syst. Sci. Data 10 (2), 765–785. doi:10.5194/essd-10-765-2018
Fan, Y., and Van den Dool, H. (2008). A global monthly land surface air temperature analysis for 1948–present. J. Geophys. Res. Atmos. 113 (D1). doi:10.1029/2007jd008470
Ghajarnia, N., Kalantari, Z., and Destouni, G. (2021). Data-driven worldwide quantification of large-scale hydroclimatic covariation patterns and comparison with Reanalysis and Earth system modeling. Water Resour. Res. 57 (10), e2020WR029377. doi:10.1029/2020wr029377
Gudmundsson, L., Do, H. X., Leonard, M., and Westra, S. (2018a). The global Streamflow indices and metadata archive (GSIM)—Part 2: time series indices and homogeneity assessment. Bremen, Germany: PANGAEA. doi:10.1594/PANGAEA.887470
Gudmundsson, L., Do, H. X., Leonard, M., and Westra, S. (2018b). The global streamflow indices and metadata archive (GSIM)–Part 2: quality control, time-series indices and homogeneity assessment. Earth Syst. Sci. Data 10 (2), 787–804. doi:10.5194/essd-10-787-2018
Gudmundsson, L., Seneviratne, S. I., and Zhang, X. (2017). Anthropogenic climate change detected in European renewable freshwater resources. Nat. Clim. Change 7 (11), 813–816. doi:10.1038/nclimate3416
Hannerz, F., and Destouni, G. (2006). Spatial characterization of the Baltic Sea drainage basin and its unmonitored catchments. AMBIO A J. Hum. Environ. 35 (5), 214–219. doi:10.1579/05-a-022r.1
Hersbach, H., Bell, B., Berrisford, P., Hirahara, S., Horányi, A., Muñoz-Sabater, J., et al. (2017). Complete ERA5 from 1940: Fifth generation of ECMWF atmospheric reanalyses of the global climate. Copernic. Clim. Change Serv. (C3S) Data Store (CDS). doi:10.24381/cds.143582cf
Koppa, A., Alam, S., Miralles, D. G., and Gebremichael, M. (2021). Budyko-based long-term water and energy balance closure in global watersheds from earth observations. Water Resour. Res. 57 (5), e2020WR028658. doi:10.1029/2020wr028658
Langbein, W. B. (1949). “Annual runoff in the United States (issue 52),” in United States department of the interior. Washington, D.C.: Geological Survey.
Lehmann, F., Vishwakarma, B. D., and Bamber, J. (2022). How well are we able to close the water budget at the global scale? Hydrology Earth Syst. Sci. 26 (1), 35–54. doi:10.5194/hess-26-35-2022
Martens, B., Miralles, D. G., Lievens, H., Van Der Schalie, R., De Jeu, R. A., Fernández-Prieto, D., et al. (2017). GLEAM v3: satellite-based land evaporation and root-zone soil moisture. Geosci. Model Dev. 10 (5), 1903–1925. doi:10.5194/gmd-10-1903-2017
Miralles, D. G., Holmes, T., De Jeu, R., Gash, J., Meesters, A., and Dolman, A. (2011). Global land-surface evaporation estimated from satellite-based observations. Hydrology Earth Syst. Sci. 15 (2), 453–469. doi:10.5194/hess-15-453-2011
Nilsson, S., Langaas, S., and Hannerz, F. (2004). International river basin districts under the EU Water Framework Directive: identification and planned cooperation. Eur. Water Manag. Online 2, 1–20.
Oki, T., and Kanae, S. (2006). Global hydrological cycles and world water resources. Science 313 (5790), 1068–1072. doi:10.1126/science.1128845
Rodell, M., Houser, P., Jambor, U., Gottschalck, J., Mitchell, K., Meng, C.-J., et al. (2004). The global land data assimilation system. Bull. Am. Meteorological Soc. 85 (3), 381–394. doi:10.1175/bams-85-3-381
Roderick, M. L., and Farquhar, G. D. (2011). A simple framework for relating variations in runoff to variations in climatic conditions and catchment properties. Water Resour. Res. 47 (12). doi:10.1029/2010wr009826
Schneider, U., Becker, A., Finger, P., Meyer-Christoffer, A., Rudolf, B., and Ziese, M. (2016). GPCC full data reanalysis version 7.0: monthly land-surface precipitation from rain gauges built on GTS based and historic data.
Vigouroux, G., and Destouni, G. (2022). Gap identification in coastal eutrophication research – scoping review for the Baltic system case. Sci. Total Environ. 839, 156240. doi:10.1016/j.scitotenv.2022.156240
Wang, C., Wang, S., Fu, B., and Zhang, L. (2016). Advances in hydrological modelling with the Budyko framework: a review. Prog. Phys. Geogr. 40 (3), 409–430. doi:10.1177/0309133315620997
Xu, X., Liu, W., Scanlon, B. R., Zhang, L., and Pan, M. (2013). Local and global factors controlling water-energy balances within the Budyko framework. Geophys. Res. Lett. 40 (23), 6123–6129. doi:10.1002/2013gl058324
Yang, H., Huntingford, C., Wiltshire, A., Sitch, S., and Mercado, L. (2019). Compensatory climate effects link trends in global runoff to rising atmospheric CO2 concentration. Environ. Res. Lett. 14 (12), 124075. doi:10.1088/1748-9326/ab5c6f
Zarei, M., and Destouni, G. (2024a). Research gaps and priorities for terrestrial water and earth system connections from catchment to global scale. Earth’s Future 12 (1), e2023EF003792. doi:10.1029/2023EF003792
Zarei, M., and Destouni, G. (2024b). A global multi catchment and multi dataset synthesis for water fluxes and storage changes on land. Sci. Data 11 (1), 1333–13. doi:10.1038/s41597-024-04203-1
Zarei, M., and Destouni, G. (2025). “Baltic hydro-climatic data (BHCD),”. Zenodo. doi:10.5281/zenodo.15019907
Keywords: multiple datasets, baltic sea, catchment, water balance closure, water fluxes, subsurface and surface water storage changes
Citation: Zarei M and Destouni G (2025) Baltic hydro-climatic data: a regional data synthesis for the baltic sea drainage basin. Front. Earth Sci. 13:1595943. doi: 10.3389/feart.2025.1595943
Received: 18 March 2025; Accepted: 29 May 2025;
Published: 10 June 2025.
Edited by:
Markus Meier, Leibniz Institute for Baltic Sea Research (LG), GermanyReviewed by:
Yahor Levachou, Vilnius University, LithuaniaAndris Andrusaitis, Latvian Institute of Aquatic Ecology, Latvia
Simon Mischel, Federal Institute of Hydrology (BfG), Germany
Copyright © 2025 Zarei and Destouni. This is an open-access article distributed under the terms of the Creative Commons Attribution License (CC BY). The use, distribution or reproduction in other forums is permitted, provided the original author(s) and the copyright owner(s) are credited and that the original publication in this journal is cited, in accordance with accepted academic practice. No use, distribution or reproduction is permitted which does not comply with these terms.
*Correspondence: Mohanna Zarei, bW9oYW5uYS56YXJlaUBuYXRnZW8uc3Uuc2U=