 Rengang Shi
 Jianwu Wang3
 Lei Xing
- 1State Key Laboratory of Deep Oil and Gas, China University of Petroleum (East China), Qingdao, Shandong, China
- 2School of Science, China University of Petroleum (East China), Qingdao, China
- 3Fourth Oil Production Plant, PetroChina Qinghai Oilfield Company, Dunhuang, China
- 4School of Geoscience, China University of Petroleum (East China), Qingdao, China
- 5Key Laboratory of Submarine Geosciences and Prospecting Techniques Ministry of Education College of Marine Geosciences, Ocean University of China, Qingdao, China
- 6Evaluation and Detection Technology Laboratory of Marine Mineral Resources Qingdao National Laboratory for Marine Science and Technology, Qingdao, China
- 7Processing and Interpretation Center, Sinopec Matrix Corporation, Qingdao, China
This study proposes a novel quantitative evaluation method for acoustic logging velocities in sedimentary porous media with free gas saturation below 2
1 Introduction
In marine or lacustrine sediments, the decomposition of organic matter generates gases such as methane. When the amount of gas produced exceeds its solubility in water, the excess gas accumulates within the pore spaces of the sediments in the form of free gas. Free gas saturation is a key parameter that describes the proportion of free gas occupying the pore volume in sediments, and it directly affects the pore fluid flow characteristics, gas migration behavior, and the safety of gas storage in sediments (Agnew and Halihan, 2018; Gurevich and Carcione, 2022). Evaluating the free gas saturation holds significant importance across a wide range of disciplines, spanning hydrocarbon exploration (Zhou et al., 2022; Liu et al., 2024; Mu et al., 2024), geological hazard mitigation (Malakhova et al., 2024; Ge et al., 2022), and environmental infrastructure security (Deng et al., 2023; Zhou et al., 2024).
Free gas saturation, even at ultra-low levels, is a critical parameter that governs the reservoir’s flow dynamics, acoustic response, mechanical stability, and overall performance in both natural and engineered systems (Tóth et al., 2014; Tŕehu and Flueh, 2001; Cheng, 2017). Experimental observations have revealed that, compared to water-saturated sediments, the presence of free gas in sediment pores significantly affects acoustic wave propagation (Wang et al., 2018; Guangying and Xiumei, 2018; Wang et al., 2019). As the free gas content increases from zero, the P-wave velocity experiences a significant decrease, while the reduction in S-wave velocity is comparatively smaller (Zhu et al., 2015; Hongxing et al., 2015; Fei et al., 2017; Leighton et al., 2021; Zhan et al., 2022; Chen et al., 2023). Zhan et al. (2022) found that the acoustic attenuation in free gas-bearing sediments is significantly greater than that in water-saturated sediments.
To evaluate free gas saturation, scientists have conducted extensive acoustic experiments and tested various velocity models (Anderson and Hampton, 1980; Gei and Carcione, 2003; Lei and Xue, 2009). Based on bubble resonance theory, Anderson and Hampton (1980) developed a bubble resonance frequency model, a P-wave velocity model, and an attenuation model for free gas-bearing sediments. Due to the irregular geometry of bubbles within the pores and discrepancies in the bubble resonance frequency, the gas saturation calculated using the Anderson-Hampton method may be underestimated compared to the measured values (Gardner and Sills, 2001; Best et al., 2004; Tóth et al., 2014; Cheng, 2017; Wang et al., 2018). Lebedev et al. (2009) injected water into dry synthetic sandstone to achieve near-complete pore water saturation. During this process, due to capillary retention and pore connectivity, a minor proportion of free gas persisted in the form of isolated patches. From the test results, it can be calculated that when the gas saturation is close to 10
In fact, sediments containing low-level free gas can be considered as a three-phase porous medium, consisting of a solid grain framework, pore fluid, and free gas bubbles (Santos et al., 1990; Santos et al., 2004; Lo et al., 2005). Acoustic wave propagation in this type sediments is fundamentally governed by Biot poroelastic theory (Biot, 1956a; Biot, 1956b; Biot, 1962). The Biot theory does not require assumptions about the detailed geometrical features of microscopic pores or the solid skeleton; it is only necessary that, at the macroscopic scale, the medium exhibits spatial uniformity and satisfies reasonable thermodynamic and static conditions. A significant advantage of this theory is that it employs physical parameters with clear physical interpretations, making it broadly applicable to the elastic and inelastic dynamic modeling of rocks, soils, and a wide range of engineering and natural porous materials. Biot theory was validated (Plona and Johnson, 1980; Berryman, 1980), and successfully extended to more complex situations (Leclaire et al., 1994; Gei and Carcione, 2003; Guangying and Xiumei, 2018; Gei et al., 2022; Liu et al., 2021; Shi et al., 2024).
Although the Biot theory has become a fundamental framework for describing solid-fluid interactions, elastic wave propagation, and their attenuation and dispersion in porous media, its direct application to low-saturation free gas reservoirs remains challenging. Natural formations exhibit highly heterogeneous physical property distributions, and under partial saturation or in the presence of gas bubbles, the influence of free gas on elastic wave characteristics shows strong frequency dependence. The velocity and attenuation of elastic waves are controlled by the complex coupling among pore structure, fluid distribution, capillary forces, as well as the size, shape, and spatial distribution of fluid patches (Kong et al., 2022; Gurevich and Carcione, 2022). These multi-scale physical mechanisms in heterogeneous media are difficult to be fully captured by the conventional Biot theory. In particular, the Biot framework has limitations in accounting for patchy flow, local gas bubble effects, slow waves induced by capillary forces, and the resulting frequency-dependent acoustic responses observed in real formations. Therefore, achieving accurate modeling of wave response and quantitative assessment of gas saturation based solely on the Biot theory remains a considerable challenge in low-saturation free gas reservoirs.
To address these issues, a novel methodological framework is developed by systematically introducing a dynamic coupling factor
2 Methods
In order to accurately assess low free-gas saturation, this chapter first selects a robust and reliable modeling approach. The formulation of model parameters associated with free-gas saturation is then systematically refined, and the impact of these improvements is evaluated through comprehensive analysis.
2.1 Velocity model
According to extensions of the classical Biot theory, if the distributions of free gas and pore water in a porous medium are sufficiently uniform, and the spatial scale of the representative volume element (RVE) is much larger than that of capillary pressure fluctuations or fluid patch sizes, then the fine-scale pressure differences between the gas and water phases average out across the RVE. Under these conditions, the two fluids can be regarded as a uniformly distributed ‘mixture’ characterized by a common, macroscopic pore pressure, facilitating the use of equivalent medium theory for large-scale analyses. Under this assumption, the effective elastic and dynamic parameters of the medium can be accurately described by using volume-fraction-weighted averages of the fluid bulk moduli and densities. Therefore, at low free gas saturation (i.e., when the gas content is extremely low), the pressure difference between gas and water is negligible, and the overall wave response of the medium resembles that of a ‘single fluid’ system. The motion equations for these sediments, under the Biot theory framework, can be written as follows:
where
Here,
Here, the apparent liquid density
The bulk modulus and shear modulus of the sediment are expressed as:
Here,
In the aforementioned formulations for the sediment parameters
Substituting the plane harmonic wave into Equation 1 (Liu et al., 2021) together with parameters (Equations 2–11), the characteristic equation can be obtained:
Here, the operator
Here,
2.2 Key parameters
From the calculation process of the velocity model (Equation 13), it can be seen that several parameters affect the P-wave velocity, and the degree of influence varies. Studying which parameters have the greatest impact on velocity as gas saturation changes and identifying the key parameters is of great significance for constructing a gas saturation evaluation model. Based on differentiation and dimensional analysis, sensitivity analysis quantifies the impact of variable changes on the output results. Sensitivity analysis can be used to identify the key parameters for estimating gas saturation, and the sensitivity function can be expressed as:
Here,
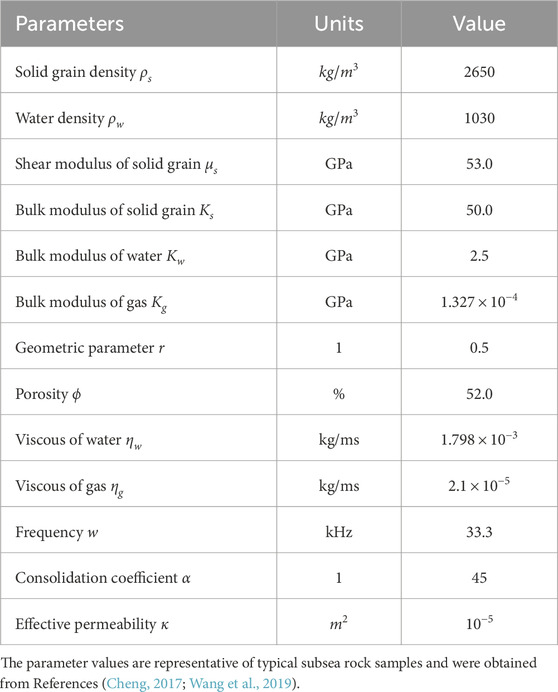
Table 1. The values of the parameters in Equation 1.
To identify the key parameters for evaluating gas saturation, it is necessary to study the variation of the sensitivity function with gas saturation for all parameters, as shown in Figure 1. The curves with relatively large sensitivity function values are marked for clarification. Figure 1 shows the variation of the sensitivity function (Equation 14) of the P-wave velocity
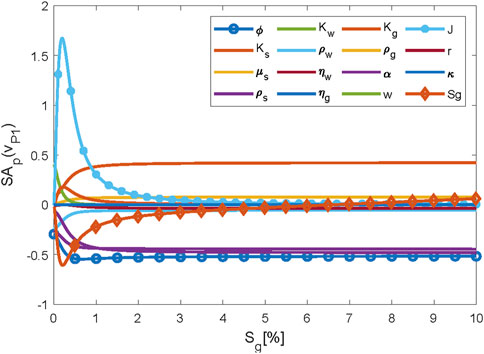
Figure 1. Variation of P-wave velocity sensitivity function with varying free gas saturation. Each curve denotes a sensitivity function with respect to a specific parameter. Except for the target parameter being analyzed, all other parameters are held constant at their default or representative values as provided in Table 1 (e.g.,
The sensitivity function with respect to
For the factor
3 Results and discussion
3.1 Optimizing factor
The Biot motion equation is the ideal model for describing wave propagation in porous media containing free gas (Biot, 1956a; Lo et al., 2005). This model assumes that free gas is uniformly distributed throughout the sediment’s pore space; however, most experimental tests indicate that this assumption is difficult to satisfy. Cheng (2017) generated nearly uniform free gas in the pore space of sediments by depressurizing
The surface in Figure 2 illustrates model velocity derived from Equation 13, with varying values of
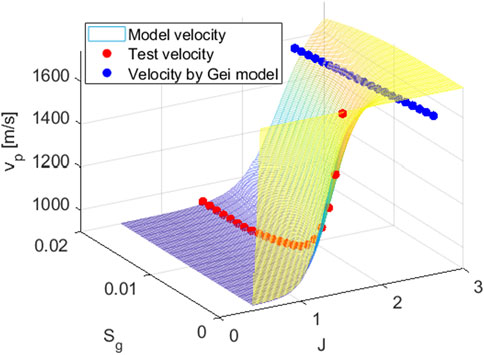
Figure 2. Comparison of model-predicted and measured velocities as functions of
The red dots in Figure 2 is laboratory test velocity (Cheng, 2017; Wang et al., 2018). The observed decline characteristics of test velocities are predetermined, while the velocity decay pattern in our model can be modulated through factor
Here,
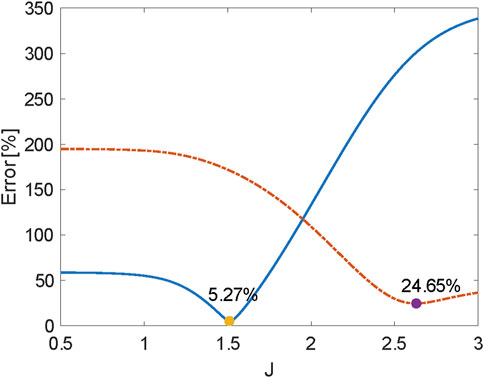
Figure 3. The blue solid line indicates the relative error between model-predicted and measured velocities, while the red dashed line shows the relative error between model-predicted and Gei model velocities. Errors are computed using Equation 15 at eleven
3.2 Well logging application
This section employs the velocity model (Equation 13) to evaluate free gas saturation in the gas-bearing water layer of well LS-361 at a depth of 1790–1800 m, where the gas saturation can be considered negligible. Well LS-361 is located in the central South China Sea, where the underlying rock is incompletely cemented, similar to the experimental samples. The optimal parameters presented in this paper can be used to perform inversion assessments of free gas saturation.
The calculation process for the velocity model (Equation 13) requires parameters such as the skeleton modulus, consolidation parameter, and the physical properties of the pore fluid, all of which can be obtained from well logging data. In all calculations, the empirical parameter
• Step 1. Extract the measured velocity, rock modulus, density, and other physical parameters from the well logging data in the pure water layer.
• Step 2. Calculate the model velocity of the pure water layer using the velocity model (Equation 13). Solve for the formation Biot consolidation parameters by minimizing the relative error between the measured velocity and the model velocity.
• Step 3. Use the formation depth as the independent variable and the consolidation parameters obtained in step (2) as the dependent variable to perform regression analysis and calculate the maximum likelihood estimate of the consolidation parameters.
• Step 4. Incorporate the consolidation parameters derived in step (3) into the velocity model (Equation 13), then solve for the free gas saturation by minimizing the relative error between the measured velocity and the model velocity.
The Biot consolidation parameter values for pure water formations are shown in Figure 4, along with the regression line derived from these values. From this regression line, it is evident that as formation depth increases, the Biot consolidation parameter values also increase, a trend that aligns with common sense. The inversion results for the empirical parameter
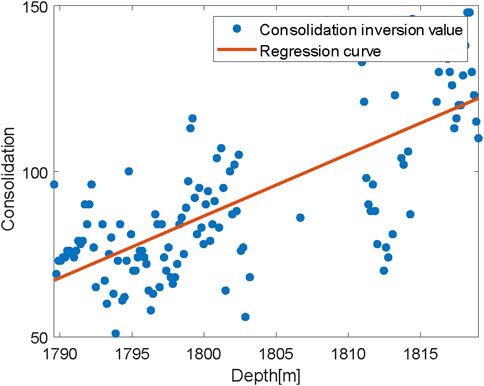
Figure 4. Inversion parameters and regression lines for pure water formations at different depths.
Figure 5 presents a comparison of gas saturation
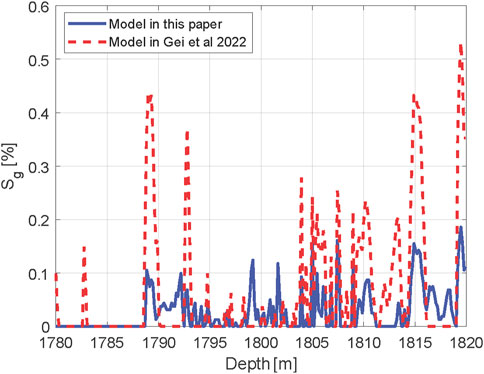
Figure 5. The curve of saturation inversion values varying with formation depth.
3.3 Dissusion
The findings of this study represent a significant advancement in the quantitative evaluation of ultralow free gas saturation in porous marine sediments through acoustic velocity measurements. By embedding a dynamically optimized coupling factor
Sensitivity analyses further highlight the critical role of the optimized parameter
Field application in the LS-361 well of the South China Sea further affirms the model’s robustness under natural, heterogeneous sediment conditions. The model facilitates high-resolution inversion of free gas saturation down to 0–0.12
Collectively, this work constitutes a methodological breakthrough, providing a rigorous, physics-based framework that quantitatively links acoustic velocity to sub-percent levels of gas saturation, thereby surmounting key limitations of traditional approaches such as linear superposition and static phase assumptions. By enriching the theoretical depiction of nonlinear poroelastic phenomena-particularly those driven by microbubble interfacial effects-the proposed model significantly enhances the ability to detect and quantify subtle geophysical gas signatures and deepens insights into the fundamental multiphase dynamics of marine sediments.
Nonetheless, these results also highlight the need to generalize and validate the approach across a broader spectrum of sedimentary environments. While current parameter calibration relies on laboratory-derived data, future research should pursue multiscale validation by integrating advanced imaging modalities (e.g., CT, MRI) to directly correlate microbubble distributions with acoustic responses, and test the model’s applicability to fine-grained, carbonate-rich, or clay-rich geological settings. Ultimately, the proposed methodology offers a robust platform for improved risk assessment in marine geohazard early warning, gas hydrate exploration, and environmental monitoring of
4 Conclusion
This study provides a systematic solution to the quantitative evaluation of acoustic logging velocities in sedimentary porous media under conditions of ultra-low free gas saturation
Both numerical simulations and laboratory data fitting demonstrate that the proposed model effectively captures the sharp decline in P-wave velocity associated with increasing gas saturation in the 0–2
Field application to well LS-361 in the South China Sea further corroborates the practical feasibility of the model, enabling high-resolution inversion of free gas saturation down to 0–0.15
These research findings not only advance the theoretical understanding of multiphase poroelastic mechanisms but also bear substantial scientific and practical significance for the interpretation of weak free gas signals in marine sediments, early warning of gas-related geohazards, and the implementation of environmental safety monitoring.
Data availability statement
The original contributions presented in the study are included in the article/supplementary material, further inquiries can be directed to the corresponding author.
Author contributions
RS: Conceptualization, Investigation, Funding acquisition, Software, Formal Analysis, Methodology, Writing – original draft, Writing – review and editing. JW: Data curation, Formal Analysis, Validation, Writing – review and editing, Resources, Methodology. ZW: Methodology, Conceptualization, Supervision, Software, Writing – review and editing. XG: Visualization, Project administration, Supervision, Writing – review and editing. LX: Investigation, Visualization, Funding acquisition, Writing – review and editing. JZ: Validation, Data curation, Writing – review and editing.
Funding
The author(s) declare that financial support was received for the research and/or publication of this article. This work is supported by the Key Support Project of Regional Innovation and Development Joint Fund (Grant No. U24A20608), the Major Scientific and Technological Projects of CNPC under Grant (ZD2019-184-001), the National Science Foundation of China (Grant No. 42374152, 41404091), and the Shandong Province Natural Science Foundation (Grant No. ZR2020MD050). The authors declare that this study received funding from CNPC. The funder was not involved in the study design, collection, analysis, interpretation of data, the writing of this article, or the decision to submit it for publication.
Conflict of interest
JW is an employee of the Fourth Oil Production Plant, PetroChina Qinghai Oilfield Company, and JZ is an employee of the Processing and Interpretation Center, Sinopec Matrix Corporation.
The remaining authors declare that the research was conducted in the absence of any commercial or financial relationships that could be construed as a potential conflict of interest.
Correction note
This article has been corrected with minor changes. These changes do not impact the scientific content of the article.
Generative AI statement
The author(s) declare that no Generative AI was used in the creation of this manuscript.
Publisher’s note
All claims expressed in this article are solely those of the authors and do not necessarily represent those of their affiliated organizations, or those of the publisher, the editors and the reviewers. Any product that may be evaluated in this article, or claim that may be made by its manufacturer, is not guaranteed or endorsed by the publisher.
References
Agnew, R. J., and Halihan, T. (2018). Why springs bubble: a framework for gas discharge in groundwater. Groundwater 56 (6), 859–870. doi:10.1111/gwat.12789
Anderson, A. L., and Hampton, L. D. (1980). Acoustics of gas-bearing sediments. ii. measurements and models. J. Acoust. Soc. Am. 67, 1890–1903. doi:10.1121/1.384454
Berryman, J. G. (1980). Confirmation of Biot’s theory. Appl. Phys. Lett. 37, 382–384. doi:10.1063/1.91951
Best, A. I., Tuffin, M. D. J., Dix, J., and Bull, J. M. (2004). Tidal height and frequency dependence of acoustic velocity and attenuation in shallow gassy marine sediments. J. Geophys. Res. 109, 1–17. doi:10.1029/2003jb002748
Biot, M. A. (1956a). Theory of propagation of elastic waves in a fluid-saturated porous solid. i. low frequency range. J. Acoust. Soc. Am. 28, 168–178. doi:10.1121/1.1908239
Biot, M. A. (1956b). Theory of propagation of elastic waves in a fluid-saturated porous solid. ii. higher frequency range. J. Acoust. Soc. Am. 28, 179–191. doi:10.1121/1.1908241
Biot, M. A. (1962). Generalized theory of acoustic propagation in porous dissipative media. J. Acoust. Soc. Am. 34, 1254–1264. doi:10.1121/1.1918315
Chen, J., Hu, G., Bu, Q., Wu, N., Liu, C., Chen, Q., et al. (2023). Elastic wave velocity of marine sediments with free gas: insights from CT-acoustic observation and theoretical analysis. Mar. Petroleum Geol. 150, 106169. doi:10.1016/j.marpetgeo.2023.106169
Cheng, P. (2017). Experimental study on acoustic properties of seabed gas charged sand sediments (PhD thesis). University of Science and Technology, AnHui, China.
Deng, Y., Wang, Y., Zhao, Y., Gu, P., Xiao, J., Zhou, J., et al. (2023). Carbon dioxide storagein China: current status, main challenges, and future outlooks. Earth Sci. Front. 30 (4), 429–439.
Fei, W., Yi-Wang, H., and Qi-Hang, S. (2017). Effect of gas bubble volume fraction on low-frequency acoustic characteristic of sandy sediment. Acta Phys. Sin. 66 (19), 194302. doi:10.7498/aps.66.194302
Gardner, T. N., and Sills, G. C. (2001). An examination of the parameters that govern the acoustic behavior of sea bed sediments containing gas bubbles. J. Acoust. Soc. Am. 110 (4), 1878–1889. doi:10.1121/1.1388005
Ge, Y., Cao, C., Chen, J., Wang, H., Zhang, P., He, J., et al. (2022). Monitoring and research on submarine hydrate mound: review and future perspective. Mar. Technol. Soc. J. 56 (4), 140–162. doi:10.4031/mtsj.56.4.14
Gei, D., and Carcione, J. M. (2003). Acoustic properties of sediments saturated with gas hydrate, free gas and water. Geophys. Prospect. 51, 141–158. doi:10.1046/j.1365-2478.2003.00359.x
Gei, D., Carcione, J. M., and Picotti, S. (2022). “’Seismic rock physics of gas-hydrate bearing sediments,” in World atlas of submarine gas hydrates in continental margins. Editors M. Jürgen, and B. Christian (Cham: Springer), 55–63.
Guangying, Z., and Xiumei, H. (2018). “’The acoustic properties of gassy sediments due to gas-content fluctuations,” in Proceedings of the 10th international conference on wireless communications and signal processing (Hangzhou, China), 1–7. 18–20 October 2018.
Gurevich, B., and Carcione, J. M. (2022). Attenuation and dispersion of elastic waves in porous rocks: mechanisms and models. Houston: Society of Exploration Geophysicists, 189–234.
Hongxing, L., Chunhui, T., Fulin, L., and Jianping, Z. (2015). Effect of gas bubble on acoustic characteristic of sediment: taking sediment from east China sea for example. Acta Phys. Sin. 64, 109101. doi:10.7498/aps.64.109101
Juntao, M., Liang, L., Al-Hamad, M. F., Van Steene, M., Ma, S. M., and Abdallah, W. (2024). “Aspect-ratio-dependent pore-size distribution from micp measurement,” in International petroleum technology conference (IPTC, 2024), D021S050R007.
Kong, L., Ma, Y., and Gurevich, B. (2022). Modelling elastic properties of partially saturated porous rocks with aligned fractures. Geophys. J. Int. 230, 2003–2018. doi:10.1093/gji/ggac146
Lebedev, M., Toms-Stewart, J., Clennell, B., Pervukhina, M., Shulakova, V., Paterson, L., et al. (2009). Direct laboratory observation of patchy saturation and its effects on ultrasonic velocities. Geophysics 28, 24–27. doi:10.1190/1.3064142
Leclaire, Ph., Cohen-Tenoudji, F., and Aguirre-puente, J. (1994). Extension of Biot theory of wave propagation to frozen porous media. J. Acoust. Soc. Am. 67, 1711–1719.
Lei, X., and Xue, Z. (2009). Ultrasonic velocity and attenuation during co2 injection into water-saturated porous sandstone: measurements using difference seismic to mography. Phys. Earth Planet. Interiors 176, 224–234. doi:10.1016/j.pepi.2009.06.001
Leighton, T. G., Dogan, H., Fox, P. D., Mantouka, A., Best, A. I., Robb, G., et al. (2021). Acoustic propagation in gassy intertidal marine sediments: an experimental study. J. Acoust. Soc. Am. 150 (4), 2705–2716. doi:10.1121/10.0006530
Liu, B., Wang, X., Su, P., Li, Q., Wan, X., Li, J., et al. (2024). Identification of interbedded gas hydrate and free gas using amplitude versus offset forward modelling. Geophys. Prospect. 72 (4), 1536–1552. doi:10.1111/1365-2478.13402
Liu, L. Y., Xie, G., Ding, J., Liu, B., Xing, D., Ren, N., et al. (2021). Microbial methane emissions from the non-methanogenesis processes: a critical review. Sci. total Environ. 806 (4), 151362. doi:10.1016/j.scitotenv.2021.151362
Lo, W.-C., Sposito, G., and Majer, E. (2005). Wave propagation through elastic porous media containing two immiscible fluids. Water Resour. Res. 41, 1–20. doi:10.1029/2004wr003162
Malakhova, T. V., Budnikov, A. A., Ivanova, I. N., Khurchak, A. I., Khurchak, A. P., and Krasnova, E. A. (2024). Passive acoustic monitoring for seabed bubble flows: case of shallow methane seeps at Laspi Bay (Black Sea). J. Acoust. Soc. Am. 156 (6), 4202–4216. doi:10.1121/10.0034605
Mu, Y., Hu, Z., Guo, Q., Duan, X., and Chang, J. (2024). Impacts of water saturation on gas-bearing property and recovery ratio of marine shale. Energy & Fuels 38 (4), 3089–3104. doi:10.1021/acs.energyfuels.3c04620
Plona, T. J., and Johnson, D. L. (1980). “Experimental study of the two bulk compressional modes in water-saturated porous structures,” in Proceedings of the 1980 ultrasonics symposium, 868–872. Boston MA, United States, 05-07 November 1980.
Santos, J. E., Douglas, J., Corberó, J. M., and Lovera, O. M. (1990). A model for wave propagation in a porous medium saturated by a two-phase fluid. J. Acoust. Soc. Am. 87 (4), 1439–1448.
Santos, J. E., Ravazzoli, C. L., Gauzellino, R. M., Carcione, J. M., and Cavallini, F. (2004). Simulation of waves in poro-viscoelastic rocks saturated by immiscible fluids: numerical evidence of a second slow wave. J. Comput. Acoust. 12 (1), 1–21. doi:10.1142/s0218396x04002195
Shi, R., Wei, Z., Ge, X., Qi, L., and Yao, Z. (2024). Numerical simulation of hydrate reservoir based on three-phase Biot velocity-stress wave equaiton. J. China Univ. Petroleum Ed. Nat. Sci. 48 (3), 57–64.
Tóth, Z., Spiess, V., Mógollon, J. M., and Jensen, J. B. (2014). Estimating the free gas content in baltic sea sediments using compressional wave velocity from marine seismic data. J. Geophys. Res. Solid Earth 119, 8577–8593. doi:10.1002/2014jb010989
Tŕehu, A. M., and Flueh, E. R. (2001). Estimating the thickness of the free gas zone beneath hydrate ridge, Oregon continental margin, from seismic velocities and attenuation. J. Geophys. Res. 106, 2035–2045. doi:10.1029/2000jb900390
Wang, J., Wu, S., Zhao, L., Wang, W., Wei, J., and Sun, J. (2019). An effective method for shear-wave velocity prediction in sandstones. Mar. Geophys. Res. 10, 655–664. doi:10.1007/s11001-019-09396-4
Wang, Y., Huang, L., Wang, Y. L., and Cheng, P. G. (2018). “Improved Anderson Hampton acoustic velocity model for marine sandy gas-bearing sediments,” in Proceedings of the IOP conference series: materials science and engineering (Nanchang, China), 423. 25–27 May 2018.
Zhan, L., Kang, D., Lu, H., and Lu, J. (2022). Characterization of coexistence of gas hydrate and free gas using sonic logging data in the shenhu area, south China sea. J. Nat. Gas Sci. Eng. 101, 104540. doi:10.1016/j.jngse.2022.104540
Zhou, J., Wang, X., Zhu, Z., Jin, J., Song, H., Su, P., et al. (2022). The influence of submarine landslides on the distribution and enrichment of gas hydrate and free gas. Chin. J. Geophys. (in Chinese) 65 (9), 3674–3689.
Zhou, S., Li, Q., Zhu, J., Zhou, Y., Zhao, C., and He, Y. (2024). Consideration on co2 marine storage and exploration of new paths. Natural Gas Industry 44 (4), 1–10.
Keywords: low saturation, free gas, velocity model, Biot theory, porous medium low free gas saturation in porous media
Citation: Shi R, Wang J, Wei Z, Ge X, Xing L and Zhao J (2025) Assessing low free gas saturation via acoustic velocity in porous media. Front. Earth Sci. 13:1596028. doi: 10.3389/feart.2025.1596028
Received: 19 March 2025; Accepted: 30 June 2025;
Published: 17 July 2025; Corrected: 23 July 2025.
Edited by:
Shouxiang Ma, Saudi Aramco, Saudi ArabiaReviewed by:
Sourav Sahoo, University of Southampton, United KingdomMaojin Tan, China University of Geosciences, China
Dahlia A. Al-Obaidi, University of Baghdad, Iraq
Copyright © 2025 Shi, Wang, Wei, Ge, Xing and Zhao. This is an open-access article distributed under the terms of the Creative Commons Attribution License (CC BY). The use, distribution or reproduction in other forums is permitted, provided the original author(s) and the copyright owner(s) are credited and that the original publication in this journal is cited, in accordance with accepted academic practice. No use, distribution or reproduction is permitted which does not comply with these terms.
*Correspondence: Rengang Shi, c2hpcmdAdXBjLmVkdS5jbg==