 Yijing Wan
 Dongyang Wang3
- 1School of Atmospheric Sciences, Guangdong Province Key Laboratory for Climate Change and Natural Disaster Studies, Key Laboratory of Tropical Atmosphere-Ocean System, Ministry of Education, Sun Yat-Sen University, Zhuhai, China
- 2Southern Marine Science and Engineering Guangdong Laboratory (Zhuhai), Zhuhai, China
- 3Zhuhai Public Meteorological Service Center, Zhuhai, China
- 4National Observation and Research Station of Coastal Ecological Environments in Macao, Macao Environmental Research Institute, Macau University of Science and Technology, Macao SAR, China
This study aims to identify the environmental differences between frontal heavy rainfall (FHR) and warm-sector heavy rainfall (WSHR), which frequently occur during early summer (April-June) over South China. Using 14 years of hourly rain-gauge data and high-resolution radiosonde observations, a total of 132 WSHR events and 84 FHR events are quantitatively investigated. FHR events occur most frequently in late May, while WSHR events demonstrate an increasing trend from April to June. WSHR events exhibit a pronounced diurnal variation, with a peak at 0800 LST (Local Standard Time, LST = UTC +8 h). In contrast, FHR events have a peak at 0400 LST. The WSHR and FHR events typically occur under favorable convective conditions characterized by abundant water vapor, moderate convective available potential energy (CAPE), and moderate to severe deep wind shear. Compared to FHR events, WSHR events are associated with more abundant water vapor at 500 hPa, greater warm cloud depth, a lower lifting condensation level, and stronger warm advection. FHR events are characterized by more water vapor in the lower troposphere, stronger instability, and stronger 0–6 km wind shear. Additionally, WSHR events exhibit higher wind speed below 800 hPa than FHR events, while the wind speed in the upper troposphere for FHR events is 3–4 m s-1 larger than that in WSHR events. The thermodynamic characteristics associated with WSHR and FHR events, as revealed in this study, have significant implications for enhancing our understanding of heavy rainfall in South China.
1 Introduction
Heavy rainfall is one of the most destructive natural hazards in South China during the pre-summer rainy season (Wu et al., 2020a). However, its prediction remains unsatisfactory in operational weather forecasting and scientific research. Previous studies have shown that two types of heavy rainfall generally occur during the pre-summer rainy season (April-June), one is frontal heavy rainfall (FHR) and the other is warm sector heavy rainfall (WSHR). FHR typically occurs near the synoptic-scale frontal zone, where the northerly cold airflow converges with southerly warm airflow (Ding, 1994; Zhao et al., 2007). In contrast, WSHR often occurs more than 200 km ahead of a surface front in the warm sector or occurs in the confluence zones of southwesterly and southeasterly airflows, even in the southwesterly airflow without conspicuous convergence (Huang et al., 1986; Luo et al., 2017). Both WSHR and FHR events cause severe flooding, considerable economic loss and serious injury (Wu and Luo, 2016; Liu et al., 2019; Zeng and Wang, 2022).
Previous studies have shown the difference in statistical characteristics of WSHR and FHR events (Wu et al., 2020a; Li and Du, 2021; Fu et al., 2023). WSHR events often occur in coastal areas, while FHR events mainly occur over inland regions. WSHR events tend to occur more frequently from April to June, which is closely related to the onset of summer monsoon, whereas the FHR events have an unobvious monthly variation (Wu et al., 2020a). Additionally, WSHR events have a peak in the early morning, which is mainly caused by the convergence between nocturnal low-level jets (LLJs) and land breezes, whereas FHR events have an afternoon peak. In contrast to FHR events that are driven by strong synoptic forcing, the trigger mechanisms for WSHR events are quite complicated, including topographic lifting (e.g., Chen et al., 2016; Bai et al., 2021; Zhang et al., 2022), local convergence initiated from low-level jets (e.g., Du and Chen, 2018; Du and Chen, 2019a; Zhang and Meng, 2019), and land-sea breeze (e.g., Chen et al., 2016; Gao et al., 2022), as well as their interactions (Du et al., 2020; Zhang S. et al., 2022; Su et al., 2023). Due to complex initiation and formation mechanisms, predicting whether WSHR events will occur in South China remains a great challenge (Huang and Luo, 2017; Huang et al., 2018; Wu et al., 2020b).
Environments for WSHR events are shown in many previous studies (Wang et al., 2014; Wu and Luo, 2016; Liu et al., 2018; Li and Du, 2021; Zeng and Wang, 2022; Zeng et al., 2023). A warm, moist, and conditionally unstable low-level environment is conducive to the occurrence of WSHR events (Chen and Zhang, 2021; Zhang et al., 2022a). Proximity soundings of WSHR events often exhibit moderate-to-high convective available potential energy (CAPE), high precipitable water condition, weak vertical wind shear below 400 hPa, and a low-level jet near 925 hPa with weak warm advection (e.g., Wang et al., 2014; Wu and Luo, 2016; Chen and Zhang, 2021; Zeng et al., 2023). In contrast, FHR events are closely associated with a synoptic-system-related low-level jet with maximum wind speed at 850–700 hPa (Du and Chen, 2018; Li and Du, 2021). The preconvective conditions for FHR events are characterized by moderate-to-high CAPE, and high precipitable water condition (Luo et al., 2014; Han et al., 2021).
Over the years, many studies have investigated the environment and mechanisms of WSHR and FHR events in South China. Although the spatial and temporal differences of these two types of heavy rainfall have been noticed, there is less focus on the differences of preconvective conditions between WSHR and FHR events. WSHR events usually occur far away from the fronts, while FHR events are closely related to the fronts. Analysis of preconvective environments of WSHR and FHR events helps in understanding the reason for the occurrence of the two types of heavy rainfall. Therefore, a climate analysis is called for differentiating the preconvective environments between WSHR and FHR events.
Our motivation for this study is to identify skillful parameters for forecasting WSHR and FHR events in South China and to elucidate different formation mechanisms for WSHR and FHR events. The remainder of this paper is organized as follows. Section 2 describes the data and methods used in this article. Section 3 presents the statistical characteristics of WSHR and FHR events in South China during 2008–2021. The discrepancies in environments between the WSHR and FHR events are shown in Section 4. Finally, the conclusions and discussion are given in Section 5.
2 Data and methods
2.1 Data
The present study focuses on the area ranging within 20–27°N and 105–120°E, which includes almost all of South China, except for Hainan Province. The datasets used in this study include surface and radiosonde observations in South China during April-June of 2008–2021 provided by the China Meteorological Administration (CMA). Surface observations with 1-h temporal resolution from 188 national surface stations (red dots in Figure 1) are used for identifying heavy rainfall events. The radiosonde data is obtained from 14 sounding stations in South China (blue crosses in Figure 1). The sounding stations are endowed with an advanced L-band radiosonde system, capable of meticulously profiling atmospheric parameters such as temperature, atmospheric pressure, relative humidity (RH), and wind characteristics with a remarkable vertical resolution of ∼10 m (Guo et al., 2016; Jiang et al., 2017; Miao et al., 2018). The conventional detection time of the L-band radiosondes is 0800 LST and 2000 LST, and additionally observations at 0200 LST and 14 LST are performed depending on the special weather conditions or test requirements.
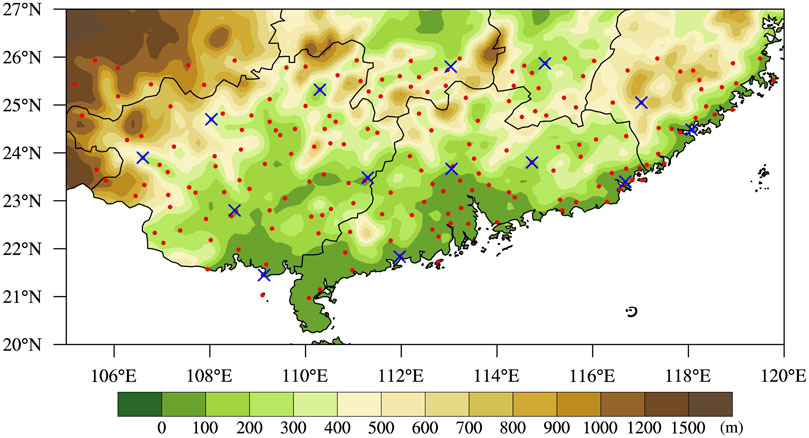
Figure 1. The distribution of the terrain height of South China, sounding sites (blue crosses), and near-surface meteorological stations (red dots).
To identify the cold fronts and diagnose the atmospheric conditions for WSHR and FHR events, ERA5 (Hersbach et al., 2020) is used in this study. ERA5 data have a time interval of 1 h and horizontal grid spacing of 0.25 × 0.25 latitude-longitude with 37 pressure levels and surface. In addition, the tropical cyclone (TC) best-track dataset provided by CMA (Ying et al., 2014; Lu et al., 2021) is used to exclude the days affected by TCs.
2.2 Identification and categorization of heavy rainfall events
In this study, daily precipitation is defined as the total precipitation recorded during the period from 2000 to 2000 LST. A heavy rainfall event in South China is characterized by at least five of the 188 stations reporting daily precipitation exceeding 50 mm day−1. The time when the hourly precipitation reaches (below) 0.1 mm/h is defined as the start (end) time of the heavy rainfall event. Heavy rainfall events due to TCs are excluded if there are any observational stations in South China within the effective radius of TCs on a day in the pre-summer rainy season. The effective radius is 500 km in this study, according to previous studies (Lee et al., 2010; Gu et al., 2017).
Generally, WSHR events occur independently of synoptic fronts and under weak synoptic-scale forcing, while FHR events are closely associated with synoptic fronts. To define WSHR and FHR events, the first step is to identify the fronts. In this study, the locations of fronts are analyzed by forecasters who subjectively locate fronts using a combination of the horizontal gradient of potential temperature (
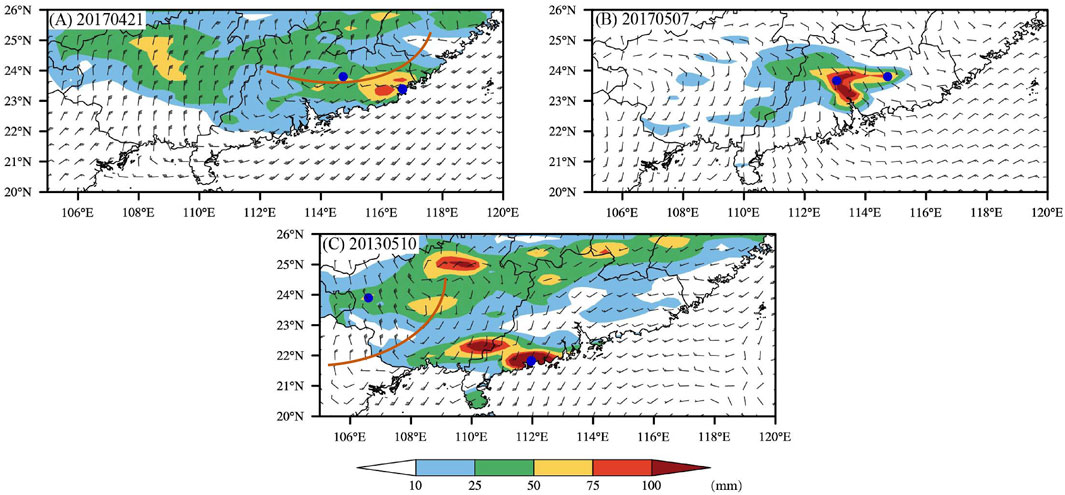
Figure 2. Distribution of precipitation and the circulation at (A) 1600 LST on 21 April 2017, (B) 0800 LST on 7 May 2017 and (C) 0800 LST on 10 May 2013: 925 hPa wind field (each bar represent 4 m s−1) and daily cumulative precipitation (shaded, mm). The solid brown lines represent the positions of the front lines. The blue dots represent the stations where heavy rainfall occurred.
2.3 Proximity sounding and physical parameters
To investigate the features of the environmental deviation between WSHR and FHR events, a precise understanding of how to determine the preconvective soundings is essential. Soundings too close to heavy rainfall events are excluded because the environmental conditions may have been altered by the convective feedback (Potvin et al., 2010). The present study selects the closest soundings prior to 2 h before the start time of heavy rainfall events. For instance, the start time of the pure FHR event (Figure 2A) is at 1600 LST on 21 April, the sounding data collected at 0800 LST on 21 April were selected for analysis of FHR events. When both FHR and WSHR events occur simultaneously, the following procedure is adopted: First, the type of heavy rainfall event experienced at each station is identified. Subsequently, the sounding data corresponding to the time closest to the onset of the heavy rainfall event is selected, based on the start time of the heavy rainfall.
To explore the connections between heavy rainfall and thermodynamic characteristics in the troposphere in South China, an analysis of 15 sounding-derived parameters (Table 1) is conducted. Among these parameters, Td850, Td500, Td100, and PWAT demonstrate the water vapor condition, θe100, Δθe950,500, CAPE, KI, SI, and TT indicate the stability of the atmosphere, while LCL and WCD represent the thermodynamic state. Additionally, WS0-1km, WS0-3km, and WS0-6km characterize the dynamic features in the lower and middle troposphere. All the selected characteristics are frequently used as indicators for heavy rainfall forecasts and are closely associated with the generation and formation of heavy rainfall (Dyson et al., 2015).
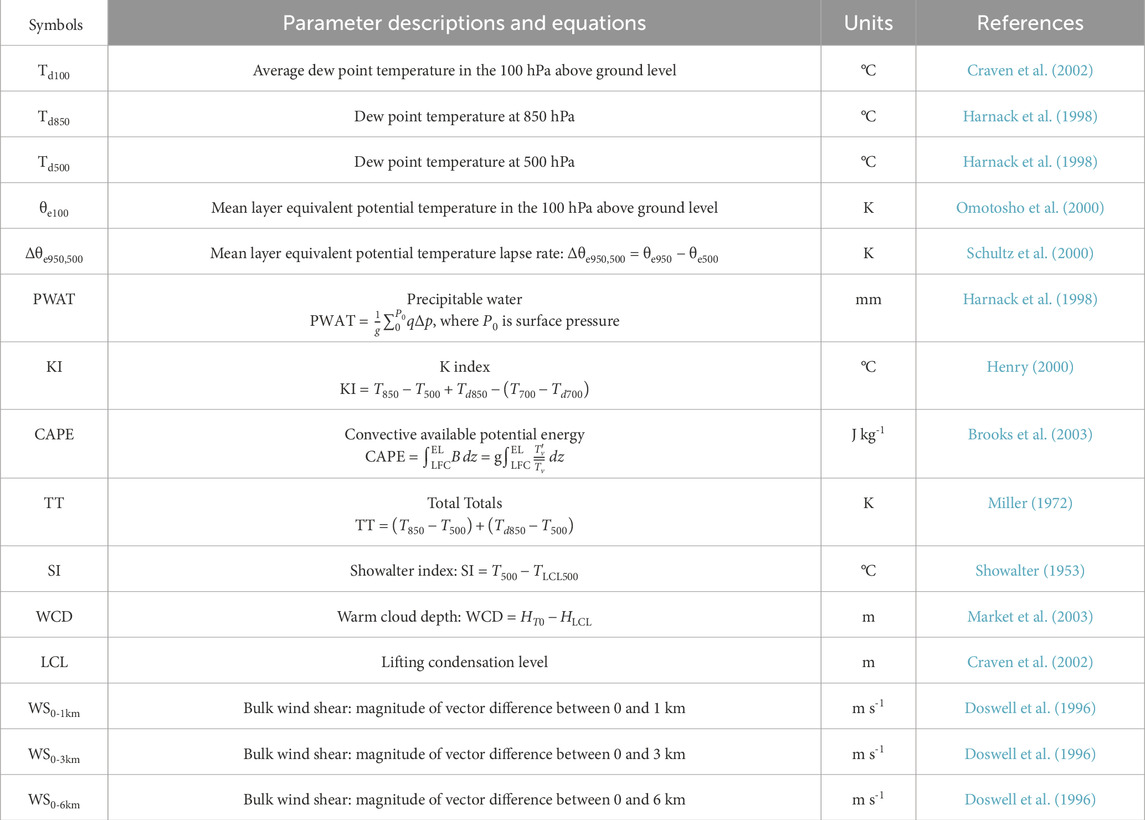
Table 1. Listing of all sounding-derived parameters used in the analysis.
3 Results
3.1 Statistical characteristics of WSHR and FHR events
To understand the seasonal climatology for WSHR and FHR events, Figure 3 shows the semi-monthly variation of rainfall amount and the occurrence of WSHR and FHR events during the pre-summer rainy season from 2008 to 2021. Each month is broken down into two 15/16 periods called early and late. The mean rainfall amount of WSHR events peaks in early May, while FHR events exhibit a maximum rainfall amount in late June, and the former is greater than the latter from April to early June. The frequency of WSHR events increases gradually from April to June. As WSHR events are closely associated with warm and moist conditions, with the onset of the East Asian summer monsoon in late May, the warm and moist flow may contribute to more favorable conditions for WSHR events (Yihui and Chan, 2005). While WSHR events exhibit higher frequency in late June, the rainfall amount is less compared to earlier periods. It is likely associated with changes in convective organization during the monsoon progression. As East Asian summer monsoon establishes, the low-level flow becomes warmer and more moisture-saturated. This environment favors more frequent but less organized convective systems with shorter durations, leading to higher frequency but lower accumulated rainfall. In contrast, the occurrence of FHR events increased in April, with peak values in early May. FHR events decrease from early May to June as the East Asian summer monsoon progresses and the warm, moist air dominates while cold air decays over South China (Chen et al., 2021). The rainfall amount of FHR events increases from early May to late June but the frequency decreases. Although the frequency of cold fronts decreases after East Asian summer monsoon establishes, it is prone to produce more intense FHR events under the warmer and more humid environment in South China once a front occurs.
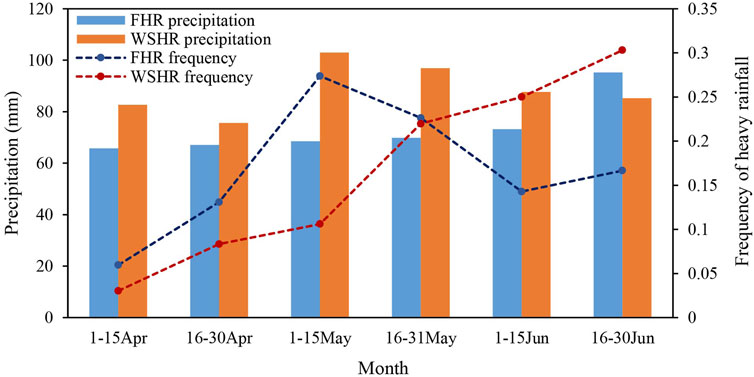
Figure 3. Semi-monthly variation of mean rainfall amount and occurrence frequency of WSHR and FHR events with orange and blue bars representing WSHR and FHR events, respectively. The red (blue) dotted line represents the occurrence frequency of WSHR (FHR) events.
Previous studies have revealed that the diurnal variations of precipitation in South China vary in different areas (Chen et al., 2018; Zhong, 2020). A statistical analysis by Chen et al. (2018) shows that during the pre-summer (May-June) season from 1998 to 2014, the morning rainfall peak was more pronounced over the South China coastal area, whereas afternoon and nocturnal rainfall were dominant on land and in the northern inland region, respectively. Fu et al. (2023) illustrated that FHR events mainly start around 0000 LST, while the start time of WSHR events is relatively evenly distributed from 2300 to 0300 LST. FHR events are likely to end in the morning and noon, while WSHR events prefer to end in the afternoon. This study focuses on the frequency of diurnal variations of the rainfall peak time of two heavy rainfall events. As shown in Figure 4, WSHR events exhibit a peak in the morning (0800 LST), while the peak time of FHR events is mainly concentrated between 0100 and 0500 LST, with the peak at 0400 LST. For coastal areas, the peak for WSHR events is mainly caused by the coastal terrain and land-sea distribution in southern China, which strengthens the nighttime land breeze, combined with the strengthening of the LLJs in the early morning (Chen et al., 2018; Bai et al., 2019; Du and Chen, 2019a; Du and Chen, 2019b; Li and Du, 2021). For inland areas, the interaction between the LLJs and local terrain effects may be conducive for WSHR events (Pu et al., 2022; Zhang S. et al., 2022). In contrast, the rainfall peak time of FHR events is found at night (0400 LST), which is possibly attributed to two mechanisms: the intensification of BLJs at night and the frontogenesis caused by the diabatic process (Chen et al., 2007; Guan et al., 2020). The frontogenesis is dominated by the diabatic heating process during the frontal precipitation (Wang et al., 2022). The sensible cooling over the cloud-free areas at the cold side of the front increases the temperature gradient and causes frontogenesis, which results in the peak time of FHR events at night (Chen et al., 2007).
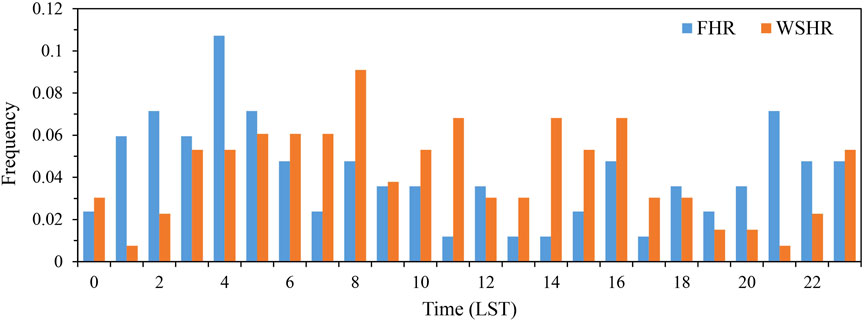
Figure 4. Diurnal variation of frequency for the peak time of WSHR and FHR events. Orange and blue bars represent WSHR and FHR events, respectively.
3.2 Differences in sounding paraments between WSHR and FHR events
3.2.1 Humidity
Figure 5 shows boxplots of moisture parameters for WSHR and FHR events. The Td100 is a parameter that represents the low-level atmospheric vapor condition. The distributions of Td100 exhibit considerable overlaps between WSHR and FHR events. As shown in Figure 5A, their 25th percentiles are 19.6 °C and 20.1 °C, and their 75th percentiles are 22.6 °C and 22.4 °C, both respectively. These results suggest that Td100 shows no significant differences between WSHR and FHR events, indicating that both WSHR and FHR events are initiated in a favorable low-level moist environment. The abundant low-level water vapor of FHR and WSHR events may be associated with BLJ, which favor the preconvective environment to produce heavy rainfall through transporting moisture (Liang et al., 2019; Liu et al., 2020; Li and Du, 2021; Zeng et al., 2023). In this sense, our result agrees with the previous literature.
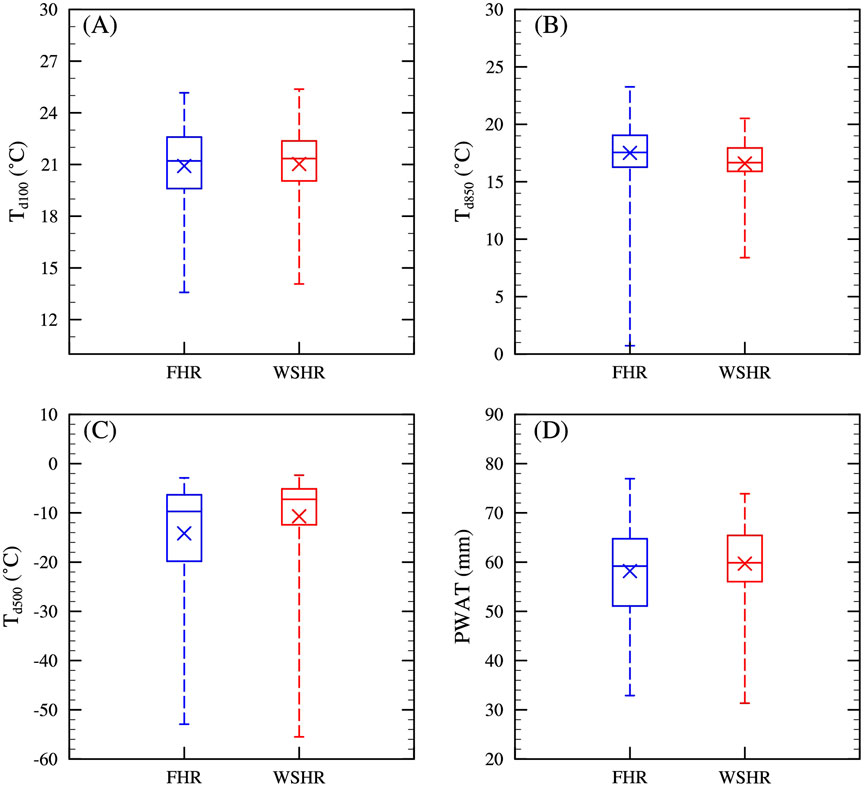
Figure 5. Box-and-whisker plots of (A) Td100, (B) Td850, (C) Td500, (D) PWAT from FHR and WSHR events over South China. The boxes represent the 25th–75th percentiles (interquartile range), whiskers extend to the minima and maxima, and the bars in the boxes indicate the 50th percentiles (median). Red (blue) cross represents the mean value of each parameter of WSHR (FHR) events.
The Td850 shows the water vapor content in the low-level troposphere. The interquartile range of Td850 are 16.3 °C–19.1 °C and 15.9 °C–17.9 °C for FHR and WSHR events, respectively (Figure 5B). The Td850 median is higher in FHR events (17.5 °C) than in WSHR events (16.6 °C). The Td850 between FHR and WSHR events are statistically different with p < 0.01 (two-tailed Welch’s t-test, (Welch, 1947); Table 2), although the distributions overlap somewhat. Some previous case studies demonstrated that the water vapor conditions in the lower mid-level of FHR are critical to the development of frontal convective system (Luo et al., 2020; Yang et al., 2023). WSHR events also tend to occur in an environment with high humidity (Chen and Zhang, 2021; Han et al., 2021). Li and Du (2021) suggested that synoptic-system-related low-level jet (SLLJ) is more associated with FHR events, which is a possible reason for the higher water content at 850 hPa in FHR events.
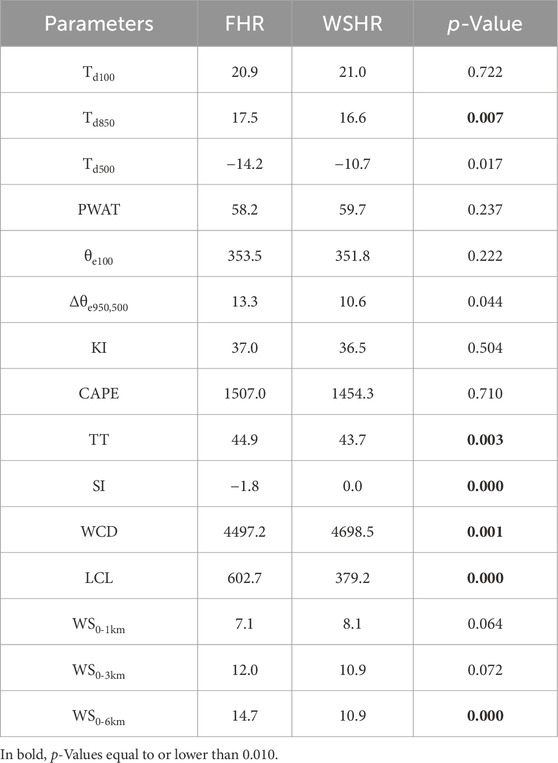
Table 2. Listing of the mean values and p-Value of the t-test for FHR and WSHR events for all sounding-derived parameters.
The Td500 is a parameter that assesses mid-level water vapor content for precipitation. For FHR events, most values range from −19.7 °C to −6.3 °C, which is broader than the range for WSHR events, whose 25th and 75th percentiles are −12.4 °C and −5.1 °C, respectively (Figure 5C). The mean value of Td500 for WSHR events is about 25% higher than that for FHR events. The differences between WSHR and FHR events are statistically significant at a 98% level of confidence, with p < 0.02, despite some overlap between the interquartile ranges (Table 2). Thus, Td500 effectively discriminates between WSHR and FHR events. WSHR events tend to occur in a higher mid-level humidity environment. Since WSHR events occur more frequently in June and FHR events peaks at early May, the higher humidity at mid-level troposphere in WSHR events is related to the warm-moisture air fed by southwesterly monsoonal flows after the onset of East Asia summer monsoon. The higher humidity at midtroposphere in WSHR events may reduce the evaporation and increase the precipitation rate. For FHR events, the drier midtroposphere indicates that the air requires deeper lifting to reach saturation than WSHR events (Doswell et al., 1996).
The PWAT gives an account of the total atmospheric water vapor contained in a vertical column above a specific sensor. As presented in Figure 5D, there is a high degree of overlap in PWAT between WSHR and FHR events. The 25th percentiles for WSHR and FHR are 51 mm and 56 mm, respectively, while the 75th percentiles are 65 mm and 66 mm. These results are consistent with the findings of Chen and Zhang (2021), indicating that both WSHR and FHR events need abundant water vapor for their formation.
3.2.2 Instability parameters
The equivalent potential temperature (θe) is a parameter of both moisture and temperature, which represents the convective instability of a specific layer within the troposphere (Schultz et al., 2000). Figure 6A shows that WSHR and FHR events exhibit similar θe100 values, with 75% of both soundings higher than 348 K. It indicates that the lowest 100 hPa layer over South China is warm and moist with high θe, which favors the occurrence of WSHR and FHR events in South China.
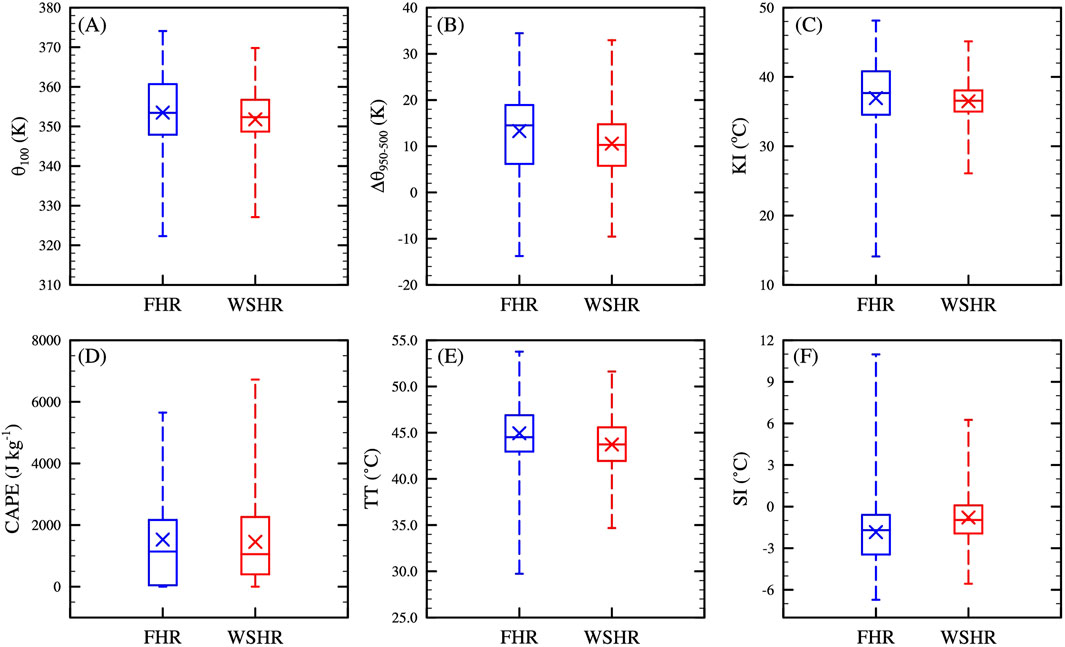
Figure 6. As Figure 5, but (A) for θe100, (B) for Δθe950,500, (C) for KI, (D) for CAPE, (E) for TT, (F) for SI.
The atmosphere is considered as convectively unstable if Δθe >0 over a sufficiently deep layer. Consequently, the Δθe950,500 value is calculated to investigate the instability in the lower troposphere. Around 50% of WSHR events have Δθe950,500 values greater than 10.3 K, and more than 61% of FHR events exceed 10.3 K. The median Δθe950,500 is higher in FHR events (14.53 K) than in WSHR events (10.28 K). The median Δθe950,500 of FHR events is very close to the 75th percentile of Δθe950,500 for WSHR events, which reflects that stronger vertical instability in frontal environments (Figure 6B). There are significant differences between WSHR and FHR events, with a confidence level of 96%. This difference is linked to drier mid-tropospheric conditions (Td500) in FHR events, which enhance the θe contrast between the warm-moist boundary layer and the mid-troposphere. These results suggest that FHR events require a stronger unstable environment for their formation.
The K index (KI) is an integrative indicator of atmospheric stability and moisture, which comprises a temperature difference term and two moisture-related terms (Henry, 2000; Dyson et al., 2015). The KI values for WSHR and FHR events are comparable. As shown in Figure 6C, the 25th to 75th percentiles of KI for FHR events range from about 35 °C to 41 °C, while for WSHR events the 25th to 75th percentiles range from 35 °C to 38 °C. Therefore, there are no significant differences between WSHR and FHR events.
CAPE is an energy-based measure of atmospheric potential instability that is widely recognized as an indicator of convective instability (Brooks et al., 1994; Lepore et al., 2015). CAPE is proportional to the kinetic energy, which a parcel can obtain from its environment due to buoyancy’s contribution to vertical acceleration. Higher CAPE values indicate greater potential for strong updrafts, which favors the occurrence of rainfall. The medians of CAPE for both WSHR and FHR events are around 1100 J kg−1. The 25th-75th percentile of CAPE for WSHR and FHR events range from 99 J kg−1 to 2189 J kg−1 and 404 J kg−1–2266 J kg−1, respectively. The distribution of CAPE exhibits a high degree of overlap (Figure 6D), indicating CAPE may not be useful in distinguishing whether FHR or WSHR events occur. These results are consistent with previous findings (Dong et al., 2019; Zeng et al., 2023).
The Total Totals Index (TT) is a parameter that is highly relevant in the forecasting of thunderstorms and other convective events. According to the threshold given by the Weather Forecast Office in North America, TT below 45 °C is an unfavorable environment for thunderstorm formation, whereas TT above 50 °C encourages the development of thunderstorms. Applying these figures to our database, we find that 44% of FHR events and 32% of WSHR events exceed 45 °C, and only three FHR events and one WSHR event surpassed 50 °C, which is consistent with Li et al. (2021). Compared to WSHR events, FHR events prefer to occur with a higher TT environment, which accounted for stronger instability. WSHR and FHR events are statistically different at a 99% level of confidence, although the distributions overlap somewhat (Figure 6E). Therefore, TT allows us to differentiate between WSHR and FHR events.
The Showalter Index (SI) is defined as the temperature difference between 500 hPa and the temperature of an air parcel in a pseudo-adiabatic ascent from 850 hPa to 500 hPa. A negative SI value indicates an unstable environment. The median of SI for FHR events is −1.7 °C, lower than that of WSHR events, which is −1 °C (Figure 6F). 87% of FHR events occurred under unstable conditions (SI < 0), with 59.5% in moderate (SI from −3 °C to 0 °C) instability and 14.3% in severe (SI ≤ −4 °C) instability, respectively. In contrast, 65.2% of WSHR events occurred in moderate instability, while only 2.3% in severe instability. There are significant differences between WSHR and FHR events, with a confidence level of 99%. This suggests that FHR events are associated with greater instability than WSHR events, and SI shows skillful discrimination between WSHR and FHR events.
The Δθe950,500, TT, and SI statistically significantly discriminates well between FHR and WSHR events. In contrast, θe100, KI, and CAPE exhibit limited utility in distinguishing between FHR and WSHR events. The distributions of the humidity and instability parameters above indicate the differences between FHR and WSHR events. In general, heavy rainfall is produced by deep moist convection that develops within a favorable preconvective environment in the presence of three essential ingredients: moisture, instability, and lift (Doswell et al., 1996). The differences in Δθe950,500 may link to the drier mid-troposphere in FHR events, which enhance the θe contrast between the warm-moist boundary layer and the mid-troposphere. The θe100 and KI mainly show thermodynamic characteristics below 700 hPa. They may not be useful in distinguishing FHR and WSHR events due to small difference in temperature and humidity conditions between FHR and WSHR events.
3.2.3 Dynamic parameters
Vertical wind shear is a critical factor influencing the organization and structural characteristics of heavy rainfall, as it helps to decouple the updraft and downdraft flows (Dyson et al., 2015). Previous studies have demonstrated that lower vertical wind shear corresponds to a decreased likelihood of raindrop evaporation, promoting efficient precipitation (Davis, 2001).
WS0-6km values greater than 10 m s−1 and 20 m s−1 are considered favorable environments for multicell storms and supercells, respectively (Markowski and Richardson, 2010). Strong vertical wind shear facilitates the organization of convection into mesoscale convective systems (Weisman and Klemp, 1982). As illustrated in Figure 7A, a large fraction of both WSHR and FHR events are associated with WS0-6km below 20 m s−1. FHR events exhibit higher quartiles than WSHR events, with a median WS0-6km for FHR events of 13.2 m s−1, compared to 10.0 m s−1 for WSHR events. The 25th percentile of WS0-6km for FHR events is 10.9 m s−1, which is larger than the median WS0-6km for WSHR events (10.0 m s−1). And the median of WS0-6km for FHR events is close to the 75th percentile of WS0-6km for WSHR events, which suggests that FHR events tend to be accompanied by stronger vertical wind shear. These results are consistent with Zeng et al. (2023). The distributions of WS0-6km are statistically significant at the 99% confidence level, with p < 0.001 (Table 2), illustrating that WS0-6km is a good discriminator for these two types of heavy rainfall. It indicates that FHR events develop in an environment with stronger vertical wind shear than WSHR events. Strong vertical wind shear is conducive to the formation of tilted structures in convective systems, separating updrafts from precipitation particles. The separation of updrafts and downdrafts generated by the gravitational drag of precipitation particles is beneficial for the development of convective systems. Thus, the lifetime of the convective systems has been extended (Houze, 2004; Pilorz et al., 2016). In addition, the vertical wind shear promotes the concentration of water vapor carried by updrafts in the middle and lower troposphere, which is beneficial for improving precipitation efficiency and increasing the probability of short-term heavy rainfall. Liu et al. (2020) suggested that the more intense cold or quasi-stationary front accompanied by the stronger geostrophic southerly winds within both jets over inland and coastal south China is, the more rainfall over the inland region is favored. Thus, synoptic conditions with high WS0-6km are conducive for the initiation of FHR.
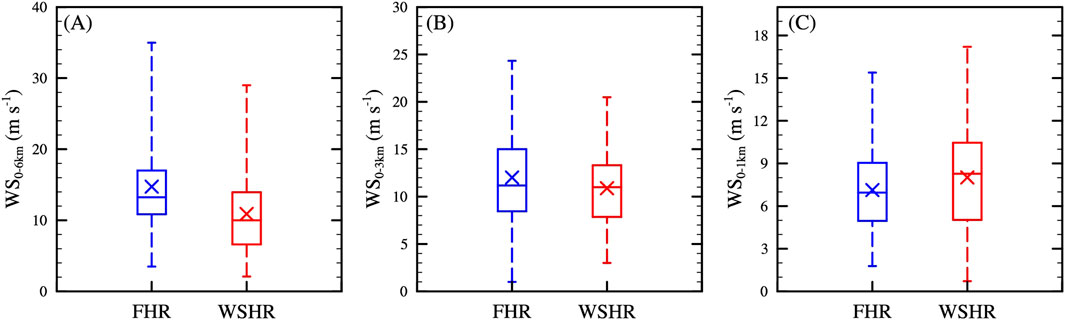
Figure 7. As Figure 5, but (A) for WS0-6km, (B) for WS0-3km, (C) for WS0-1km.
The distributions of WS0-3km exhibit considerable overlaps between WSHR and FHR events (Figure 7B). The 25th to 75th percentile of WS0-3km for FHR events range from 8.7 m s−1–15.2 m s−1, whereas the 25th and 75th percentile values for WSHR events are 7.9 m s−1 and 13.3 m s−1, respectively. These values are consistent with the results presented in Zeng et al. (2023). It implies that WS0-3km shows no significant differences between WSHR and FHR events, with both event types characterized by weak-to-moderate shear (5–20 m s−1).
Previous studies have revealed that strong low-level wind shear is unfavorable for torrential rain (Markowski and Richardson, 2010; Zhang Q. et al., 2022). Figure 7C shows that the median and mean values of WS0-1km for FHR events are lower than those of WSHR events. For FHR events, the 25th and 75th percentiles are 5.0 m s−1 and 9.1 m s−1, respectively. This interval is similar to that of WSHR events, whose 25th and 75th percentiles are 5.3 m s−1 and 10.5 m s−1. The differences in WS0-1km values are not statistically significant, illustrating that both WSHR and FHR events are characterized by weak WS0-1km in most cases.
In addition to bulk wind shear, the vertical wind profiles of WSHR and FHR events are compared. For FHR events, the mean wind speed increases gradually from near the surface to 200 hPa, with the maximum wind speed reaching 19.6 m s-1 (Figure 8A). The low-level wind speed for WSHR events increases from 2 m s−1–9.8 m s−1 below 850 hPa. From 800 hPa to 350 hPa, the wind speed maintains a relatively stable range of 10–12 m s−1, while above 300 hPa, it increases further to 15 m s−1. The wind directions of WSHR and FHR events veer with altitude from the boundary layer to midtroposphere, transitioning through south-southeasterly, southerly, south-westerly, and westerly directions. This veering indicates strong warm advection, with an average 900–800 hPa wind speed of 6–10 m s−1 from the southwest. WSHR events have greater wind speed and warm advection in the lower troposphere. The stronger low-level wind favors the low-level disturbance, which can cause significant low-level convergence and the initiation of convective systems (Chen et al., 2023). The warm advection is conducive to the formation of warm and humid environmental conditions and the deeper thickness of the warm cloud layer for convection triggering.
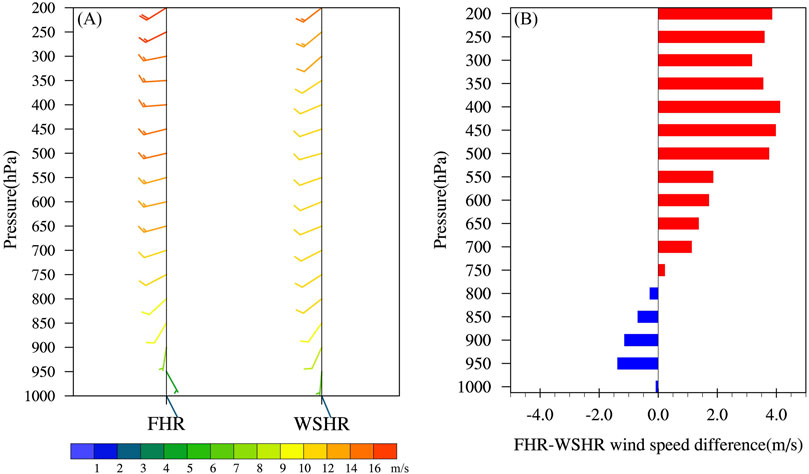
Figure 8. (A) Vertical profile of mean wind direction and speed for WSHR and FHR events, (B) vertical profile of the wind speed difference between FHR and WSHR events. Short barbs represent wind strengths of 5 m s−1 and long barbs 10 m s−1.
Figure 8B presents the wind speed differences between FHR and WSHR events. The largest difference between WSHR and FHR events is at 400 hPa in the upper troposphere, which is 4.1 m s−1. In FHR events, the wind speed in the upper troposphere is 3–4 m s−1 larger than that in WSHR events. The combination of frontal lifting, stronger wind shear, and abundant water vapor creates favorable conditions for the initiation of convective systems. In contrast, WSHR events have stronger mean winds than FHR events under 800 hPa, particularly in the v component, where winds are about 1.5 m s−1 stronger. Strong southerly winds might favor the preconvective environment to produce WSHR by transporting more moisture.
Some previous cases studies demonstrated that the underestimated southerlies in the lower troposphere result in the northeastward shifted shear line and the absent moisture channel at the boundary layer in a forecast of WSHR event (Zhang et al., 2022b). Attributed to these atmospheric circulation biases, the accumulated warm and moist energy is weaker at the boundary layer, which leads to weaker intensities of precipitation in the forecast. Zhang and Meng (2019) suggested that the QPF skill of WSHR events with LLJs is lower than that without LLJs. The QPF skill of WSHR events with LLJs is significantly correlated with the forecast accuracy of the LLJs, especially at 925 hPa. WSHR events are characterized by stronger wind than FHR events in the low-level troposphere and a close relationship with LLJs. Future numerical prediction for WSHR events need to improve the low-level wind and warm advection. The forecast uncertainties of FHR primarily stem from the SLLJ and the convergence of cold and warm air masses (Li and Du, 2021). Improving the prediction skill of frontal lifting and the wind shear can enhance the numerical prediction of FHR events. Assimilating more wind observations in the numerical model may correct the wind speed and wind direction, which helps to improve the QPF skill of WSHR and FHR events.
3.2.4 Warm cloud height and LCL height
The warm cloud depth (WCD) is defined as the difference in height between the lifting condensation level and the freezing level (0 °C isotherm) (Dyson et al., 2015). WCD is closely related to high precipitation rates. Several previous studies showed that WSHR events usually occur in environments with thick warm cloud layers (He et al., 2021; Pu et al., 2022; Zhang Q. et al., 2022). Figure 9A shows that both WSHR and FHR events have high WCD values, with 97% of these events exceeding 3.3 km. Moreover, a significant difference exists between WSHR and FHR events. For FHR events, most WCD values range from 4216 m to 4821 m, while WSHR events have higher 25th and 75th percentiles of 4531 m and 4985 m, respectively. WSHR events are characterized by high precipitation efficiency, which may be associated with the collision and coalescence of raindrops (warm rain process) in deep warm clouds (Davis, 2001; Han et al., 2021; Zhang Q. et al., 2022; Wang et al., 2025).
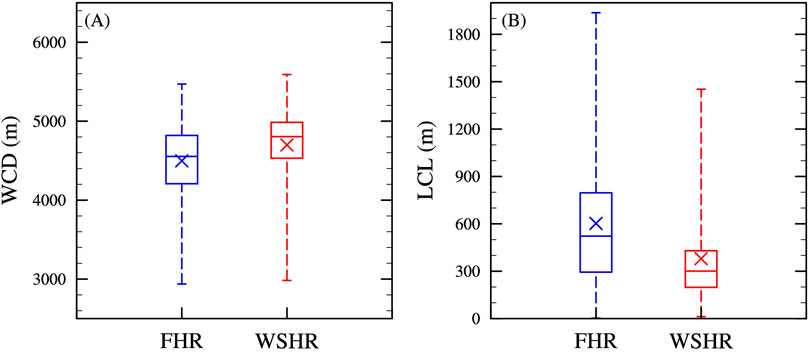
Figure 9. As Figure 5, but (A) for WCD, (B) for LCL.
The lifting condensation level height (LCL) is defined as the height at which water vapor condenses, as well as the height of the stratus cloud base. The distributions of LCL associated with the WSHR and FHR are shown in Figure 9B. The median and mean values of LCL for WSHR events are consistently lower than those for FHR events, with a significant discrepancy observed at a confidence level of 99% (Table 2). Based on these results, LCL discriminates well between WSHR and FHR events.
4 Summary
Using surface meteorological observations, ballon-sounding measurements, and ERA5 reanalysis data, heavy rainfall events during the pre-summer rainy season from 2008 to 2021 were classified into WSHR and FHR events. This study investigates the differences in statistical and preconvective environmental characteristics between WSHR and FHR events. The major findings can be summarized as follows:
The monthly frequency of WHSR events in South China increases from April to June. The occurrence frequency of FHR events demonstrates an unimodal pattern, peaking in early May. The mean rainfall amount of WSHR events peaks in early May, whereas FHR events have a maximum rainfall amount in late June. The peak occurrence time of WSHR events in South China is in the morning (0800 LST), whereas the FHR events tend to peak in the early morning (0400 LST).
To identify the crucial parameters that can improve the prediction of WSHR and FHR events, 15 metrics were evaluated based on 132 and 84 proximity soundings for WSHR and FHR backgrounds, respectively. Generally, both WSHR and FHR events occur in moist environments. The middle level of WSHR events is moister than those of FHR events, while the lower troposphere of FHR events has more water vapor than WSHR events. In contrast to the WSHR background, the environment for FHR events is characterized by stronger atmospheric instability, with three parameters (Δθe950,500, TT, and SI) showing significant differences between WSHR and FHR events. Although CAPE is typically used to reflect the environmental instability for heavy rainfall events in previous studies (e.g., Wang et al., 2014; Wu and Luo, 2016; Liu et al., 2018), it proves indistinguishable between WSHR and FHR events. The dynamic environments of both WSHR and FHR events are associated with moderate to severe wind shear, with FHR events exhibiting stronger WS0-6km than WSHR events. The composite wind profiles rotate clockwise from boundary layer to midtroposphere in both WSHR and FHR events, indicating that these events are associated with strong warm advection. The wind speed for FHR events increases gradually from 1000 hPa to 200 hPa. WSHR events exhibit greater wind speed below 800 hPa than FHR events, while the wind speed in the upper troposphere for FHR events is 3–4 m s−1 larger than that in WSHR events. Moreover, WCD and LCL display significant differences between WSHR and FHR events. WSHR events are characterized by deeper WCD and lower LCL than FHR events.
WSHR events occur in environments with weakly synoptic forcing. The preconvective environment of WSHR events is characterized by moister mid-level troposphere, deeper warm cloud layer, lower LCL, and stronger warm advection environment than FHR events. These differences are likely enhanced warm rain processes in WSHR events, potentially providing more cloud droplets for raindrops to collect. Stronger southerly winds and the warm advection in the low-level troposphere for WSHR events can transport more incoming water vapor and deepen the thickness of the warm cloud layer to develop heavy rain. In contrast, FHR events are primarily forced by synoptic-scale frontal lifting, leading to widespread convective systems around the frontal area. FHR events tend to occur with greater low-level moisture, stronger instability, stronger 0–6 km wind shear, and stronger wind in the upper troposphere. The coexistence of warm, humid air in the lower layer and dry air in the mid-troposphere enhances the equivalent potential temperature gradient, thereby increasing convective instability (Ninomiya and Shibagaki, 2007). The synoptic lifting provided by the fronts acts as the triggering mechanism that efficiently releases this instability. Moderate to severe vertical wind shear is conducive to the formation of tilted structures in convective systems and promotes the concentration of water vapor carried by updrafts in the middle and lower troposphere, which contributes to the maintenance of convective organization.
To improve the QPF skill for WHSR and FHR events, significant efforts need to be made according to different key environmental parameters. Luo and Chen (2015) suggested that prediction could be significantly improved when the initial fields of moisture, wind, and temperature were changed together for an extreme rainfall event in East China. Convection-permitting ensemble forecasts of a double-rainbelt event in South China revealed that the FHR event is sensitive to the synoptic forcing, and its sensitive area mainly locates near the frontal system, while the coastal boundary layer jet and water vapor from the South China Sea govern WSHR processes. The choice of microphysical scheme is critical for the convective initiation for the WSHR event (Yang et al., 2023). Based on previous studies and the results of this study, future numerical prediction for WSHR requires improving the prediction skill of WCD, LCL, Td500, and the wind at low-level troposphere by choosing more appropriate microphysics schemes (Zhang and Meng, 2019; Zhang et al., 2022b; Xiao et al., 2025). The simulation capabilities of different microphysics schemes for the heavy rainfall event can be evaluated and improved by using polarimetric radar, soundings, and surface observation data. For FHR events with strong synoptic forcing, data assimilation of wind and moisture needs to be improved to reduce initial errors and further decrease forecast errors. The influence of initial conditions of wind and moisture on the development of FHR events can be further discussed in the future.
In summary, this study analyzes the temporal characteristics and the preconvective environments of WSHR and FHR events over South China. These results enhance our understanding of the different skillful parameters for WSHR and FHR events. However, an in-depth discussion of the initiation and formation mechanisms of heavy rainfall, particularly WSHR, has not been conducted. Future studies should focus on the relationships between the statistical characteristics and the initiation mechanisms of the two types of events to better understand the intrinsic patterns of different types of heavy rainfall. Additionally, employing numerical simulations to assess the relative importance of different parameters should be considered in future studies to improve the numerical prediction of heavy rainfall in South China.
Data availability statement
The original contributions presented in the study are included in the article/supplementary material, further inquiries can be directed to the corresponding author.
Author contributions
YW: Validation, Writing – review and editing, Investigation, Formal Analysis, Software, Methodology, Data curation, Visualization, Resources, Conceptualization, Writing – original draft, Project administration, Funding acquisition. DyW: Visualization, Software, Writing – review and editing, Supervision, Resources. DhW: Funding acquisition, Resources, Validation, Supervision, Writing – review and editing, Software.
Funding
The author(s) declare that financial support was received for the research and/or publication of this article. This work was supported by the Science and Technology Development Fund of Macao Special Administrative Region (Grant No. 0009/2024/RIB1).
Conflict of interest
The authors declare that the research was conducted in the absence of any commercial or financial relationships that could be construed as a potential conflict of interest.
Generative AI statement
The author(s) declare that no Generative AI was used in the creation of this manuscript.
Any alternative text (alt text) provided alongside figures in this article has been generated by Frontiers with the support of artificial intelligence and reasonable efforts have been made to ensure accuracy, including review by the authors wherever possible. If you identify any issues, please contact us.
Publisher’s note
All claims expressed in this article are solely those of the authors and do not necessarily represent those of their affiliated organizations, or those of the publisher, the editors and the reviewers. Any product that may be evaluated in this article, or claim that may be made by its manufacturer, is not guaranteed or endorsed by the publisher.
References
Bai, L., Meng, Z., Huang, Y., Zhang, Y., Niu, S., and Su, T. (2019). Convection initiation resulting from the interaction between a quasi-stationary dryline and intersecting gust fronts: a case study. JGR Atmos. 124, 2379–2396. doi:10.1029/2018JD029832
Bai, L., Chen, G., Huang, Y., and Meng, Z. (2021). Convection initiation at a coastal rainfall hotspot in South China: synoptic patterns and orographic effects. J. Geophys. Res. Atmos. 126, e2021JD034642. doi:10.1029/2021JD034642
Brooks, H. E., Doswell, C. A., and Cooper, J. (1994). On the environments of tornadic and nontornadic mesocyclones. Boston, MA: American Meteorological Society. 9 (4), 606–618. doi:10.1175/1520-0434(1994)009<0606:oteota>2.0.co;2
Brooks, H. E., Lee, J. W., and Craven, J. P. (2003). The spatial distribution of severe thunderstorm and tornado environments from global reanalysis data. Atmos. Res. 67 (68), 73–94. doi:10.1016/S0169-8095(03)00045-0
Chen, T., and Zhang, D.-L. (2021). A 7-year climatology of warm-sector heavy rainfall over South China during the pre-summer months. Atmosphere 12, 914. doi:10.3390/atmos12070914
Chen, G. T.-J., Wang, C.-C., and Wang, A.-H. (2007). A case study of subtropical frontogenesis during a Blocking event. Mon. Weather Rev. 135, 2588–2609. doi:10.1175/MWR3412.1
Chen, X., Zhang, F., and Zhao, K. (2016). Diurnal variations of the land–sea breeze and its related precipitation over South China. J. Atmos. Sci. 73, 4793–4815. doi:10.1175/JAS-D-16-0106.1
Chen, G., Lan, R., Zeng, W., Pan, H., and Li, W. (2018). Diurnal variations of rainfall in surface and satellite observations at the monsoon coast (South China). J. Clim. 31, 1703–1724. doi:10.1175/JCLI-D-17-0373.1
Chen, G., Du, Y., and Wen, Z. (2021). Seasonal, interannual, and interdecadal variations of the East Asian summer monsoon: a diurnal-cycle perspective. J. Clim. 34, 4403–4421. doi:10.1175/JCLI-D-20-0882.1
Chen, H., Wang, Y., Wei, Y., Zhang, N., Lin, X., Yang, Y., et al. (2023). Analysis of the triggering and maintenance mechanisms of a Record-breaking warm-sector extreme-rainfall process in front of an upper-level trough in tianjin, China. Atmosphere 14, 808. doi:10.3390/atmos14050808
Craven, J. P., Jewell, R. E., and Brooks, H. E. (2002). Comparison between observed convective cloud-base heights and lifting condensation level for two different lifted parcels. Wea. Forecast. 17, 885–890. doi:10.1175/1520-0434(2002)017<0885:cboccb>2.0.co;2
Davis, R. S. (2001). “Flash flood forecast and detection methods,” in Severe convective storms. Editor C. A. Doswell (Boston, MA: American Meteorological Society), 481–525. doi:10.1007/978-1-935704-06-5_12
Dong, W., Lin, Y., Wright, J. S., Xie, Y., Yin, X., and Guo, J. (2019). Precipitable water and CAPE dependence of rainfall intensities in China. Clim. Dyn. 52, 3357–3368. doi:10.1007/s00382-018-4327-8
Doswell, C. A., Brooks, H. E., and Maddox, R. A. (1996). Flash flood forecasting: an ingredients-based methodology. Wea. Forecast. 11, 560–581. doi:10.1175/1520-0434(1996)011<0560:FFFAIB>2.0.CO;2
Du, Y., and Chen, G. (2018). Heavy rainfall associated with double low-level jets over southern China. Part I: ensemble-based analysis. Mon. Weather Rev. 146, 3827–3844. doi:10.1175/MWR-D-18-0101.1
Du, Y., and Chen, G. (2019a). Climatology of low-level jets and their impact on rainfall over southern China during the early-summer rainy season. J. Clim. 32, 8813–8833. doi:10.1175/JCLI-D-19-0306.1
Du, Y., and Chen, G. (2019b). Heavy rainfall associated with double low-level jets over southern China. Part II: convection initiation. Mon. Weather Rev. 147, 543–565. doi:10.1175/MWR-D-18-0102.1
Du, Y., Chen, G., Han, B., Bai, L., and Li, M. (2020). Convection initiation and growth at the coast of South China. Part II: effects of the terrain, Coastline, and cold pools. Mon. Weather Rev. 148, 3871–3892. doi:10.1175/MWR-D-20-0090.1
Dyson, L. L., Van Heerden, J., and Sumner, P. D. (2015). A baseline climatology of sounding-derived parameters associated with heavy rainfall over Gauteng, South Africa. Intl J. Climatol. 35, 114–127. doi:10.1002/joc.3967
Fu, Y., Sun, J., Fu, S., and Zhang, Y. (2023). Comparison between warm-sector and frontal heavy rainfall events in South China and the objective classification of warm-sector heavy rainfall events. Meteorol. Atmos. Phys. 135, 11. doi:10.1007/s00703-022-00949-8
Gao, X., Luo, Y., Lin, Y., and Bao, X. (2022). A source of WRF simulation error for the early-summer warm-sector heavy rainfall over SouthSouth China coast: land-sea thermal contrast in the boundary layer. JGR Atmos. 127, e2021JD035179. doi:10.1029/2021JD035179
Gu, X., Zhang, Q., Singh, V. P., Liu, L., and Shi, P. (2017). Spatiotemporal patterns of annual and seasonal precipitation extreme distributions across China and potential impact of tropical cyclones. Intl J. Climatol. 37, 3949–3962. doi:10.1002/joc.4969
Guan, P., Chen, G., Zeng, W., and Liu, Q. (2020). Corridors of mei-yu-season rainfall over eastern China. J. Clim. 33, 2603–2626. doi:10.1175/JCLI-D-19-0649.1
Guo, J., Miao, Y., Zhang, Y., Liu, H., Li, Z., Zhang, W., et al. (2016). The climatology of planetary boundary layer height in China derived fromradiosonde and reanalysis data. Atmos. Chem. Phys. 16, 13309–13319. doi:10.5194/acp-16-13309-2016
Han, B., Du, Y., Wu, C., and Liu, X. (2021). Microphysical characteristics of the coexisting frontal and warm-sector heavy rainfall in South China. JGR Atmos. 126, e2021JD035446. doi:10.1029/2021JD035446
Harnack, R. P., Jensen, D. T., and Cermak Iii, J. R. (1998). Investigation of upper-air conditions occurring with heavy summer rain in Utah. Int. J. Climatol. 18, 701–723. doi:10.1002/(SICI)1097-0088(19980615)18:7<701::AID-JOC265>3.0.CO;2-S
He, L., Long, L., Chen, B., Wang, Y., Geng, F., and Yan, X. (2021). A case study on the triggering mechanisms of localized warm-sector rainstorm. Meteorol. Atmos. Phys. 133, 1707–1717. doi:10.1007/s00703-021-00836-8
Henry, N. L. (2000). A static stability index for low-topped convection. Weather Forecast. 15, 246–254. doi:10.1175/1520-0434(2000)015<0246:ASSIFL>2.0.CO;2
Hersbach, H., Bell, B., Berrisford, P., Hirahara, S., Horányi, A., Muñoz-Sabater, J., et al. (2020). The ERA5 global reanalysis. Quart. J. R. Meteoro Soc. 146, 1999–2049. doi:10.1002/qj.3803
Houze, R. A. (2004). Mesoscale convective systems. Rev. Geophys. 42, 2004RG000150. doi:10.1029/2004RG000150
Huang, L., and Luo, Y. (2017). Evaluation of quantitative precipitation forecasts by TIGGE ensembles for south China during the presummer rainy season. JGR Atmos. 122, 8494–8516. doi:10.1002/2017JD026512
Huang, S., Li, Z., and Bao, L. (1986). Rainstorms during pre-rainy season in South China. Guangzhou: Guangdong Science and Technology Press.
Huang, L., Luo, Y., and Zhang, D. (2018). The relationship between anomalous presummer extreme rainfall over SouthSouth China and synoptic disturbances. JGR Atmos. 123, 3395–3413. doi:10.1002/2017JD028106
Jiang, X., Wang, D., Xu, J., Zhang, Y., and Chiu, L. S. (2017). Characteristics of observed tropopause height derived from L-band sounder over the Tibetan Plateau and surrounding areas. Asia-Pacific J. Atmos. Sci. 53, 1–10. doi:10.1007/s13143-016-0035-7
Lee, M.-H., Ho, C.-H., and Kim, J.-H. (2010). Influence of tropical cyclone landfalls on spatiotemporal variations in typhoon season rainfall over South China. Adv. Atmos. Sci. 27, 443–454. doi:10.1007/s00376-009-9106-3
Lepore, C., Veneziano, D., and Molini, A. (2015). Temperature and CAPE dependence of rainfall extremes in the eastern United States. Geophys. Res. Lett. 42, 74–83. doi:10.1002/2014GL062247
Li, X., and Du, Y. (2021). Statistical relationships between two types of heavy rainfall and low-level jets in South China. J. Clim. 34, 8549–8566. doi:10.1175/JCLI-D-21-0121.1
Li, S., Meng, Z., and Wu, N. (2021). A preliminary study on the organizational modes of mesoscale convective systems associated with warm-sector heavy rainfall in South China. JGR Atmos. 126, e2021JD034587. doi:10.1029/2021JD034587
Liang, Z., Fovell, R. G., and Liu, Y. (2019). Observational analysis of the characteristics of the synoptic situation and evolution of the organized warm-sector rainfall in the coastal region of South China in the pre-summer rainy season. Atmosphere 10, 722. doi:10.3390/atmos10110722
Liu, X., Luo, Y., Guan, Z., and Zhang, D. (2018). An extreme rainfall event in coastal southSouth China during SCMREX-2014: formation and roles of Rainband and Echo Trainings. JGR Atmos. 123, 9256–9278. doi:10.1029/2018JD028418
Liu, R., Sun, J., and Chen, B. (2019). Selection and classification of warm-sector heavy rainfall events over South China. Chin. J. Atmos. Sci. (in Chinese) 43, 119–130. doi:10.3878/j.issn.1006-9895.1803.17245
Liu, X., Luo, Y., Huang, L., Zhang, D., and Guan, Z. (2020). Roles of double low-level jets in the generation of coexisting inland and coastal heavy rainfall over SouthSouth China during the presummer rainy season. JGR Atmospheres 125, e2020JD032890. doi:10.1029/2020jd032890
Lu, X., Yu, H., Ying, M., Zhao, B., Zhang, S., Lin, L., et al. (2021). Western North pacific tropical cyclone database created by the China meteorological administration. Adv. Atmos. Sci. 38, 690–699. doi:10.1007/s00376-020-0211-7
Luo, Y., and Chen, Y. (2015). Investigation of the predictability and physical mechanisms of an extreme-rainfall-producing mesoscale convective system along the Meiyu front in East China: an ensemble approach: predictability and mechanisms of an mcs. J. Geophys. Res. Atmos. 120 (10), 10,593–10,618. doi:10.1002/2015JD023584
Luo, Y., Gong, Y., and Zhang, D.-L. (2014). Initiation and organizational modes of an extreme-rain-producing mesoscale convective system along a Mei-yu front in East China. Monthly Weather Review 142, 203–221. doi:10.1175/MWR-D-13-00111.1
Luo, Y., Zhang, R., Wan, Q., Wang, B., Wong, W. K., Hu, Z., et al. (2017). The southern China monsoon rainfall experiment (SCMREX). Bulletin of the American Meteorological Society 98, 999–1013. doi:10.1175/BAMS-D-15-00235.1
Luo, Y., Xia, R., and Chan, J. C. L. (2020). Characteristics, physical mechanisms, and prediction of pre-summer rainfall over South China: research progress during 2008–2019. Journal of the Meteorological Society of Japan 98, 19–42. doi:10.2151/jmsj.2020-002
Market, P., Allen, S., Scofield, R., Kuligowski, R., and Gruber, A. (2003). Precipitation efficiency of warm-season midwestern mesoscale convective systems. Wea. Forecasting 18, 1273–1285. doi:10.1175/1520-0434(2003)018<1273:PEOWMM>2.0.CO;2
Miao, Y., Liu, S., Guo, J., Huang, S., Yan, Y., and Lou, M. (2018). Unraveling the relationships between boundary layer height and PM2.5 pollution in China based on four-year radiosonde measurements. Environmental Pollution 243, 1186–1195. doi:10.1016/j.envpol.2018.09.070
Miller, R. (1972). Notes on analysis and severe storm forecasting procedures of the air force global weather centre. Air Weather Service, United State Air Force.
Ninomiya, K., and Shibagaki, Y. (2007). Multi-scale features of the meiyu-baiu front and associated precipitation systems. J. Meteorol. Soc. Jpn. Ser. 2 (85B), 103–122. doi:10.2151/jmsj.85B.103
Omotosho, J. B., Balogun, A. A., and Ogunjobi, K. (2000). Predicting monthly and seasonal rainfall, onset and cessation of the rainy season in West Africa using only surface data. Int. J. Climatol. 20, 865–880. doi:10.1002/1097-0088(20000630)20:8<865::AID-JOC505>3.0.CO;2-R
Pilorz, W., Laskowski, I., Łupikasza, E., and Taszarek, M. (2016). Wind shear and the strength of severe convective phenomena—Preliminary results from Poland in 2011–2015. Climate 4, 51. doi:10.3390/cli4040051
Potvin, C. K., Elmore, K. L., and Weiss, S. J. (2010). Assessing the Impacts of proximity sounding criteria on the climatology of significant tornado environments. Weather and Forecasting 25, 921–930. doi:10.1175/2010WAF2222368.1
Pu, Y., Hu, S., Luo, Y., Liu, X., Hu, L., Ye, L., et al. (2022). Multiscale perspectives on an extreme warm-sector rainfall event over coastal southSouth China. Remote Sensing 14, 3110. doi:10.3390/rs14133110
Schultz, D. M., Schumacher, P. N., and Doswell, C. A. (2000). The intricacies of instabilities. Mon. Wea. Rev. 128, 4143–4148. doi:10.1175/1520-0493(2000)129<4143:TIOI>2.0.CO;2
Showalter, A. K. (1953). A stability index for thunderstorm forecasting. Bulletin of the American Meteorological Society 34, 250–252. doi:10.1175/1520-0477-34.6.250
Su, L., Sun, X., Du, Y., Fung, J. C. H., and Chen, G. (2023). The roles of local convergences in the convection initiation of a record-breaking rainfall event at the coastal pearl river delta in SouthSouth China. JGR Atmospheres 128, e2022JD037234. doi:10.1029/2022JD037234
Thomas, C. M., and Schultz, D. M. (2019). Global climatologies of fronts, airmass boundaries, and airstream boundaries: why the definition of “front” matters. Monthly Weather Review 147, 691–717. doi:10.1175/MWR-D-18-0289.1
Wang, H., Luo, Y., and Jou, B. J. (2014). Initiation, maintenance, and properties of convection in an extreme rainfall event during SCMREX: observational analysis. JGR Atmospheres 119. doi:10.1002/2014JD022339
Wang, X., Zhou, R., Deng, Y., Cui, C., Hu, Y., Wang, J., et al. (2022). Symbiotic relationship between mei-yu rainfall and the Morphology of Mei-yu front. Journal of Hydrometeorology 23, 87–100. doi:10.1175/JHM-D-21-0068.1
Wang, H., Xue, M., Wu, N., He, J., Ding, W., and Deng, H. (2025). Microphysical characteristics of frontal and warm sector heavy rainfall over SouthSouth China during the pre-summer rainy season. JGR Atmospheres 130, e2024JD043209. doi:10.1029/2024JD043209
Weisman, M. L., and Klemp, J. B. (1982). The dependence of numerically simulated convective storms on vertical wind shear and buoyancy. Boston, MA: American Meteorological Society. 110 (2), 504–520. doi:10.1175/1520-0493(1982)110<0504:tdonsc>2.0.co;2
Welch, B. L. (1947). The generalization of `Student’s’ problem when several different population variances are involved. Biometrika 34, 28–35. doi:10.2307/2332510
Wu, M., and Luo, Y. (2016). Mesoscale observational analysis of lifting mechanism of a warm-sector convective system producing the maximal daily precipitation in China mainland during pre-summer rainy season of 2015. Journal of Meteorological Research 30, 719–736. doi:10.1007/s13351-016-6089-8
Wu, N., Ding, X., Wen, Z., Chen, G., Meng, Z., Lin, L., et al. (2020a). Contrasting frontal and warm-sector heavy rainfalls over South China during the early-summer rainy season. Atmospheric Research 235, 104693. doi:10.1016/j.atmosres.2019.104693
Wu, N., Wen, Z., Deng, W., Lin, L., and Chen, G. (2020b). Advances in warm-sector heavy rainfall during the first rainy season in South China. Journal of the Meteorological Sciences (in Chineses) 40, 605–616. doi:10.3969/2020jms.0077
Xiao, H., Hu, S., Liu, X., Li, H., He, S., and Feng, L. (2025). Improvement of microphysics schemes for a warm-sector heavy precipitation over South China. Atmospheric Research 315, 107905. doi:10.1016/j.atmosres.2024.107905
Yang, Y., Yuan, H., and Chen, W. (2023). Convection-permitting ensemble forecasts of a double-rainbelt event in South China during the pre-summer rainy season. Atmospheric Research 284, 106599. doi:10.1016/j.atmosres.2022.106599
Yihui, D., and Chan, J. C. L. (2005). The East Asian summer monsoon: an overview. Meteorol. Atmos. Phys. 89, 117–142. doi:10.1007/s00703-005-0125-z
Ying, M., Zhang, W., Yu, H., Lu, X., Feng, J., Fan, Y., et al. (2014). An overview of the China meteorological administration tropical cyclone database. Journal of Atmospheric and Oceanic Technology 31, 287–301. doi:10.1175/JTECH-D-12-00119.1
Zeng, Z., and Wang, D. (2022). Observations of heavy short-term rainfall hotspots associated with warm-sector episodes over coastal South China. Atmospheric Research 276, 106273. doi:10.1016/j.atmosres.2022.106273
Zeng, Z., Huang, L., Schultz, D. M., Garcia-Carreras, L., and Wang, D. (2023). Comparing synoptic conditions and environmental characteristics for fronts with and without prefrontal convection initiation and heavy rain over coastal southSouth China. Monthly Weather Review 151, 3235–3254. doi:10.1175/MWR-D-23-0054.1
Zhang, M., and Meng, Z. (2019). Warm-sector heavy rainfall in southern China and its wrf simulation evaluation: a low-level-jet perspective. Monthly Weather Review 147, 4461–4480. doi:10.1175/MWR-D-19-0110.1
Zhang, L., Ma, X., Zhu, S., Guo, Z., Zhi, X., and Chen, C. (2022a). Analyses and applications of the precursor signals of a kind of warm sector heavy rainfall over the coast of Guangdong, China. Atmospheric Research 280, 106425. doi:10.1016/j.atmosres.2022.106425
Zhang, L., Song, L., Zhu, S., Guo, Z., Wang, H., Zhou, L., et al. (2022b). Forecasts of the warm-sector heavy rainfall with a warm shear pattern over coastal areas of the yangtze–huaihe river in a regional business forecast model. Front. Earth Sci. 10, 938336. doi:10.3389/feart.2022.938336
Zhang, M., Rasmussen, K. L., Meng, Z., and Huang, Y. (2022). Impacts of coastal terrain on warm-sector heavy-rain-producing MCSs in southern China. Monthly Weather Review 150, 603–624. doi:10.1175/MWR-D-21-0190.1
Zhang, Q., Luo, Y., Tang, Y., Xu, X., Yu, S., and Wu, C. (2022). Cause-effect relationship between meso-γ-scale rotation and extreme short-term precipitation: observational analyses at Minute and sub-kilometer scales. J. Meteorol. Res. 36, 539–552. doi:10.1007/s13351-022-2028-z
Zhang, S., Liang, Z., Wang, D., and Chen, G. (2022). Nocturnal convection initiation over inland South China during a record-breaking heavy rainfall event. Monthly Weather Review 150, 2935–2957. doi:10.1175/MWR-D-21-0264.1
Zhao, S., Bei, N., and Sun, J. (2007). Mesoscale analysis of a heavy rainfall event over Hong Kong during a pre-rainy season in South China. Adv. Atmos. Sci. 24, 555–572. doi:10.1007/s00376-007-0555-2
Keywords: warm-sector heavy rainfall, frontal heavy rainfall, sounding, preconvective environmental conditions, South China
Citation: Wan Y, Wang D and Wang D (2025) Comparison of preconvective environments between warm-sector and frontal heavy rainfall events in South China. Front. Earth Sci. 13:1598866. doi: 10.3389/feart.2025.1598866
Received: 24 March 2025; Accepted: 04 September 2025;
Published: 23 September 2025.
Edited by:
Yi-Leng Chen, University of Hawaii at Manoa, United StatesReviewed by:
Mingxin Li, Chinese Academy of Meteorological Sciences, ChinaKao-Shen Chung, National Central University, Taiwan
Copyright © 2025 Wan, Wang and Wang. This is an open-access article distributed under the terms of the Creative Commons Attribution License (CC BY). The use, distribution or reproduction in other forums is permitted, provided the original author(s) and the copyright owner(s) are credited and that the original publication in this journal is cited, in accordance with accepted academic practice. No use, distribution or reproduction is permitted which does not comply with these terms.
*Correspondence: Donghai Wang, d2FuZ2RoN0BtYWlsLnN5c3UuZWR1LmNu