 Ran Kong
- School of Jewelry and Geology, Lanzhou Resource & Environment Voc-Tech University, Lanzhou, China
Improving the performance of loess significantly protects it against failure and degradation, and is important for rammed earth and infrastructure constructed with loess materials. The physical and mechanical properties of nano-SiO2-treated loess were tested with different contents and curing days—including unconfined compressive strength (UCS) and splitting tensile strength (STS)—and their corresponding water content, density, and void ratio. I paid close attention to the homogeneity during sample preparation—that is, sample quality—based on the UCS test. I then analyzed their relation to physical and mechanical properties to gain a better understanding. The results show that the UCS test is a valuable method for examining the quality of sample preparation. UCS, STS, and density increased, and the water content and void ratio decreased with increasing content and curing days due to nano-SiO2 addition. The improvement of mechanical strength is related to the ratio of water content to nano-SiO2 content and curing period rather than the physical properties and additive contents of treated loess. These findings reveal that nano-SiO2 can be an effective stabilizing agent for loess improvement, which has important implications for geohazard mitigation and engineering management in the Chinese loess area.
Highlights
• The physical and mechanical properties of nano-SiO2-treated loess are examined.
• The UCS and STS of treated loess are related with ratio of after-curing water content to Nano-SiO2 content.
• The homogeneity of the prepared samples is crucial for ensuring the quality of test results from nano-SiO2 treated loess.
• Nano-SiO2 has potential to serve as an effective stabilized agent to improve loess performance.
1 Introduction
Nano-SiO2 is known for its excellent properties, small particle size, large surface area, and high activity. It is thus widely used as a composite material in civil engineering. Recently, nano-SiO2 has also been used in soil improvement in geotechnical engineering due to its eco-friendly characteristics and stabilizing effects.
Previous research has shown that nanoparticles added to soils can enhance their strength, stiffness, and durability and can decrease their collapsibility, permeability, moisture, and liquefaction risk (Gallagher, 2000; Hung, 2007; Taha and Taha, 2012; Kim et al., 2014; Ng and Coo, 2014; Ren and Hu, 2014; Ali Zomorodian et al., 2017; Ghasabkolaei et al., 2017; Kong et al., 2018). These changes can generally be attributed to the structural modification of soils. Meanwhile, no changes in mineral composition have been observed in nanoparticle-treated clay (Taha and Taha, 2012; Kong et al., 2018). Previous research has mostly used different nano-clays and nano-metals as additives, and few attempted to use nano-SiO2 to improve soils. However, little effort has been made to determine the effect of nano-SiO2 on the physical and mechanical properties of treated loess (Ren and Hu, 2014; Kong et al., 2018). Meanwhile, these physical and mechanical properties have afforded a direct index to assess the improved performance of treated loess. However, their quantitative relationship has not been given enough attention.
In the research of soil improvement, the behaviors of treated soils commonly use laboratory-prepared samples. Hence, prepared samples with uniform density (i.e., homogeneity) are a fundamental problem in assessing test results and analyzing experimental data. Generally, there are two ways to solve the problem of soil mechanism research. One is to enhance homogeneity during sample preparation using new techniques and apparatuses, such as thermal cycling and apparatuses with three-point temperature control (Ma et al., 2015; Nadimi and Fonseca, 2016). Another is to examine the homogeneity of the prepared samples using different methods. This kind of research has gained more attention than sample preparation. Researchers generally used image techniques, including scanning electron microscopy (SEM), X-rays, computed tomography (CT), and digital cameras, to observe the uniformity of samples (Kuo and Frost, 1996; Frost and Park, 2003; Wong, 2003; Yamamuro and Wood, 2004; Hattab et al., 2013). Some have used basic properties, such as water content and void ratio at different sample locations, to analyze sample quality (Frost and Yang, 2003; Ma et al., 2015). In addition, Metelková et al. (2012) used nitrogen adsorption to obtain micropore characteristics for examining sample homogeneity. These methods are influenced by sampling strategy and data, and most are expensive, labor-intensive, and time-consuming. Hence, triaxial shear tests have become another direct method; these examine multiple prepared samples to observe their strain–stress curves (Kuganenthira et al., 1996; Kuo and Frost, 1996; Frost and Park, 2003; Frost and Yang, 2003; Yamamuro and Wood, 2004; Fener and Yesiller, 2013; Ma et al., 2015; Nadimi and Fonseca, 2016; Ng et al., 2017). In soil improvement research, the usual method is to perform UCS tests three times for the average value of treated samples. Nevertheless, less attention has been paid to examining the prepared sample’s homogeneity with additives (Metelková et al., 2012).
This study examined the effect of nano-SiO2 on the physical and mechanical properties of loess treated at different contents and curing days. It examined the changes in the UCS and STS untreated and treated loesses, their corresponding water content, density, and void ratio, and the relationship between physical and mechanical properties. The homogeneity of the treated samples was examined using strain–stress curves in the UCS test. Finally, the relationship between the physical and mechanical properties of nano-SiO2 treated loess is analyzed and their changes discussed to understand the cause of improvement of nano-SiO2-treated loess.
2 Material and methods
2.1 Tested materials
The tested loess is widely deposited in the Malan formation in the Chinese loess plateau. The loess was taken from Lanzhou City, Gansu Province, China. The additive is a commercially available nano-SiO2. Their basic properties are listed in Table 1.
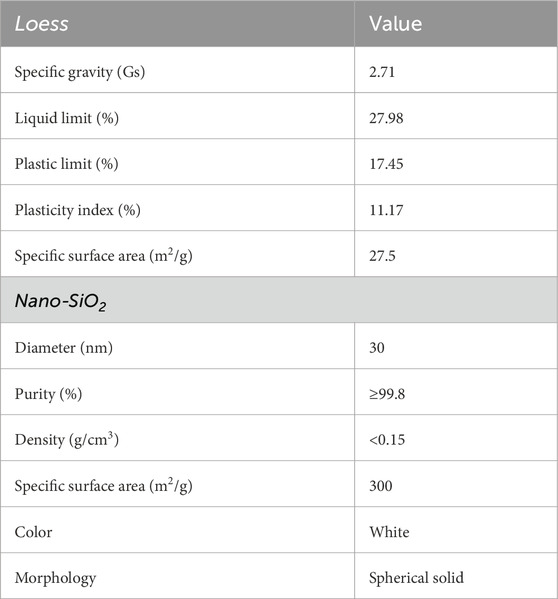
Table 1. Basic properties of loess and nano-SiO2 used in this study.
The particle size distribution and structures of the loess and nano-SiO2 are shown in Figures 1 and 2. It can be seen that nano-SiO2 exists as aggregate similar to loess. The mean particle size of the nano-SiO2 aggregate is approximately 20 μm. The particle size of nano-SiO2 seems unreasonable , but the result is reasonable due to the presence of nano-SiO2 aggregates rather than single particles (Figure 2b). Hence, it is necessary to analyze the results of nanoparticle size by a laser diffraction instrument.
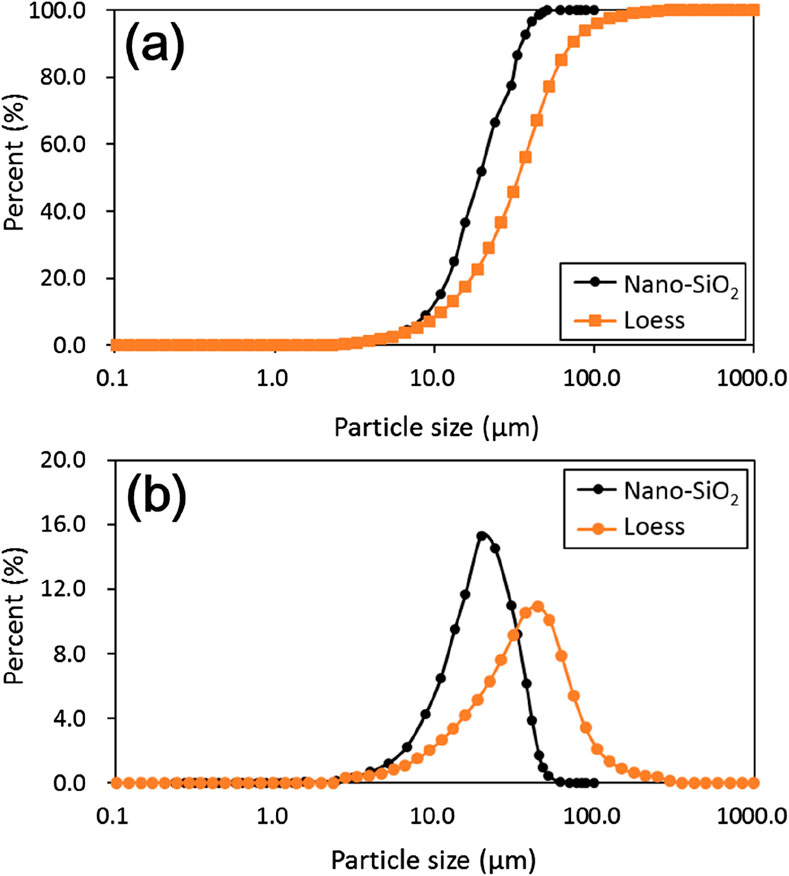
Figure 1. (a) Cumulative particle size distribution curves of nano-SiO2 and loess; (b) frequent particle size distribution curves of nano-SiO2 and loess.
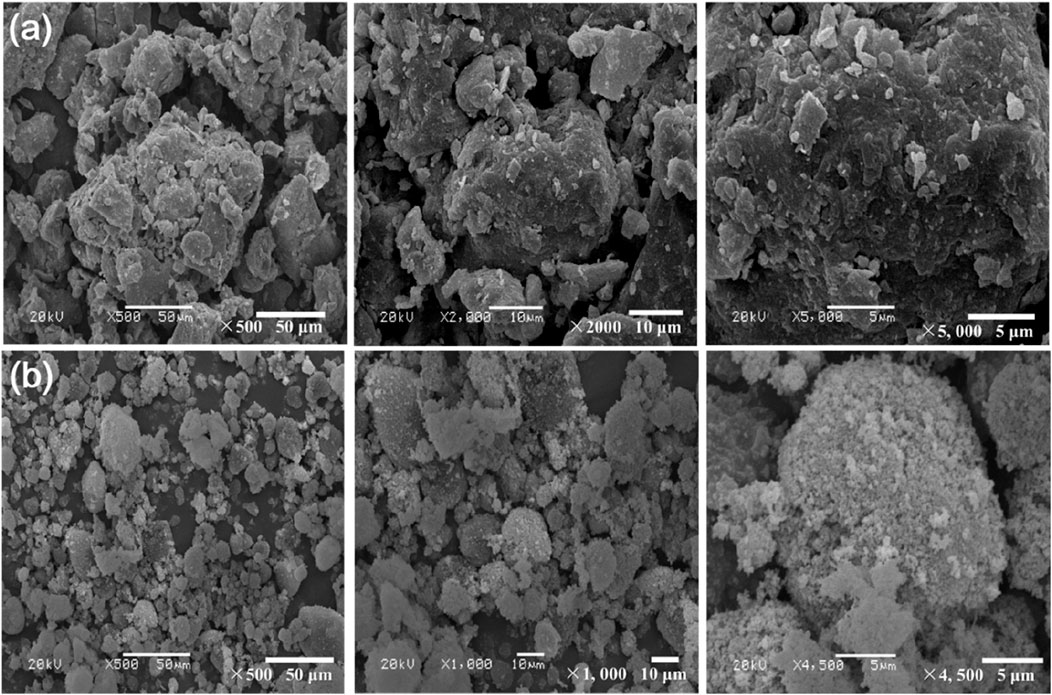
Figure 2. SEM images of loess and nano-SiO2 at different amplification factors. (a) Loess, and (b) nano-SiO2.
The X-ray diffractions for loess and nano-SiO2 are shown in Figure 3. The loess is mainly composed of quartz, feldspar, and calcite, including minor chlorite, dolomite, and illite (Figure 3a). The nano-SiO2 is purely quartz in composition (Figure 3b).
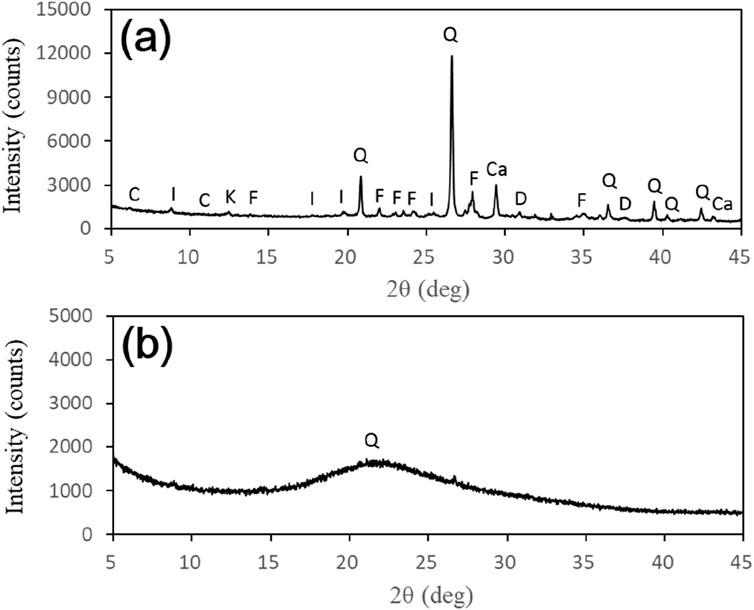
Figure 3. (a) X-ray diffraction of loess; (b) X-ray diffraction of nano-SiO2. (C, chlorite; Ca, calcite; D, dolomite; F, feldspar; I, illite; Kao, kaolinite; Q, quartz).
2.2 Tested methods
2.2.1 Sample preparation
The loess was first air-dried at room temperature and sifted using a 0.5-mm aperture sieve. The air-dried samples were further dried in an oven at 105°C. Distilled water was added to oven-dried loess to obtain a desired water content of 15%. Then, 0%, 0.2%, 0.4%, 0.8%, 1.0%, 1.5%, and 2.0% of nano-SiO2 dry weight was thoroughly mixed with the wet loess by hand. The added sequence of water and nano-SiO2 powder is crucial for uniform mixing. The mixture was kept moisture-uniform and sealed for 24 h in a plastic package. The samples were compacted in five layers inside a cylindrical steel holder with an internal diameter of 50 mm and a length of 100 mm. The sample reached a dry density of 1.47 g/cm3 with the help of a hydraulic jack. They were then sealed in a plastic film and cured at room temperature for 7 days, 14 days, 28 days, and 60 days.
2.2.2 Physical property
Water content and wet density were weighed after curing the prepared cylindrical samples at different nano-SiO2 contents and curing days. There was a negligible change in the volume of all the cylindrical samples during curing. Bulk wet density was calculated from the cylindrical volume and wet sample weight, and the change in water content was calculated by sample weight before and after curing. The void ratio was then calculated,
2.2.3 Unconfined compressive strength
Unconfined compressive strength (UCS) tests were performed using an automatic loading machine with a maximum loading capacity of 100 kN. The loading speed during all the tests was 0.1 mm/min. The UCS test was also used to check the homogeneity of sample preparation—that is, the sample quality. To this end, one group of all the specific samples were loaded in the same compaction direction during sample preparation. A second group of two specific samples were inversely loaded. In the series, one had the same loading direction with compaction direction during sample preparation, while the other was performed at opposite loading with its compaction direction. The average value of the specific samples was used in data analysis.
2.2.4 Splitting tensile strength
Splitting tensile strength (STS) is an indirect tensile strength test made by a mold (Figure 4B). The mold design was suggested by Tang and Graham (2000). The tensile mold consisted of two separate semi-circular steel supports with a lower inner diameter of 50 mm and an upper inner diameter of 40 mm. The gap offers a deformation space for the mold-holding sample. The STS test is similar to the UCS test with the same loading speed (i.e., 0.1 mm/min), but the mold-holding samples were horizontally placed on the loading plate.
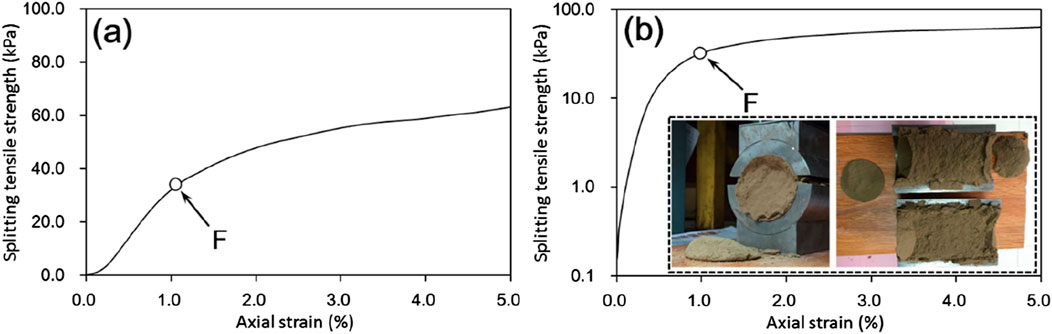
Figure 4. Typical curves of the splitting tensile test and its splitting tensile strength at failure. (a) Linear splitting tensile strength, and (b) Logarithmic splitting tensile strength with dimple fracture.
In the STS test of the soil samples, the loading force constantly increased with increasing strain (Figure 4). It significantly differed from the rock samples, and their loading force sharply decreased once the samples fractured. Based on observation and analysis, I propose a method for evaluating the STS value which is determined at point F in the stress–strain curve (Figure 4). The F point essentially occurs when the sample breaks with a typical dimple fracture in materials science (Figure 4B). In fact, the fractured surface already exists at F point. However, the loading force shows a continually slow increase due to compaction.
3 Results
3.1 Homogeneity of the sample
Figure 5 shows the stress–strain curves in special samples with the same loading direction as sample preparation. It can be seen that they have almost the same stress–strain curves and, correspondingly, almost identical strength. The sample preparation has a negligible effect on strength, although the change in strain with loading exists to a certain variance. It also meets the requirements of data analysis.

Figure 5. Unconfined compressive strength (UCS) curves in special samples with same loading direction with sample preparation. (a) Curing periods at 7 days with 1% nano-SiO2 content; (b) Curing periods at 14 days with 0.4% nano-SiO2 content; (c) Curing periods at 28 days with 0.2% nano-SiO2 content; (d) Curing periods at 60 days with 0.4% nano-SiO2 content.
Figure 6 shows the stress–strain curves of two nearly identical samples with inverse loading direction. The solid line (S1) represents the same loading direction as the sample preparation, and the dotted line (S2) represents the opposite loading direction. To all tested samples, the peak of S1 is always greater than that of S2, while the strain location at the peak of S1 occurs later than those at the peak of S2. After this, there is an apparent drop in the strain–stress curve of S2. This may be because the upper layer is slightly looser than the lower layer of the prepared samples. Moreover, the trend of the strain–stress curve is similar. After fracture, the strength of S1 declines uniformly, but the sample of S2 still came through densification. Therefore, the homogeneity of the samples is high, with only very slight anisotropy in the whole sample.
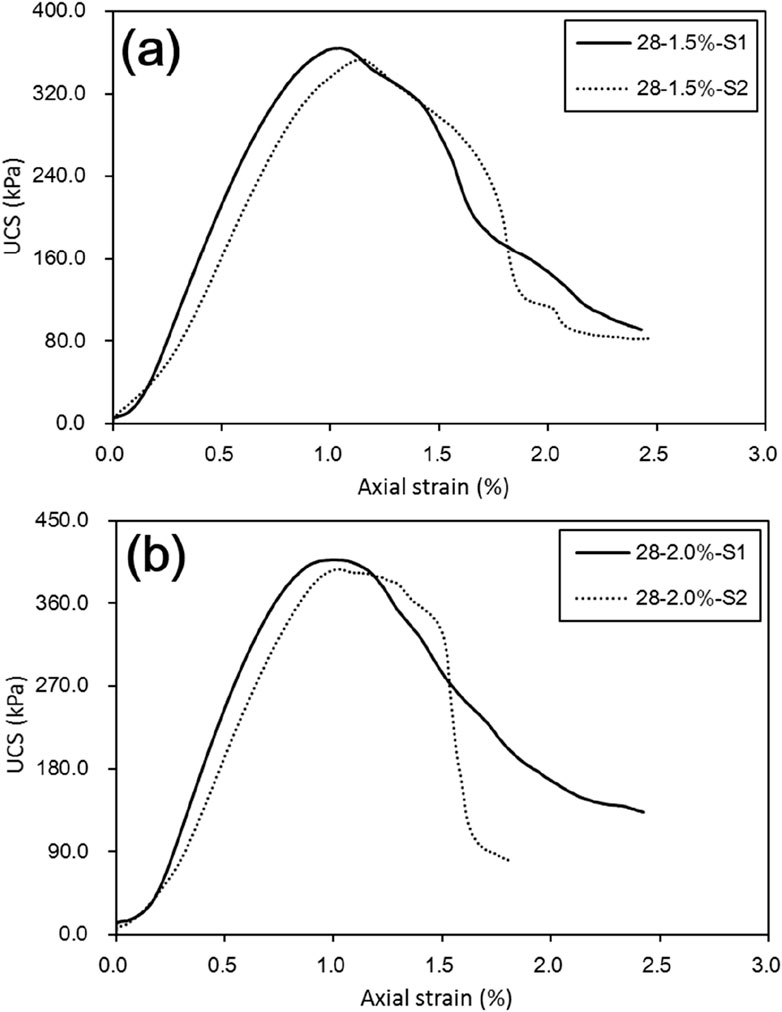
Figure 6. Unconfined compressive strength (UCS) curves of two nearly identical samples with inverse loading direction. (a) Curing periods at 28 days with 1.5% nano-SiO2 content; (b) Curing periods at 28 days with 2.0% nano-SiO2 content.
The tested results reveal that the compaction technique used in the research can produce high-quality samples. Meanwhile, the UCS test is not only a simple and low-cost method for examining the quality of the sample preparation but can also afford direct test results for data analysis. In addition, the special properties of nano-SiO2, such as intense activity and high free energy, facilitate particle dispersion, likely promoting the homogeneity of the sample. It is interesting to note the added sequence of water and nano-SiO2 during sample preparation. According to my experience, dry nano-SiO2 added into curing wet soil is a better choice to guarantee sample homogeneity. Otherwise, it will cause moisture accumulation, making it easy to produce large aggregates in the mixing process.
3.2 UCS
Figure 7 shows the effect of nano-SiO2 content and curing days on the UCS of untreated and treated loesses. It can be seen that the UCS of treated loess increases with the increasing nano-SiO2 content and curing days. Moreover, the effect of curing days on UCS is more striking than that of nano-SiO2 content. There is a striking increase in UCS when nano-SiO2 content is more than 0.2% (Figure 7c). The apparent increase in UCS is also observed after 28 days. The strength of nano-SiO2 content of 0.2% is approximately 325 kPa at 60 days, which is approximately three times higher than that of nano-SiO2 free loess.
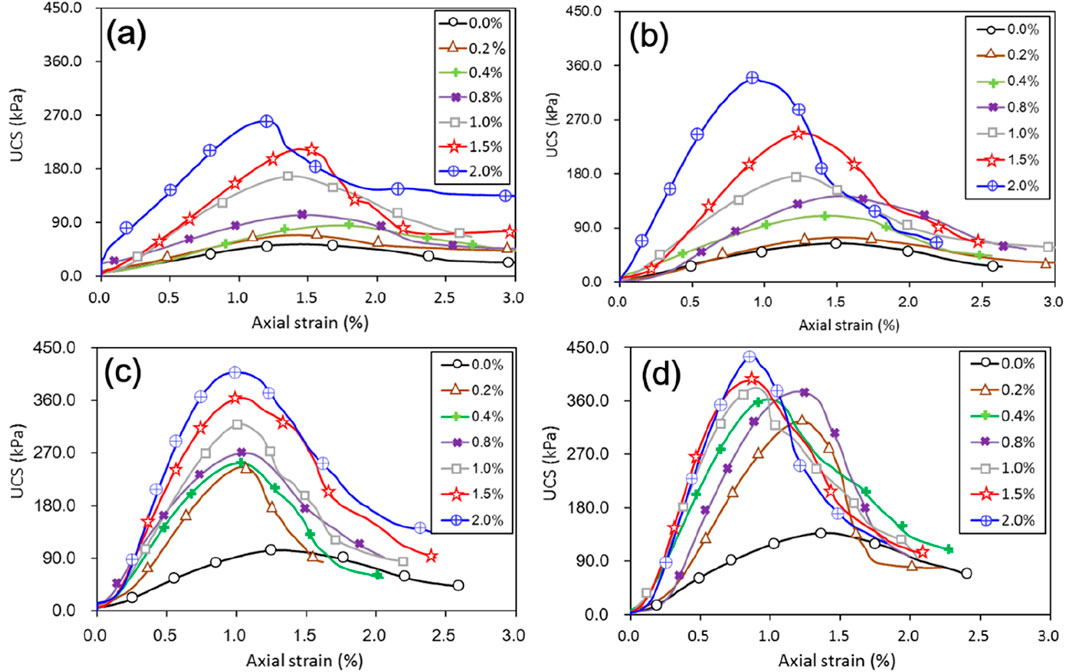
Figure 7. UCS curves of treated loess with different nano-SiO2 contents at curing periods of (a) 7 days, (b) 14 days, (c) 28 days, and (b) 60 days.
The test results reveal that curing days significantly improve the mechanical properties of nano-SiO2 treated loess. As shown in Figure 8, even at low nano-SiO2 content, UCS increases to different curing days. For short-term curing periods—7 and 14 days—the ductile behavior is integrally maintained compared with longer curing periods—28 days and 60 days. All of the treated samples became much more brittle than the untreated samples.
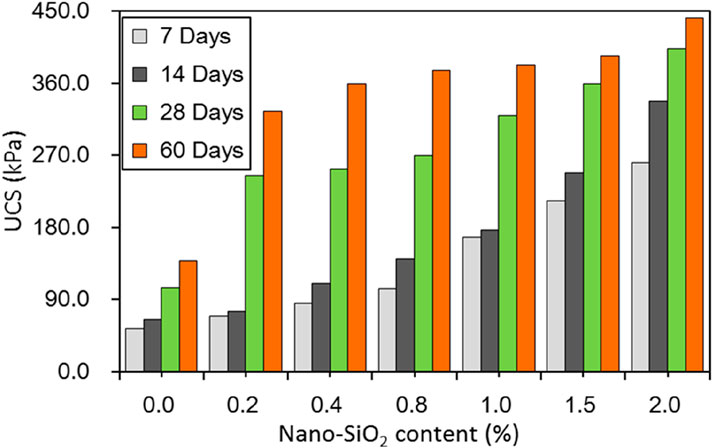
Figure 8. UCS values of treated loess at different nano-SiO2 contents and curing days.
3.3 STS
Figure 9 presents the stress–strain curves of the splitting tensile strength of treated loess with different contents of nano-SiO2 and curing days. The splitting tensile strength of the treated loess was generally higher than the untreated loess with the same curing days. At the same curing time, the splitting tensile strength of treated loess increases with the content of nano-SiO2. At the same additive content of nano-SiO2, the STS increases significantly with curing days, especially at 28 and 60 days. This is different in the USC of treated loess. The STS did not improve substantially under a longer curing period when the loess was treated with a low additive content nano-SiO2.
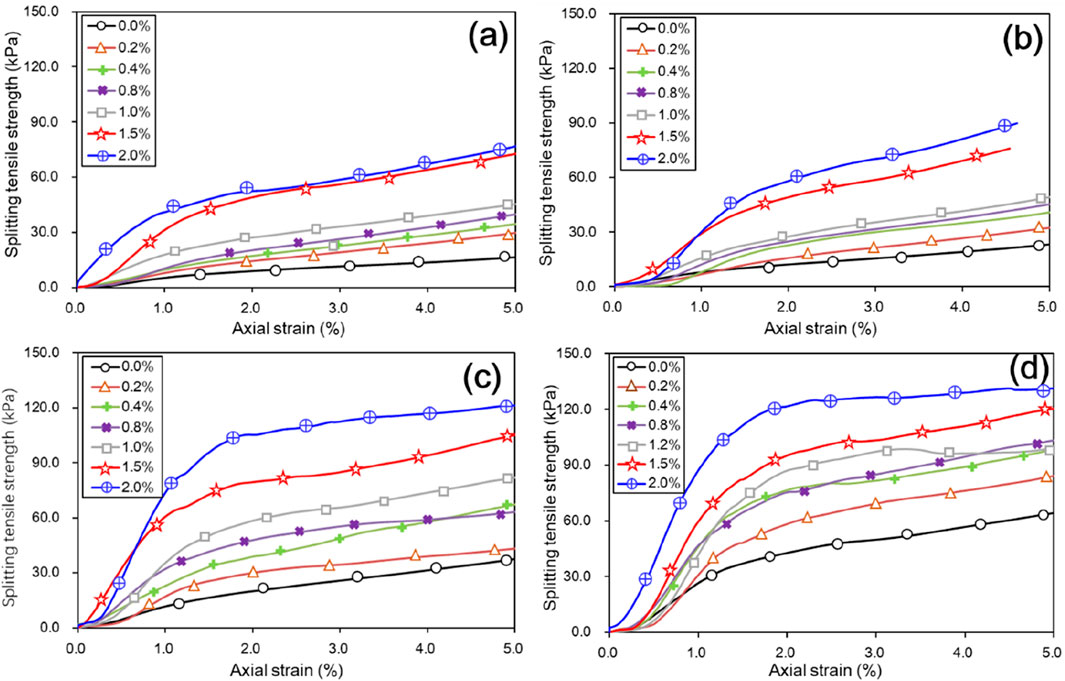
Figure 9. Splitting tensile strength (STS) curves of treated loess with different nano-SiO2 contents at curing periods of (a) 7 days, (b) 14 days, (c) 28 days, and (b) 60 days.
In the stress–strain curve of the splitting tensile test (Figure 9), the axial strain of both the untreated and the treated loess increases rapidly with the stress in the initial stage. After failure, the curve shows a slow upward trend with the axial strain, which is the compaction progress along the fracture surface. In the short curing period of 7 and 14 days, the failure points of the untreated and treated loess are primarily close to the position at 1% of strain. However, after the long curing period of 28 and 60 days, the failure point of the untreated and treated loesses is between 1% and 2%. After the failure point is exceeded, the compaction trend is weakened. Thus, the ability of untreated and treated loess to withstand splitting is enhanced with nano-SiO2, which is more obvious under a longer curing period.
Figure 10 summarizes the STS variation of all untreated and treated loesses under different nano-SiO2 content and curing days. The STS of treated loess increases with increasing curing periods at the same additive content of nano-SiO2, while the strength of all samples increases linearly with increased nano-SiO2 content. This differs from that of the UCS of treated loess, which shows a variation of nonlinear increase at the long curing periods of 28 and 60 days.
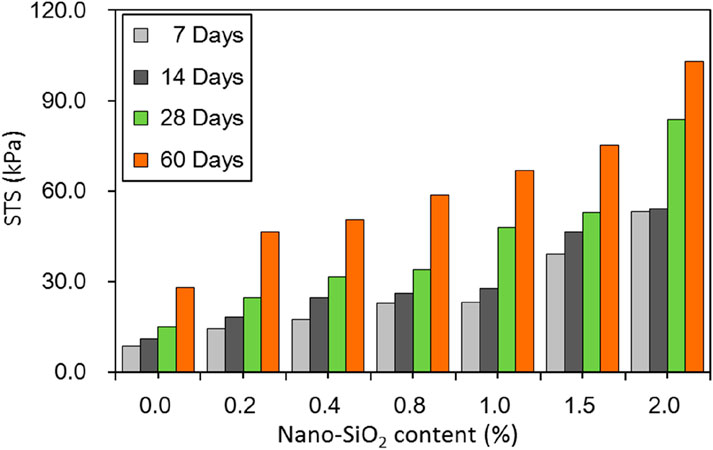
Figure 10. STS values of treated loess at different nano-SiO2 contents and curing days.
3.4 Physical properties
Figure 11 shows the physical properties of the untreated and treated loesses with nano-SiO2 content subjected to different curing periods, including the water content, wet density, and void ratio of all samples. All the samples have the same initial conditions: water content of 15.0%, wet density of 1.72 g/cm3, and void ratio of 0.81. After curing for 7 days, the water content and density of the treated loess reduced slightly. With the increase of nano-SiO2 content, the water content and density are slightly lower, but not obviously so. With curing periods of 14 days and 28 days, the water content and density of the treated loess show a progressive decrease. The water content reduces to 11.8% and 10.8%, and the density reduces to 1.66 g/cm3 and 1.64 g/cm3, respectively. However, the water content of treated loess decreased sharply to approximately 7.5% after a curing period of 60 days, while the density drops to 1.59 g/cm3. At the same time, the dry density results show that all samples maintained the dry density of 1.47 g/cm3 in the initially designed state. This result indicates that the decrease in density is mainly due to the decreased water content in treated loess. Hence, the void ratio of the treated loess increased slightly with the increase of the curing periods (Figure 11C). When the water content in the sample decreases, the suction between particles increases, resulting in closer contact with particles.
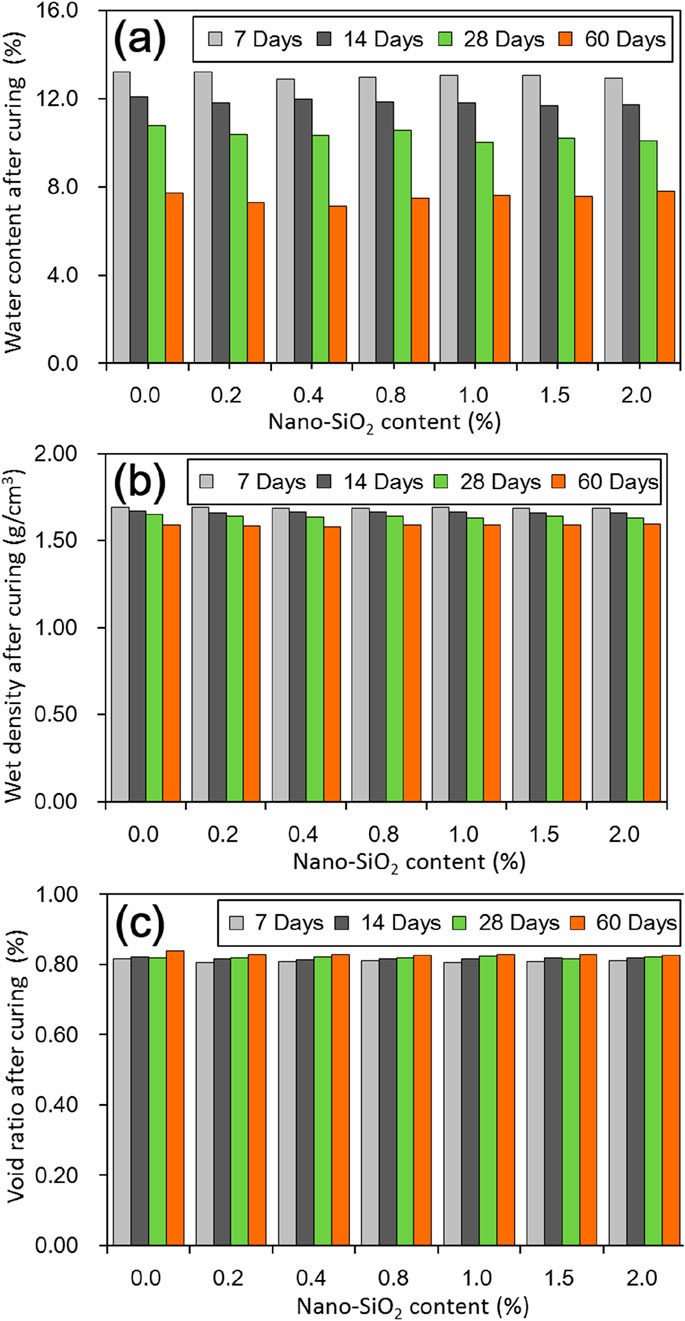
Figure 11. Physical properties of treated loess at different nano-SiO2 contents and curing days. (a) Water content after curing; (b) wet density after curing; (c) void ratio after curing.
As shown in Figure 12, under the same curing days, the nano-SiO2-treated loess has almost identical water content consumption and density reduction to the untreated loess. In addition, the dry density of treated loess did not change, including a slight decrease in void ratio. This means that the reduction of water content in treated loess is the same as in untreated loess.
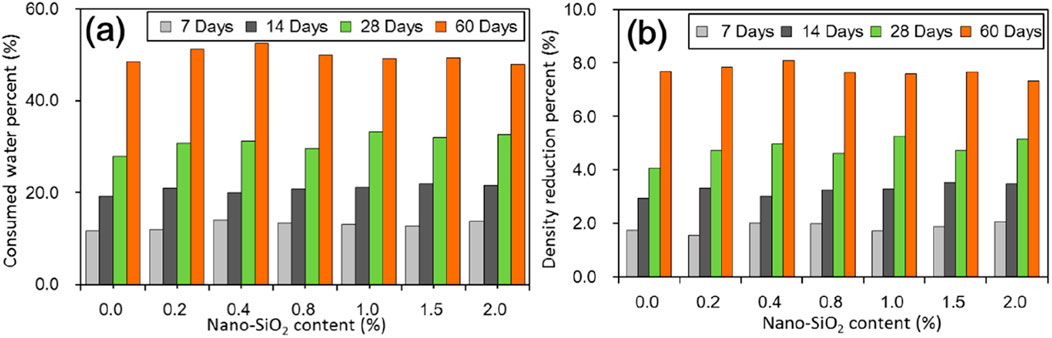
Figure 12. (a) Consumed water at different nano-SiO2 contents and curing days; (b) density reduction percent at different nano-SiO2 contents and curing days.
4 Analysis and discussion
4.1 The relationship of mechanical properties
Figure 13 shows the relationship between untreated loess and nano-SiO2-treated loess unconfined compressive strength (UCS) and split tensile strength (STS). From Figure 13, it is evident that UCS and STS show a relationship of exponential function and their correlation coefficient is close to 0.9. The exponential relation is because the UCS of treated loess presents a nonlinear relation under the long curing periods. In contrast, the STS of treated loess still presents a linear relationship under the high curing period.
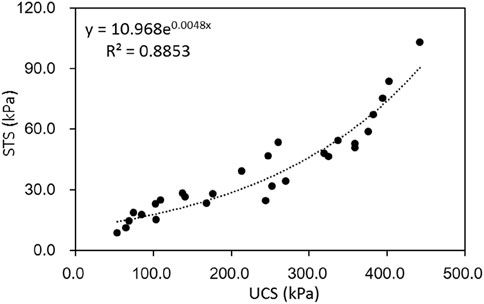
Figure 13. Relationship between UCS and STS.
Previous research has found that the improvement of mechanical strength of nano-SiO2-treated loess can be attributed to coarser particles and denser contacts (Kong et al., 2018). According to this research, this is due to nano-SiO2-induced structural modification, causing the formation of aggregate and more uniform aggregate. Some researchers have found that the aggregate can remarkably modify the mechanical behavior of the loess due to the structural adjustment (Zhang et al., 2013; Duan et al., 2024). Thus, the multiscale standpoint should help explain the improvement mechanism of nano-SiO2-treated loess. Moreover, the solidification has contributed little to the increase in strength due to reduced water content. They also concluded that the changes in nano-SiO2-treated loess result from physical effects rather than chemical activities (Kong et al., 2018). This finding is consistent with those found in tests on clays treated with other nanoparticles (Taha and Taha, 2012). This differs entirely from chemical additives such as lime, fly ash, and cement (Metelková et al., 2012; Pei et al., 2015; Zhang et al., 2017; Zhang et al., 2018). These chemical additives generally produce short-term modification and long-term stabilization. Modification typically results in decreased water content and increased dry density, while stabilization results from a pozzolanic reaction, causing the formation of coarse aggregates and new minerals. As a result, chemical additive-treated loess has a noticeable strength enhancement. It should be noted that adding a small amount of nano-SiO2 can also markedly enhance mechanical strength. Hence, nano-SiO2 can be used as a potentially cost-effective material in soil improvement.
4.2 The relationship of physical-mechanical properties
Figure 14 shows the relationship of ratios of after-curing water content to nano-SiO2 content (W/C) against the UCS and STS of nano-SiO2 treated loess at different curing days. The W/C ratios exist in the power function relationship with the UCS of treated loess with different nano-SiO2 contents after various curing days (Figure 14a). This may be mainly because the water content of treated loess does not decrease with the increase of nano-SiO2 content but does decrease with the increase of curing days. As shown in Figure 11a, the water content is almost the same under each curing period.
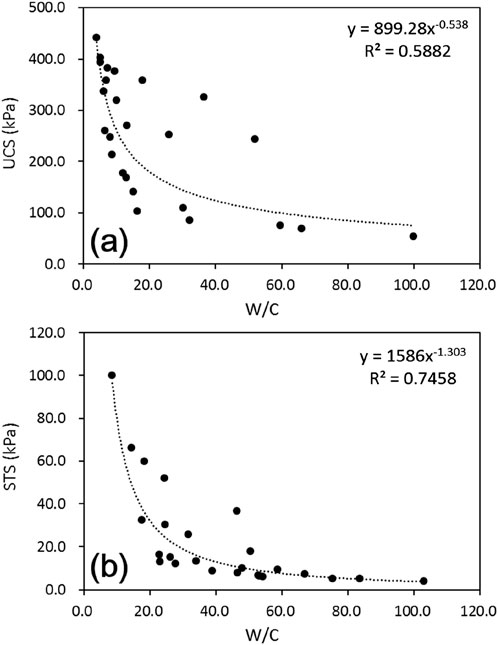
Figure 14. (a) Relationship between W/C and UCS; (b) relationship between W/C and STS. (W/C is the ratio of after-curing water content to nano-SiO2 content).
The W/C ratios of treated loess have a strong power function relationship with STS (Figure 14b). This may be mainly because the STS of treated loess continuously increases with increasing nano-SiO2 content and curing days. Under long curing periods, the STS of untreated and treated loess observably increases because the nano-SiO2 consumes a large amount of water in the sample, which significantly correlate with the lower water content (Figure 12a).
There is no apparent relationship between the after-curing water content of the UCS and STS of treated loess. A relatively close relationship exists between the W/C ratio and mechanical strengths. This finding is consistent with those obtained in other studies of cement-treated clays (Boutouil and Levacher, 2005; Lee et al., 2005; Lorenzo and Bergado, 2006). In addition, there is for chemical additives, such as cement and lime-treated soils, a close relationship between the after-curing void ratio to additive dosage and mechanical strengths (Lorenzo and Bergado, 2006; Consoli et al., 2010). Nevertheless, nano-SiO2 treated loess does not have such a linkage due to the almost constant void ratio. In addition, the consumed water is strongly related to the curing days of nano-SiO2 treated loess (Figure 15). For cement treated tailings and sludge, the consumed water is entirely related to the cement content (Boutouil and Levacher, 2005; Koohestani, 2017).
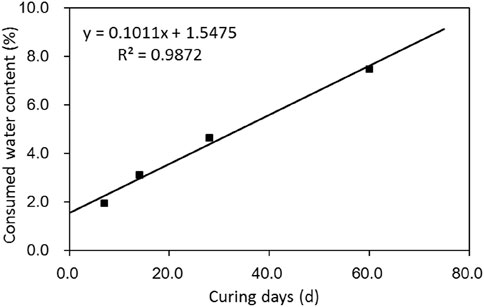
Figure 15. Relationship between consumed water content and curing days.
These significant differences may be derived from different reactive processes and stabilized mechanisms induced by chemical additives and nanoparticles. As suggested previously (Taha and Taha, 2012; Changizi and Haddad, 2015; Kong et al., 2018), nanoparticles are physical modification processes lacking chemical reactions and cemented mineral generation. Thus, the ratio of after-curing water content to nano-SiO2 content (W/C) may be a fundamental parameter for assessing the mechanical strengths of nanoparticle-treated soils. Hence, there is a need for further research on the basic parameters in nanoparticle treated soils.
5 Conclusion
This study focused on the effect of nano-SiO2 on the mechanical and physical properties of treated loess at different contents and curing days and paid special attention to sample homogeneity using UCS tests. Based on the test results, the conclusions are as follows.
(1) The UCS test is a simple and low-cost method for examining the homogeneity of sample preparation. The compaction technique used in this study can produce high-quality samples with the reasonably added sequence of water and nano-SiO2 during sample preparation. This study also affords an indirect tensile strength test and a failure point decision method under a specially desired mold.
(2) The UCS and STS of nano-SiO2 treated loess increase at different additive contents and curing days. Meanwhile, their water content decreases with increasing nano-SiO2 additive contents at different curing days. The increases in UCS and STS are related to the structural modification with coarser particles, denser contact, and lower water content.
(3) There is an exponential function relationship between UCS and STS due to their different increase trend, with nano-SiO2 contents accompanying curing days.
(4) There is a power function relationship ratio of after-curing water content to nano-SiO2 content (W/C) against the UCS and STS of nano-SiO2 treated loess at different curing days. Meanwhile, the power function relationship is stronger on STS than on UCS due to the continuous increase in nano-SiO2 content and curing days.
Data availability statement
The original contributions presented in the study are included in the article/supplementary material; further inquiries can be directed to the corresponding author.
Author contributions
RK: Validation, Visualization, Methodology, Formal analysis, Data curation, Investigation, Resources, Funding acquisition, Writing – review and editing, Conceptualization, Writing – original draft, Software, and Project administration.
Funding
The author(s) declare that financial support was received for the research and/or publication of this article. This study is supported by the Major Scientific and Technological Project in Lanzhou Resources and Environment Voc-Tech University (No. X2022ZD-02), the Team Project in The Youth Talent from the Organization Department of Gansu Province (No. 2025QNTD13), the Natural Science Foundation Project of Gansu Province (No. 25JRRA755), and the Innovation Fund Project for College Teachers of Gansu Province (2025A-298).
Conflict of interest
The author declares that the research was conducted in the absence of any commercial or financial relationships that could be construed as a potential conflict of interest.
Generative AI statement
The author declares that no generative AI was used in the creation of this manuscript.
Publisher’s note
All claims expressed in this article are solely those of the authors and do not necessarily represent those of their affiliated organizations, or those of the publisher, the editors and the reviewers. Any product that may be evaluated in this article, or claim that may be made by its manufacturer, is not guaranteed or endorsed by the publisher.
References
Ali Zomorodian, S. M., Shabnam, M., Armina, S., and O'Kelly, B. C. (2017). Strength enhancement of clean and kerosene-contaminated sandy lean clay using nanoclay and nanosilica as additives. Appl. Clay Sci. 140, 140–147. doi:10.1016/j.clay.2017.02.004
Boutouil, M., and Levacher, D. (2005). Effect of high initial water content on cement-based sludge solidification. Ground Improv. 9, 169–174. doi:10.1680/grim.2005.9.4.169
Changizi, F., and Haddad, A. (2015). Strength properties of soft clay treated with mixture of nano-SiO2 and recycled polyester fiber. J. Rock Mech. Geotechnical Eng. 7, 367–378. doi:10.1016/j.jrmge.2015.03.013
Consoli, N. C., Cruz, R. C., Floss, M. F., and Festugato, L. (2010). Parameters controlling tensile and compressive strength of artificially cemented sand. J. Geotechnical Geoenvironmental Eng. 136, 759–763. doi:10.1061/(asce)gt.1943-5606.0000278
Duan, Z., Song, K., Zhang, N., Zheng, L.-C., Yan, X.-S., and Zhang, M.-M. (2024). Characteristics and mechanisms of soil structure damage under salt weathering. Soil Tillage Res. 238, 106030. doi:10.1016/j.still.2024.106030
Fener, M., and Yesiller, N. (2013). Vertical pore structure profile of a compacted clayey soil. Eng. Geol. 166, 204–215. doi:10.1016/j.enggeo.2013.08.001
Frost, J. D., and Park, J.-Y. (2003). A critical assessment of the moist tamping technique. Geotechnical Test. J. 26, 57–70. doi:10.1520/gtj11108j
Frost, J. D., and Yang, C.-T. (2003). Effect of end platens on microstructure evolution in dilatant specimens. Soils Found. 43, 1–11. doi:10.3208/sandf.43.4_1
Gallagher, P. M. (2000). Passive site remediation for mitigation of liquefaction risk. Virginia Polytechnic Institute and State University.
Ghasabkolaei, N., Janalizadeh Choobbasti, A., Roshan, N., and Ghasemi, S. E. (2017). Geotechnical properties of the soils modified with nanomaterials: a comprehensive review. Archives Civ. Mech. Eng. 17, 639–650. doi:10.1016/j.acme.2017.01.010
Hattab, M., Hammad, T., Fleureau, J.-M., and Hicher, P.-Y. (2013). Behaviour of a sensitive marine sediment: microstructural investigation. Géotechnique 63, 71–84. doi:10.1680/geot.10.p.104
Hung, V. (2007). “Remediation of soil liquefaction using colloidal silica grout,” in Proceedings of the 2007 earthquake engineering symposium for young researchers.
Kim, S.-S., Hooton, R. D., Cho, T.-J., and Lee, J.-B. (2014). Comparison of innovative nano fly ash with conventional fly ash and nano-silica. Can. J. Civ. Eng. 41, 396–402. doi:10.1139/cjce-2012-0419
Kong, R., Zhang, F., Wang, G., and Peng, J. (2018). Stabilization of loess using nano-SiO2. Materials 11, 1014. doi:10.3390/ma11061014
Koohestani, B. (2017). Effect of saline admixtures on mechanical and microstructural properties of cementitious matrices containing tailings. Constr. Build. Mater. 156, 1019–1027. doi:10.1016/j.conbuildmat.2017.09.048
Kuganenthira, N., Zhao, D., and Anandarajah, A. (1996). Measurement of fabric anisotropy in triaxial shearing. Géotechnique 46, 657–670. doi:10.1680/geot.1996.46.4.657
Kuo, C.-Y., and Frost, J. D. (1996). Uniformity evaluation of cohesionless specimens using digital image analysis. J. geotechnical Eng. 122, 390–396. doi:10.1061/(asce)0733-9410(1996)122:5(390)
Lee, F. H., Lee, Y., Chew, S. H., and Yong, K. Y. (2005). Strength and modulus of marine clay-cement mixes. J. Geotechnical and Geoenvironmental Eng. 131, 178–186. doi:10.1061/(asce)1090-0241(2005)131:2(178)
Lorenzo, G. A., and Bergado, D. T. (2006). Fundamental characteristics of cement-admixed clay in deep mixing. J. Mater. Civ. Eng. 18, 161–174. doi:10.1061/(asce)0899-1561(2006)18:2(161)
Ma, L., Qi, J., Yu, F., and Yao, X. (2015). Experimental study on variability in mechanical properties of a frozen sand as determined in triaxial compression tests. Acta Geotech. 11, 61–70. doi:10.1007/s11440-015-0391-y
Metelková, Z., Boháč, J., Přikryl, R., and Sedlářová, I. (2012). Maturation of loess treated with variable lime admixture: pore space textural evolution and related phase changes. Appl. Clay Sci. 61, 37–43. doi:10.1016/j.clay.2012.03.008
Nadimi, S., and Fonseca, J. (2016). Enhancing soil sample preparation by thermal cycling. Géotechnique 66, 953–958. doi:10.1680/jgeot.15.t.033
Ng, C. W. W., Baghbanrezvan, S., Sadeghi, H., Zhou, C., and Jafarzadeh, F. (2017). Effect of specimen preparation techniques on dynamic properties of unsaturated fine-grained soil at high suctions. Can. Geotechnical J. 54, 1310–1319. doi:10.1139/cgj-2016-0531
Ng, C. W. W., and Coo, J. L. (2014). Hydraulic conductivity of clay mixed with nanomaterials. Can. Geotechnical J. 52, 808–811. doi:10.1139/cgj-2014-0313
Pei, X., Zhang, F., Wu, W., and Liang, S. (2015). Physicochemical and index properties of loess stabilized with lime and fly ash piles. Appl. Clay Sci. 114, 77–84. doi:10.1016/j.clay.2015.05.007
Ren, X., and Hu, K. (2014). Effect of nanosilica on the physical and mechanical properties of silty clay. Nanosci. Nanotechnol. Lett. 6, 1010–1013. doi:10.1166/nnl.2014.1857
Taha, M. R., and Taha, O. M. E. (2012). Influence of nano-material on the expansive and shrinkage soil behavior. J. Nanoparticle Res. 14, 1190–1213. doi:10.1007/s11051-012-1190-0
Tang, G. X., and Graham, J. (2000). A method for testing tensile strength in unsaturated soils. Geotechnical Test. J. 23, 377–382. doi:10.1520/gtj11059j
Wong, R. C. K. (2003). Strain-induced anisotropy in fabric and hydraulic parameters of oil sand in triaxial compression. Can. Geotechnical J. 40, 489–500. doi:10.1139/t03-005
Yamamuro, J. A., and Wood, F. M. (2004). Effect of depositional method on the undrained behavior and microstructure of sand with silt. Soil Dyn. Earthq. Eng. 24, 751–760. doi:10.1016/j.soildyn.2004.06.004
Zhang, C., Jiang, G., Su, L., and Zhou, G. (2017). Effect of cement on the stabilization of loess. J. Mt. Sci. 14, 2325–2336. doi:10.1007/s11629-017-4365-4
Zhang, F., Pei, X., and Yan, X. (2018). Physicochemical and mechanical properties of lime-treated loess. Geotechnical Geol. Eng. 36, 685–696. doi:10.1007/s10706-017-0341-6
Keywords: physical property, mechanical property, nano-SiO2-treated loess, sample preparation, performance improvement
Citation: Kong R (2025) Physical and mechanical properties of Nano-SiO2-treated loess. Front. Earth Sci. 13:1600037. doi: 10.3389/feart.2025.1600037
Received: 25 March 2025; Accepted: 15 April 2025;
Published: 15 May 2025.
Edited by:
Jie Dou, China University of Geosciences Wuhan, ChinaReviewed by:
Zhao Duan, Xi’an University of Science and Technology, ChinaGonghui Wang, Kyoto University, Japan
Copyright © 2025 Kong. This is an open-access article distributed under the terms of the Creative Commons Attribution License (CC BY). The use, distribution or reproduction in other forums is permitted, provided the original author(s) and the copyright owner(s) are credited and that the original publication in this journal is cited, in accordance with accepted academic practice. No use, distribution or reproduction is permitted which does not comply with these terms.
*Correspondence: Ran Kong, a29uZ3JhbkBsenJlLmVkdS5jbg==