 Xianhui Feng
 Jiren Zhang2†
 Haiyang Zhao
- 1College of Civil Engineering and Resource Environment, University of Science and Technology Beijing, Beijing, China
- 2College of Ocean Science and Engineering, Shanghai Maritime University, Shanghai, China
- 3Henan Datong Yiyuan Real Estate Co., Zhengzhou, Henan, China
- 4State Key Laboratory of Coastal and Offshore Engineering, Dalian University of Technology, Dalian, Liaoning, China
Temperature is a key factor influencing the mechanical behavior of the static interface between marine silica sand (SS) and geogrid, which directly impacts the stability and bearing capacity of reinforced soil structures. Despite its importance, there is limited research on the temperature-dependent mechanical properties of the silica sand-geogrid (SG) interface. To address this, a self-designed temperature-controlled large-scale static shear apparatus was used to perform a series of static shear tests on the SG interface, utilizing marine SS particles ranging from 0.075 mm to 2 mm and testing temperatures ranging from −5°C to 80°C. The results revealed a non-linear relationship between shear strength and temperature: as temperature increased from −5°C to 40°C, shear strength decreased, then rose between 40°C and 50°C, before declining again beyond 50°C. The sensitivity of interface shear strength to variations in normal stress remained low at both low and high temperatures. Moreover, the interface friction angle and cohesion showed temperature-dependent fluctuations, initially decreasing, then increasing, and finally declining again. These findings underscore the complex effects of temperature on SG interface mechanics and suggest that temperature must be carefully considered in evaluating the stability and performance of reinforced soil structures under varying environmental conditions.
1 Introduction
As a typical marine sediment, marine silica sand (SS) is widely distributed worldwide and is particularly common in coastal and offshore areas (Chen R. et al., 2023; Wu et al., 2022; Wu et al., 2019). As marine engineering construction advances, marine SS is being progressively adopted as a key material for building engineering structures, including foundations for port terminals and coastal highways (Akosah et al., 2025; Peng et al., 2022; Wu et al., 2021). However, the marine SS foundation’s pliability in relevant engineering applications could cause uneven settlement or localized failure, especially when subjected to water infiltration and waves (Oyegbile and Oyegbile, 2017; Wang H. et al., 2024; Yu and Bathurst, 2017). The geogrid reinforcement technique is considered an efficacious approach for enhancing the safety of marine engineering structures and mitigating foundation settlement (Chai et al., 2024; Li and Rowe, 2008; Sajan et al., 2024). The reinforcement effect predominantly influences the mechanical performance at the interface between the marine SS and the geogrid (Chen et al., 2021; Gao et al., 2024; Shao et al., 2023). The stabilized SG interface has been demonstrated to facilitate the effective transfer of external loads to the geogrid (Wang and Zhang, 2020; Wang et al., 2021). This process restricts marine SS foundations’ lateral deformation, enhancing their overall flatness (Ahmad and Mahboubi, 2021; Fan et al., 2025; Gao and Ye, 2023). Therefore, in-depth research into the mechanical properties of SG interfaces is essential.
In marine engineering, SG interfaces are frequently subjected to static loads, including foundation self-weight and long-term static loads in marine environments (Chen et al., 2022; Rui et al., 2024; Ye et al., 2022). The soil-geosynthetics interface’s mechanical response to static loading is known to be very different from its response to dynamic loading (Chao et al., 2024d; Chao et al., 2024e; Deng et al., 2024). Compared to dynamic loading, the interface under static loading primarily demonstrates long-term stability and progressive deformation characteristics (Chao et al., 2024c; Wang P. et al., 2024; Wang T. et al., 2024). The results show that under static loading conditions, the SG interface undergoes stress relaxation and creep deformation, causing irreversible damage to the SG joint interface during long-term use (Cardile, 2023; Ye et al., 2019). These phenomena significantly impact the SG interface’s shear performance and long-term stability (Chen J. et al., 2023; Wang et al., 2025; Feng et al., 2022). Furthermore, the findings indicate that the mechanisms of friction and embedded locking at the SG interface under static loading are also more significant (Samanta et al., 2022; Liu et al., 2024). Therefore, studying the SG interface’s mechanical characteristics under static loading is essential.
Marine engineering structures on marine SS foundations experience temperature fluctuations due to elevated temperatures and exothermic reactions in tropical and subtropical coastal regions (Chao et al., 2023b; Feng et al., 2022). Generally, the marine foundation temperatures may approach 50°C or higher in the summer and below 0°C in the winter (Chao et al., 2024b; Feng et al., 2024). Research has demonstrated that temperature exerts a substantial influence on the performance of geosynthetics (Feng et al., 2025; Han and Jiang, 2013). Geogrid is made of thermoplastic synthetic polymers such as polyester and polypropylene, which are heat-sensitive and will soften at elevated temperatures (Liu et al., 2023; Samea and Abdelaal, 2023). Rising temperatures cause a notable reduction in the geogrid’s mechanical properties, including the modulus of elasticity and strength (Marcotte and Fleming, 2022). Research indicates that an increase in temperature from 20°C to 60°C can reduce the tensile strength of geogrid by approximately 30% (Chao et al., 2024a; Francey and Rowe, 2023; Shirazi et al., 2019). Additionally, research indicates that higher ambient temperatures lead to decreased tensile strength and elastic stiffness, accompanied by increased creep strain in geogrid (Wang et al., 2023). Regarding the mechanical properties of marine SS, the current studies demonstrate that it is also temperature-dependent. Temperature changes alter the thermal conductivity of marine SS, affecting temperature distribution and moisture migration and leading to changes in the effective stresses in the soil (Chao et al., 2023a; Karademir and Frost, 2014; Shi et al., 2023). Hence, studying how temperature affects the SG interface’s mechanical properties is essential.
Despite the increasing use of geogrid-reinforced marine sand in coastal and offshore engineering. Rare research on how temperature affects the SG interface has been carried out because of limitations in tools like temperature-controlled interface static shear apparatus. Most existing studies focus on SG interfaces’ static and dynamic mechanical behaviour under ordinary temperatures, with limited attention to temperature variations. This paper presents a series of static shear tests conducted on SG interfaces at various temperatures utilizing a self-developed temperature-controlled large interface static shear apparatus. The experimental temperatures were (−5°C, 0°C, 20°C, 40°C, 50°C, 60°C, 70°C, and 80°C), and the marine SS particle sizes varied from 0.075 mm to 2 mm. The experiment’s results provide valuable insights into the temperature effects on the static interface interaction between sand and geogrid. This research fills a critical gap in understanding how temperature variations impact the performance of geogrid-reinforced marine foundations. Furthermore, it offers significant references for the engineering application of geogrids across various environmental conditions, particularly in the design and long-term performance assessment of geogrid-reinforced marine foundations under fluctuating temperature conditions.
2 Experimental program
2.1 Testing apparatus
The self-developed temperature-controlled large interface static shear apparatus comprises two primary components: an external environmental temperature chamber and an internal static shear system, as depicted in Figure 1. The static shear system is housed within the temperature chamber, which enables precise temperature regulation for interface shear tests over a broad range from −50°C to 300°C, with durations of up to 7 days. The servo load’s normal stress ranges from 0 kPa to 400 kPa, the speed range is 0.1–50 mm/min, and the normal stress accuracy is 1 kPa. The shear loading servo control system can apply stress or displacement-controlled shear loading to the lower shear box through the shear stress loading lever, with the maximum shear force and displacement of 50 kN and 200 mm, respectively, the displacement resolution of 0.001 mm and the accuracy of shear stress of ±0.02%. Static shear tests on the SG interface under controlled temperatures are now possible, thanks to this device.
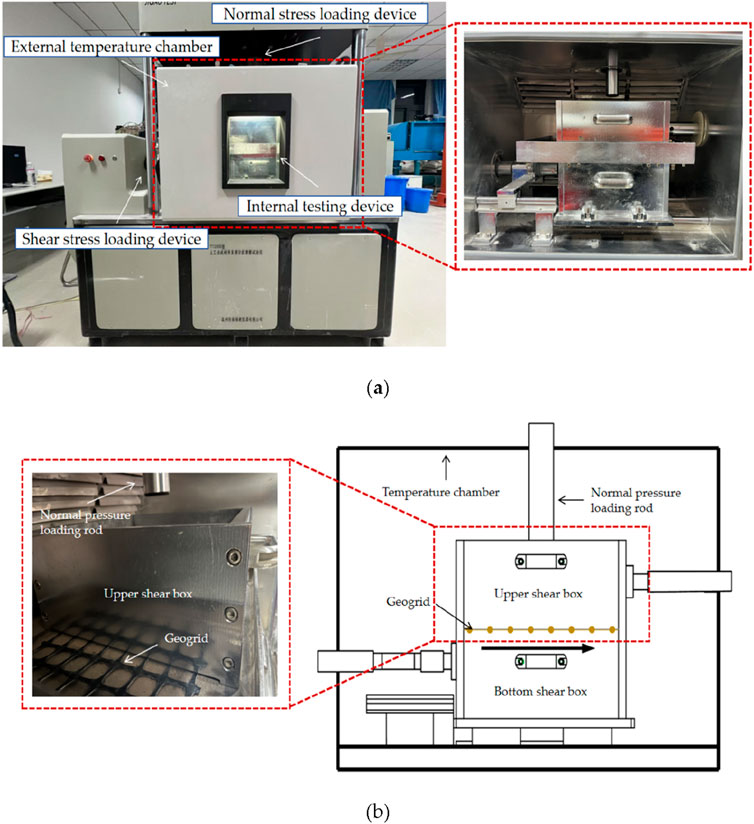
Figure 1. The self-developed temperature-controlled large interface static shear apparatus. (a) Front view; (b) Close-up view and corresponding cross-sectional view.
2.2 Materials
2.2.1 Silica sand
The experimental material employed in this study is marine SS (refer to Figure 2). The distribution curve of particle sizes is depicted in Figure 3. The ideal moisture content of the prepared marine SS materials is 9.65%. Table 1 delineates the physical and mechanical characteristics of marine SS.
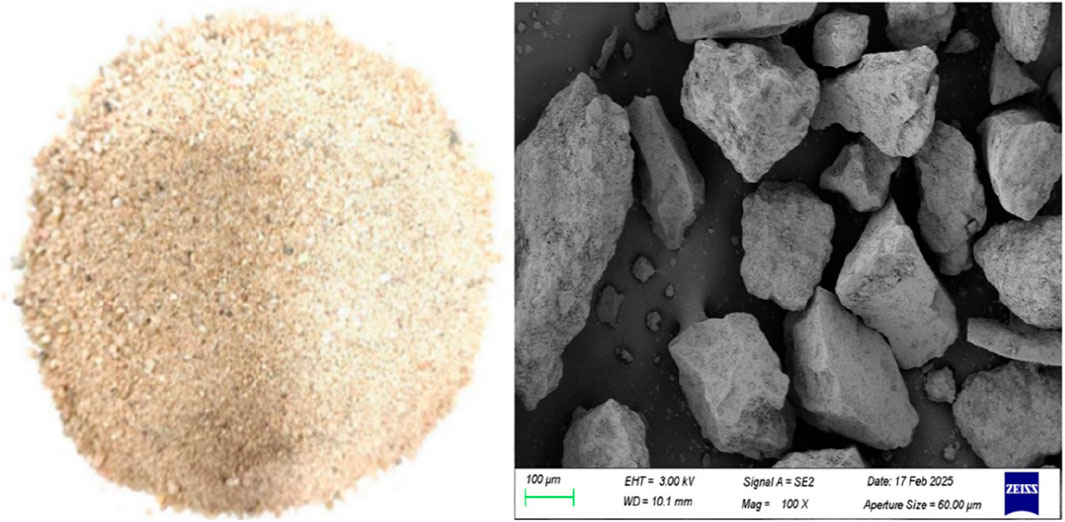
Figure 2. Marine silica sand sample.
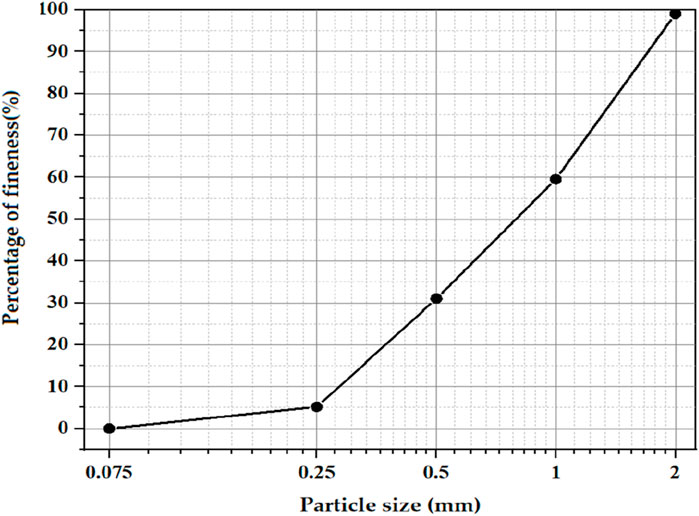
Figure 3. The particle size distribution curve.
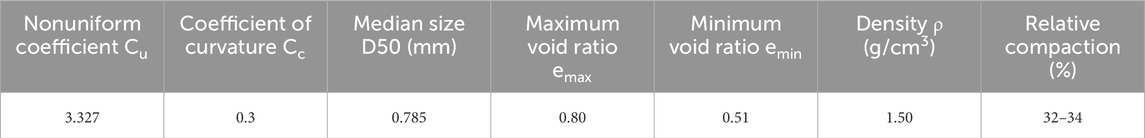
Table 1. Physical and mechanical properties of marine silica sand.
2.2.2 Geogrid
Geogrids were selected as the reinforcing material for this test because they are suitable for reinforcement applications with high embedded locking and load transfer requirements. Geogrid, through its unique large aperture structure and soil particles, forms a mechanical interlocking effect, significantly enhancing the soil’s shear strength and tensile strength. This reinforcing effect can effectively improve the stability of the soil under external loads. Geogrid improves reinforced sand structures’ tensile strength and load-bearing capacity by limiting lateral displacement and mobilising confining effects. These characteristics make geogrids particularly advantageous for marine applications. The geogrid used in the experiment is a polypropylene (PP) biaxially oriented plastic geogrid manufactured by Lusheng Geosynthetics Co., as shown in Figure 4. Its technical specifications are detailed in Table 2. In Table 2, transverse quality control tensile strength represents the tensile strength under transverse loading, while longitudinal quality control tensile strength is the tensile strength under longitudinal loading. Transverse node effectiveness indicates the functional performance of nodes in the transverse direction, whereas longitudinal node effectiveness measures node performance in the longitudinal direction. Additionally, 0.5% strain transverse stiffness and 0.5% strain longitudinal stiffness are key parameters describing the material’s deformation resistance and stiffness under external forces in the respective directions.
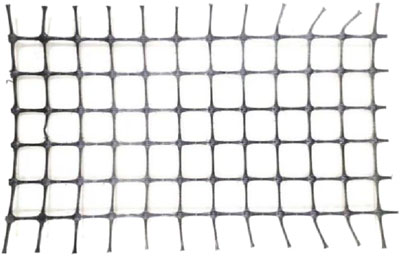
Figure 4. Biaxial geogrid.
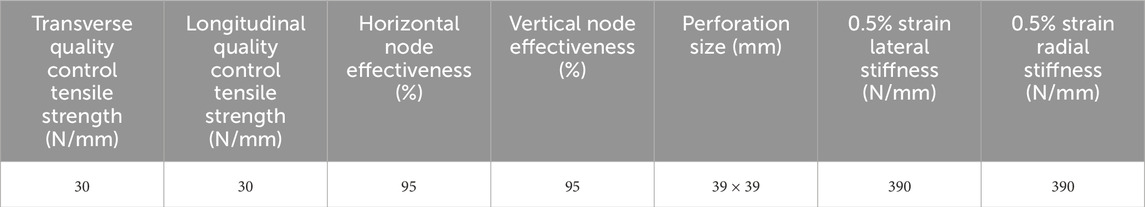
Table 2. Technical specifications of geogrid.
2.3 Test steps
The geogrid sample used in the experiment was 280 mm wide and 460 mm long, and it was fixed to the front edge of the lower shear box in the static shear apparatus. The static shear test was performed along the longitudinal direction of the geogrid sample. The upper shear box was loaded with marine SS in five layers using a layered compaction method. The height of each layer was 24 mm, totalling 12 mm, and 16 tampers compacted each layer. After compacting the upper shear box fill, cover the rigid bearing plate, apply normal stress, and turn on the temperature control switch for temperature adjustment. The consolidation time of the marine SS sample was 2 hours, and the temperature adjustment time was 2 hours. The examination was performed in a strain-controlled mode, utilizing a shear rate of 1 mm/min. The horizontal tension and shear displacement were recorded automatically throughout the shear process. The test ceases automatically upon the attainment of a shear displacement of 65 mm.
2.4 Testing program
Geogrid is commonly used in marine engineering to reinforce the foundation, the general cover soil thickness is 2.5 m–12.5 m, which exerts about 50 kPa–250 kPa normal stress on the SG interface. Based on the practical application of geogrids in marine engineering, three experimental normal stress values of 50 kPa, 150 kPa, and 250 kPa were selected in order to simulate the stress conditions at different depths that may be encountered in actual reinforcement projects. The normal stress of 50 kPa represents shallow reinforcement applications such as coastal dykes and roadbeds. The normal stress of 150 kPa corresponds to a medium-depth reinforcement scheme, which is geogrid in the engineered fill layer. The normal stress of 250 kPa corresponds to deep foundation applications. In this study, a temperature interval from −5°C to 80°C was selected based on the range of temperature variations common in marine engineering. Intermediate temperatures (0°C, 20°C, 40°C, 50°C, 60°C, and 70°C) were also selected to systematically analyze the effects of temperature variations on the SG interface, considering the value of the experimental results for engineering applications and workload balance. Choosing reasonable temperature intervals can effectively reveal the influence of the law of temperature change on the mechanical behaviour of the interface, especially the change of mechanical response in the high and low-temperature intervals. The shear rate of 1 mm/min was selected based on established standards (ASTM D3080, ISO 17892-10) for direct shear testing of soil-geosynthetic interfaces. A lower shear rate ensures quasi-static loading, allowing stress redistribution and preventing inertial effects or strain localization. This rate aligns with practical geotechnical applications and has been widely adopted in previous studies to accurately capture interface mechanical behaviour under static loading. Under undrained consolidation, the static shear test was carried out on the SG interface using constant temperature control technology. A total of 24 testing programs were designed under three normal stresses (50 kPa, 150 kPa, 250 kPa) and eight different constant temperature conditions (−5°C, 0°C, 20°C, 40°C, 50°C, 60°C, 70°C, and 80°C), as shown in Table 3, to study the effects of different temperatures on the SG interface shear mechanical properties.
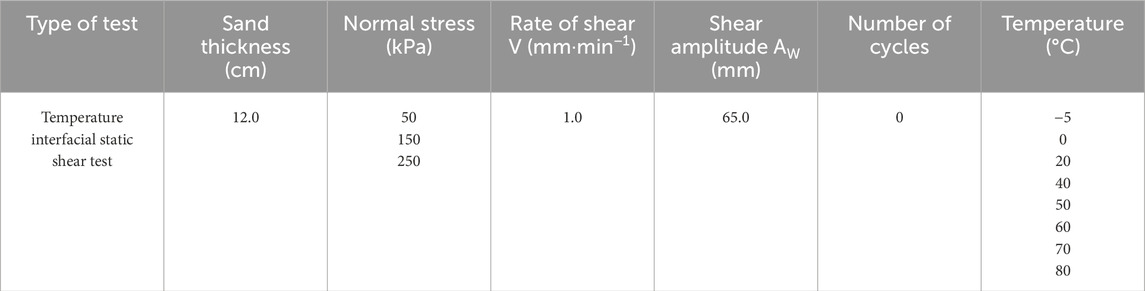
Table 3. Testing program.
3 Results and analysis
3.1 The relationship between shear stress and shear displacement
Figure 5 illustrates the relationship curves between shear stress and shear displacement of the SG interface at various temperatures and normal stresses.
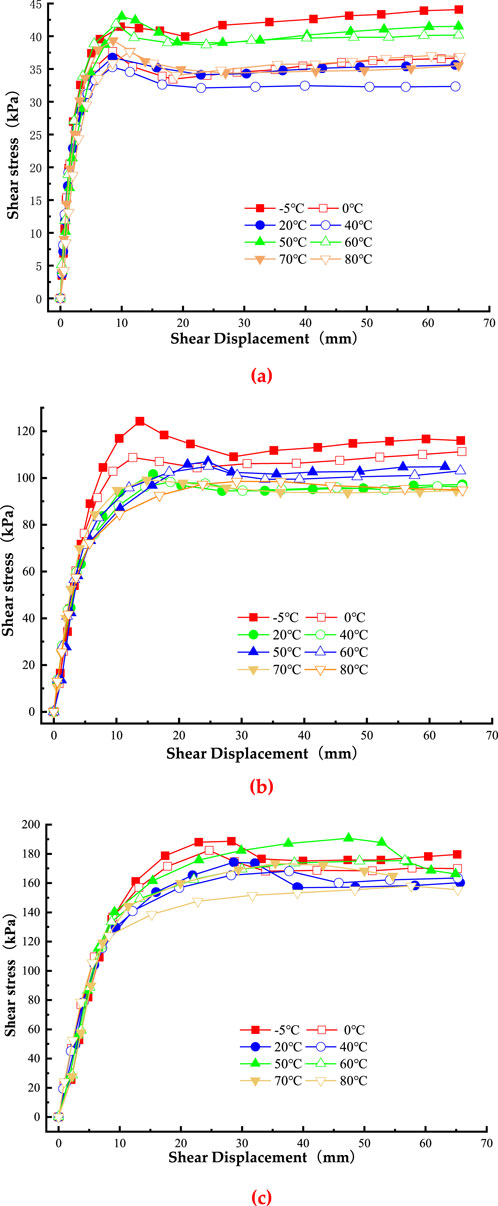
Figure 5. The relationship curves between shear stress and shear displacement. (a) 50 kPa Normal stress; (b) 150 kPa Normal stress; (c) 250 kPa Normal stress.
Figure 5 shows that for most temperatures and normal stresses, the hyperbolic pattern is the most common relationship between shear stress and shear displacement at the SG interface. When the shear displacement grows, the shear stress goes up, down, and then flattens out. Elastic, failure and residual shear are the three separate phases that these curves go through.
In the elastic stage, shear stress and displacement exhibit a linear correlation. At the same level of normal stress, curves for different temperatures nearly overlap, suggesting that temperature has minimal influence on the shear mechanical behaviour of the interface in this stage.
In the failure stage, the SG interface shear stress increases and then decreases with the displacement increase, showing apparent strain-softening characteristics. Strain-softening refers to a phenomenon where, after reaching peak shear stress, the shear resistance decreases as deformation continues, often due to the progressive degradation of material interlocking and bonding. The main reason is that the occlusal embedment between soil particles and geogrid is gradually destroyed with the increase of displacement. This leads to a decrease in shear strength, which is manifested as strain-softening characteristics. The shear displacement corresponding to the peak shear stress increases with the increase of normal stress at the same temperature. For example, under a normal stress of 50 kPa, the shear displacement corresponding to the peak shear stress ranges from 8 mm to 12 mm; under 150 kPa, it ranges from 12 mm to 25 mm; and under 250 kPa, it ranges from 20 mm to 35 mm. However, at high normal stresses and elevated temperatures, the interface may exhibit insignificant strain-softening characteristics or even demonstrate strain-hardening characteristics. Strain-hardening describes a response where shear stress continuously increases with displacement, indicating an increasing resistance to deformation due to material densification or strengthening mechanisms. Specifically, at normal stresses of 50 kPa and 150 kPa, the shear stress initially increases and then decreases with increasing displacement, exhibiting strain-softening characteristics. In contrast, at a normal stress of 250 kPa, the shear stress increases with displacement in the temperature range from 40°C to 80°C, showing strain-hardening characteristics. This is due to the fact that the increased embedded locking effect between sand grains occurs at higher normal stresses due to grain compacting and an increase in contact points. At higher temperatures, the geogrid softens due to thermal expansion, and when shear displacement increases, the embedded locking effect between the sand particles and the geogrid pores becomes more noticeable. Shear strength gradually increases as a result of this. Causing the SG interface to exhibit strain-hardening behaviour.
In the residual shear stage, the SG interface shear stress remains relatively constant as displacement increases. At the same temperature, the residual shear stage is less pronounced under normal stress of 250 kPa than normal stresses of 50 kPa and 150 kPa.
3.2 The temperature-dependent interface shear strength
In order to investigate the variation in shear strength of the SG interface as a function of temperature, graphical representations illustrating the relationship between interface shear strength and temperature (specifically at 5°C, 0°C, 20°C, 40°C, 50°C, 60°C, 70°C, and 80°C) are provided under three distinct normal stress conditions (50 kPa, 150 kPa, and 250 kPa), as depicted in Figure 6. The maximum shear stress observed on the relationship curve between shear stress and shear displacement of the SG interface represents the shear strength of the interface. In the context of multiple peak stresses, the initial peak shear stress signifies the shear strength of the interface.
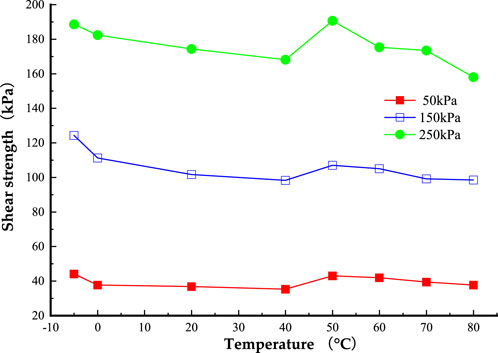
Figure 6. The relationship curves between the interface shear strength and temperature.
According to Figure 6, the interface shear strength exhibits an initial decline, followed by an increase, and subsequently a further decrease as the temperature rises. Within the temperature range of −5°C–40°C, the interface shear strength exhibits a gradual decline as the temperature rises. This reduction can be ascribed to a diminished bond strength between the sand particles and the geogrid interface. The geogrid material demonstrates increased rigidity in low-temperature environments, resulting in a more pronounced locking effect among the sand particles (Lahoori et al., 2021; Ye and Gao, 2024). Between 40°C and 50°C, the interfacial shear strength significantly increases with the elevation of temperature. The observed increase can be attributed to the moderate softening of the geogrid material at elevated temperatures, which facilitates an enhanced interlocking effect between the sand particles and the geogrid interface, thereby augmenting the shear resistance at the interface (Khan and Latha, 2023; Shu et al., 2025). The enhancement in shear strength is especially notable when subjected to a normal stress of 250 kPa. Nevertheless, within the temperature range of 50°C–80°C, the interface shear strength exhibits a decline as the temperature increases. This indicates that the thermal softening of the material at elevated temperatures considerably influences the mechanical properties of the interface. Within the low-temperature range of −5°C–0°C, the shear strength of the SG interface reaches its peak at −5°C.
The interface shear strength change ratio β is introduced to investigate the sensitivity of the SG interface shear strength to normal stress and temperature changes (Ari and Akbulut, 2024).
where,
The interface shear strength change ratio β (Equation 1) reflects its sensitivity to variations in normal stress and temperature. The shear strength change ratio β at different temperatures and normal stress intervals are presented in Tables 4,5.
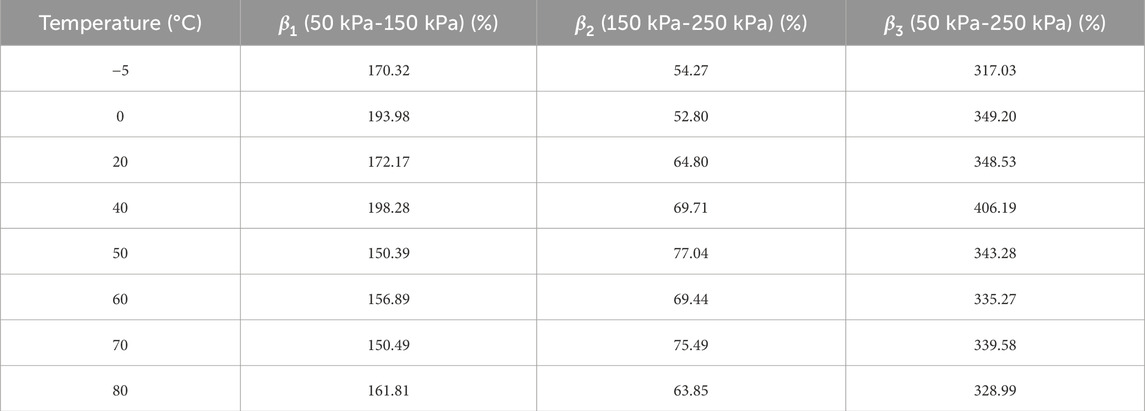
Table 4. The shear strength change ratio β corresponding to different normal stress intervals.
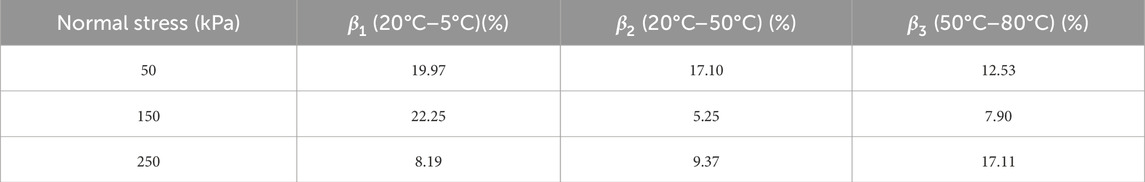
Table 5. The shear strength change ratio β corresponding to different temperature intervals.
As shown in Table 4, the variation in interface shear strength initially increases and then decreases with rising temperature, reaching a peak within a specific temperature range. For normal stress variation intervals of 50 kPa–150 kPa and 50 kPa–250 kPa, the interface shear strength change ratio β reaches its highest values at 40°C, measuring 198.28% and 406.19%, respectively. This indicates that at 40°C, the SG interface is most sensitive to changes in normal stress within these ranges. The underlying reason is the moderate thermal softening of the geogrid material at this temperature, which enhances the interlocking effect between sand particles and the geogrid, thereby improving the interface’s responsiveness to normal stress variations. For the normal stress interval of 50 kPa–150 kPa, the interface shear strength change ratio β is highest at 50°C, with a value of 77.04%. This suggests that the sensitivity of the SG interface shear strength to normal stress changes is most pronounced at 50°C within this range. The interface shear strength change ratio β at room temperature (20°C) is more significant than at both low and high temperatures. Specifically, for the normal stress interval of 50 kPa–150 kPa, the interface shear strength change ratio β is 317.03% at −5°C, 328.99% at 80°C, and 348.53% at 20°C. This indicates that the interface shear strength is more sensitive to normal stress variations at room temperature than at low or high temperatures. To better explain this behaviour, photographs of geogrid samples after testing at different temperature conditions (low, room, and high) are attached, as shown in Figure 7. As shown in Figure 7, no significant deformation of the geogrid occurred at low temperatures. This is because at low temperatures, polypropylene geogrids become stiffer, with a marked increase in stiffness, leading to a reduction in their flexibility. This weakens the occlusal embedment between the geogrid and the sand particles, thereby reducing the sensitivity of the interface shear strength to changes in normal stress. Geogrids undergo significant plastic deformation in high-temperature environments due to the thermal softening effect. This material softening phenomenon significantly reduces structural stiffness, weakening the geogrid’s shear resistance. In contrast, at room temperature, geogrids balance rigidity and flexibility. This balance optimizes the occlusal embedment between the geogrid and the sand particles, enhancing the interface’s mechanical response and making its interfacial shear strength more sensitive to normal stress changes. The observed trends are valid for the polypropylene (PP) geogrids used in this study, as PP geogrids exhibit moderate thermal softening behaviour. However, different geogrids made from alternative polymers, such as polyester or polyethene, may exhibit different responses to temperature variations.
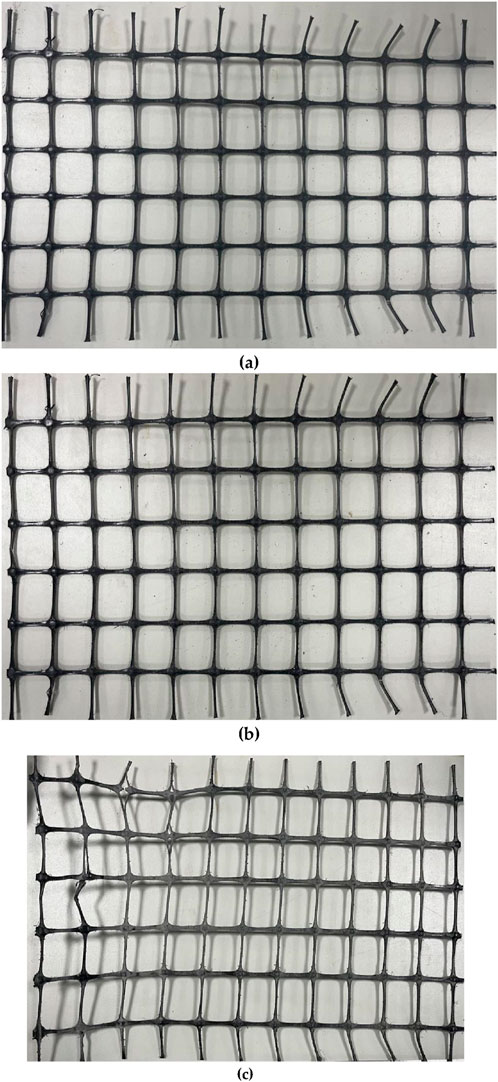
Figure 7. Samples of geogrids after tests with different parameters. (a) 150 kPa Normal stress; −5°C temperature; (b) 150 kPa Normal stress; 20°C temperature; (c) 150 kPa Normal stress; 80°C temperature.
Table 5 shows that as the temperature increases, the interface shear strength change ratio β decreases under normal stress of 50 kPa. This trend suggests that, under normal stress of 50 kPa, the SG interface becomes less sensitive to temperature changes as temperatures increase. Between −5°C and 20°C, the sensitivity to temperature changes is at its peak, and between 50°C and 80°C, it is at its lowest. As the temperature rises, the interface shear strength change ratio β grows under a normal stress of 250 kPa. It can be observed that at a normal stress of 250 kPa, the shear strength of the SG interface is highly sensitive to changes in temperature. The sensitivity to temperature change is greatest in the 5–20°C temperature range, and in the 50–80°C range, it is least.
3.3 The temperature-dependent interface strength parameter analysis
To investigate the SG interface shear characteristics at different temperatures, the least square method plots the envelope curves of interface shear strength and residual shear strength at various constant temperatures, as shown in Figure 8.
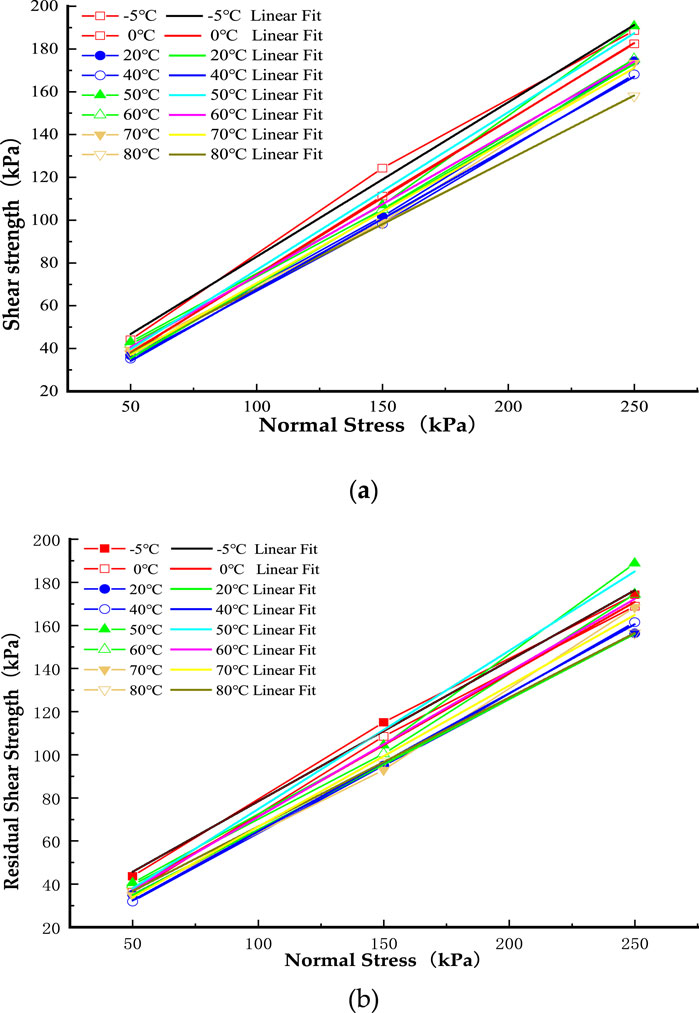
Figure 8. Mohr-Coulomb Failure envelope lines of SG interface shear strength. (a) Shear strength; (b) residual shear strength.
Figure 8 illustrates the linear relationship between shear and residual shear strength and normal stress. The correlation coefficients (R2) for shear and residual shear strength in relation to normal stress range from 0.994 to 1.000, as shown in Table 6. This signifies a robust linear correlation between shear strength and residual shear strength in relation to normal stress. The present study employs the Mohr-Coulomb criterion to analyze this linear relationship. The cohesion and internal friction angle, essential parameters of interface shear strength, are ascertained using the Mohr-Coulomb Failure envelope theorem. According to the theorem, the shear strength (
where,

Table 6. Goodness of fit of interface shear strength molar stress circular envelope line.
The cohesion (c) and friction angle (
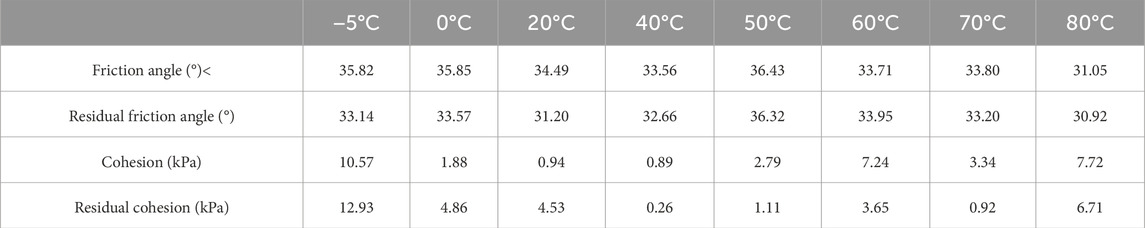
Table 7. Tabulated values of friction angle and cohesion at different temperatures.
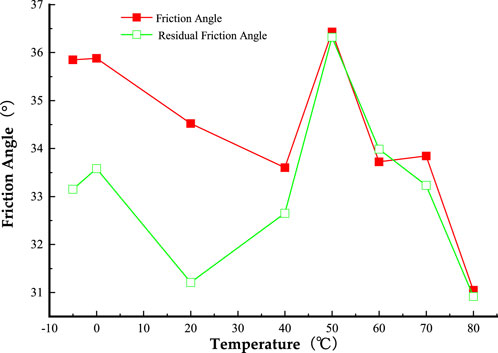
Figure 9. The relationship curves between interface friction angle and temperature.
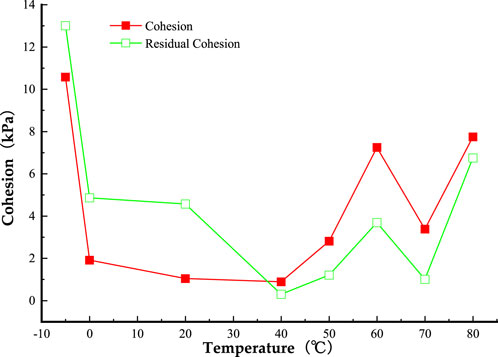
Figure 10. The relationship curves between interface cohesion and temperature.
Although marine SS is usually considered to be cohesionless, the present experimental data measure the SG interface, which differs from pure marine SS. The physical interaction between marine SS particles and geogrid can explain the observed cohesion at the SG interface. The geogrid’s rough surface and large pore size structure create an occlusal embedding interaction with the marine SS particles, effectively increasing the interface’s shear strength. Although marine SS does not have cohesion, this occlusal embedding interaction produces measurable cohesion at the interface. In addition, the tested marine SS had a moisture content of 9.45%, which allowed for a moisture film on the surface of the sand particles. The moisture film creates cohesion between the particles through capillary action or surface tension.
Figure 9 demonstrates that the SG interface friction angle varies between 31.05° and 36.43°, whereas the SG interface residual friction angle fluctuates from 30.92° to 36.32°. The interface friction angle and the residual friction angle initially diminish, then augment, and subsequently decline as the temperature escalates. The minimum values for both angles are recorded at 80°C, while the maximum values are noted at 50°C. At 80°C, the interface friction angle is 31.05°, and the residual friction angle is 30.92°. Conversely, at 50°C, the interface friction angle increases to 36.43°, and the residual friction angle attains 36.32°. As the temperature decreases from 20°C to −5°C, the interface friction angle rises by 3.97%, and the residual friction angle escalates by 8.06%. This suggests that the peak residual interface friction angle exhibits greater sensitivity to temperature fluctuations than the interface friction angle when the temperature declines from 20°C to −5°C. Low temperatures considerably affect the rigidity of the interface material, resulting in more pronounced alterations in interface behaviour under residual conditions (Jin et al., 2022; Shoushtari et al., 2023). When the temperature increases from 20°C to 80°C, the interface friction angle decreases by 9.70%, while the interface residual friction angle decreases by 3.49%. The results indicate that, within the temperature range of 20°C–80°C, the interface friction angle is more sensitive to temperature changes than the interface residual friction angle (Jin et al., 2022; Gao and Ye, 2024). The results indicate that the high-temperature softening effect may significantly impact the initial shear stage. In contrast, the mechanical performance changes during the residual stage are relatively minor.
Figure 10 shows that different values of interface cohesion (from 0.89 kPa to 10.57 kPa) and residual interface cohesion (from 0.26 kPa to 12.93 kPa) are observed. As the temperature increases, the interface and residual cohesion show a pattern of decreasing, increasing, and then decreasing again. At 40°C, the values for both parameters are at their lowest, and 5°C, they are at their highest. The residual and interface cohesion are both lower at 20°C than at the two extremes. An increase of 806.18% in interface cohesion and a rise of 144.43% in residual cohesion are observed as the temperature drops from 20°C to −5°C. This suggests that, within this temperature range, changes in interface cohesion are more noticeable than changes in residual cohesion. Similarly, there is a 647.73% increase in interface cohesion and a 40.48% increase in residual cohesion as the temperature rises from 20°C to 80°C. From 20°C to 80°C, this indicates that, like residual cohesion, interface cohesion is more temperature-sensitive.
3.4 The relationship between normal and shear displacement
The relationship curves between normal and shear displacement in different temperatures are drawn in Figure 11.
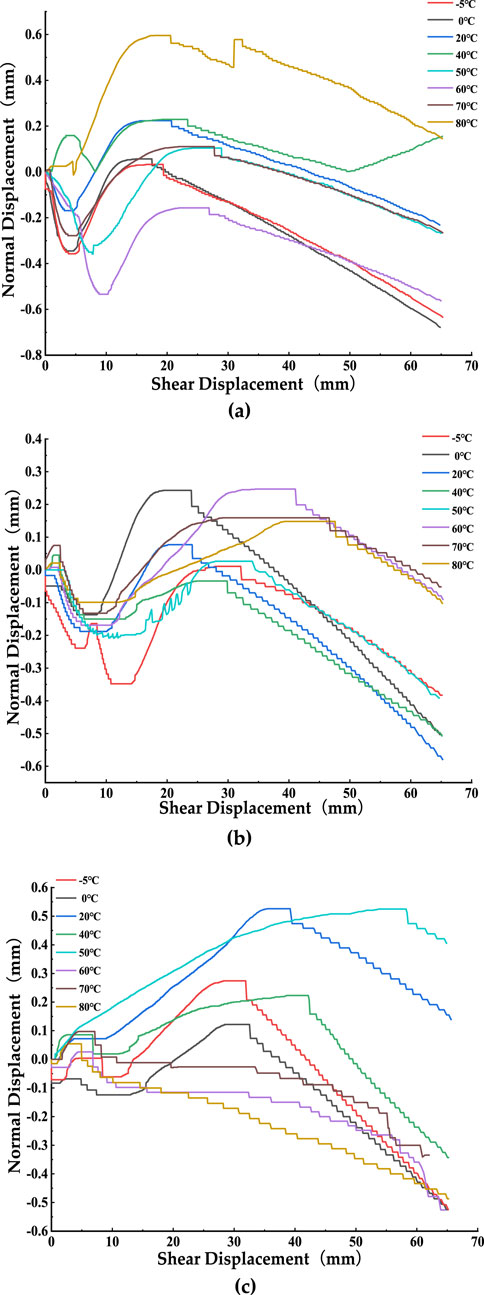
Figure 11. The relationship curves between normal displacement and shear displacement. (a) 50 kPa Normal stress; (b) 150 kPa Normal stress; (c) 250 kPa Normal stress.
Figure 11 depicts the correlation between normal and shear displacement at identical normal stress levels across varying temperatures. In Figure 11, negative normal displacement indicates shrinkage behaviour, whereas positive normal displacement signifies expansion behaviour. The vertical deformation of reinforced soil during the shear displacement process can be categorized into three distinct stages. In the initial stage, the shear displacement is relatively small, the normal displacement is negative, and the reinforced soil undergoes vertical shrinkage. At this stage, as the sand grains are rearranged, the voids between the grains are gradually reduced, and the particles are compacted. In addition, the geogrid enhances the embedded locking effect of the particles so that the sand particles do not undergo large-scale slippage at the initial stage, which promotes the compacting of the soil. This leads to a reduction in the volume of the sandy soil and shear shrinkage. In the second stage, the normal displacement becomes positive as the shear displacement increases, and the reinforced soil exhibits dilatancy. The reason for this phenomenon is the sliding of the sand particles on each other and the surface of the geogrid as the shear displacement increases. Increased relative displacement and space between particles lead to swelling of the sandy soil; thus, the reinforced soil exhibits shear swelling. In the third stage, after reaching the maximum shear stress. The geogrid is gradually withdrawn from the soil layer, and its pores and surface will bring out part of the sandy soil. This results in a continuous decrease in the overall volume of the sandy soil and, thus, a continuous decrease in the normal displacement and shear contraction until the maximum shear displacement is reached.
The shear displacements linked to the changes from shear shrinkage to shear dilation and from shear dilation to shear shrinkage follow similar patterns at different temperatures, as shown in Figure 10, when subjected to the same normal stress. The horizontal displacement linked to the first stage’s completed shear shrinkage grows steadily larger as the normal stress grows. As the second stage nears its end, the horizontal displacement linked to the shear dilation’s end also increases with time. As an example, when normal stress was raised, the horizontal displacement at the end of the first stage of shear shrinkage increased from 5 mm to 8 mm and then to 10 mm. Likewise, as normal stress increased, the horizontal displacement of 15 mm, 20 mm, and 30 mm corresponding to the end of shear dilation in the second stage grew. The soil sample’s shear dilatancy in the second stage became less noticeable or even vanished when subjected to high normal stress and elevated temperatures. Soil samples sheared and vanished in the second stage when subjected to normal stresses of 250 kPa and 80°C; this behaviour persisted at 60°C and 70°C as well.
The initial stage shear shrinkage of the SS sample is negligible or nonexistent at a normal stress of 250 kPa. The dilatancy in the second stage is more noticeable as temperature increases under low normal stress. The normal displacement in the second stage increases by 0.38 mm at −5°C, 0.4 mm at 0°C, 0.45 mm at 20°C, and 0.6 mm at 80°C, according to a normal stress of 50 kPa. The normal displacement turns positive at a maximum normal stress of 250 kPa and a low temperature of −5°C. This is probably because the sand density increases and the pore water ice volume increases under high stress (Chao et al., 2025; Gao et al., 2024).
4 Conclusion
This study used a self-engineered temperature-controlled large interface static shear apparatus to perform a series of temperature-regulated static shear tests on the interface between geogrid and marine SS, with particle sizes ranging from 0.75 mm to 2 mm. Temperatures ranging from −5°C to 80°C were used for the tests. According to the results of the study, the static mechanical behaviour of the SG interface is greatly affected by temperature. Under different normal stresses, the SG interface shear strength first decreases, then increases, and subsequently decreases as the temperature rises. As the temperature increases, the angle of interface and residual friction decreases at first, then increases, and finally decreases again. As the temperature increases, the interface and residual interface cohesion follow a decreasing trend at the outset, an increasing trend later on, and a decreasing trend again. Under the same normal stress, the shear displacements associated with the transitions from shear shrinkage to shear dilation and from shear dilation to shear shrinkage exhibit similar trends at different temperatures. The results presented in this paper provide crucial insights into the temperature-dependent static mechanical behaviour of the interface between geogrid and marine SS. These results are essential for addressing the uncertainties and limitations of selecting mechanical parameters for designing SG interfaces in relevant marine engineering applications. Future research should address the effects of different temperature intervals on geogrid performance and explore in depth how to select appropriate geogrids based on temperature changes. By optimizing the material selection and structural design of geogrids, it can be ensured that geogrids can provide the best service effect and long-term stability under low temperature, high temperature and temperature cycling. These studies are of great significance in promoting the sustainable development of marine engineering infrastructure. They can provide more accurate engineering parameters for the reasonable application of geogrids under various temperature conditions and provide a more scientific and practical reference for future engineering design.
Data availability statement
The original contributions presented in the study are included in the article/supplementary material, further inquiries can be directed to the corresponding author.
Author contributions
XF: Conceptualization, Investigation, Resources, Data curation, Writing – original draft, Writing – review and editing. JZ: Conceptualization, Investigation, Data curation, Writing – original draft, Writing – review and editing, Software. XY: Conceptualization, Resources, Writing – review and editing, Supervision. HZ: Writing – review and editing, Supervision, Software, Funding acquisition. DJ: Writing – original draft, Methodology, Supervision, Formal Analysis. WD: Writing – review and editing, Validation, Software. MC: Writing – review and editing, Supervision, Validation, Funding acquisition.
Funding
The author(s) declare that financial support was received for the research and/or publication of this article. The authors would like to acknowledge the consistent support of National Natural Science Foundation of China: Nos. 52471290, 52301327; Project funded by China Postdoctoral Science Foundation: Nos. 2024T170217, 2023M730929; Failure Mechanics and Engineering Disaster Prevention, Key Laboratory of Sichuan Province: No. FMEDP202209; Shanghai Sailing Program: Nos. 22YF1415800, 23YF1416100; Shanghai Natural Science Foundation: Nos. 23ZR1426200, 24ZR1427900; The Shanghai Soft Science Key Project: No. 23692119700; Funded by Key Laboratory of Ministry of Education for Coastal Disaster and Protection, Hohai University, No. 202302; Funded by Key Laboratory of Estuarine and Coastal Engineering, Ministry of Transport, No. KLECE202302.
Conflict of interest
Author HZ was employed by Henan Datong Yiyuan Real Estate Co.
The remaining authors declare that the research was conducted in the absence of any commercial or financial relationships that could be construed as a potential conflict of interest.
Generative AI statement
The author(s) declare that no Generative AI was used in the creation of this manuscript.
Publisher’s note
All claims expressed in this article are solely those of the authors and do not necessarily represent those of their affiliated organizations, or those of the publisher, the editors and the reviewers. Any product that may be evaluated in this article, or claim that may be made by its manufacturer, is not guaranteed or endorsed by the publisher.
References
Ahmad, H., and Mahboubi, A. (2021). Effect of the interfacial shearing stress of soil–geogrid interaction on the bearing capacity of geogrid-reinforced sand. Innov. Infrastruct. Solut. 6, 57–13. doi:10.1007/s41062-020-00430-8
Akosah, S., Zhou, L., Chen, J., Yao, T., and Gidigasu, S. (2025). Undrained dynamic behavior of geogrid-reinforced coral sand. Geotechnology 43 (2), 244–259. doi:10.1080/1064119x.2024.2326957
Ari, A., and Akbulut, S. J. C. (2024). Multiscale evaluation of sand-geomaterial interface shear response in terms of material geometry effects. Materials 450, 138765. doi:10.1016/j.conbuildmat.2024.138765
Cardile, G. (2023). “The road to resilience: advanced soil-geosynthetic interface characterization and its role in reinforcing soil structures for sustainability,” in Geosynthetics: leading the way to a resilient planet. CRC Press, 105–134.
Chai, J., Saito, A., and Hino, T. (2024). Effect of surface roughness on soil-geogrid/geotextile interface shear strengths. Int. J. Geosynth. Groun. 10, 43–49. doi:10.1007/s40891-024-00558-y
Chao, Z., Fowmes, G., Mousa, A., Zhou, J., Zhao, Z., Zheng, J., et al. (2024a). A new large-scale shear apparatus for testing geosynthetics-soil interfaces incorporating thermal condition. Geotext. Geomembr. 52, 999–1010. doi:10.1016/j.geotexmem.2024.06.002
Chao, Z., Li, Z., Dong, Y., Shi, D., and Zheng, J. (2024b). Estimating compressive strength of coral sand aggregate concrete in marine environment by combining physical experiments and machine learning-based techniques. Ocean. Eng. 308, 118320. doi:10.1016/j.oceaneng.2024.118320
Chao, Z., Shi, D., and Fowmes, G. (2023b). Mechanical behaviour of soil under drying–wetting cycles and vertical confining pressures. 11 (9), 714–724. doi:10.1680/jenge.22.00048
Chao, Z., Shi, D., Fowmes, G., Xu, X., Yue, W., Cui, P., et al. (2023a). Artificial intelligence algorithms for predicting peak shear strength of clayey soil-geomembrane interfaces and experimental validation. Geotext. Geomembranes 51, 179–198. doi:10.1016/j.geotexmem.2022.10.007
Chao, Z., Wang, H., Hu, S., Wang, M., Xu, S., and Zhang, W. (2024c). Permeability and porosity of light-weight concrete with plastic waste aggregate: experimental study and machine learning modelling. Constr. Build. Mater. 411, 134465. doi:10.1016/j.conbuildmat.2023.134465
Chao, Z., Wang, H., Zheng, J., Shi, D., Li, C., Ding, G., et al. (2024d). Temperature-dependent post-cyclic mechanical characteristics of interfaces between geogrid and marine reef sand: experimental research and machine learning modeling. J. Mar. Sci. Eng. 12, 1262. doi:10.3390/jmse12081262
Chao, Z., Zhao, H., Liu, H., Cui, P., Shi, D., Lin, H., et al. (2024e). The temperature-dependent monotonic mechanical characteristics of marine sand–geomembrane interfaces. J. Mar. Sci. Eng. 12, 2193. doi:10.3390/jmse12122193
Chao, Z., Zhou, J., Shi, D., and Zheng, J. (2025). Particle size effect on the mechanical behavior of coral sand–geogrid interfaces. Geosynth. Int., 1–17. doi:10.1680/jgein.24.00143
Chen, J., Akosah, S., Ma, C., and Gidigasu, S. S. (2023a). Large-scale triaxial tests of reinforced coral sand with different grain size distributions. Mar. Georesour. Geotec. 41, 544–554. doi:10.1080/1064119x.2022.2068462
Chen, J., Ren, X., Xu, H., Zhang, C., and Xia, L. (2022). Effects of grain size and moisture content on the strength of geogrid-reinforced sand in direct shear mode. Int. J. Geomech. 22, 04022006. doi:10.1061/(asce)gm.1943-5622.0002309
Chen, R., Zhao, T., Wu, Z., Hao, D., Xue, N., and Yuan, C. (2023b). Experimental investigation on particle breakage behavior of marine silica sand under high-stress triaxial shear. J. Mar. Sci. Eng. 11, 1825. doi:10.3390/jmse11091825
Chen, W., Xu, T., and Zhou, W. (2021). Microanalysis of smooth Geomembrane–Sand interface using FDM–DEM coupling simulation. Geotext. Geomembranes 49, 276–288. doi:10.1016/j.geotexmem.2020.10.022
Deng, Z., Zhou, L., Zhu, Z., Ma, L., Chen, J., Dai, F., et al. (2024). Study of the fracture properties of twin tunnel surrounds subjected to the coupling of dynamic and static loads. Theor. Appl. Fract. Mec. 130, 104308. doi:10.1016/j.tafmec.2024.104308
Fan, L., Zhu, Z., Sheng, Q., Zheng, J., and Dong, Y. (2025). Elaborate numerical analysis and new fibre Bragg grating monitoring methods for the ground pressure in shallow large-diameter shield tunnels: a case study of the yellow crane tower tunnel project. B. Eng. Geo. Environ. 84, 1–19. doi:10.1007/s10064-025-04088-3
Feng, X., Gong, B., Cheng, X., Zhang, H., and Tang, C. (2022). Anisotropy and microcrack-induced failure precursor of shales under dynamic splitting. Geomatics, Nat. Hazards Risk. 13, 2864–2889. doi:10.1080/19475705.2022.2137440
Feng, X., Gong, B., Liang, Z., Wang, S., Tang, C., Li, H., et al. (2024). Study of the dynamic failure characteristics of anisotropic shales under impact Brazilian splitting. Rock Mech. Rock Eng. 57, 2213–2230. doi:10.1007/s00603-023-03673-w
Feng, X., Liu, H., Wang, P., Zhang, S., Zhu, Q., Tang, C., et al. (2025). Failure behaviors of anisotropic shale with a circular cavity subjected to uniaxial compression[J]. J. Rock Mech. Geotech. 17(1):357–369. doi:10.1016/j.jrmge.2024.03.042
Francey, W., and Rowe, R. (2023). Stress crack resistance of unaged high-density polyethylene geomembrane fusion seams. Geosynth. Int. 30, 154–168. doi:10.1680/jgein.21.00027a
Gao, R., and Ye, J. (2023). Mechanical behaviors of coral sand and relationship between particle breakage and plastic work. Eng. Geol. 316, 107063. doi:10.1016/j.enggeo.2023.107063
Gao, R., and Ye, J. (2024). A novel relationship between elastic modulus and void ratio associated with principal stress for coral calcareous sand. Eng. G. 16 (3), 1033–1048. doi:10.1016/j.jrmge.2023.07.011
Gao, X., Tian, R., Yin, T., Torres, S. A. G., and Lei, L. (2024). Pore-scale freezing of a sandy saline soil visualized with micro-computed tomography. Process. P 35 (2), 109–124. doi:10.1002/ppp.2215
Han, J., and Jiang, Y. (2013). Use of geosynthetics for performance enhancement of earth structures in cold regions. Sci. Cold. Arid. Reg. 5, 517–529. doi:10.3724/sp.j.1226.2013.00517
Jin, H., Guo, L., Sun, H., Shi, L., and Cai, Y. (2022). Undrained cyclic shear strength and stiffness degradation of overconsolidated soft marine clay in simple shear tests. Ocean. Eng. 262, 112270. doi:10.1016/j.oceaneng.2022.112270
Karademir, T., and Frost, J. D. (2014). Micro-scale tensile properties of single geotextile polypropylene filaments at elevated temperatures. Geotext. Geomember. 42, 201–213. doi:10.1016/j.geotexmem.2014.03.001
Khan, R., and Latha, G. M. (2023). Multi-scale understanding of sand-geosynthetic interface shear response through Micro-CT and shear band analysis. Geotext. Geomembranes 51, 437–453. doi:10.1016/j.geotexmem.2023.01.006
Lahoori, M. S., Paumier, R., and Masrouri, F. (2021). Effect of monotonic and cyclic temperature variations on the mechanical behavior of a compacted soil. Eng. Geo. 290, 106195. doi:10.1016/j.enggeo.2021.106195
Li, A. L., and Rowe, R. K. (2008). Effects of viscous behavior of geosynthetic reinforcement and foundation soils on the performance of reinforced embankments. Geotext. Geomembranes 26, 317–334. doi:10.1016/j.geotexmem.2007.12.002
Liu, H., Feng, X., Liu, L., Li, T., and Tang, C. (2023). Mechanical properties and failure characteristics of anisotropic shale with circular hole under combined dynamic and static loading. Int. I. Rock Mech. Min. Sci. 170, 105524. doi:10.1016/j.ijrmms.2023.105524
Liu, H., Feng, X., Miao, S., Hu, J., Zhao, J., Zhang, Y., et al. (2024). Study on the dynamic fracture behavior of anisotropic CCNBD shale specimens under different impact angles. Theor Appl Fract Mec. 133, 104616. doi:10.1016/j.tafmec.2024.104616
Marcotte, B. A., and Fleming, I. R. (2022). Design guidance for protection of geomembrane liners in landfill applications. Can. Geotech. J. 59, 743–757. doi:10.1139/cgj-2021-0222
Oyegbile, B. O., and Oyegbile, B. A. (2017). Applications of geosynthetic membranes in soil stabilization and coastal defence structures. Int. J. Sus. Built. envir. 6, 636–662. doi:10.1016/j.ijsbe.2017.04.001
Peng, Y., Ding, X., Yin, Z. Y., and Wang, P. (2022). Micromechanical analysis of the particle corner breakage effect on pile penetration resistance and formation of breakage zones in coral sand. Ocean. Eng. 259, 111859. doi:10.1016/j.oceaneng.2022.111859
Rui, S., Zhang, H., Xu, H., Zha, X., Xu, M., and Shen, K. (2024). Seabed structures and foundations related to deep-sea resource development: a review based on design and research. Deep. Undergr. Sci. Eng. 3, 131–148. doi:10.1002/dug2.12042
Sajan, M. K., Chaudhary, B., Kotrabasappa, A. P., Kumar, S., and Sah, B. (2024). Novel techniques for reinforcing rubble-mound breakwater against tsunamis. J. Geotech. Geoenviron. 150, 04024002. doi:10.1061/jggefk.gteng-11773
Samanta, M., Bhowmik, R., and Khanderi, H. (2022). Laboratory evaluation of dynamic shear response of sand–geomembrane interface. Geosynth. Int. 29 (1), 99–112. doi:10.1680/jgein.21.00016a
Samea, A., and Abdelaal, F. (2023). Effect of elevated temperatures on the degradation behaviour of elastomeric bituminous geomembranes. Geotext. Geomemb. 51, 219–232. doi:10.1016/j.geotexmem.2022.10.010
Shao, W., Yue, W., Zhang, Y., Zhou, T., Zhang, Y., Dang, Y., et al. (2023). The application of machine learning techniques in geotechnical engineering: a review and comparison. Mathematics-Basel 11, 3976. doi:10.3390/math11183976
Shi, D., Niu, J., Zhang, J., Chao, Z., and Fowmes, G. (2023). Effects of particle breakage on the mechanical characteristics of geogrid-reinforced granular soils under triaxial shear: a DEM investigation. Geomech. Energy. Envir. 34, 100446. doi:10.1016/j.gete.2023.100446
Shirazi, S. G., Valipourian, K., and Golhashemand, M. R. (2019). A review on geomembrane characteristics and application in geotechnical engineering. Int. J. Civ. Envir. Eng. 13, 494–501. doi:10.5281/zenodo.3455659
Shoushtari, M. R., Lashkari, A., and Martinez, A. (2023). Effect of gas-oil contamination on the mechanical behavior of sand-woven geotextile interface: experimental investigation and constitutive modeling. Geotext. Geomembranes. 51, 56–71. doi:10.1016/j.geotexmem.2023.03.004
Shu, Z., Gan, X., Xie, J., Dai, Z., and Li, Z. (2025). A macroscopic peridynamic approach for glulam embedment failure simulations. 112587.
Wang, A., and Zhang, D. (2020). Lateral response and failure mechanisms of rigid piles in soft soils under geosynthetic-reinforced embankment. Int. J. Civ. Eng. 18, 169–184. doi:10.1007/s40999-019-00434-1
Wang, H., Liu, T., Zhang, Z., Zou, D., Zhou, A., and Li, Y. (2024). Durability of SFCB reinforced low-alkalinity seawater sea sand concrete beams in marine environment. Eng. Struct. 317, 118616. doi:10.1016/j.engstruct.2024.118616
Wang, J., Zhang, L., Tang, Y., and Huang, S. (2021). Influence of reinforcement-arrangements on dynamic response of geogrid-reinforced foundation under repeated loading. Constr. Build. Mater. 274, 122093. doi:10.1016/j.conbuildmat.2020.122093
Wang, Y., Liu, Z., Jin, C., Lu, L., and Bai, M. (2023). Experimental study on the preparation and physical thermal performance of coral sand-based phase change material concrete composites. Constr. Build. Mater. 389, 131631. doi:10.1016/j.conbuildmat.2023.131631
Wang, P., Xu, C., Yin, Z., Song, S., Xu, C., and Dai, S. (2024). A DEM-based generic modeling framework for hydrate-bearing sediments. Comput Geotech. 171, 106287. doi:10.1016/j.compgeo.2024.106287
Wang, T., Wang, P., Yin, Z., Laouafa, F., and Hicher, P. (2024). Hydro-mechanical analysis of particle migration in fractures with CFD-DEM. Eng Geol. 335, 107557. doi:10.1016/j.enggeo.2024.107557
Wang, T., Wang, P., Yin, Z.-Y., Zhang, F., and Xu, C. (2025). DEM-DFM Modeling Suffusion of Granular Soils under Triaxial Compression. Int J Geomech. 25 (2), 04024352. doi:10.1061/IJGNAI.GMENG-10162
Wu, J., Ye, X., Li, J., and Li, G. (2019). Field and numerical studies on the performance of high embankment built on soft soil reinforced with PHC piles. Comput. Geotech. 107, 1–13. doi:10.1016/j.compgeo.2018.11.019
Wu, Q., Liu, Q., Zhuang, H., Xu, C., and Chen, G. (2022). Experimental investigation of dynamic shear modulus of saturated marine coral sand. Ocean. Eng. 264, 112412. doi:10.1016/j.oceaneng.2022.112412
Wu, Y., Li, N., Wang, X., Cui, J., Chen, Y., Wu, Y., et al. (2021). Experimental investigation on mechanical behavior and particle crushing of calcareous sand retrieved from South China Sea. Eng. Geol. 280, 105932. doi:10.1016/j.enggeo.2020.105932
Ye, J., and Gao, R. (2024). Isotropic compression and triaxial shear characteristics of coral sand under high confining pressure and related particle breakage. 1–17. doi:10.1680/jgeot.24.01260
Ye, J., Haiyilati, Y., Cao, M., Zuo, D., and Chai, X. (2022). Creep characteristics of calcareous coral sand in the South China Sea. Acta Geotech. 17 (11), 5133–5155. doi:10.1007/s11440-022-01634-1
Ye, J., Zhang, Z., and Shan, J. (2019). Statistics-based method for determination of drag coefficient for nonlinear porous flow in calcareous sand soil. Environ. t. 78, 3663–3670. doi:10.1007/s10064-018-1330-6
Keywords: temperature, geogrid, marine silica sand, silica sand-geogrid interface, shear test, static interface interaction
Citation: Feng X, Zhang J, Yao X, Zhao H, Jiang D, Duan W and Cai M (2025) Influence of temperature on the static interface interaction of marine silica sand and geogrid. Front. Earth Sci. 13:1600985. doi: 10.3389/feart.2025.1600985
Received: 27 March 2025; Accepted: 18 April 2025;
Published: 14 May 2025.
Edited by:
Bin Gong, Brunel University London, United KingdomReviewed by:
Yang Lu, Hohai University, ChinaHaoyu Han, Yunnan University, China
Feiyang Wang, Donghua University, China
Copyright © 2025 Feng, Zhang, Yao, Zhao, Jiang, Duan and Cai. This is an open-access article distributed under the terms of the Creative Commons Attribution License (CC BY). The use, distribution or reproduction in other forums is permitted, provided the original author(s) and the copyright owner(s) are credited and that the original publication in this journal is cited, in accordance with accepted academic practice. No use, distribution or reproduction is permitted which does not comply with these terms.
*Correspondence: Haiyang Zhao, emhhb2hhaXlhbmdoYWlAMTI2LmNvbQ==
†These authors have contributed equally to this work