 Daniel Falaschi
 Jan Blöthe
 Etienne Berthier
 Takeo Tadono
 Ricardo Villalba
- 1Instituto Argentino de Nivología, Glaciología y Ciencias Ambientales, CCT-CONICET, Mendoza, Argentina
- 2Institute of Environmental Social Sciences and Geography, University of Freiburg, Freiburg, Germany
- 3Laboratoire d’Etudes en Géophysique et Océanographie Spatiales, Université de Toulouse, CNES, CNRS, IRD, UPS, Toulouse, France
- 4Earth Observation Research Center (EORC), Japan Aerospace Exploration Agency (JAXA), Ibaraki, Japan
- 5Cape Horn International Centre (CHIC), Puerto Williams, Chile
Glaciers and rock glaciers are essential components of the cryosphere in the Andes of Argentina and Chile, serving as significant freshwater reservoirs and playing a crucial hydrological role as the region experiences warming and drying trends. Although the climate response of glaciers and rock glaciers can be different, studies evaluating simultaneous changes in both glaciers and rock glaciers remain scarce. Here, we analyze glacier geodetic mass balance and rock glacier surface elevation changes in the Monte San Lorenzo in Central Patagonia during 2018–2023, using sub-meter Pléiades digital elevation models (DEMs). Our findings reveal a record glacier mass loss rate (−1.49 m ± 0.16 w.e. a−1), the highest recorded in the past 60 years for this region. Elevation changes in the six studied rock glaciers ranged from slightly negative to moderately positive (+0.27 ± 0.88 m to −0.46 ± 0.81 m), with their distribution patterns suggesting the occurrence of ʿice-debris complexesʾ. Additionally, we present the first (2008–2023) rock glacier kinematic assessment in the Patagonian Andes applying feature-tracking to Pléiades and ALOS PRISM satellite images, and find median velocities ranging between 0.14 m a−1 and 0.43 m a−1. While glaciers in the region showed unprecedented negative mass balance conditions since the mid-20th century -coinciding with rising air temperatures and declining precipitation- rock glacier velocities have remained relatively stable across the two sampled epochs (2008–2018 and 2018–2023). The different response of glaciers and rock glaciers reflects the particular response mechanisms and timing in which each of them couples with the climate.
1 Introduction
Andean glaciers have been major contributors to sea-level rise since the early 21st century (Braun et al., 2019; Dussaillant et al., 2019; Hugonnet et al., 2021), with significant mass loss concentrated in the Patagonian Icefields (Abdel Jaber et al., 2019; Dussaillant et al., 2018; Braun et al., 2019; Minowa et al., 2021; McDonnell et al., 2022). The glaciers within the Icefields have exhibited varying responses to climate variability due to overlapping climatic and dynamic drivers (Ryan et al., 2018; Abdel Jaber et al., 2019; Bown et al., 2019). The pattern of rapidly receding and thinning calving glaciers, in comparison to the more stable land-terminating ones, has been also observed in the smaller mountain glaciers on the periphery of the Patagonian Icefields (e.g., Masiokas et al., 2015; Falaschi et al., 2017, 2019).
Rock glaciers are permafrost creep features that shape the periglacial environment in several mountain ranges worldwide (Barsch, 1996; Janke and Bolch, 2022). As cryo-conditioned landforms (Berthling, 2011), these ice-debris masses are sensitive to changing temperature and thus help to better understand the impact of ongoing climate change. In this context, the Global Climate Observing System (GCOS) initiative has included Rock Glacier Velocity (RGV) as a product for the Essential Climate Variable (ECV) permafrost (WMO, 2022). However, data on the velocity of rock glacier in the Andes remain scarce, especially outside of the Dry Andes (Blöthe et al., 2021, 2025; Vivero et al., 2021; Bertone et al., 2022), where they outnumber glaciers (Zalazar et al., 2020). In Patagonia, rock glaciers exist in the lower, less glacierized mountains east of the Patagonian Icefields (Falaschi et al., 2015; Masiokas et al., 2015; Selley et al., 2019), yet their activity and climatic response remain poorly understood, offering vast, unexplored potential for rock glacier research (Hu et al., 2025).
Glaciers and rock glaciers respond differently to climate variability. On the one hand, atmospheric warming and feedback mechanisms, such as water infiltration into the shear horizon, promotes permafrost degradation and subsequent rock glacier acceleration (e.g., Cicoira et al., 2019a, 2019b). On the other hand, climate fluctuations drive changes in the accumulation and ablation of a glacier, affecting its mass budget. While changes in glaciers and rock glaciers are indicative of a changing climate in the Andean Cryosphere (Masiokas et al., 2020), few studies have previously addressed these landforms together (Robson et al., 2022). In this study, we use two Pléiades-derived Digital Elevation Models (DEMs) stemming from the Pléiades Glacier Observatory (PGO) programme to assess the geodetic mass balance of Monte San Lorenzo (47°S) between 2018 and 2023, extending an existing 60-year record (Falaschi et al., 2019). In addition, we use feature tracking on Pléiades and ALOS PRISM imagery, to derive surface velocity data for six rock glaciers (0.1–1.2 km2) from 2008 to 2023, providing the first assessment of their velocity in the Patagonian Andes.
2 Study area
Monte San Lorenzo (47°35′S, 72°18′W, 3,706 m a.s.l., Figure 1A) lies in a transitional maritime-to-continental climate, shaped by a strong west-east orographic precipitation gradient and a less pronounced temperature contrast across the main water divide, resulting in glaciers with varying thermal regimes. Cold-based ice is common above 1800 m a.s.l., while warm-based ice is present in the lower parts of debris-covered valley glaciers (Martin et al., 2022).

Figure 1. (A) Annual elevation change map around Monte San Lorenzo between 22 February 2018 and 20 March 2023. (B) Main statistics over stable terrain after corrections. (C) and (D) show the glacier area distribution and average elevation changes as a function of elevation for the four largest glaciers (C) and the total glacier area (D) in the study site.
Since the mid-20th century, air- and satellite-borne imagery and DEMs have revealed high mass loss rates and other signs of glacier wastage, including rising altitudes of end-of-summer snowlines, expanding ice-cliff and proglacial lake areas (Falaschi et al., 2019, 2021). The latest glacier inventory reports a total area of ∼127 km2, comprising the largest, mostly debris-free Calluqueo Glacier (∼50 km2), three debris-covered valley glaciers (Río Oro, 15.3 km2; Río Lácteo, 11.7 km2; San Lorenzo Sur, 19.5 km2), and over 60 smaller mountain glaciers (Falaschi et al., 2019).
Intact rock glaciers (containing ice-rich permafrost) cover 1.4% of the area above the estimated lower limit of discontinuous permafrost (1,400 m) in the region (Falaschi et al., 2015). Most rock glaciers are small in size (0.09 km2 on average), tongue-shaped (63%), and classified as “debris rock glaciers” (55%) following Barsch (1996). In relation to their upslope spatial connection (Rock glacier inventories and kinematics, 2023), they are primarily talus- or debris-mantled slope-connected.
3 Data and methods
3.1 Glacier and rock glacier outlines
We use the 2018 glacier outlines from Falaschi et al. (2019), drawn manually on ArcGIS on the basis of the 22 February 2018 Pléiades scene. Because the geodetic mass balance of rapidly receding glaciers is particularly sensitive to unaccounted area changes (Florentine et al., 2023), we revised the 2018 glacier outlines and adapted them by visual inspection of the 20 March 2023 scene.
For the purpose of feature tracking in optical imagery, we rely on rock glacier polygons available from Nansen and Belgrano catchment reports published in the National Glacier Inventory of Argentina (ING, Zalazar et al., 2020). We chose to use the ING outlines over the rock glacier inventory by Falaschi et al. (2015) because the ING follows a restricted mapping approach (Rock glacier inventories and kinematics, 2023). This allows us to emphasize the analysis on the rock glacier surfaces, dismissing rock glacier lateral margins and front talus, where image matching is less successful. To simplify the rock glacier name coding used in the ING in this study, we renamed the six investigated rock glaciers to Penitentes I-VI (Penitentes VI was not mapped in the ING), as per the Penitentes peak where the landforms are located.
3.2 Orthoimages and digital elevation models derived from the ALOS PRISM and Pléiades satellites
We assessed surface velocities of 6 rock glaciers (accounting for a total area of 2.9 km2) for two epochs, i.e., between 29 March 2008 and 22 February 2018 (EP1), and between the latter and 20 March 2023 (EP2). For the initiation time of EP1 we used the 2.5 m resolution ALOS PRISM scene originally utilized by Falaschi et al. (2015) to produce a local rock glacier inventory. This ortho-image was generated using the DSM and Ortho-image Generation Software of the Japan Aerospace Exploration Agency with no terrain-surveyed ground control points (GCPs). The reader is referred to Falaschi et al. (2015) for full technical details and validation.
In addition to the ALOS PRISM dataset, we used two sub-meter Pléiades orthomosaics and Digital elevation Models (DEMs) at 0.5 m spatial resolution and 2 m ground-sampling distance, respectively, acquired on 22 February 2018 and 20 March 2023, and available from the Pléiades Glacier Observatory program (Berthier et al., 2024; LEGOS and OMP, 2024). Tested globally over mountainous terrain, the low uncertainty level (˂1 m, Berthier et al., 2014) of the very-high-resolution (VHR) Pléiades stereo imagery has allowed for robust assessments of glacier elevation changes at short (even annual to seasonal) time steps in various mountain ranges (e.g., Belart et al., 2017; Beraud et al., 2023; Berthier et al., 2024; Falaschi et al., 2023a).
3.3 DEM differencing and glacier geodetic mass balance
The PGO standard procedure allowed us to assess glacier geodetic mass balance in Monte San Lorenzo between 22 February 2018 and 20 March 2023. The PGO workflow includes DEM coregistration, differencing and correction of systematic biases (see Berthier et al., 2024 and references therein). During further processing of the PGO data, we defined as outliers those cells in the elevation change grid maps exceeding ± 100 m and removed them accordingly. In DEM differencing, any data voids in the source DEMs are inevitably inherited by the derived elevation change grids. For our 2018–2023 Pléiades-derived elevation change grids in Monte San Lorenzo, data voids accounted for 1.5% of the glacier area. Within glacier ice area only (i.e., not over rock glaciers), we followed a global hypsometric approach (McNabb et al., 2019) to fill in these data voids, applying a fifth-degree polynomial fit to the elevation changes on 50 m elevation bins. Once all the above corrections were implemented, we derived time-averaged glacier- and region-wide elevation change rate values (dh/dt) at pixel scale.
The volumetric change Δv (m3) over the investigated time interval dt is then calculated as the product of the individual pixels dhi (summed over the total pixel number covering the glacier area) and the cell size r of the dh/dt grid:
We then calculated the annual glacier-wide mass balance Δm (in m w.e. a−1) using a density conversion factor ρ of 850 ± 60 kg m-3. This value is technically sound in geodetic assessments considering periods longer than 5 yrs and significant volume changes (Huss, 2013):
where Ᾱ is the mean glacier area calculated over the intervening time dt.
To calculate the volumetric mass balance uncertainty and overall uncertainty in mass budget, we follow the method described in Falaschi et al. (2023b), which uses an error propagation approach, considering the uncertainties in glacier area, elevation change and the volume to mass conversion factor. A full description of the calculation of the involved uncertainties and other consideration of biases can be found in Supplementary Section S1.
3.4 Feature tracking in optical imagery and kinematic characterization of rock glaciers
We derived surface velocities of 5 rock glaciers from 30 March 2008 to 22 February 2018 (EP1) and 6 rock glaciers from 22 February 2018 to 20 March 2023 (EP2) using the Environmental Motion Tracking software (EMT Version 0.93 - Schwalbe and Maas, 2017) and a feature tracking approach in optical imagery as described in Blöthe et al. (2025). While using the original resolution of the Pléiades imagery for tracking surface velocities for EP2, we resampled the ALOS PRISM and Pléiades imagery for EP1 to a common resolution of 2.5 m. For computational efficiency, we subdivided the study area into a northern and southern section, containing the rock glaciers Penitentes I to IV, and Penitentes V and VI, respectively (Supplementary Figure S1). To enhance rock glacier surface structures such as ridges and furrows for feature tracking in optical data recorded by different sensors, we applied a near anisotropic orientation filter during pre-processing (see Van Wyk de Vries and Wickert, 2021; Blöthe et al., 2025 for details). The workflow initially matches image patches from a reference to a secondary image utilizing cross-correlation, followed by a least squares matching (LSM) algorithm to achieve sub-pixel accuracies. For feature tracking, we defined object points as spaced 2.5 (EP2) and 5.0 m (EP1) in x and y directions within grids based on rock glacier outlines. We discarded object point displacements where correlation coefficients lay below 0.75. To account for positional mismatches between image pairs, EMT calculates an affine transformation model based on a set of 1,000 object points that were randomly distributed outside rock glacier polygons. To quantify the residual positional errors, we tracked a second set of 1,000 randomly distributed object points after applying the affine transformation. The Limit of Detection (LoD; Supplementary Table S2, Supplementary Figure S2) was then defined as the median of residual mismatches between image pairs, and is used to discern significant from non-significant displacements.
Recently, the Rock Glacier Inventory and Kinematics working group of the International Permafrost Association developed the Moving Area (MA) concept to identify areas of spatially homogeneous velocities within rock glaciers (Rock glacier inventories and kinematics, 2023). The MAs are used to assign a consistent kinematic attribute to a given rock glacier (active, transitional, relict), based on a predefined classification scheme. On the basis of the derived displacements, we transformed them to surface velocity rasters and subsequently classified them into the velocity classes as defined by the RGIK initiative (Rock glacier inventories and kinematics, 2023). Because the velocity field distribution of a single rock glacier can be highly variable, we set 0.01 km2 as the MA minimum area, and considered rock glaciers as actively moving when at least one MA showed surface velocities above the corresponding Limit of Detection.
4 Results
4.1 2018–2023 glacier mass budget and rock glacier elevation changes
The region-wide geodetic mass balance (71 glaciers, 132.34 km2) around Monte San Lorenzo (Figures 1A, B) over the 2018–2023 period was −1.49 m ± 0.16 w.e. a−1, and the overall volume loss amounted to 225.9 ± 17.8 × 10⁶ m3 a−1 (Supplementary Table S2). To provide a sense of homogeneity in glacier mass balance, the non-area weighted average was −1.41 ± 0.16 w.e. a−1, and the standard deviation (spread in mass balance among individual glaciers) was 0.73 w.e. a−1. Among the larger sampled glaciers (i.e., ˃1 km2) Río Lácteo showed the most negative mass budget (−3.02 ± 0.22 w.e. a−1). Significantly, the mean elevation change over 50 m elevation intervals (Figure 1D) shows thinning through the full altitudinal range of glacier ice in Monte San Lorenzo (450–3,700 m). Contemporarily, the total glacier area shrunk from 132.3 km2 to 125.9 km2 (∼1% a−1).
Regarding rock glacier elevation changes, we found that on average, three sampled rock glaciers (Penitentes III-V) showed slightly positive elevation changes (up to +0.27 ± 0.88 m at Penitentes IV) between 2018 and 2023, whereas the remaining three (Penitentes I, II and VI) underwent surface lowering overall (Table 1), with a negative peak of −0.46 m at Penitentes VI.
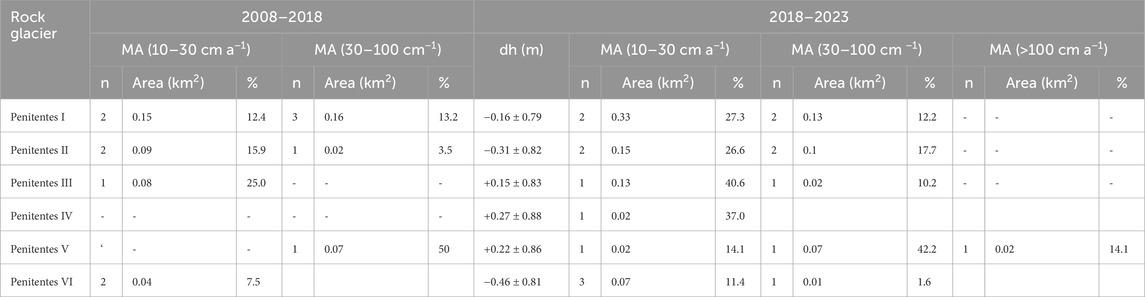
Table 1. Summary of Moving Area number and area on individual rock glaciers. The numbers in brackets denote the percentage of a given velocity class associated with a MA with respect to the total rock glacier area.
4.2 Rock glacier surface velocities
Our feature tracking results indicate active movement exceeding the Limit of Detection for all investigated rock glaciers (Figure 2). For EP1, the Limit of Detection falls between 0.11 and 0.14 m a−1, while being lower for EP2 with Limit of Detection values falling between 0.09 and 0.10 m a−1. We identified 12 and 18 Moving Areas with velocities higher than the Limit of Detection for EP1 and EP2, respectively (Table 1), which account for 22.9% and 39.4% of the total rock glacier area. While no Moving Areas with velocities ˃1 m a−1 were detected in EP1, Penitentes V attained the maximum velocity (1.1 m a−1) during EP2, and included the (single) Moving Area with the highest velocity class (1–3 m a−1), covering 14.1% of its total area. Velocities in the range of 10–30 cm a−1 were the most abundant in absolute number (n = 6 and 11) and area (13.3% and 31% of the total rock glacier area) in both EP1 and EP2. Mean velocities of individual rock glaciers ranged from 0.20 m a−1 to 0.47 m a−1 in EP1 and from 0.14 m a−1 to 0.52 m a−1 in EP2, while median velocities varied from 0.16 m a−1 to 0.42 m a−1 in EP1 and from 0.14 m a−1 to 0.43 m a−1 in EP2.
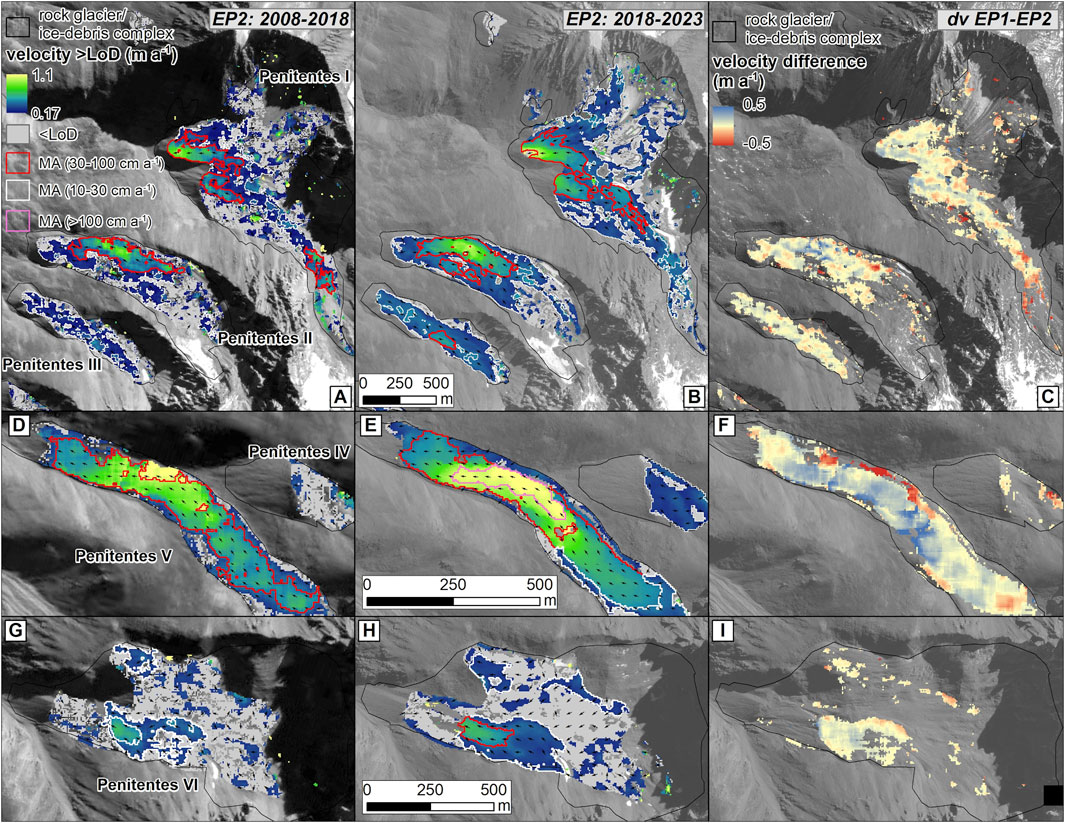
Figure 2. Rock glacier velocities between 2008 and 2018 (A,D,G) and between 2018 and 2023 (B,E,H) and velocity difference between the two epochs (C,F,I). Background: ALOS PRISM (2008) and Pléiades © CNES 2018 and 2023, Distribution Airbus D&S.
5 Discussion
5.1 Accelerated wastage of glaciers in Monte San Lorenzo
From a sample of the 18 largest glaciers (covering 95% of the total glacier area), all but one show more negative mass budgets in 2018–2023 than during 2000–2018. Dedo Soto Glacier (0.9 km2) is the only exception, with a much more negative mass balance in 2012–2018 (−1.90 ± 0.16 m w.e. a−1; Falaschi et al., 2019) than in 2018–2023 (−0.87 ± 0.13 m w.e. a−1). The region-wide 2018–2023 mass budget (−1.49 ± 0.16 m w.e. a−1) was twice as negative as in 2000–2012 (−0.69 m w.e. a−1) and nearly three times more negative than in 2012–2018 (−0.58 ± 0.19 m w.e. a−1). This reflects the close relation between summer air temperatures and glacier mass balance (Falaschi et al., 2019; Supplementary Figure S1 in this study). Furthermore, the 2018–2023 mass balance of the three largest valley glaciers was almost twice as negative as the 1958–2018 average (Falaschi et al., 2019; Supplementary Table S2). Although some elevation gains are observable in the upper parts of Río Oro, Río Lácteo and San Lorenzo Sur glaciers (Figure 1C), we put forward that these are most probably owed to DEM artefact in almost vertical terrain that are later transferred to the resulting elevation change grids.
Our 2018–2023 geodetic results provide the most up-to-date glacier mass change assessment at the periphery of the Patagonian Icefields, but confirming recent trends elsewhere in the Patagonian Andes remains challenging. The closest ongoing glaciological mass balance program, conducted by the ING since 2013, monitors Glaciar de los Tres in the Fitz Roy massif (∼200 km south of Monte San Lorenzo). There, unpublished data indicate a similar doubling of mass loss rates between 2018 and 2023 (−1.19 m w.e. a−1) compared to −0.64 m w.e. a−1 during 2013–2018 (WGMS, 2023; Pierre Pitte, personal comm.).
The analysis of temperature and precipitation records from the Balmaceda weather station (180 km South of Monte San Lorenzo, but representative of the overall climate conditions at Monte San Lorenzo, see Falaschi et al., 2019) reveals an annual temperature increase of 0.12 °C per decade and a precipitation decrease of 28 mm/d between 1963 and 2024 (Supplementary Figure S1). The mass balance of the San Lorenzo glaciers with the longest existing record (San Lorenzo Sur and Río Lácteo) appear nevertheless to be driven mainly by summer (Oct-Mar) temperatures (0.17°C/d), as shown by the Spearman Rank Order correlations in Supplementary Figure S1. While both winter and summer precipitation have decreased, the correlation between annual precipitation and glacier mass balance is not significant (rs = 0.7 at p < 0.05). Because further increases in air temperatures are projected in the area around the Patagonian Icefields (Bravo et al., 2021), it is critical to actively monitor ongoing changes in the cryosphere in the region.
5.2 Elevation changes in rock glaciers: rock glaciers or “ice-debris complexes”?
As outlined in Section 4.1, Penitentes III–V exhibited slight elevation gains, whereas, Penitentes I, II, and VI experienced slight elevation losses (Table 1). We stress here, however, that none of these changes are statistically significant (i.e., greater than the uncertainty). Nonetheless, it is telling to us that rock glaciers with an average positive elevation change are found in narrow gullies stripped of glacier ice, where rocky material can be avalanched from the surrounding slopes. Rock debris can detach from the headwall and linger on the surface of rock glaciers, later to be carried down the valley (Lehmann et al., 2022). This rock glacier configuration and associated nourishment mechanism are consistent with observations from other sites in the Andes, where positive elevation changes have been attributed to debris accumulation (Robson et al., 2022). On the contrary, rock glaciers with average surface lowering are comparatively larger and located in wider valleys with an upslope glacier connection. We put forward that during their interaction with glaciers, likely during the Little Ice Age, these rock glaciers might have accumulated significant amounts of ice in their upper sections. As ice was later covered by debris and is presently melting, this configuration led to negative elevation changes, similarly to what has been observed in other alpine settings (e.g., Vivero and Lambiel, 2024; Wee et al., 2024).
A closer look into the ‘raw’ (i.e., uncorrected for data voids) rock glacier elevation change maps, however, reveals that individual rock glaciers do show substantial changes over specific areas (Figures 3A–I). Unlike glaciers, which consistently thinned across all elevations (Figure 1C), some rock glaciers (Penitentes I, II, VI) experienced surface lowering (up to 10 m) only in their uppermost parts, where debris-free ice is present (Figure 3-a-). Below this, elevation changes remain within ±0.5 m, except in thermokarst ponds and ice-cliff depressions typical of debris-covered ice (Figure 3-b-). Further downslope, some elevation change maps reveal the downward movement of longitudinal and transverse furrows and ridges (Figure 3-e-). At the terminus, the advancing front of Penitentes I shows elevation gains exceeding 2 m (Figure 3-c-), and resembles the conveyor caterpillar-like advance mechanism of rock glaciers (Kääb and Reichmuth, 2005) probably unrelated to glaciers. Occasionally, rock glacier fronts display localized surface lowering (which we interpret as partially collapsed or eroded fronts), alongside adjacent areas of elevation gains, corresponding to the material mobilized and deposited immediately underneath (Figure 3-f-).
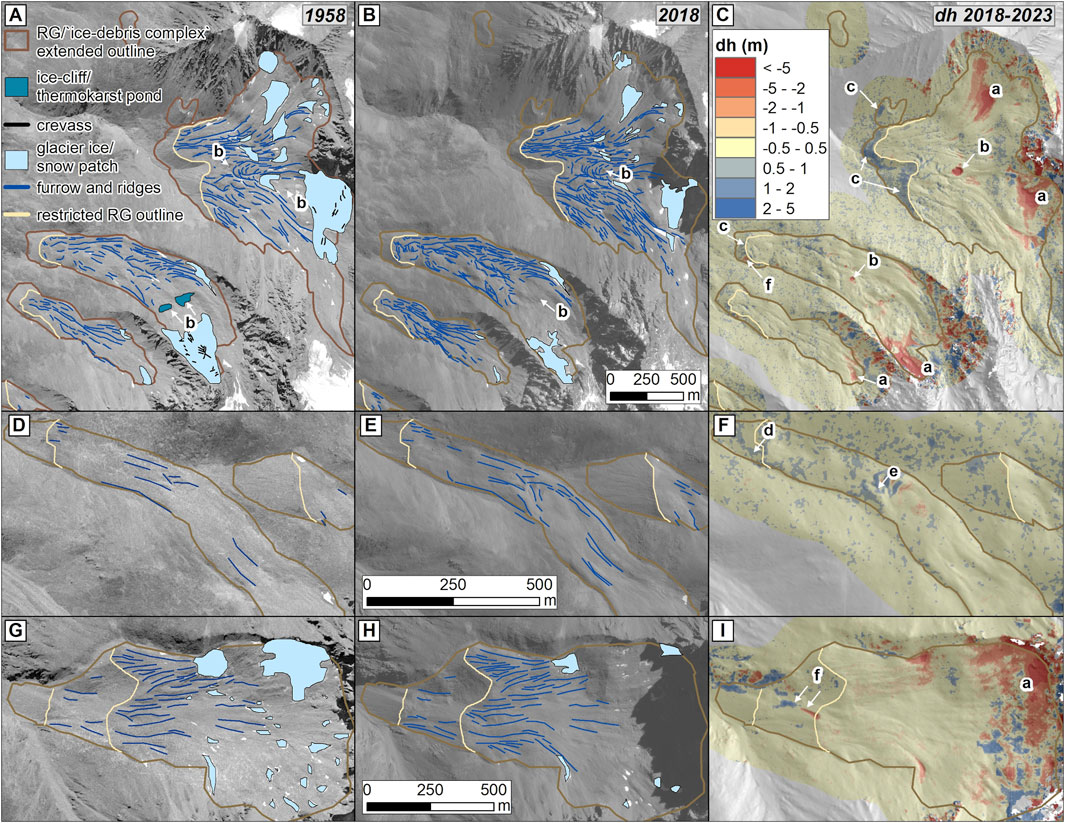
Figure 3. Surface characteristics of the investigated rock glaciers in 1958 (background orthophoto stems from Falaschi et al., 2019) (A,D,G) and 2018 (B,E,H) and 2018–2023 elevation change maps (C,F,I). Note the reduction in glacier ice area in coincidence with areas depicting substantial surface lowering. Background: orthorectified aerial photos (1958) and Pléiades © CNES 2018, Distribution Airbus D&S.
Ice-debris complexes are ice-debris landforms in close proximity to glaciers and may include several elements such as rock glaciers in various stages of activity, ice-cored moraines and also debris-covered stagnant ice bodies. Elevation changes in ice-debris complexes in regions exhibiting negative glacier mass balance often show significant surface lowering due to sub-debris ice melt in their upper parts and a greater stability towards their fronts (Bolch et al., 2019). The observed elevation change patterns in Monte San Lorenzo resemble those of ice-debris complexes with actively moving rock glacier-type fronts, as documented in the Andes and other mountain regions in the World (Monnier and Kinnard, 2017; Meng et al., 2023). ‘Typical’ rock glaciers, lacking clear connections to debris-covered or debris-free ice, rarely exhibit surface lowering of magnitudes of up to 20 m per decade (Groh and Blöthe, 2019; Cusicanqui et al., 2021; Fleischer et al., 2021, 2023). While such ice-debris complexes are well-documented in the drier central Andes (Blöthe et al., 2021; Villarroel et al., 2021; Robson et al., 2022), their presence in the more humid Central Patagonia had only been suggested based on geomorphological interpretation of high-resolution imagery (Falaschi et al., 2015; Zalazar et al., 2020). When observing landforms of analogous characteristics in the Jeinemeni district (∼80 km north of Monte San Lorenzo), Selley et al. (2019) attributed their potential origin to former glaciers that experienced highly negative mass balances since the Little Ice Age and are presently transitioning into rock glaciers (Monnier and Kinnard, 2015; 2017). While observed velocities and elevation changes support this, detailed geophysical analyses of internal structure and ice content are needed (Bolch et al., 2019; Petersen et al., 2020; Villarroel et al., 2021) to better understand the formation and evolution of these landforms in the Patagonian Andes. This could, in turn, provide insight into the geomorphological evolution of deglacierising mountain regions under future climate change.
From a methodological perspective, the high vertical precision of Pléiades-derived DEMs allows for detecting elevation and geomorphological changes in rock glaciers and ice-debris complexes, even when these changes are smaller than glacier thinning processes. While higher-resolution techniques like UAV surveys or Terrestrial Laser Scanning (Abermann et al., 2010; Zahs et al., 2019; Vivero et al., 2022) can capture finer rock glacier dynamics at seasonal or annual scales, very-high-resolution satellite photogrammetry remains effective for pluri-annual to sub-decadal investigations. Thus, Pléiades data are increasingly being used to monitor rock glaciers and ice-debris landforms in addition to glaciers, particularly in semi-arid regions where these landforms coexist (e.g., Robson et al., 2022; Cusicanqui et al., 2024; Wood et al., 2025).
5.3 Changes in rock glacier velocities through time
By comparing the rock velocity maps from EP1 and EP2 (Figures 2C,F,I), we found that only a small proportion of the rock glacier area exhibited velocity changes that exceeded the EP1-EP2 difference Limit of Detection (Supplementary Table S2). Merely 4% of the total rock glacier area (and 10% of the area successfully tracked in both epochs) shows velocity increases ˃LoD. Similarly, velocity decreases ˂LoD were observed in less than 4% of the total rock glacier area and 9% of the common tracked areas. An exception is Penitentes V, where 21% of the total area and 29% of the successfully tracked areas showed velocity increases ˃LoD.
Despite significant warming documented in the Monte San Lorenzo area (Falaschi et al., 2019; Supplementary Figure S2), and a significant acceleration in glacier loss revealed in our data, rock glacier velocities remain stable since 2008 (within our detection limit), though our sample size remains somewhat small. While long-term data on rock glacier kinematics in the Andes is scarce and sample sizes vary across previous studies, findings remain mixed—some suggest widespread acceleration, while others indicate largely unchanged velocities (Vivero et al., 2021; Blöthe et al., 2025; Cusicanqui et al., 2024). The above findings are not surprising, since permafrost reacts in a much delayed and attenuated way and constitutes a longer-term indicator to climatic changes compared to glaciers (Kääb et al., 2007). Specifically, increasing air temperature, reduced ground-insulating snow cover, and concomitant increase in liquid water availability are regarded as the primary factors affecting permafrost temperatures and the deformation rate of frozen debris (Cicoira et al., 2021; Kääb and Røste, 2024). In addition, and unlike glaciers, which primarily respond to climate forcing, rock glacier dynamics is influenced by complex energy transfer processes and thermo-hydro-mechanical properties that affect heat conduction and storage in the ground (Wirz et al., 2016; Pruessner et al., 2018; Cicoira et al., 2019a). More so, thermal inertia and insulation effects of surface layers (e.g., snow) contribute to the delayed response of permafrost to climatic changes (Murton, 2021).
6 Conclusion
This study provides the most up-to-date assessment of glacier mass balance as well as the first assessment of rock glacier dynamics in the Patagonian Andes. Our results reveal a significant acceleration in glacier mass loss between 2018 and 2023, with the mass budget (−1.49 m ± 0.16 w.e. a−1) nearly twice as negative as in the previous six decades. This intensified glacier wastage aligns with regional trends of increasing summer air temperatures (+0.17 °C/decade) and decreasing annual precipitation (−28 mm/decade) observed in nearby instrumental records since 1963. Regarding rock glaciers, some exhibited surface elevation gains, while others showed overall lowering. We attribute the positive elevation changes to debris accumulation in narrow, glacier-stripped gullies, and the negative changes to larger rock glaciers in wider valleys with upslope glacier connections and presumably lower debris production (2008–2023). In addition to this, our findings confirm that all six investigated rock glaciers are actively moving, though significant acceleration or deceleration (i.e., ± the Limit of Detection) were detected for less than 10% of the tracked rock glacier area during the study period. The identification of moving areas and the classification of rock glacier kinematics around Monte San Lorenzo, following international standards by the International Permafrost Association, will serve as a valuable baseline for future monitoring efforts. Overall, this study highlights the need for continued high-resolution geodetic assessments to refine our understanding of glacier evolution in the Patagonian Andes. Moreover, given the spatio-temporal variability in surface elevation changes and the lack of a consistent acceleration or deceleration signal in rock glacier surface velocity over the 2008–2023 time interval, further research is essential to evaluate the long-term impacts of climate change on these landforms in Patagonia.
Data availability statement
The datasets presented in this study can be found in online repositories. The names of the repository/repositories and accession number(s) can be found below: Falaschi, D., Blöthe, J., and Berthier, E. (2025). 2008–2023 glacier elevation change and rock glacier velocity in Monte San Lorenzo, Patagonia [Data set]. Zenodo. https://doi.org/10.5281/zenodo.15084949.
Author contributions
DF: Methodology, Writing – review and editing, Conceptualization, Investigation, Writing – original draft, Formal Analysis, Visualization. JB: Formal Analysis, Investigation, Methodology, Writing – review and editing. EB: Writing – review and editing, Methodology, Investigation, Formal Analysis. TT: Writing – review and editing, Methodology. RV: Writing – review and editing, Visualization, Formal Analysis.
Funding
The author(s) declare that no financial support was received for the research and/or publication of this article.
Acknowledgments
The Japan International Cooperation Agency and the Japan Aerospace Exploration Agency (JAXA) provided the ALOS imagery through the project “Developing a glacier inventory in the Argentinean Andes using high-resolution ALOS (Advanced Land Observing Satellite)”. The Pléiades imagery used in this study was provided by the Pléiades Glacier Observatory (PGO) initiative of the French Space Agency (CNES). Pléiades data © CNES 2018 and 2023, Distribution Airbus D&S. The authors are grateful to Sebastían Crespo and Pierre Pitte (IANIGLA) for their insight into rock glacier hydrology and the glaciological mass balance data of Glaciar de los Tres, respectively.
Conflict of interest
The authors declare that the research was conducted in the absence of any commercial or financial relationships that could be construed as a potential conflict of interest.
Generative AI statement
The author(s) declare that Generative AI was used in the creation of this manuscript. The authors declare that language editing and shortening of the original draft was carried out in the Abstract, Sections 1 and 2, using ChatGPT (OpenAI), version February 2025, Model GPT-4-turbo.
Publisher’s note
All claims expressed in this article are solely those of the authors and do not necessarily represent those of their affiliated organizations, or those of the publisher, the editors and the reviewers. Any product that may be evaluated in this article, or claim that may be made by its manufacturer, is not guaranteed or endorsed by the publisher.
Supplementary material
The Supplementary Material for this article can be found online at: https://www.frontiersin.org/articles/10.3389/feart.2025.1601249/full#supplementary-material
References
Abdel Jaber, W., Rott, H., Floricioiu, D., Wuite, J., and Miranda, N. (2019). Heterogeneous spatial and temporal pattern of surface elevation change and mass balance of the Patagonian ice fields between 2000 and 2016. Cryosphere 13 (9), 2511–2535. doi:10.5194/tc-13-2511-2019
Abermann, J., Fischer, A., Lambrecht, A., and Geist, T. (2010). On the potential of very high-resolution repeat DEMs in glacial and periglacial environments. Cryosphere 4 (1), 53–65. doi:10.5194/tc-4-53-2010
Barsch, D. (1996). Rockglaciers. Indicators for the present and former geoecology in high mountain environments. Berlin: Springer.
Belart, J. M. C., Berthier, E., Magnússon, E., Anderson, L. S., Pálsson, F., Thorsteinsson, T., et al. (2017). Winter mass balance of Drangajökull ice cap (NW Iceland) derived from satellite sub-meter stereo images. Cryosphere 11 (3), 1501–1517. doi:10.5194/tc-11-1501-2017
Beraud, L., Cusicanqui, D., Rabatel, A., Brun, F., Vincent, C., and Six, D. (2023). Glacier-wide seasonal and annual geodetic mass balances from Pléiades stereo images: application to the Glacier d'Argentière, French Alps. J. Glaciol. 69 (275), 525–537. doi:10.1017/jog.2022.79
Berthier, E., Lebreton, J., Fontannaz, D., Hosford, S., Belart, J. M.-C., Brun, F., et al. (2024). The Pléiades Glacier Observatory: high-resolution digital elevation models and ortho-imagery to monitor glacier change. Cryosphere 18 (12), 5551–5571. doi:10.5194/tc-18-5551-2024
Berthier, E., Vincent, C., Magnússon, E., Gunnlaugsson, Á. Þ., Pitte, P., Le Meur, E., et al. (2014). Glacier topography and elevation changes derived from Pléiades sub-meter stereo images. Cryosphere 8 (6), 2275–2291. doi:10.5194/tc-8-2275-2014
Berthling, I. (2011). Beyond confusion: rock glaciers as cryo-conditioned landforms. Geomorphology 131 (3–4), 98–106. doi:10.1016/j.geomorph.2011.05.002
Bertone, A., Barboux, C., Bodin, X., Bolch, T., Brardinoni, F., Caduff, R., et al. (2022). Incorporating InSAR kinematics into rock glacier inventories: insights from 11 regions worldwide. Cryosphere 16 (7), 2769–2792. doi:10.5194/tc-16-2769-2022
Blöthe, J. H., Falaschi, D., Vivero, S., and Tadono, T. (2025). Rock Glacier kinematics in the valles calchaquíes region, northwestern Argentina, from multi-temporal aerial and satellite imagery (1968–2023). Permafr. Periglac. Process. 36 (1), 123–136. doi:10.1002/ppp.2260
Blöthe, J. H., Halla, C., Schwalbe, E., Bottegal, E., Trombotto Liaudat, D., and Schrott, L. (2021). Surface velocity fields of active rock glaciers and ice-debris complexes in the Central Andes of Argentina. Earth Surf. Process. Landf. 46 (2), 504–522. doi:10.1002/esp.5042
Bolch, T., Rohrbach, N., Kutuzov, S., Robson, B. A., and Osmonov, A. (2019). Occurrence, evolution and ice content of ice-debris complexes in the Ak-Shiirak, Central Tien Shan revealed by geophysical and remotely-sensed investigations: ice-debris complexes in Ak-Shiirak. Earth Surf. Process. Landf. 44 (1), 129–143. doi:10.1002/esp.4487
Bown, F., Rivera, A., Pętlicki, M., Bravo, C., Oberreuter, J., and Moffat, C. (2019). Recent ice dynamics and mass balance of jorge montt glacier, southern Patagonia icefield. J. Glaciol. 65 (253), 732–744. doi:10.1017/jog.2019.47
Braun, M. H., Malz, P., Sommer, C., Farías-Barahona, D., Sauter, T., Casassa, G., et al. (2019). Constraining glacier elevation and mass changes in South America. Nat. Clim. Change 9 (2), 130–136. doi:10.1038/s41558-018-0375-7
Bravo, C., Bozkurt, D., Ross, A. N., and Quincey, D. J. (2021). Projected increases in surface melt and ice loss for the Northern and Southern Patagonian Icefields. Sci. Rep. 11 (1), 16847. doi:10.1038/s41598-021-95725-w
Cicoira, A., Beutel, J., Faillettaz, J., Gärtner-Roer, I., and Vieli, A. (2019a). Resolving the influence of temperature forcing through heat conduction on rock glacier dynamics: a numerical modelling approach. Cryosphere 13 (3), 927–942. doi:10.5194/tc-13-927-2019
Cicoira, A., Beutel, J., Faillettaz, J., and Vieli, A. (2019b). Water controls the seasonal rhythm of rock glacier flow. Earth Planet. Sci. Lett. 528, 115844. doi:10.1016/j.epsl.2019.115844
Cicoira, A., Marcer, M., Gärtner-Roer, I., Bodin, X., Arenson, L. U., and Vieli, A. (2021). A general theory of rock glacier creep based on in-situ and remote sensing observations. Permafr. Periglac. Process. 32 (1), 139–153. doi:10.1002/ppp.2090
Cusicanqui, D., Lacroix, P., Bodin, X., Robson, B. A., Kääb, A., and MacDonell, S. (2024). Detection and reconstruction of rock glaciers kinematic over 24 years (2000–2024) from Landsat imagery. Cryosphere Discuss. doi:10.5194/egusphere-2024-2393
Cusicanqui, D., Rabatel, A., Vincent, C., Bodin, X., Thibert, E., and Francou, B. (2021). Interpretation of volume and flux changes of the laurichard Rock Glacier between 1952 and 2019, French alps. J. Geophys. Res. Earth Surf. 126 (9), e2021JF006161. doi:10.1029/2021JF006161
Dussaillant, I., Berthier, E., and Brun, F. (2018). Geodetic mass balance of the northern patagonian icefield from 2000 to 2012 using two independent methods. Front. Earth Sci. 6, 8. doi:10.3389/feart.2018.00008
Dussaillant, I., Berthier, E., Brun, F., Masiokas, M., Hugonnet, R., Favier, V., et al. (2019). Two decades of glacier mass loss along the Andes. Nat. Geosci. 12 (10), 802–808. doi:10.1038/s41561-019-0432-5
Falaschi, D., Berthier, E., Belart, J. M. C., Bravo, C., Castro, M., Durand, M., et al. (2023b). Increased mass loss of glaciers in Volcán Domuyo (Argentinian Andes) between 1962 and 2020, revealed by aerial photos and satellite stereo imagery. J. Glaciol. 69 (273), 40–56. doi:10.1017/jog.2022.43
Falaschi, D., Bhattacharya, A., Guillet, G., Huang, L., King, O., Mukherjee, K., et al. (2023a). Annual to seasonal glacier mass balance in High Mountain Asia derived from Pléiades stereo images: examples from the Pamir and the Tibetan Plateau. Cryosphere 17 (12), 5435–5458. doi:10.5194/tc-17-5435-2023
Falaschi, D., Bolch, T., Rastner, P., Lenzano, M. G., Lenzano, L., Lo Vecchio, A., et al. (2017). Mass changes of alpine glaciers at the eastern margin of the Northern and Southern Patagonian Icefields between 2000 and 2012. J. Glaciol. 63 (238), 258–272. doi:10.1017/jog.2016.136
Falaschi, D., Lenzano, M. G., Villalba, R., Bolch, T., Rivera, A., and Lo Vecchio, A. (2019). Six decades (1958–2018) of geodetic glacier mass balance in Monte san Lorenzo, patagonian Andes. Front. Earth Sci. 7, 326. doi:10.3389/feart.2019.00326
Falaschi, D., Rivera, A., Lo Vecchio Repetto, A., Moragues, S., Villalba, R., Rastner, P., et al. (2021). Evolution of surface characteristics of three debris-covered glaciers in the Patagonian Andes from 1958 to 2020. Front. Earth Sci. 9, 671854. doi:10.3389/feart.2021.671854
Falaschi, D., Tadono, T., and Masiokas, M. (2015). Rock glaciers in the patagonian Andes: an inventory for the Monte san Lorenzo (cerro cochrane) massif, 47° s. Geogr. Ann. A Phys. Geogr. 97 (4), 769–777. doi:10.1111/geoa.12113
Fleischer, F., Haas, F., Altmann, M., Rom, J., Knoflach, B., and Becht, M. (2023). Combination of historical and modern data to decipher the geomorphic evolution of the Innere Ölgruben rock glacier, Kaunertal, Austria, over almost a century (1922–2021). Permafr. Periglac. Process. 34 (1), 3–21. doi:10.1002/ppp.2178
Fleischer, F., Haas, F., Piermattei, L., Pfeiffer, M., Heckmann, T., Altmann, M., et al. (2021). Multi-decadal (1953–2017) rock glacier kinematics analysed by high-resolution topographic data in the upper Kaunertal, Austria. Cryosphere 15 (12), 5345–5369. doi:10.5194/tc-15-5345-2021
Florentine, C., Sass, L., McNeil, C., Baker, E., and O’Neel, S. (2023). How to handle glacier area change in geodetic mass balance. J. Glaciol. 69 (278), 2169–2175. doi:10.1017/jog.2023.86
Groh, T., and Blöthe, J. H. (2019). Rock Glacier kinematics in the kaunertal, ötztal alps, Austria. Geosci 9 (9), 373. doi:10.3390/geosciences9090373
Hu, Y., Arenson, L. U., Barboux, C., Bodin, X., Cicoira, A., Delaloye, R., et al. (2025). Rock Glacier velocity: an essential climate variable quantity for permafrost. Rev. Geophys. 63 (1), e2024RG000847. doi:10.1029/2024RG000847
Hugonnet, R., McNabb, R., Berthier, E., Menounos, B., Nuth, C., Girod, L., et al. (2021). Accelerated global glacier mass loss in the early twenty-first century. Nature 592 (7856), 726–731. doi:10.1038/s41586-021-03436-z
Huss, M. (2013). Density assumptions for converting geodetic glacier volume change to mass change. Cryosphere 7 (3), 877–887. doi:10.5194/tc-7-877-2013
Janke, J. R., and Bolch, T. (2022). “Rock glaciers,” in Treatise on geomorphology. Editor J. J. F. Shroder Second Edition (Oxford: Academic Press), 75–118.
Kääb, A., Chiarle, M., Raup, B., and Schneider, C. (2007). Climate change impacts on mountain glaciers and permafrost. Glob. Planet. Change 56 (1–2). vii-ix. doi:10.1016/j.gloplacha.2006.07.008
Kääb, A., and Reichmuth, T. (2005). Advance mechanisms of rock glaciers. Permafr. Periglac. Process. 16 (2), 187–196. doi:10.1002/ppp.507
Kääb, A., and Røste, J. (2024). Rock glaciers across the United States predominantly accelerate coincident with rise in air temperatures. Nat. Commun. 15 (1), 7581. doi:10.1038/s41467-024-52093-z
LEGOS and OMP (2024). Data from: pléiades Glacier Observatory data products. EOST. doi:10.25577/313A-A978
Lehmann, B., Anderson, R. S., Bodin, X., Cusicanqui, D., Valla, P. G., and Carcaillet, J. (2022). Alpine rock glacier activity over Holocene to modern timescales (western French Alps). Earth Surf. Dyn. 10 (3), 605–633. doi:10.5194/esurf-10-605-2022
Martin, J., Davies, B. J., Jones, R., and Thorndycraft, V. (2022). Modelled sensitivity of Monte San Lorenzo ice cap, Patagonian Andes, to past and present climate. Front. Earth Sci. 10, 831631. doi:10.3389/feart.2022.831631
Masiokas, M. H., Delgado, S., Pitte, P., Berthier, E., Villalba, R., Skvarca, P., et al. (2015). Inventory and recent changes of small glaciers on the northeast margin of the Southern Patagonia Icefield, Argentina. J. Glaciol. 61 (227), 511–523. doi:10.3189/2015JoG14J094
Masiokas, M. H., Rabatel, A., Rivera, A., Ruiz, L., Pitte, P., Ceballos, J. L., et al. (2020). A review of the current state and recent changes of the andean cryosphere. Front. Earth Sci. 8, 99. doi:10.3389/feart.2020.00099
McDonnell, M., Rupper, S., and Forster, R. (2022). Quantifying geodetic mass balance of the northern and southern patagonian icefields since 1976. Front. Earth Sci. 10, 813574. doi:10.3389/feart.2022.813574
McNabb, R., Nuth, C., Kääb, A., and Girod, L. (2019). Sensitivity of glacier volume change estimation to DEM void interpolation. Cryosphere 13 (3), 895–910. doi:10.5194/tc-13-895-2019
Meng, T. M., Aguilar, R., Christoffersen, M. S., Petersen, E. I., Larsen, C. F., Levy, J. S., et al. (2023). Photogrammetric monitoring of Rock Glacier motion using high-resolution cross-platform datasets: formation Age estimation and modern thinning rates. Remote Sens. 15 (19), 4779. doi:10.3390/rs15194779
Minowa, M., Schaefer, M., Sugiyama, S., Sakakibara, D., and Skvarca, P. (2021). Frontal ablation and mass loss of the Patagonian icefields. Earth Planet. Sci. Lett. 561, 116811. doi:10.1016/j.epsl.2021.116811
Monnier, S., and Kinnard, C. (2015). Reconsidering the glacier to rock glacier transformation problem: new insights from the central Andes of Chile. Geomorphology 238, 47–55. doi:10.1016/j.geomorph.2015.02.025
Monnier, S., and Kinnard, C. (2017). Pluri-decadal (1955-2014) evolution of glacier-rock glacier transitional landforms in the central Andes of Chile (30-33°S). Earth Surf. Dyn. 5 (3), 493–509. doi:10.5194/esurf-5-493-2017
Murton, J. B. (2021). “Permafrost and climate change,” in Climate change. Editor T. M. Letcher Third Edition (Elsevier), 281–326.
Petersen, E. I., Levy, J. S., Holt, J. W., and Stuurman, C. M. (2020). New insights into ice accumulation at Galena Creek Rock Glacier from radar imaging of its internal structure. J. Glaciol. 66 (255), 1–10. doi:10.1017/jog.2019.67
Pruessner, L., Phillips, M., Farinotti, D., Hoelzle, M., and Lehning, M. (2018). Near-surface ventilation as a key for modeling the thermal regime of coarse blocky rock glaciers. Permafr. Periglac. Process. 29 (3), 152–163. doi:10.1002/ppp.1978
Robson, B. A., MacDonell, S., Ayala, Á., Bolch, T., Nielsen, P. R., and Vivero, S. (2022). Glacier and rock glacier changes since the 1950s in the La Laguna catchment, Chile. Cryosphere 16 (2), 647–665. doi:10.5194/tc-16-647-2022
Rock glacier inventories and kinematics (RGIK) (2023). “Guidelines for inventorying rock glaciers: baseline and practical concepts (Version 1.0),” in IPA Action Group Rock glacier inventories and kinematics. doi:10.51363/unifr.srr.2023.002
Ryan, J. C., Sessions, M., Wilson, R., Wündrich, O., and Hubbard, A. (2018). Rapid surface lowering of benito glacier, northern patagonian icefield. Front. Earth Sci. 6, 47. doi:10.3389/feart.2018.00047
Schwalbe, E., and Maas, H.-G. (2017). The determination of high-resolution spatio-temporal glacier motion fields from time-lapse sequences. Earth Surf. Dyn. 5 (4), 861–879. doi:10.5194/esurf-5-861-2017
Selley, H., Harrison, S., Glasser, N., Wündrich, O., Colson, D., and Hubbard, A. (2019). Rock glaciers in central Patagonia. Geogr. Ann. A Phys. Geogr. 101 (1), 1–15. doi:10.1080/04353676.2018.1525683
Van Wyk de Vries, M., and Wickert, A. D. (2021). Glacier Image Velocimetry: an open-source toolbox for easy and rapid calculation of high-resolution glacier velocity fields. Cryosphere 15 (4), 2115–2132. doi:10.5194/tc-15-2115-2021
Villarroel, C. D., Ortiz, D. A., Forte, A. P., Tamburini Beliveau, G., Ponce, D., Imhof, A., et al. (2021). Internal structure of a large, complex rock glacier and its significance in hydrological and dynamic behavior: a case study in the semi-arid Andes of Argentina. Permafr. Periglac. Process. 33 (1), 78–95. doi:10.1002/ppp.2132
Vivero, S., Bodin, X., Farías-Barahona, D., MacDonell, S., Schaffer, N., Robson, B. A., et al. (2021). Combination of aerial, satellite, and UAV photogrammetry for quantifying Rock Glacier kinematics in the Dry Andes of Chile (30°S) since the 1950s. Front. Remote Sens. 2, 784015. doi:10.3389/frsen.2021.784015
Vivero, S., Hendrickx, H., Frankl, A., Delaloye, R., and Lambiel, C. (2022). Kinematics and geomorphological changes of a destabilising rock glacier captured from close-range sensing techniques (Tsarmine rock glacier, Western Swiss Alps). Front. Earth Sci. 10, 1017949. doi:10.3389/feart.2022.1017949
Vivero, S., and Lambiel, C. (2024). Annual surface elevation changes of rock glaciers and their geomorphological significance: examples from the Swiss Alps. Geomorphology 467, 109487. doi:10.1016/j.geomorph.2024.109487
Wee, J., Vivero, S., Mathys, T., Mollaret, C., Hauck, C., Lambiel, C., et al. (2024). Characterizing ground ice content and origin to better understand the seasonal surface dynamics of the Gruben rock glacier and the adjacent Gruben debris-covered glacier (southern Swiss Alps). Cryosphere 18 (12), 5939–5963. doi:10.5194/tc-18-5939-2024
Wirz, V., Gruber, S., Purves, R. S., Beutel, J., Gärtner-Roer, I., Gubler, S., et al. (2016). Short-term velocity variations at three rock glaciers and their relationship with meteorological conditions. Earth Surf. Dyn. 4 (1), 103–123. doi:10.5194/esurf-4-103-2016
Wood, E., Bolch, T., and Streeter, R. (2025). Insights from feature tracking of optical satellite data for studying rock glacier kinematics in the Northern Tien Shan. Front. Earth Sci. 12, 1518390. doi:10.3389/feart.2024.1518390
World Meteorological Organization. (2022). The 2022 GCOS ECVs requirements. Available online at: https://library.wmo.int/records/item/58111-the-2022-gcos-ecvs-requirements (Accessed April 23, 2025).
Zahs, V., Hämmerle, M., Anders, K., Hecht, S., Sailer, R., Rutzinger, M., et al. (2019). Multi-temporal 3D point cloud-based quantification and analysis of geomorphological activity at an alpine rock glacier using airborne and terrestrial LiDAR. Permafr. Periglac. Process., 222–238. doi:10.1002/ppp.2004
Keywords: glacier mass balance, rock glacier kinematics, Pléiades, Monte San Lorenzo, Patagonian Andes
Citation: Falaschi D, Blöthe J, Berthier E, Tadono T and Villalba R (2025) Monitoring recent (2018–2023) glacier and rock glacier changes in Central Patagonia using high-resolution Pléiades and ALOS PRISM satellite data. Front. Earth Sci. 13:1601249. doi: 10.3389/feart.2025.1601249
Received: 27 March 2025; Accepted: 03 June 2025;
Published: 24 June 2025.
Edited by:
Dongliang Luo, Chinese Academy of Sciences (CAS), ChinaReviewed by:
Jia Li, Central South University, ChinaSebastián Vivero, Swiss Federal Institute of Technology Lausanne, Switzerland
Copyright © 2025 Falaschi, Blöthe, Berthier, Tadono and Villalba. This is an open-access article distributed under the terms of the Creative Commons Attribution License (CC BY). The use, distribution or reproduction in other forums is permitted, provided the original author(s) and the copyright owner(s) are credited and that the original publication in this journal is cited, in accordance with accepted academic practice. No use, distribution or reproduction is permitted which does not comply with these terms.
*Correspondence: Daniel Falaschi, ZGZhbGFzY2hpQG1lbmRvemEtY29uaWNldC5nb2IuYXI=