 Yiming Ma
 Hui Qiu1,2*
- 1China Meteorological Administration Basin Heavy Rainfall Key Laboratory/Hubei Key Laboratory for Heavy Rain Monitoring and Warning Research, Institute of Heavy Rain, China Meteorological Administration, Wuhan, China
- 2Bureau of Hydrology, Changjiang Water Resources Commission, Wuhan, China
- 3River Basin Complex Administration Center, China Three Gorges Corporation, Yichang, China
- 4Fujian Meteorological Observatory, Fuzhou, China
To improve understanding of essential aspects that influence forecasting of tropical cyclone sudden track change, by using ERA5 reanalysis data provided by the European Centre for Medium-Range Weather Forecasts (ECMWF), the synoptic analysis method and the vorticity diagnosis method to explore the reasons for the sudden track change of super typhoon GAEMI(2024). It is found that the subtropical high on the east of the typhoon and the trough on the north are the main synoptic systems affecting the sudden track change. Due to the uneven distribution of the wind field in the vertical direction and the uneven horizontal distribution of vertical motion, the vertical motion tilts the horizontal vorticity to generate a vertical vorticity component. Thus the vorticity tilting term is the main reason for the enhancement of the subtropical high. During the eastward movement of the trough on the north side of the typhoon, its intensity weakened and the bottom of the trough moved northward. And at the same time, the typhoon intensity weakened after landfall, so the westward-extending subtropical high formed a steadily maintained high-pressure dam in the north of the typhoon. Under the combined effect of the above changes in the environmental field, the meridional steering current of the typhoon decreases rapidly, and under the guidance of the upper-level steering flow, the typhoon suddenly turns westward from the northwestward track.
1 Introduction
Typhoons are intense cyclonic vortices that occur in tropical oceans, accompanying strong winds, heavy rains, and other hazards, leading to severe damage (Zhu et al., 2000; Chen et al., 2002). Although the typhoon track forecast technology has made significant progress in recent years, the prediction of abnormal track turn and sudden track change still poses significant challenges. Analyzing the forecasting errors of typhoon track sudden changes from 2005 to 2010 found that the mean 24-hour and 48-hour forecast errors for sudden northward-turning were significantly larger than the average forecasting levels maintained by the National Meteorological Center of China Meteorological Administration (CMA). Specifically, for these sudden northward-turning, the mean 24-hour and 48-hour forecast error increased by 29.3% and 68.3%, compared to the average forecast errors (Ni et al., 2013). Using the T213 and T639 models to compare the typhoon track forecasting performance from 2009 to 2010 found that T639 has better performance for the north-westward moving and turning typhoons than T213, but the forecasting errors for westward and northward-moving typhoons were relatively large (Ma et al., 2012). The suboptimal performance in typhoon forecasting is attributed to both the inherent complexity of atmospheric systems and the insufficient precision in observational data. Implementing advanced data assimilation techniques to refine radar and satellite observations may potentially enhance typhoon prediction accuracy (Xu et al., 2024; Xu et al.,2025; Shu et al., 2025; Shen et al., 2023; Shen et al., 2025; Zhang et al., 2024). This indicates that sudden changes in typhoon tracks remain a significant challenge in track forecasting.
Extensive research has been conducted globally to elucidate mechanisms causing abrupt typhoon track change. Researches have found that adjustments in large-scale systems such as the South Asia High, the western Pacific subtropical high, and mid-latitude westerly trough, as well as directional shifts deep-layer mean flow field, have significant impacts on abrupt changes in typhoon tracks (Chan and Gray, 1982; Holland, 1983; Chan, 2005; Wei et al., 2014). Investigating possible influences of a predominantly upper-level easterly wave (EW) on Typhoon Megi’s (2010) sharp northward turn after passing over the Philippines, it found that In the absence of the upper-level EW, the simulation showed that Megi would not have made a sharp northward turn (Huang et al., 2020). Diagnosing the abnormal track of the severe tropical storm Helen (9505) and found that a break in the subtropical high, along with the weakening and eastward retreating were the primary factors contributing to Helen’s unusual northward turn (Zhang et al., 2005). Through composite analysis, the characteristics of westward-moving and northward-turning typhoons are as follows: the upper-level westerly troughs consistently approaching the typhoon center, reduced zonal/meridional extent of the South Asian High’s anticyclonic circulation, and the gradual eastward retreat and southward shift of the subtropical high (Li et al., 2015). The westward deceleration and northward acceleration of typhoons before track change can be explained by the interaction between the typhoon and the monsoon vortex (Carr and Elsberry, 1995). Stronger typhoons exhibit heightened susceptibility to abrupt northward deflections during such interactions (Bi et al., 2015). The westward deceleration of Typhoon In-Fa (2021) before the deflection was mainly affected by the intraseasonal component of environmental steering flows associated with the monsoon gyre, while its northward turn and acceleration after the turn were guided by weather-scale environmental steering flow components resulting from the interaction between the monsoon gyre and the typhoon (Liang and Li, 2024). The sudden track changes of typhoon are influenced by the interaction of multi-time-scale circulations, including the Madden-Julian Oscillation (MJO), the quasi-biweekly oscillation (QBWO), and synoptic-scale systems (Wu et al., 2011). Conducting a piecewise potential vorticity inversion to investigate the sudden track change of typhoon Goni (2015) found that throughout its movement, Goni was affected by the large-scale background system and the steering flows including the Northwest Pacific subtropical high, the monsoon gyre, the typhoon Atsani and the peripheral anticyclone of Atsani during the whole lifetime of Goni. The northeastward steering flow associated with the peripheral anticyclone acted as a major factor that resulted in the abrupt northward turning (Bi et al., 2018). Using the same method to investigate Typhoon Goni (2015) found that the anti-cyclone east of Goni and the cyclone in low-frequency circulation field promote a sudden transition with a right angle of the cyclone (Yu et al., 2020).
Although previous studies have conducted in-depth research on the sudden track changes of typhoons, there are still many cases where such changes have been poorly forecast. For example, in 2010, the typhoon Megi(1013) suddenly turned northward while crossing the northern Philippines and entering the South China Sea. The China Meteorological Administration (CMA), the Joint Typhoon Warning Center (JTWC) of the United States, and the Japan Meteorological Agency (JMA) all failed to accurately forecast this sudden track change (Qian et al., 2013). In 2021, typhoon In-Fa(2106) suddenly turned northwestward while moving westward in the east coast of Taiwan, all track forecasts by the China Meteorological Administration (CMA) tended to the left of the actual track, and the predicted landfall positions were located south of the actual (Xiang et al., 2022). In 2024, after Typhoon GAEMI(2403) made landfall, its track suddenly turned westward from northwestward at 07:00 on July 27(CST) when it was near Jiujiang City in Jiangxi Province. However, the track forecast by the CMA at 05:00 on July 27 still indicated that the typhoon would continue to move northward. Similarly, numerical models such as ECMWF-IFS and NCEP-GFS mainly forecasted a northward movement and performed poorly in predicting the westward turn. These persistent forecasting failures show critical knowledge gaps in abrupt track prediction. To advance understanding of multiscale influencing factors and enhance forecasting abilities, this study conducts research on the sudden track change process of the Typhoon GAEMI(2403).
2 Overview of typhoon GAEMI
The typhoon GAEMI(2403) formed in the eastern ocean of the Philippines. It was initially classified as a tropical depression by the China Meteorological Administration (CMA) at 20:00 on 19 July 2024(CST) and moved northwestwards. At 14:00 on July 21, GAEMI intensified to a severe tropical storm with a minimum sea level pressure of 982 hPa and maximum winds of 28 m/s. Its track abruptly shifted from northwest to north, with its intensity gradually increasing. By 08:00 on July 24, GAEMI had moved east of Taiwan Island and strengthened into a super typhoon with a minimum sea level pressure of 935 hPa and maximum winds of 52 m/s. After briefly hovering off the eastern side of Taiwan Island, it crossed the island and made landfall on the coast of Xiuyu District, Putian City, Fujian Province, at around 19:50 on the 25th as a typhoon with a minimum sea level pressure of 972 hPa and maximum winds of 33 m/s.
After landfall, GAEMI rapidly weakened and continued to move northwest, passing through Fujian and Jiangxi provinces. At 07:00 on July 27, when it reached near Jiujiang City in Jiangxi Province, its track suddenly turned west and entered the eastern part of Hubei Province. Then, GAEMI continued to move westward within Hubei Province, with its intensity further weakening until CMA discontinued tracking at 08:00 on July 28. The track of Typhoon GAEMI exhibited six stages: northwest - north - northwest - hovering - northwest - west, characterized by sudden changes and complex variations. Specific typhoon track changes are shown in Figure 1.
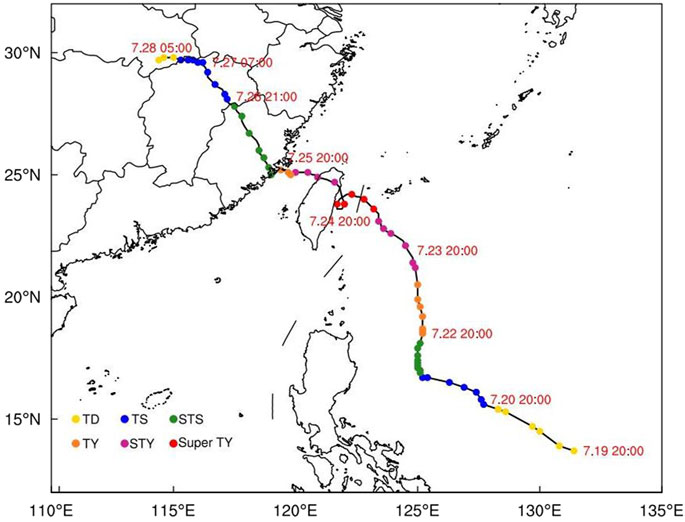
Figure 1. The track of super typhoon GAEMI (data from CMA tcdata.typhoon.org.cn).
Affected by the sudden track change of Typhoon GAEMI, torrential rain (locally exceeding 250 mm/day) occurred in the Dongting and Poyang Lake basins from July 26 to 28, 2024. The area-averaged rainfall in the Xiangjiang River basin reached 110 mm on July 27th, ranking first for the same period in history since 1961. In particular, the cumulative rainfall in Xiangtan City from 8 PM on July 27th to 8 PM on July 28th reached 281.6 mm, breaking the historical record. Extreme precipitation triggered record-breaking hydrological responses, the Shebu Station on the Juanshui River, a tributary of the Xiangjiang River, rose to 51.07 m at 9:45 PM on the 28th (exceeding the historical highest water level by 0.44 m), resulting in a historical flood. At the Xiangtan Hydrological Station on the Xiangjiang River, the water level rose to 38.00 m at 7:22 PM on July 28th (with the warning level at 38.0 m), reaching flood warning thresholds and forming the “Fourth Flood of the Xiangjiang River in 2024.”
3 Analysis of sudden track change of GAEMI
3.1 Analysis of circulation situation
Typhoon GAEMI maintained a northwestward track after making landfall in Fujian Province. Multiple numerical models (such as CMA-GFS, NCEP-GFS, EC-IFS, CMA-TYM, HWRF, etc.) consistently predicted that the typhoon would turn from northwestward to northward movement after entering inland China, and move into northern China. However, at 07:00 on July 27th, when GAEMI moved near Jiujiang City, Jiangxi Province, its track suddenly deflected westward and then maintained a westward track.
Figure 2 shows the 500 hPa geopotential height field and wind field before and after the sudden track change of Typhoon GAEMI. As shown in the figure, the eastern part of GAEMI has always been controlled by a strong Wetern Pacific Subtropical High (WPSH), and there is a low trough in the north that forms a north-south confrontation with the subtropical high. Figure 2a shows that at 20:00 on the 25th, shortly after the typhoon made landfall and was located off the coast of Fujian Province, the presence of multiple closed isohypses indicates that the typhoon had strong intensity and large spatial extent. At the same time, the trough on the north of the typhoon was relatively strong, with its central closed contour lower than 5680 gpm and the bottom of the trough extending to near 35°N. Subsequently, the typhoon gradually moved westward and northward, while the northern trough continued to move eastward and southward. At 01:00 on the 26th (Figure 2b), the 5,840 gpm isohypse of GAEMI and the northern trough merged, forming a contiguous low-pressure belt over eastern China. With the resistance of the two strong low-pressure systems, the WPSH remained over the sea, with its western edge oscillating near the central Bohai Sea, thus having no significant impact on the northward movement of typhoon.
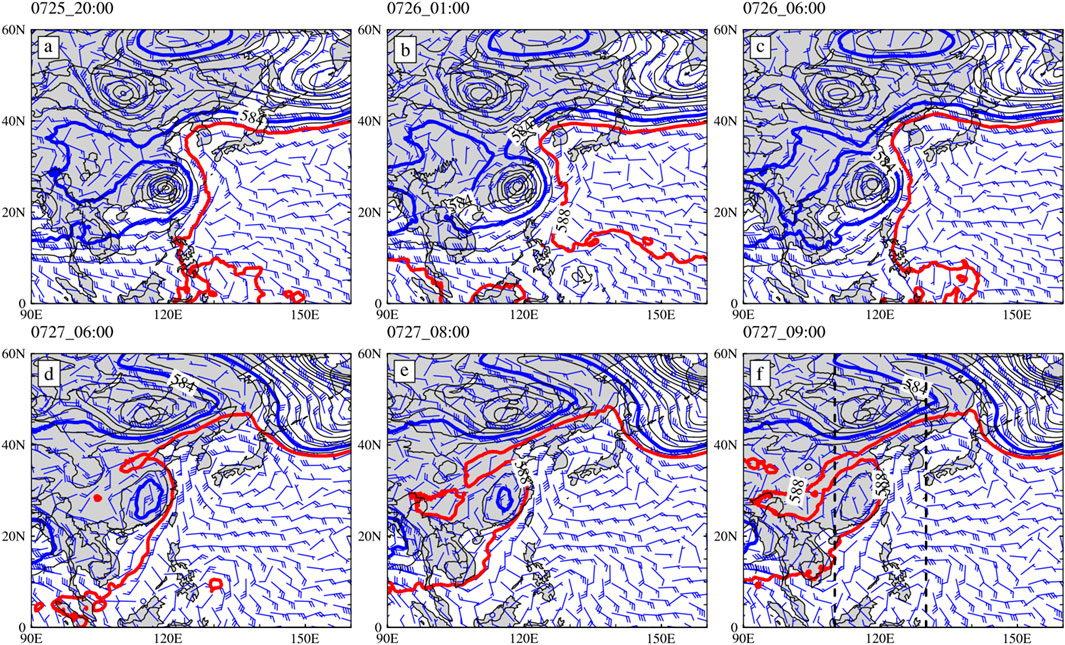
Figure 2. Evolution of 500-hPa geopotential height (units: 10 gpm) and wind field (units: m/s,the reference vector values are 8 m/s) of typhoon GAEMI at (a) 2000 CST on 25; (b) 0100 CST on 26; (c) 0600 CST on 26; (d) 0600 CST on 27; (e) 0800 CST on 27; (f) 0900 CST on 27, July (The red line represents the 5880 gpm contour and the blue represents the 5840 contour gpm).
However, the intensity of northern trough weakened, while GAEMI decayed due to increased surface friction and reduced heat supply after-landfall. At 06:00 on the 26th (Figure 2c), the 5840 gpm contours of the two low-pressure systems disconnected, and the bottom of the northern trough rapidly retreated northward to near 40°N. The weakening of the two low-pressure systems and the disconnection of the low-pressure belt provided an opportunity for the WPSH to extend inland. Afterwards, as the typhoon moved northwestward, its intensity continued to weaken, the northern trough gradually moved eastward, and the bottom of the trough lifted northward. This disintegration of the low-pressure belt allowed the WPSH continued to extend westward and intrude inland.
At 06:00 on the 27th (Figure 2d), the 5880gpm contour of the WPSH had entered the space between the typhoon and the trough, forming a high-pressure barrier to the north of the typhoon. Subsequently, the WPSH continued to strengthen and extend westward, with the area and intensity of the high-pressure barrier increasing, completely enclosing the typhoon within the control of the high pressure (Figures 2e,f). This prevented the typhoon from moving northward and forced it to turn westward.
From the above analysis, it can be seen that the sudden track change of Typhoon GAEMI from northwestward to westward was caused by the enhancement and westward extension of the WPSH over the western Pacific, which formed a stable high-pressure barrier to the north of the typhoon, blocking its northward movement and forcing it to turn westward. However, the reasons for the continuous westward extension and strengthening of the WPSH are not yet clear. Therefore, Section 3.2 analyzes the causes of the enhancement of the WPSH.
3.2 Analysis of the strengthen and westward extension of WPSH
Previous studies have indicated a close correlation between the activities of the South Asian High (SAH) and the Western Pacific Subtropical High (WPSH). The SAH and the WPSH exhibit a tendency to move towards each other or away from each other (Ren et al., 2007). Further investigation revealed that during the eastward movement of the SAH, dynamic forcing from upper-level negative vorticity advection induces convergence and subsidence, leading to divergence in the mid-atmospheric layer of the subtropical high-pressure region.
This dynamically affect the development of negative vorticity within the WPSH, inducing its strengthening and westward extension. Based on this, Whether this negative vorticity enhancement resulted from the eastward migration of the South Asian High (SAH) and the dynamic forcing of upper-level negative vorticity advection, which induces convergence and subsidence as previously hypothesized? To verify this hypothesis, an analysis of the changes in the SAH and the WPSH during the typhoon’s development process was conducted.
Figure 3 shows the variation of the SAH with blue contours and the WPSH with red contours. As shown in Figure 3a, at 20:00 on the 25th, the eastern end of the SAH and the western end of the WPSH are both located near 125°E, with no significant overlap between the two high-pressure systems. At 06:00 on the 26th, the 16880gpm contour of the SAH extends eastward significantly, and the 5880 gpm contour of the WPSH also shifts westward, resulting in partial overlap between the eastern end of the SAH and the western end of the WPSH. At 06:00 on the 27th, the SAH has extended eastward and intensified notably compared to the previous two time points, with the eastern end of the 16880gpm contour located near 135°E. At this time, the WPSH has also intensified and extended westward significantly, with a large and obvious overlapping area between the two high-pressure systems. At 09:00 on the 27th, the intensification and overlap of the two become even more pronounced. From the above analysis, it can be seen that during the period of Typhoon GAEMI, the SAH and the WPSH indeed follow a pattern of moving towards each other.
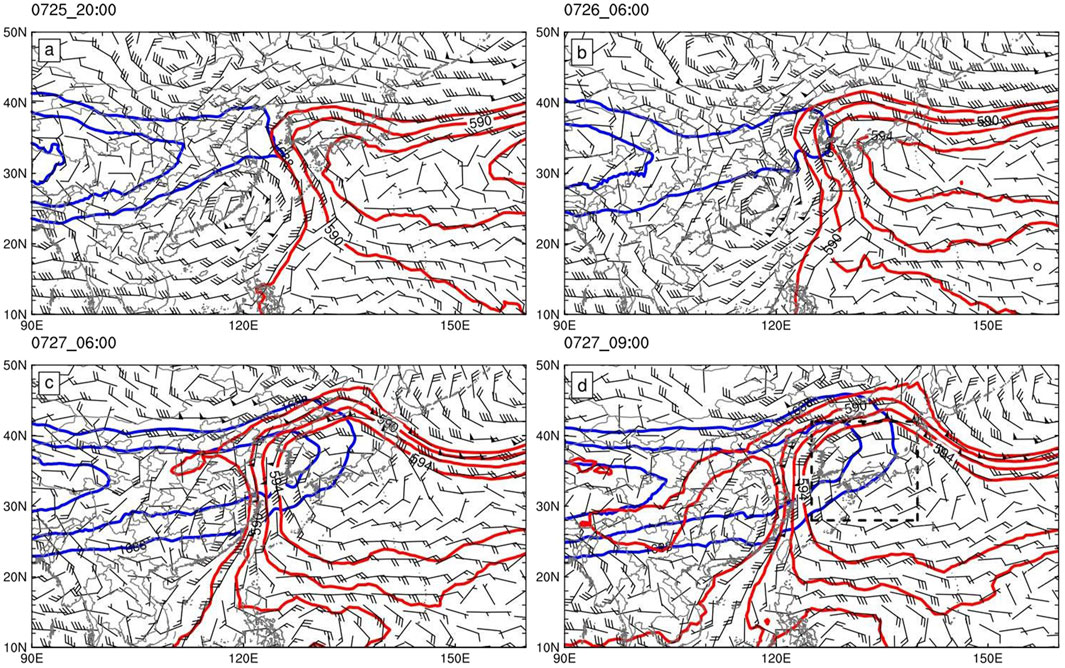
Figure 3. Distributions of Southern Asia high characterization lines above to 16880 gpm at 100-hPa(blue lines, represent 16880, 16920, 16960 gpm) and Western Pacific subtropical high characterization lines above to5880 gpm at 500-hPa (red lines, represent 5880, 5900, 5920, 5940 gpm) and wind field (units: m/s,the reference vector values are 4 m/s) at (a) 2000 CST on 25; (b) 0600 CST on 26; (c) 0600 CST on 27; (d) 0900 CST on 27, July.
From the 500 hPa wind field shown in Figures 3c–d, it can be seen that the westward extension and intensification of the WPSH are mainly manifested by the generation and development of a obvious anticyclonic circulation over the sea northeast of China. From the perspective of vorticity generation and dissipation, this can be attributed to the continuous development and enhancement of negative vorticity. Is the enhancement of this negative vorticity caused by the eastward movement of the SAH and the dynamic forcing of high-level negative vorticity advection causing convergence and subsidence motions? To explore the reasons, a vorticity diagnostic analysis was conducted on the relative vorticity within the range of 28°N-42°N, 125°E−140°E (as shown by the black box in Figure 3d) using Equation 1. This analysis aims to investigate the dynamic factors influencing the intensification of the WPSH in this region.
Figure 4 calculates the horizontal advection, geostrophic advection, vertical advection, tilting term, divergence term, and mean relative vorticity influencing local vorticity changes at the 500 hPa level. The purple line represents the mean relative vorticity, which was still positive at 20:00 on the 25th, indicating that no significant anticyclonic circulation had developed in the area at that time. Subsequently, the mean relative vorticity rapidly decreased and continued negative after 11:00 on the 26th. The negative vorticity continued to strengthen, corresponding to the development of the anticyclonic circulation on the western side of the WPSH. The blue line is the horizontal relative vorticity advection, the pink line is the geostrophic vorticity advection, the red line is the vertical vorticity transport, the green line is the tilting term,and the black line is the divergence term. From the perspective of the various components that influence local vorticity changes, the divergence term, the horizontal relative vorticity advection term, and the geostrophic vorticity advection term all have minor contributions to vorticity changes. In contrast, the vertical vorticity transport and the tilting term have the largest relative contributions to vorticity changes. In terms of the contribution values of these two significant terms, the tilting term, which converts the horizontal component of vorticity into the vertical component due to the uneven distribution of vertical velocity in the horizontal direction, contributes negatively to local vorticity changes, meaning it favors the development and enhancement of negative vorticity. On the other hand, the vertical vorticity transport contributes positively to local vorticity changes, meaning it does not favor the development of negative vorticity. This differs from previous research findings that suggest subsidence motion generated by negative vorticity at upper levels leads to the enhancement of negative vorticity at middle levels.
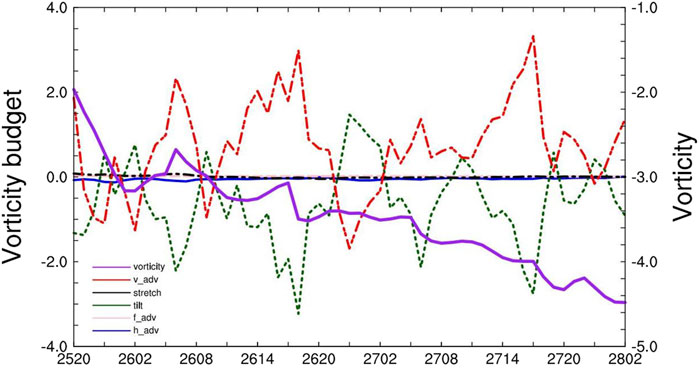
Figure 4. Time series of the relative vorticity tendencies induced by the horizontal advection (blue line) and vertical advection (red line) and Coriolis advection (pink line) and tilting terms (green line) and stretching terms (black line),as well as the relative vorticity(ordinate on the right; units: 105 s−1) , averaged over the range 28°N-42°N, 125°E-140°E at 500 hPa.
To further investigate the vertical velocity within the anticyclonic circulation and the contributions of vertical vorticity transport and the tilting term to the WPSH at different heights, Figure 5 presents the calculations of the variations in vertical vorticity transport, the tilting term, and vertical velocity with time and height within the range of 28°N-42°N and 125°E−140°E. In the atmosphere at different heights, since the contributions of horizontal vorticity advection, geostrophic vorticity advection, and the divergence term to vorticity changes are all relatively weak, they are not analyzed in detail here (figure omitted).

Figure 5. Time-height plots of the (a) vertical advection (b) tilting (c) vertical speed(shade,units: 102m/s) and relative vorticity(contour), averaged over the range 28°N-42°N, 125°E-140°E at 100–1000 hPa.
From Figure 5a, it can be seen that vertical vorticity transport mainly exhibits positive vorticity transport below 400 hPa. In conjunction with the distribution of vertical velocity represented by the shaded area in Figure 5c, the average vertical velocity in the anticyclonic region below 400 hPa does not manifest as subsidence but rather as significant upward motion, vertical velocity ω < 0. From the horizontal view of vertical velocity at 500 hPa, it is evident that both upward and downward motions exist within the region, but the upward motion is relatively stronger (Figure 6). Some previous studies have reached the same conclusion. For example, through analyzing the average circulation of the WPSH in summer found that the subsidence area in the subtropical region mainly occurs in the eastern part of the ocean, while the western part of the ocean corresponds to upward motion (Liu and Wu, 2000; Ren and Wu, 2003). Investigating the average structure of the WPSH at 500 hPa in July 1998 and found that there is consistent upward motion west of 160°E, while subsidence only exists east of 160°E (Ren et al., 2007). Analysing the mechanisms of convective rain belts developed near the warm edge of WPSH on 23 July 2012 and 2 July 2013 from the following aspects such as dynamics, vapor, thermal factor and instability, it found that WPSH has obvious inner dynamic, thermal factor and instability borders, and the convective rain belts take place nearby the borders (Wang et al., 2014). On the edge of the WPSH may generate and strengthen the mesoscale convective system that triggered the heavy rainfall event (Liu et al., 2020). Moreover, whether it is over coastal land or the northwest Pacific Ocean, both upward and downward motions can occur within the WPSH. This indicates that the subtropical high pressure area at 500 hPa is not necessarily characterized by complete subsidence; there is also significant upward motion. Analysis of the 500 hPa vertical velocity (Figure 6) reveals that the region of intense upward motion predominantly resides along the northwestern periphery of the subtropical high. This observation aligns with prior research findings (Wang et al., 2014). Referencing the investigation into precipitation mechanisms associated with Typhoon Gaemi, their study revealed significant precipitation processes coinciding with intense convective activity along the subtropical high northwestern flank during the typhoon activity. Backward trajectory analysis of moisture transport identified that water vapor was primarily channeled to the precipitation zone through synergistic interactions between the outer southeastern flow of typhoon and the subtropical high. These findings collectively indicate that the intense convective activity along the subtropical high northwestern periphery contributed to remote precipitation events associated with Typhoon Gaemi (Jia et al., 2025).
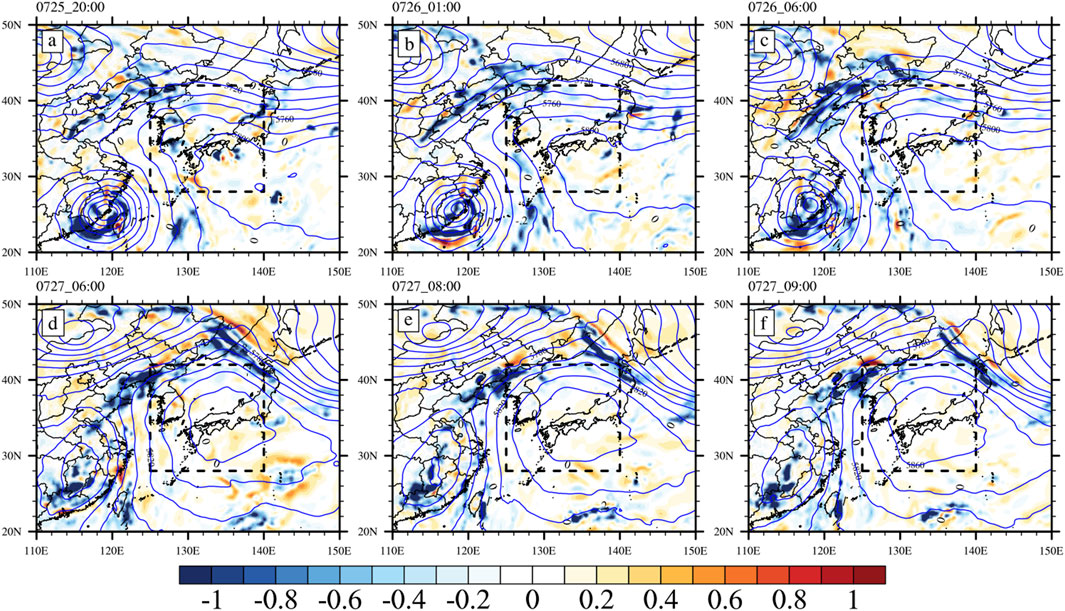
Figure 6. Temporal evolution of 500 hPa vertical velocity (shading) and geopotential height (contours) at (a) 2000 CST on 25 July, (b) 0100 CST on 26 July, (c) 0600 CST on 26 July, (d) 0600 CST on 27 July, (e) 0800 CST on 27 July, and (f) 0900 CST on 27 July. The black box is the same as that in Figure 3d of the manuscript.
From the vertical distribution of relative vorticity represented by the contours in Figure 5c, it can be seen that the relative vorticity decreases with increasing p-coordinate below 200 hPa,
3.3 The role of the northern trough
From the analysis of the circulation pattern in Figure 2, it can be seen that the interaction between the northern trough and the WPSH plays a significant role in the movement of Typhoon GAEMI after its landfall. In the early stage before the typhoon’s landfall, due to the strong intensity and relatively southern position of the trough, it confronted the WPSH to its southeast, effectively hindering the westward extension of the subtropical high pressure. However, as the trough gradually weakened and its base moved northward during its development, it allowed the WPSH to take advantage and form a high-pressure barrier between the trough and the typhoon, resulting in a sudden change in the typhoon’s track.
To further quantitatively analyze the variations among the northern trough, WPSH, and typhoon GAEMI, Figure 7 shows the changes in zonal mean geopotential height with latitude and time within the range of 110°E−130°E (indicated by the dashed black line in Figure 2f). As can be seen from the Figure 7, between 20:00 on the 25th and 05:00 on the 26th, the zonal mean geopotential height between 40°N and 55°N is below 5,840 gpm, with a low-value center of less than 5,760 gpm appearing between 44°N and 48°N, which corresponds to the location of the northern trough in the circulation map of Figure 2. Over time, it can be seen that the zonal mean geopotential height north of 40°N significantly increases. By 20:00 on the 26th, the mean geopotential height near 46°N has increased to 5,770 gpm. The increased geopotential height indicates that the intensity of the northern trough has significantly weakened during this process. From the changes in the 5,840 gpm contour, it can be seen that the low-pressure trough area continuously moves northward over time. The 5,840 gpm contour is located near 38°N at 20:00 on the 25th, but has shifted to near 44°N by 08:00 on the 27th. Although the intensity of the trough increases again during the northward movement, it is significantly weaker compared to before.
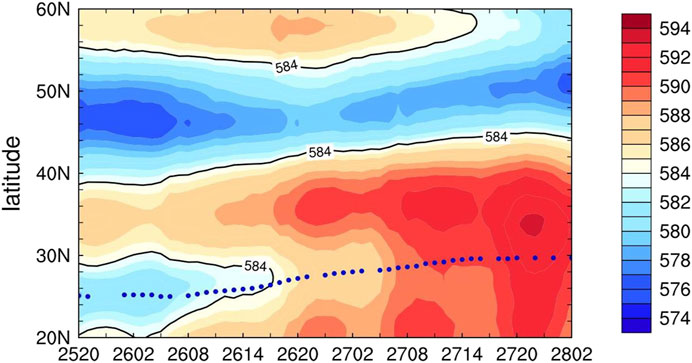
Figure 7. The variation of geopotential height averaged over the range 110°E-130°E at 500 hPa, blue dots represent the latitude position of the typhoon center.
As the low trough weakened and moved northward, the intensity of the typhoon GAEMI also continued to diminish. The blue dots is the change in latitude of the typhoon GAEMI center over time. It can be seen that between 20:00 on the 25th and around 11:00 on the 26th, the zonal mean geopotential height at the typhoon center was between 5,810–5,820 gpm within the range of 110°E−130°E. As the typhoon center gradually moved northward, the zonal mean geopotential height at its center significantly increased, reaching 5,890–5,900 gpm by 08:00 on the 27th. This indicates that the intensity of the typhoon had markedly weakened during this period. At the same time, the mean geopotential height between the typhoon and the northern trough, within the 30°N-40°N latitude range, increased from 5,870 gpm at 20:00 on the 25th to 5,920 gpm, indicating the continuous strengthening of the high-pressure system to the north of the typhoon, which corresponds to the formation of the high-pressure barrier to the north of the typhoon shown in Figure 2. This quantitative analysis further reveals the relationship between the weakening and northward movement of the northern trough, the weakening of the typhoon’s intensity, and the formation of the a high-pressure barrier between them.
3.4 Analysis of the steering flow
Previous studies have shown that the environmental steering flow is one of the important factors affecting the track of typhoons, and there is a good correspondence between typhoon movement and the steering flow near its center (Chan and Gray, 1982; Dong and Neumann, 1983; Shapiro and Goldenberg, 1998). To analyze the relationship between the steering flow and typhoon movement during the development of Typhoon GAEMI, Figure 7 calculate the U and V components of the deep-layer steering flow and the actual movement of the typhoon using the method proposed by Holland (Holland, 1993), within a radius of 500 km from the typhoon center horizontally and from 300 hPa to 850 hPa vertically.
Figure 8a shows the U-component of the steering flow represented by the solid red line and the actual U-component of the typhoon’s movement represented by the dashed red line. It can be seen that, the U-component wind speed of the steering flow is positive only during the period from 02:00 on the 26th to 08:00 on the 26th, and is negative at all other times, indicating that the steering flow primarily moves westward in the U-direction. From the U-component of the actual movement speed of the typhoon center, it can be seen that the U-component of the typhoon’s actual movement is negative throughout its journey, meaning that the typhoon moves westward after making landfall. This indicates that the steering flow and the typhoon’s movement direction are basically consistent in the U-component.
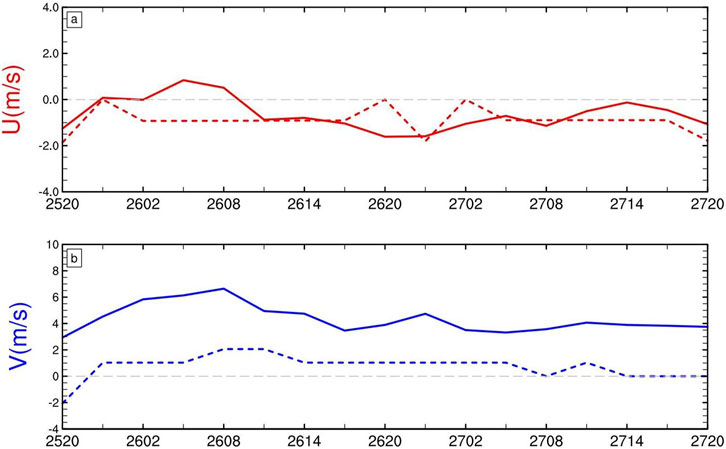
Figure 8. The component of the steering flow in the (a) east-west and (b) north-south direction (the solid line is the speed of the steering flow and the dashed line is the typhoon center moving speed).
Figure 8b shows the V-component of the steering flow represented by the solid blue line and the actual V-component of the typhoon’s movement represented by the dashed blue line. It can be seen that the V-component wind speed of the deep-layer steering flow remains positive, indicating that the steering flow is moving northward in the V-direction. From the V-component of the actual movement speed of the typhoon center, it can be observed that before 08:00 on the 27th, the typhoon’s actual movement speed is basically between 1 m/s and 2 m/s, also reflecting a northward movement in the north-south direction. After 08:00 on the 27th, the V-component of the steering flow changes little and continues to move northward at a speed of about 4 m/s. However, the movement speed of the typhoon center decreases to 0 at 08:00 on the 27th, and although it briefly becomes positive afterwards, it quickly weakens to 0 again, indicating that after this time, the typhoon basically loses its northward movement speed. The movement of the typhoon is mainly dominated by the negative component in the U-direction, showing a westward movement. Thus, it can be seen that the V-direction steering flow is basically consistent with the typhoon’s movement direction before 08:00 on the 27th, but there is some divergence from the typhoon’s actual movement direction after 08:00 on the 27th.
To analyze the guiding effect of the steering flow on the typhoon’s track in the vertical direction, Figure 8 calculates the mid-to-upper level steering flow from 300–500 hPa and the mid-to-lower level steering flow from 500–850 hPa. Figure 9a shows the U-component of the steering flow represented by the solid blue line and the actual V-component of the typhoon’s movement represented by the dashed blue line. Figure 9a shows the U-component of the mid-to-upper level steering flow as a red line and the U-component of the mid-to-lower level steering flow as a blue line. It can be seen that the U-component of the mid-to-lower level steering flow exhibits a pattern of “negative-positive-negative-positive-negative” after the typhoon’s landfall, which corresponds to the direction of the mid-to-lower level steering flow changing from “west-east-west-east-west.” This is significantly different from the actual movement direction of the typhoon shown in Figure 8a. The U-component of the mid-to-upper level steering flow remains negative after the typhoon’s landfall, indicating that the direction of the mid-to-upper level steering flow consistently points westward, which is consistent with the actual movement direction of the typhoon.
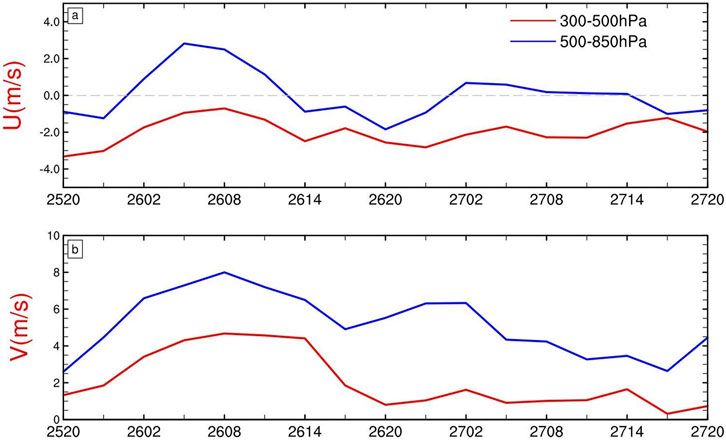
Figure 9. The component of the steering flow in the (a) east-west and (b) north-south direction (the red line is the steering flow with 300–500 hPa and the blue line is the steering flow with 500–850 hPa).
Figure 9b shows the V-component of the mid-to-upper level steering flow as a red line and the V-component of the mid-to-lower level steering flow as a blue line. It can be seen that the V-component of the mid-to-lower level steering flow significantly increases after the typhoon’s landfall, rapidly rising from about 2.5 m/s to about 8 m/s, and then fluctuates and decreases. Although the trend of this speed change is similar to the trend of the typhoon center’s movement speed shown in Figure 8b, the V-component of the steering flow still has a northward speed of about 2.5–4.5 m/s after 08:00 on the 27th, when the typhoon basically loses its northward speed. The trend of the V-component of the mid-to-upper level steering flow is consistent with the mid-to-upper level and deep-layer steering flow, also showing a pattern of first increasing and then decreasing, but its speed in the V-direction is much less than that of the mid-to-lower level steering flow. At 20:00 on the 26th, the V-component of the mid-to-upper level steering flow drops to about 1 m/s and then remains below 2 m/s thereafter. That is, in the V-direction, the changes in the mid-to-upper level steering flow are more closely aligned with the actual movement of the typhoon. This indicates that, compared to the deep-layer and mid-to-lower level steering flows, the track of Typhoon GAEMI after landfall is more significantly influenced by the mid-to-upper level steering flow. To further analyze vertical variations in steering mechanisms, Figure 10 illustrates the U-V components of steering winds across the 100-850 hPa layer. From the perspective of the vertical distribution of steering flow, the U-component in the upper levels above 200 hPa, particularly near 100 hPa, exhibits a significant increase in easterly wind component. According to the 100 hPa circulation pattern (figure not shown), this is attributed to the persistent position of typhoon within the easterly jet stream region on the southeastern flank of the upper-level South Asian High during its movement. The robust band-shaped South Asian High provides a crucial large-scale circulation context that steers the typhoon westward. While these findings confirm the SAH critical contribution to the westward steering component, temporal analysis of the U-component in Figure10 reveals no discernible variation in upper-level steering flows around 0700 UTC on 27th during the abrupt track shift. This suggests the SAH was not the primary driver of the sudden path alteration. Instead, the synergistic effects of the upper-level zonally oriented SAH and the westward extension of the mid-level subtropical high pressure ridge collectively induced a transition in deep-layer steering winds to easterlies, ultimately determining the trajectory deviation.
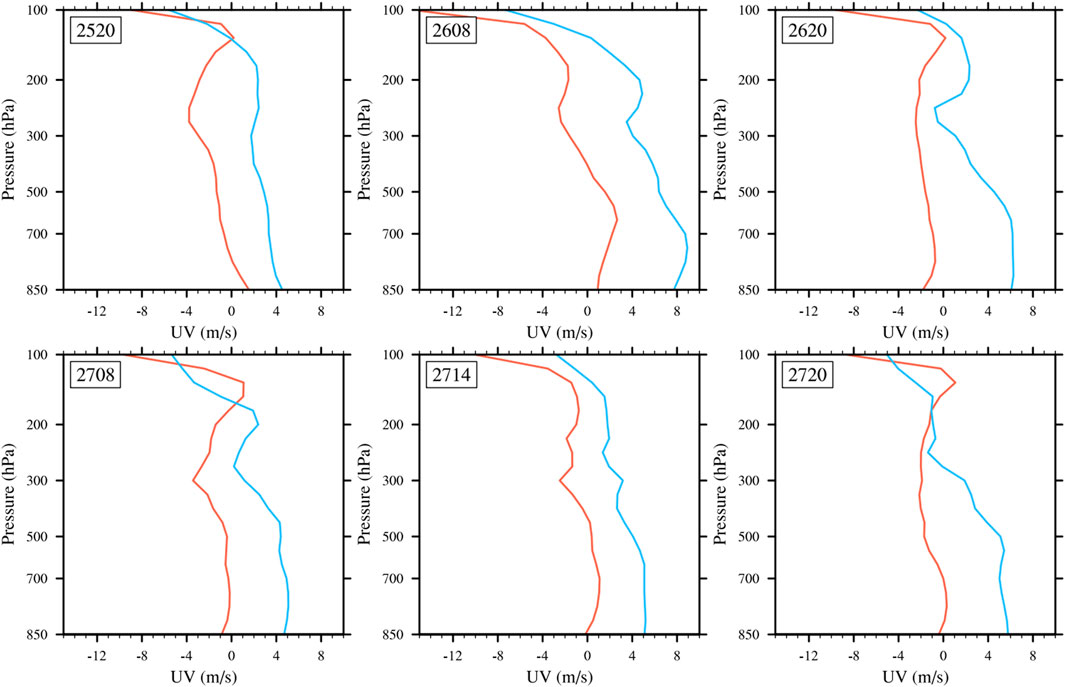
Figure 10. UV component of the 100–850 hPa typhoon steering flow, the red line represents the U component and the blue is the V component.
4 Conclusion and discussion
After Super Typhoon GAEMI(2403) made landfall in Fujian Province, China, it moved northwest and suddenly turned west near Jiujiang City in Jiangxi Province, continuing westward thereafter. This sudden track change caused torrential rain and locally exceptional rain in the Dongting and Poyang Lake basins, resulting in the “Fourth Flood of the Xiangjiang River in 2024.” This paper analyzes the reasons for the sudden westward turn of GAEMI using ERA5 reanalysis data provided by ECMWF, and the main conclusions are as follows:
(1) The track changes of GAEMI were primarily influenced by the subtropical high-pressure system to the east of the typhoon and the low trough to its north. The reason for the sudden track changes of GAEMI from northwestward to westward was the enhancement and westward extension of the WPSH, which formed a stable high-pressure barrier to the north of the typhoon, blocking its northward movement and diverting it westward.
(2) During the transition of GAEMI from moving northwest to moving west, although the SAH and the WPSH exhibited a pattern of “moving towards each other,” the reason for the enhancement of the WPSH was not due to the downward motion caused by upper-level negative vorticity leading to the strengthening of mid-level negative vorticity. Rather, it was attributed to the uneven distribution of the wind field in the vertical direction and the uneven horizontal distribution of vertical motion, which caused the horizontal vortex tube to tilt and generate a vertical vorticity component, resulting in the enhancement and westward extension of the WPSH over the sea northeast of China.
(3) The intensity and positional changes of the low trough to the north of the typhoon, critically influenced the westward intrusion of WPSH. When the northern low trough is strong and positioned further south, it confronts the WPSH in a north-south direction, making westward extension of the WPSH difficult, and thereby enabling the typhoon to move northward smoothly. As the northern low trough moves eastward, its intensity weakens and retreated northward, reducing its blocking effect on the WPSH. This allows the WPSH to extend westward into the space between the low trough and the typhoon, hindering the typhoon’s northward movement.
(4) Typhoon GAEMI’s track is mainly governed by the upper-level steering flow. The deep-layer steering flow from 300–850 hPa poorly matched the actual track of typhoon. Compared to the low-level steering flow from 500–850 hPa, the upper-level steering flow from 300–500 hPa is closer to GAEMI’s actual track, directly contributing to the abrupt track changes.
This study demonstrates that typhoon track emerge from complex interactions among multiple synoptic systems. To accurately forecast the typhoon’s track, it is necessary to make accurate judgments about the changes in related weather systems. This article analyzes the role of the main weather systems associated with GAEMI in its sudden track changes, but does not delve into the extent of the influence of each weather system on the typhoon’s track mutations. Currently, the analysis of the reasons for the intensification of the subtropical high only use the vorticity diagnostic equation, while neglecting the influence of other weather systems on typhoon tracks. For instance, in studies of abrupt changes in typhoon track caused by interactions between the northern trough and the subtropical high, future research could employ the piecewise potential vorticity (PV) inversion method to diagnose the impacts of PV perturbations from different subsystems on the typhoon. Additionally, ensemble simulations could be conducted for this typhoon case. By analyzing scenarios with similar environmental fields but varying intensities and developmental states of weather systems, we could further investigate how synoptic systems and internal changes contribute to abrupt track alterations. Further research on the factors affecting typhoon track changes can be conducted through methods such as sensitivity tests in the future. In addition, this article only analyzes the reasons for the sudden track changes of GAEMI from the perspective of the large-scale environmental field, but does not analyze the impact of the inner structure of typhoon and internal changes on its track. The vortex motion induced by the beta drift theory is the primary reason for the significant deviation between the steering flow and the actual typhoon path. Additionally, diabatic processes generated by convective systems within typhoon, such as internal cumulonimbus cloud clusters, play a critical role in abrupt turning or sudden track changes of typhoons. The next step could be to conduct detailed research on the dynamic and thermodynamic processes within the typhoon through high-resolution numerical simulations and other methods.
5 Data and methods
5.1 Data
This study employs the fifth-generation reanalysis data from the European Centre for Medium-Range Weather Forecasts (ERA5) with the horizontal grid spacing of 0.25° × 0.25°grids at every 1 h. The data are available on the surface, at 60 pressure levels from 1,000 to 1 hPa, including geopotential height, wind field, vertical velocity, relative humidity. The Typhoon GAEMI(2403) data recorded on the Digital Typhoon website of the National Institute of Informatics (NII) in Japan (http://agora.ex.nii.ac.jp/digital-typhoon/), including the latitude and longitude of the typhoon center, the lowest sea level pressure, and maximum wind speed every 3 h throughout the typhoon’s lifecycle, are utilized. Furthermore, the data used in this article includes the track and intensity information of Typhoon GAEMI recorded by the China Meteorological Administration (CMA) (tcdata.typhoon.org.cn) (Ying et al., 2014; Lu et al., 2021); daily precipitation data and conventional radiosonde data from 08:00 to 08:00 (GMT+8, the same below) collected by 701 national meteorological observation stations in the Yangtze River Basin provided by the China Meteorological Administration; and real-time flood reporting data measured by hydrological stations of the Hydrology Bureau of the Changjiang Water Resources Commission.
5.2 Method
The vorticity equation is a fundamental equation describing the evolution of atmospheric vortex characteristics and is widely used in the analysis and research of weather systems such as cyclones, typhoons, subtropical highs, and severe convection (Xiang et al., 2022; Tang, 2022; Gong et al., 2023; Liu et al., 2023). The vorticity equation in a pressure coordinate, neglecting friction terms, can be written as:
Where
Data availability statement
The original contributions presented in the study are included in the article/supplementary material, further inquiries can be directed to the corresponding authors.
Author contributions
YM: Data curation, Writing – original draft, Conceptualization, Investigation, Visualization. HuQ: Methodology, Funding acquisition, Resources, Writing – review and editing. BF: Writing – review and editing, Formal Analysis, Investigation. HaQ: Writing – review and editing, Formal Analysis, Validation. JZ: Writing – review and editing, Supervision, Formal Analysis. WG: Writing – review and editing. JL: Data curation, Writing – review and editing.
Funding
The author(s) declare that financial support was received for the research and/or publication of this article. This research is financially Supported by the Open Project Fund of China Meteorological Administration Basin Heavy Rainfall Key Laboratory (No. 2023BHR-Y10), China Three Gorges Corporation (Contract Number: 0704205) and National Key Research and Development Program of China (2021YFC3200301). The authors declare that this study received funding from China Three Gorges Corporation. The funder was not involved in the study design, collection, analysis, interpretation of data, the writing of this article, or the decision to submit it for publication.
Conflict of interest
Author WG was employed by the company China Three Gorges Corporation.
The remaining authors declare that the research was conducted in the absence of any commercial or financial relationships that could be construed as a potential conflict of interest.
Generative AI statement
The author(s) declare that no Generative AI was used in the creation of this manuscript.
Publisher’s note
All claims expressed in this article are solely those of the authors and do not necessarily represent those of their affiliated organizations, or those of the publisher, the editors and the reviewers. Any product that may be evaluated in this article, or claim that may be made by its manufacturer, is not guaranteed or endorsed by the publisher.
References
Bi, M., Li, T., Peng, M., and Shen, X. (2015). Interactions between typhoon Megi (2010) and a low-frequency monsoon gyre. J. Atmos. Sci. 72, 2682–2702. doi:10.1175/JAS-D-14-0269.1
Bi, X. X., Chen, G. H., and Zhou, W. C. (2018). A mechanism study on the sudden track change of super typhoon Goni (2015) (in Chinese). Chin. J. Atmos. Sci. 42 (1), 227–238. doi:10.3878/j.issn.1006-9895.1708.16280
Carr, L. E., and Elsberry, R. L. (1995). Monsoonal interactions leading to sudden tropical cyclone track changes. Mon. Wea Rev. 123, 265–290. doi:10.1175/1520-0493(1995)123<0265:miltst>2.0.co;2
Chan, J. C. L. (2005). The physics of tropical cyclone motion. Annu. Rev. Fluid Mech. 37, 99–128. doi:10.1146/ANNUREV.FLUID.37.061903.175702
Chan, J. C. L., and Gray, W. M. (1982). Tropical cyclone movement and surrounding flow relationships. Mon. Wea Rev. 110 (10), 1354–1374. doi:10.1175/1520-0493(1982)110<1354:tcmasf>2.0.co;2
Chen, L. S., Xu, X. D., and Luo, Z. X. (2002). Introduction to tropical cyclone dynamics (in Chinese). Beijing: Meteorological Press, 19–21.
Dong, K. Q., and Neumann, C. J. (1983). On the relative motion of binary tropical cyclones. Mon. Wea Rev. 111, 945–953. doi:10.1175/1520-0493(1983)111<0945:otrmob>2.0.co;2
Gong, W. D., Zhou, Y. S., and Zhong, S. S. (2023). Evolution process and mechanism analysis of the mesoscale system of an extreme summer rainstorm in shandong Province (in Chinese). Chin. J. Atmos. Sci. 47 (3), 786–804. doi:10.3878/j.issn.1006-9895.2208.21261
Holland, G. (1993). “Tropical cyclone motion,” in Global guide to tropical cyclone forecasting. Editor G. Holland (Melbourne: Bureau of Meteorology Research Centre).
Holland, G. J. (1983). Tropical cyclone motion: environmental interaction plus a Beta effect. Atmos. Sci. 40 (2), 328–342. doi:10.1175/1520-0469(1983)040<0328:tcmeip>2.0.co;2
Huang, Q., Ge, X., and Peng, M. (2020). Impacts of an upper-level easterly wave on the sudden track change of Typhoon Megi (2010). J. Meteor. Soc. Jpn. 98 (6), 1335–1352. doi:10.2151/jmsj.2020-069
Jia, L., Xiang, C., and Lü, X. (2025). Characteristics and causes of different types of precipitation under impact of Super Typhoon Gaemi (2403) (in Chinese). J. Mar. Meteorology 45 (1), 1–11. doi:10.19513/j.cnki.hyqxxb.20241126001
Li, X., Ding, Z. Y., and Wang, Y. (2015). A composite study of the tropical cyclones northward turning motion over South China Sea (in Chinese). J. Trop. Meteorol. 31 (4), 444–456.
Liang, J., and Li, S. Y. (2024). Effects of monsoon gyre on sudden track changes of Typhoon “In-fa” (in Chinese). J. Meteorol. Sci. 44 (3), 527–535.
Liu, J., Zhang, J., Liu, F., and Yang, L. (2020). Drivers of a sudden mesoscale rainstorm in arid and semi-arid regions at the edge of the western Pacific subtropical high. Meteorol. Appl. 27 (2), e1884. doi:10.1002/met.1884
Liu, X., Zeng, M. J., and Wang, Y. Q. (2023). Analysis of key dynamical factors and water vapor sources influencing remote heavy rainfall produced by typhoon Lekima (in Chinese). Trans. Atmos. Sci. 46 (5), 776–789. doi:10.13878/j.cnki.dqkxxb.20220406001
Liu, Y. M., and Wu, G. X. (2000). Reviews on the study of the subtropical anticyclone and new insights on some fundamental problems (in Chinese). Acta Meteorol. Sin. (4), 500–512. doi:10.11676/qxxb2000.053
Lu, X., Yu, H., Ying, M., Zhao, B., Zhang, S., Lin, L., et al. (2021). Western North pacific tropical cyclone database created by the China meteorological administration. Adv. Atmos. Sci. 38, 690–699. doi:10.1007/s00376-020-0211-7
Ma, S. H., Wu, Y., and Qu, A. X. (2012). Comparative analysis on tropical cyclone numerical forecast errors of T213 and T639 models (in Chinese). J. Appl. Meteor Sci. 23 (2), 167–173.
Ni, Z. P., Wu, L. G., and Zhang, L. (2013). Analysis on forecasting errors and associated circulations of sudden typhoon track changes during 2005-2010 (in Chinese). Meteor Mon. 39 (6), 719–727. doi:10.7519/j.issn.1000-0526.2013.06.008
Qian, C., Zhang, F., Green, B. W., Zhang, J., and Zhou, X. (2013). Probabilistic evaluation of the dynamics and prediction of supertyphoon Megi (2010). Wea Forecast. 28, 1562–1577. doi:10.1175/WAF-D-12-00121.1
Ren, R. C., Liu, Y. M., and Wu, G. X. (2007). Impact of south Asia high on the short term variation of the subtropical anticyclone over western Pacific in july 1998 (in Chinese). Acta Meteorol. Sin. (2), 183–197. doi:10.11676/qxxb2007.018
Ren, R. C., and Wu, G. X. (2003). On the short-term structure and formation of the subtropical anticyclone in the summer of 1998 (in Chinese). Acta Meteorol. Sin. (2), 180–195. doi:10.11676/qxxb2003.017
Shapiro, L. J., and Goldenberg, S. B. (1998). Atlantic Sea surface temperatures and tropical cyclone formation. J. Clim. 11 (4), 578–590. doi:10.1175/1520-0442(1998)011<0578:asstat>2.0.co;2
Shen, F., Song, L., He, Z., Xu, D., Chen, J., and Huang, L. (2023). Impacts of adding hydrometeor control variables on the radar reflectivity data assimilation for the 6–8 August 2018 mesoscale convective system case. Atmos. Res. 295, 107012. doi:10.1016/j.atmosres.2023.107012
Shen, F., Song, L., Min, J., He, Z., Shu, A., Xu, D., et al. (2025). Impact of assimilating pseudo-observations derived from the “Z-RH” relation on analyses and forecasts of a strong convection case. Adv. Atmos. Sci. 42, 1010–1025. doi:10.1007/s00376-024-3215-x
Shu, A., Shen, F., and Li, H. (2025). Impacts of assimilating polarimetric radar KDP observations with an ensemble Kalman filter on analyses and predictions of a rainstorm associated with Typhoon Hato (2017). Quart. J. R. Meteor. Soc. e4943. doi:10.1002/qj.4943
Tang, Y. Q. (2022). Dynamic mechanism of Tibetan plateau vortex genesis in boreal summer (in Chinese). Nanjing: Nanjing University of Information Science and Technology. Doctor Dissertation.
Wang, Z., Ding, Y., and Zhang, Y. (2014). The border characteristics of the western North Pacific subtropical high and the cause of convective rain belts in the nearby warm area (in Chinese). Acta Meteorol. Sin. 72 (3), 417–427. doi:10.11676/qxxb2014.030
Wei, X., Wang, L. Q., and Li, H. N. (2014). Circulation structure change impact on the westbound track of typhoon Tembin (1214) (in Chinese). Mar. Forecasts 31 (3), 72–79.
Wu, L., Zong, H., and Liang, J. (2011). Observational analysis of sudden tropical cyclone track changes in the vicinity of the east China sea. J. Atmos. Sci. 68, 3012–3031. doi:10.1175/2010JAS3559.1
Xiang, C. Y., Xu, Y. L., and Gao, S. Z. (2022). Analysis of the characteristics and forecast difficulties of typhoon over the western north pacific in 2021 (in Chinese). Meteor Mon. 48 (9), 1195–1208. doi:10.7519/j.issn.1000-0526.2022.053001
Xu, D., Chen, J., Li, H., Shen, F., and He, Z. (2025). The impact of radar radial velocity data assimilation using variational and EnKF systems on the forecast of Super Typhoon Hato (2017) with Rapid Intensification. Atmos. Res. 314, 107748. doi:10.1016/j.atmosres.2024.107748
Xu, D., Zhang, X., Min, J., and Shen, F. (2024). Impacts of assimilating all-sky FY-4A AGRI satellite infrared radiances on the prediction of Super Typhoon In-Fa during the period with abnormal changes. J. Geophys. Res. Atmos. 129, e2024JD040784. doi:10.1029/2024jd040784
Ying, M., Zhang, W., Yu, H., Lu, X., Feng, J., Fan, Y., et al. (2014). An overview of the China meteorological administration tropical cyclone database. J. Atmos. Ocean. Technol. 31, 287–301. doi:10.1175/JTECH-D-12-00119.1
Yu, K., Shen, X. Y., and Zhang, C. (2020). Effects of multi-time scale circulation on the sudden track of Typhoon Goni (1515) (in Chinese). J. Meteorol. Sci. 40 (3), 333–340.
Zhang, S. J., Chen, L. S., and Xu, X. D. (2005). The diagnoses and numerical simulation on the unusual track of helen (9505) (in Chinese). Chin. J. Atmos. Sci. 29 (6), 937–946. doi:10.3878/j.issn.1006-9895.2005.06.09
Zhang, X., Xu, D., Shen, F., and Min, J. (2024). Impacts of offline nonlinear bias correction schemes using the machine learning technology on the all-sky assimilation of cloud-affected infrared radiances. J. Adv. Model. Earth Syst. 16 (12), e2024MS004281. doi:10.1029/2024ms004281
Keywords: typhoon, sudden track change, high-pressure dam, vorticity diagnosis, steering flow
Citation: Ma Y, Qiu H, Feng B, Qi H, Zhang J, Gong W and Liu J (2025) Impacts of environment on the sudden track change of super typhoon GAEMI(2024). Front. Earth Sci. 13:1601840. doi: 10.3389/feart.2025.1601840
Received: 28 March 2025; Accepted: 09 June 2025;
Published: 24 June 2025.
Edited by:
Feifei Shen, Nanjing University of Information Science and Technology, ChinaReviewed by:
Jianping Tang, Nanjing University, ChinaYoucun Qi, Chinese Academy of Sciences (CAS), China
Copyright © 2025 Ma, Qiu, Feng, Qi, Zhang, Gong and Liu. This is an open-access article distributed under the terms of the Creative Commons Attribution License (CC BY). The use, distribution or reproduction in other forums is permitted, provided the original author(s) and the copyright owner(s) are credited and that the original publication in this journal is cited, in accordance with accepted academic practice. No use, distribution or reproduction is permitted which does not comply with these terms.
*Correspondence: Hui Qiu, cWl1aHVpNzc3N0AxNjMuY29tJiN4MDIwMGE7; Jing Liu, bGl1amluZzAyMzBAMTYzLmNvbQ==