 Zohreh Rahnama
 Shohreh Hassanpour
 Dany Savard
 Zahid Shah
- 1ANGLO REM CA Exploration Mining Ltd, Astana, Kazakhstan
- 2Department of Geology, Payame Noor University, Tehran, Iran
- 3LabMaTer, UQAC Laboratory, Université du Québec à Chicoutimi, Saguenay, QC, Canada
- 4School of Mining and Geosciences, Nazarbayev University, Astana, Kazakhstan
The Masjeddaghi porphyry Cu-Au deposit is situated in the Alborz-Azarbaijan structural zone of northwest Iran. Chemical compositions of rock-forming (biotite, amphibole) and accessory minerals (magnetite, apatite) in the potassic to propylitic altered diorite porphyry of Masjeddaghi serve as key indicators of magmatic-hydrothermal mineralization. In situ LA-ICP-MS was conducted to analyze trace element contents of selected magnetite-bearing samples, while EMPA analyzed biotite, amphibole, and apatite compositions. The mineral compositions show a parental magma with calc-alkaline features, suggesting a source comprised of both subduction mantle-derived and crust-derived materials, and the Masjeddaghi mineralizing magmas have a relatively elevated ƒO2 and are classified as oxidized I-type magmas. The calculated temperature ranges are constrained by Al-in-amphibole geothermometry, saturation temperature of apatite, and the Ti-in-biotite geothermometer (830°C–877°C) (845°C-918°C) and (723°C–782°C), respectively, whereas the Al-in-amphibole geobarometry exhibits formation pressure (120–186 MPa; relating to depths ranging from 4 to 10 km) and H2Omelt content at time of crystallization (4.10–4.46 wt%), indicating formation of a hydrous calc-alkaline magma from a deep magmatic reservoir. The intrusion of oxidized hydrous mafic magma from a deeper magma source likely promoted wide magma mixing and prolonged fractional crystallization within the evolved dioritic magma chamber, resulting in exsolution of the ore-forming fluids and the formation of the Masjeddaghi deposit.
1 Introduction
Porphyry-related Cu (Mo-Au) deposits are magmatic-hydrothermal systems that predominantly develop in subduction settings along continental margins and island arcs (Sun et al., 2015; Rahnama et al., 2021; Shah et al., 2025). Studying chemical compositions of igneous rock-forming minerals equilibrated with magma is an effective approach to understanding ore-forming conditions (Pan et al., 2019).
Biotite is a widely occurring mineral in igneous rocks used as a geothermometer and geothermobarometer in magmatic-hydrothermal systems (Pan et al., 2019). Its chemical composition serves in the estimation of intrinsic thermodynamic parameters, including temperature (T), oxygen fugacity in the parent magmas (ƒO2), magmatic rock water fugacity (ƒH2O), and the contents of halogens, such as F and Cl, enabling reconstruction of granitoid petrogenesis and tectonic setting. Amphibole indicates the physicochemical conditions of the melt during crystallization. Its chemical composition can be utilized as a petrogenetic index for pressure estimation (P), temperature (T), and H2O amount, defining the melt composition in the magmatic chambers (Ridolfi and Renzulli, 2012). Apatite is a porphyry indicator mineral (Piccoli and Candela, 2002). It can be used to quantify the parental magma oxidation state, determine the magma chemistry, distinguish the difference between barren and fertile host rocks, and estimate the oxygen fugacity (Zhong et al., 2021). Magnetite is the predominant oxide mineral found in the Earth’s crust and commonly appears as an accessory mineral in various ore deposits (Dare et al., 2014). Depending on the various mineralizing systems, magnetite can accommodate a diverse range of trace elements in its crystal structure (Dupuis and Beaudoin, 2011). Magnetite trace element compositions can reflect the crystallization conditions across various geodynamic settings (Dare et al., 2014).
The Masjeddaghi porphyry Cu-Au deposit is situated 35 km east of the Jolfa area in the East Azarbaijan Province, near the Aras River (Figure 1a,b). The exploration region covers around 8 km2. Based on drill hole data, the deposit comprises ore reserves of 272 Mt with an average grade of copper 0.31 wt% and grade of gold 0.6 ppm (Hassanpour and Alirezaei, 2016). However, due to a lack of data, there is little knowledge about associated magmatic evolution and ore-forming mechanisms. To acquire a deeper comprehension of the physico-chemical parameters affecting magmatic development and ore-forming mechanisms, we have studied the chemical characteristics of rock-forming and accessory indicator minerals in the porphyry intrusion of Masjeddaghi.
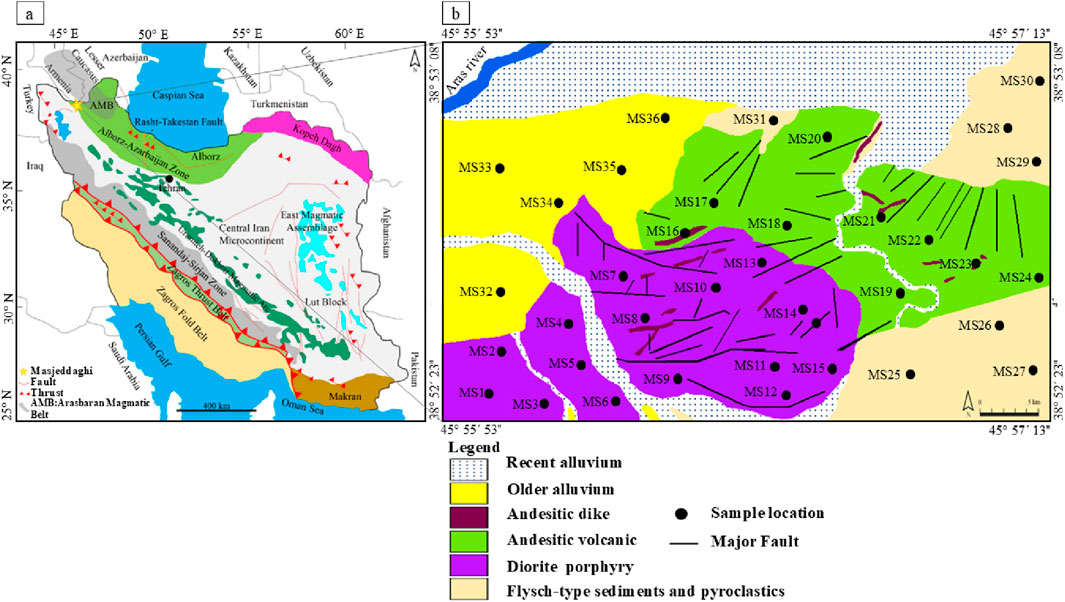
Figure 1. (a) Simplified geology map of Iran (Nabavi, 1976), illustrating the Masjeddaghi Cu-Au porphyry within the Alborz-Azarbaijan structural zone, northwest Iran; (b) Simplified geological map of the Masjeddaghi deposit (Hassanpour and Alirezaei, 2016).
In this study, element compositions of biotite, amphibole, and apatite were investigated by electron microprobe analysis (EMPA), while the trace element contents of Mn, Al, V, Si, Ti, Mg, Ni, Zn, Co., and Cr in magnetite were analyzed by laser ablation-inductively coupled plasma-mass spectrometry (LA-ICP-MS) associated with the Cu-Au mineralization in Masjeddaghi. The primary objective of this paper is to utilize mineral chemistry of biotite, amphibole, magnetite, and apatite to determine key parameters of hydrothermal mineralization and magmatic processes linked to the deposit formation.
2 The Masjeddaghi Cu-Au porphyry deposit
2.1 Geological setting of the Masjeddaghi deposit
Based on the structural-sedimentary division of Iran (Nabavi, 1976), the Masjeddaghi deposit is situated in the Alborz-Azarbaijan structural zone (Figure 1a). Nabavi (1976) states that the Alborz-Azarbaijan zone is framed in the south by the Semnan Fault, the west by the Tabriz-Urumiyeh Fault, and the north by the Alborz Fault. There are different views about the geological position of the Masjeddaghi deposit. Some researchers who worked on Masjeddaghi consider that this deposit is in the Arasbaran Magmatic Belt (AMB) based on geological, mineralogical, and petrological studies (Aghazadeh et al., 2015), but Hassanpour and Alirezaei (2016) suggested that Masjeddaghi was formed in a subduction-related arc and is situated in the margin of AMB, and it is geologically different from this belt. Accordingly, we favor the Masjeddaghi intrusion with its high-K calc-alkaline and meta-aluminous affinity to have formed in an island arc subduction/collision setting (Hassanpour and Alirezaei, 2016; Rajabpour et al., 2023).
The dominant rock formations are the Cretaceous flysch-type sediment series that crop out in the southern and northeastern sections of the region (Figure 1b). These sedimentary sequences are overlain by Eocene volcanic complexes with andesitic to trachyandesitic compositions. The unit, with a relatively lighter color than diorite porphyry intrusion, is widespread in the area. The andesitic to trachyandesite rocks consist mostly of phenocryst assemblages of plagioclase and amphibole in a microlithic to glassy groundmass (Figures 2a,b). Finally, the ore-hosting diorite porphyry occurred within the Early Eocene andesitic to trachyandesitic host rock. Diorite has a porphyritic texture distinguished primarily by plagioclase, biotite, magnetite, K-feldspar, and phenocrysts of quartz (Figures 3a–f). The primary K-feldspar and biotite are altered to sericite, muscovite, opaque minerals, and secondary biotite (Figures 2c,d). The diorite porphyry is the main host of Cu-Au mineralization. Late post-ore dikes of andesitic composition intersected all these rocks.
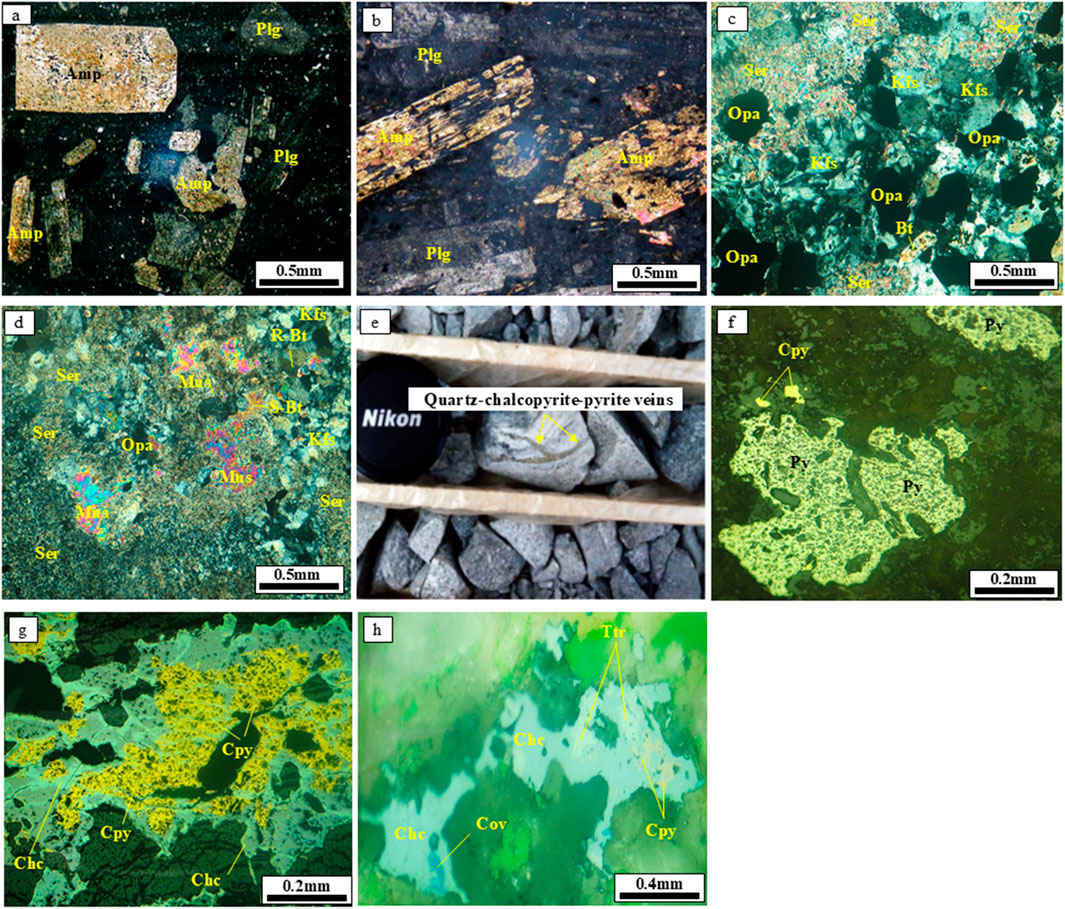
Figure 2. Representative field photographs, a drill core photo, and photomicrographs of ore minerals from the Masjeddaghi Cu-Au porphyry deposit: (a,b) Phenocryst of plagioclase and amphibole in a microlithic to glassy groundmass from the andesitic to trachyandesite rocks; (c) K-feldspar and biotite altered to sericite and opaque minerals in diorite porphyry; (d) K-feldspar and biotite altered to sericite, opaque minerals, secondary biotite, and muscovite in diorite porphyry; (e) Quartz-chalcopyrite-pyrite veins in drill core from diorite porphyry; (f) Chalcopyrite and pyrite in sample M2; (g) Replacement of chalcocite by chalcopyrite in sample M1; (h) Replacement of chalcocite, covellite, and tetrahedrite by chalcopyrite in sample M4 (reflected light). Abbreviations: Amp, amphibole; Plg, plagioclase; Kfs, K-feldspar; Bt, biotite; Ser, sericite; Mus, muscovite; Py, pyrite; Cpy, chalcopyrite; Chc, chalcocite; Cov, covellite; Ttr, tetrahedrite; Opa, opaque minerals.
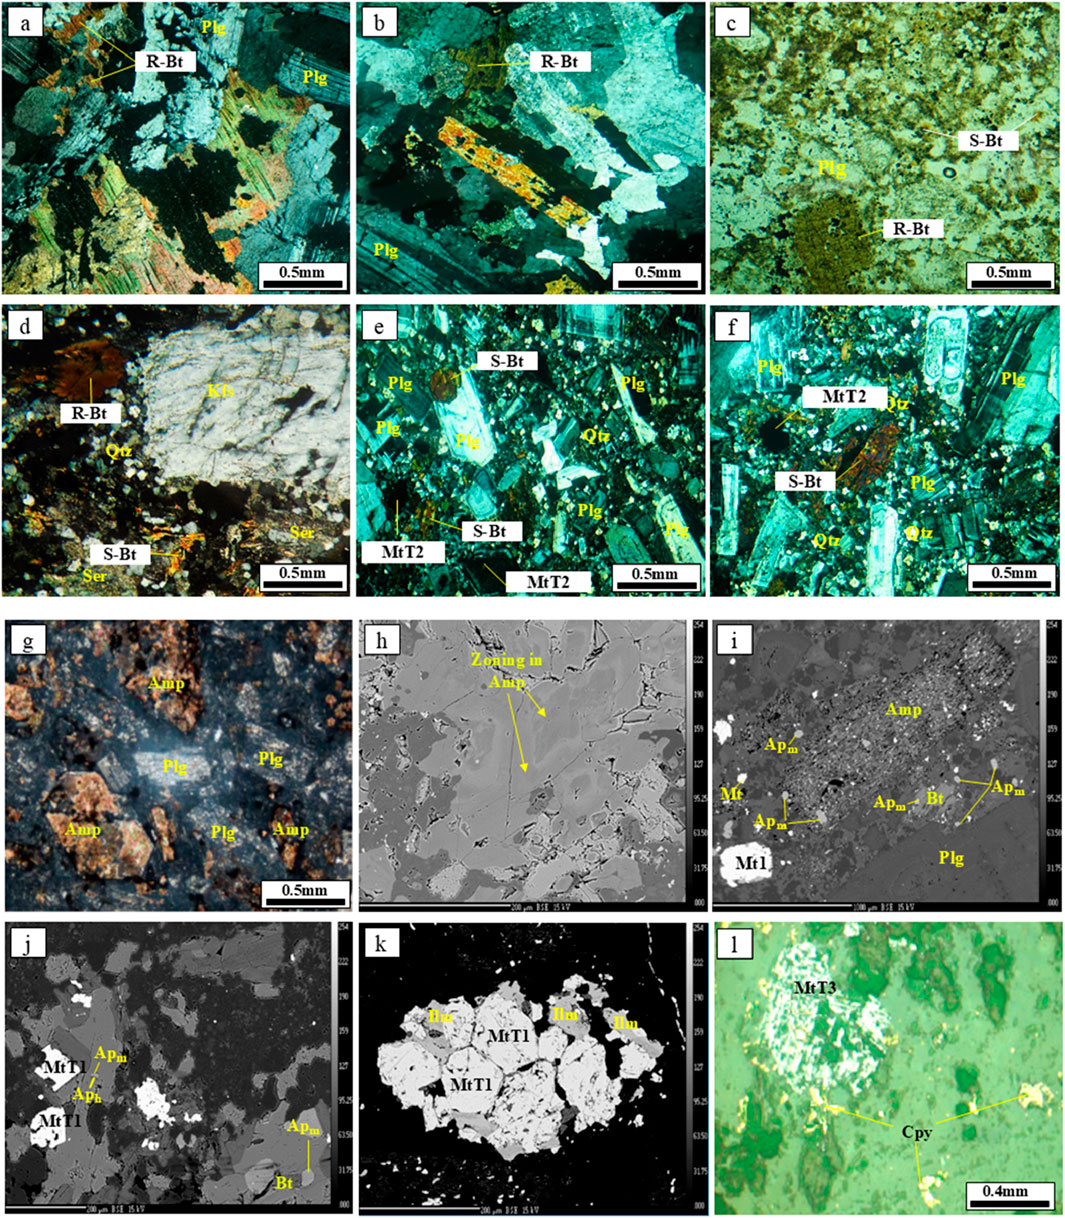
Figure 3. Representative photomicrographs, field photographs, and back-scattered electron (BSE) images of apatite and biotite from diorite porphyry of the Masjeddaghi Cu-Au porphyry deposit: (a,b) reequilibrated biotite in diorite porphyry associated with plagioclase; (c) Reequilibrated biotite and secondary biotite in diorite porphyry associated with plagioclase; (d) Reequilibrated biotite and secondary biotite associated with sericite, quartz and K–feldspar; (e) plagioclase phenocrysts replaced by hydrothermal biotite and reequilibrated magnetite in diorite porphyry; (f) plagioclase phenocrysts replaced by hydrothermal biotite and reequilibrated magnetite in diorite porphyry; (g) amphibole phenocrysts associated with plagioclase; (h) Back-scattered electron (BSE) image of zoned amphibole (core-rim textures); (i) Back-scattered electron (BSE) image of magmatic apatite (Apm) appears as inclusions in amphibole, with lesser amounts in biotite, as well as discrete crystals in the groundmass; (j) Back-scattered electron (BSE) image of hydrothermal apatite (Aph) grains partly replaced by Apm and Apm grains as inclusions within biotite; (k) Back-scattered electron (BSE) image of Magmatic-Type 1 intergrown with ilmenite, amphibole, biotite, and plagioclase; (l) Hydrothermal-Type 3 containing chalcopyrite inclusions. Abbreviations: Kfs, K-feldspar; Plg, plagioclase; Bt, biotite; R, Bt-reequilibrated biotite; S-Bt, Secondary biotite; Kfs, K-feldspar; Plg, plagioclase; Qtz, quartz; Ser, sericite; Amp, amphibole, Apm, magmatic apatite; Aph, hydrothermal apatite; MtT1, Magmatic-Type 1; MtT2, Reequilibrated-Type 2; MtT3, Hydrothermal-Type 3.
2.2 Petrography and mineral assemblages
According to petrographic observations and field investigation, the hydrothermal alteration zones in the Masjeddaghi deposit primarily consist of potassic and propylitic alteration. Cu-Au mineralization is found in sulfide-bearing veins/veinlets and as disseminations formed during the primary ore-forming phase (Figure 2e), that are linked to the potassic alteration zone located in the center of the deposit. Ore minerals consist of pyrite, chalcopyrite, chalcocite, magnetite, and covellite, with small occurrences of tetrahedrite (Figures 2f–h). Potassic alteration occurs at depths of 500–700 m and extends into the western and eastern boundaries of the seasonal Arpachaei River. The potassic alteration is composed of secondary biotite and secondary K-feldspar, with localized occurrences of magnetite, quartz, and plagioclase (Figures 3d–f). The diorite porphyry stock underwent potassic alteration. Propylitic alteration spreads horizontally and is present throughout the deposit’s margins. Sulfide minerals of this alteration include chalcopyrite and pyrite. The propylitic alteration is characterized by the occurrence of chlorite and calcite that partially replace phenocrysts (Figure 3g).
Petrographic studies of our samples have identified two distinct biotite varieties: reequilibrated and hydrothermal. The reequilibrated biotite exhibits a shreddy texture within the potassic alteration zone of the diorite porphyry (Figures 3a,b). Some appear as euhedral to subhedral phenocrysts exhibiting ragged textures and are commonly altered to secondary hydrothermal biotite with a fine-grained texture (Figures 3c,d). Figure 3c shows the best comparison between R-biotite and S-biotite. Hydrothermal biotites in diorite porphyry occur as irregular grains and fine-grained aggregates. They partially replace plagioclase phenocrysts (Figures 3e,f). Amphibole grains occur as euhedral to subhedral shapes, with a light rim and dark core (Figures 3h,i). Apatite is classified into magmatic and hydrothermal varieties. In backscattered electron (BSE) imaging, the magmatic apatite (Apm) appears as inclusions in amphibole, with lesser amounts in biotite, as well as discrete crystals in the groundmass (Figure 3i). The hydrothermal apatite (Aph) occurs as an irregular and inhomogeneous grain (Figure 3j). It seems that Aph partly replaces the magmatic apatite. The Aph crystals appear darker in color than unaltered apatites under BSE imaging (Figure 3j). Magnetites are grouped into magmatic, reequilibrated, and hydrothermal types. Magmatic-Type 1 (MtT1) forms as euhedral to subhedral grains and is relatively pristine or homogeneous (Figure 3k), intergrown with ilmenite, amphibole, biotite, and plagioclase. Reequilibrated-Type 2 (MtT2) magnetite commonly occurs in subhedral to anhedral grains associated with potassic alteration, consisting of plagioclase, hydrothermal biotite, and quartz (Figures 3e,f). Hydrothermal-Type 3 (MtT3) occurs mostly as anhedral grains and is highly fractured or pitted, containing sulfide inclusions (chalcopyrite and pyrite) (Figure 3l). The description of selected samples is summarized in Supplementary Table S1.
3 Samples and analytical methods
In this investigation, samples are selected from a collection of twenty-one polished thin sections and fifteen polished sections from various depths of the ore-bearing diorite porphyry intrusion at the Masjeddaghi deposit (Supplementary Tables).
3.1 EPMA
The key samples, including biotite, amphibole, and apatite, were selected for geochemical and mineralogical analysis. Before analysis, each sample was covered with a thin carbon coating. Masaryk University, Czech Republic, conducted electron microprobe analysis (EMPA) utilizing a Cameca SX100® electron microprobe to measure the contents of major and minor elements, along with halogens. The detection limits for major and minor elements are as follows: 0.01 wt% and 0.001 wt%, respectively. Standard operating parameters for F, Fe, Cl, and Na included a beam current of 10 nA, a beam diameter of 3 μm, defined counting times ranging from 20 to 40 s, and an accelerating voltage of 15 kV. For Ba, Ti, Ca, Cr, Si, Mg, K, Mn, and Al, analytical conditions consisted of a 15 kV accelerating voltage, a 20 nA beam current, a 3 μm beam diameter, and a total pulse integration time of up to 10 s.
3.2 LA-ICP-MS
Trace element amounts were measured in fifteen representative samples containing abundant magnetite grains using the LA-ICP-MS. Trace elements analyses (n = 54 spots) and distribution maps (n = 1) for magnetite were conducted at LabMaTer, Université du Québec à Chicoutimi (UQAC), Canada. The LA-ICP-MS technique utilized an 193-nm Excimer Resonetics Resolution M-50 laser ablation system, equipped with a double volume cell S-155 and coupled with an Agilent 7,900 × mass spectrometer. A stage movement speed of 10 μm/s, a laser frequency of 15 Hz, and a fluence of 3 J/cm2 were utilized to examine the grains of magnetite. The magnetite grain surfaces were scanned using beam diameters ranging from 11 to 55 µm. According to the grain sizes, line scans across for large grains and spot analyses were conducted for small grains. The gas blank was recorded for 30 s prior to activating the laser for at least 30 s. The ablated material was transported into the ICP-MS by an argon-helium gas mix at a rate of 0.8–1 L/min for Ar, 350 mL/min for He, and 2 mL/min of nitrogen. Internal standardization was related to 57Fe based on stoichiometric iron content of magnetite. The specified isotopes were analyzed: 28Si, 34S, 57Fe, 59Co, 60Ni, 65Cu, 66Zn, 75As, 82Se, 95Mo, 101Ru, 103Rh, 105Pd, 107Ag, 111Cd, 118Sn, 121Sb, 126Te, 185Re, 189Os, 193Ir, 195Pt, 197Au, 208Pb, and 209Bi. GSE-1 g is one of the reference materials (RM) that were taken for standardization. GSE-1 g, a natural basaltic glass fused and doped with various elements at 300–500 ppm, was provided by the U.S. Geological Survey (USGS) and was utilized for element calibration based on reference data from the GeoReM database (Jochum et al., 2005). In magnetite, the 90Zr from 50Ti40Ar, 50V40Ar, and 50Cr40Ar; 92Zr from 52Cr40Ar; and 93Nb from 53Cr40Ar interferences are minimal, making corrections unnecessary. Element distribution maps were generated for select magnetite grains, illustrating relative element concentrations in a semi-quantitative manner. The different beam diameters and stage translation rates were modified to obtain an optimal balance of grain size and clarity, enhancing spatial coverage and analysis efficiency. Data reduction was carried out using the Iolite package for Igor Pro software (Paton et al., 2011). Element distribution maps were created with the Iolite software package, capturing the temporal variation in elemental composition, with concentration scales presented as internally standardized absolute ppm.
4 Results
4.1 Biotite chemistry
The calculation of cations for biotite was calculated based on 22 oxygen equivalents. Component names, mole fractions, estimation of ferric and ferrous iron based on stoichiometric limitations, fluorine and chlorine intercept amounts, and the biotite geothermometer were determined using the mica recalculation scheme, and fugacity ratios were calculated using Geo-ƒO2 software (Li et al., 2019). The XOH, XCl, and XF are the OH, Cl, and F mole fractions, respectively, in the hydroxyl site, and OH values were calculated automatically based on (Munoz, 1984). The results of all the analyses and chemical formula calculations are illustrated in Supplementary Table S2. Data show that the values of SiO2 range from 36.01 to 43.07 wt%, Al2O3 contents are (11.18–14.40 wt%), concentrations of TiO2 are between 2.26 and 4.47 wt%, FeO concentrations are (8.71–13.57 wt%), and MgO ranges from 16.57 to 21.99 wt%, Na2O, and K2O contents are 0.11–0.49 wt%, and 4.67 to 9.32 wt%, correspondingly. According to the Fe/(Fe + Mg) vs. AlIV classification diagram (Deer et al., 1992), most biotite samples fall within the field of the Eastonite composition (Figure 4a). In the ternary diagram of MgO-10×(TiO2)-(FeO + MnO) (Nachit et al., 2005), all the analyzed samples fall within the reequilibrated field (Figure 4b), indicating that the reequilibrated biotite likely has a magmatic source. Magmatic biotites have concentrations of AlIV <1 (Nachit et al., 2005). The amount of AlIV in most samples of Masgeddaghi is between 1.85 and 2.50 (mean = 2.27), so the biotite was probably formed from a magmatic-hydrothermal fluid, possibly derived from a hydrous magma (Supplementary Table S2).
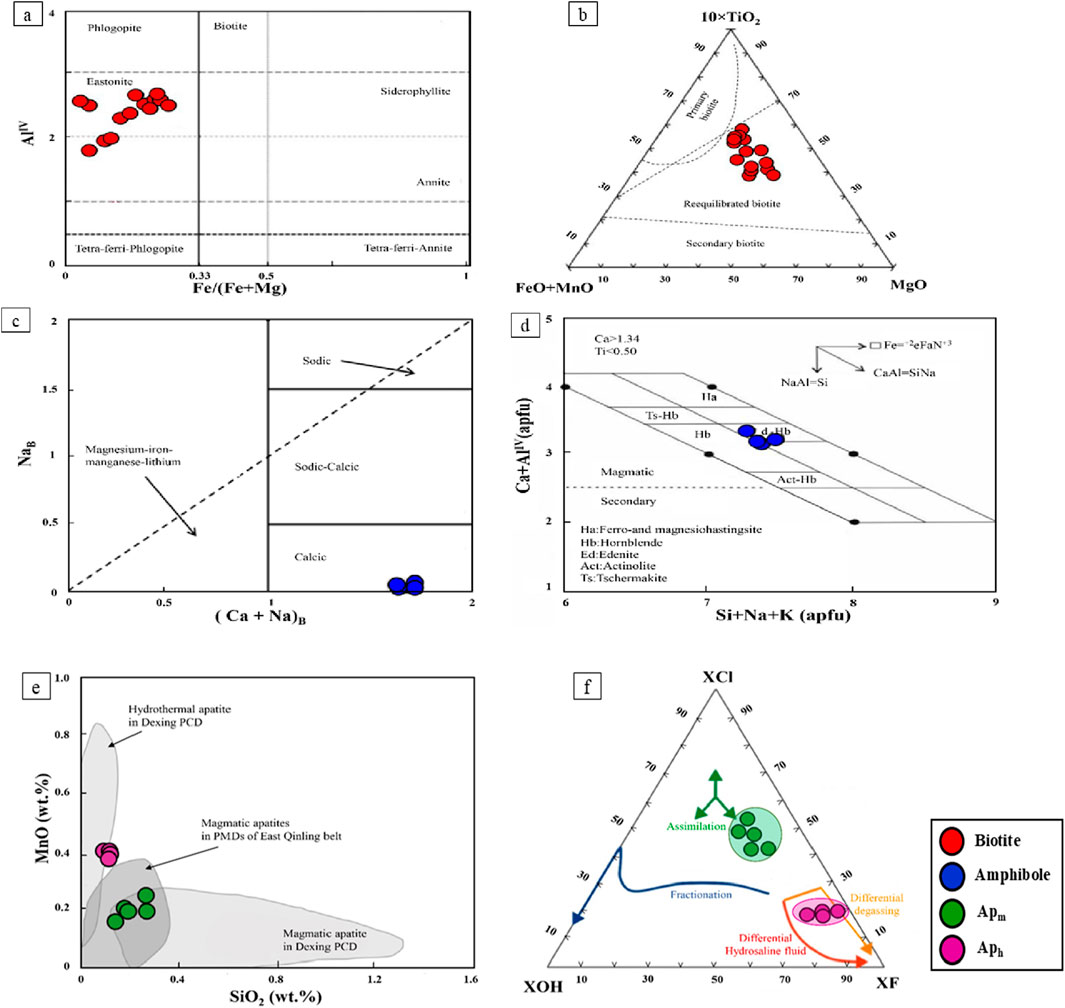
Figure 4. Chemical composition of biotite, amphibole, and apatite from the Masjeddaghi porphyry deposit on categorization diagrams: (a) The Fe/(Fe + Mg) vs. AlIV diagram (Deer et al., 1992); (b) Ternary 10×TiO2-FeO + MnO–MgO diagram (Nachit et al., 2005). Amphibole compositions from the Masjeddaghi porphyry deposit plotted on: (c) (Ca + Na)B vs. NaB (Leake et al., 1997); (d) Si + Na + K (apfu) vs. Ca + AlIV (apfu) diagram (Giret et al., 1980). Compositions of major and trace elements in Apm and Aph from the Masjeddaghi deposit: (e) SiO2 vs. MnO plot for apatite occurring in diorite porphyry. Dexing porphyry Cu deposit and the porphyry Mo deposits of the East Qinling Belt contain magmatic and hydrothermal apatite domains, which are based on data from (Zhao et al., 2020); (f) Ternary F-Cl-OH diagram (McCubbin et al., 2015). Abbreviations: Apm, magmatic apatite; Aph, hydrothermal apatite.
4.2 Amphibole chemistry
Calculation of amphibole structural formulae was based on 23 oxygen using WinAmptb programs (Yavuz and Döner, 2017). All analytical results are shown in Supplementary Table S3. Results show that the SiO2 contents of the diorite porphyry range from 45.70 to 47.33 wt% (6.66–6.89 apfu Si, where apfu refers to atoms per formula unit). The contents of Al2O3 are from 7.56 to 9.36 wt% (1.30–1.61 apfu Al). The TiO2 contents are between 1.19 and 1.63 wt% (0.13–0.18 apfu Ti). The amphiboles of diorite porphyry belong to calcic amphiboles with (Ca + Na)B >1.75, NaB <0.04, and CaB >1.75 (B means two M4 sites per formula unit, following the classification scheme of Leake, et al. (1997); Figure 4c). On the Si + Na + K (apfu) vs. Ca + AlIV (apfu) diagram, which is presented to distinguish magmatic and secondary amphiboles (Giret et al., 1980). The amphiboles in this study plot in the magmatic amphibole field with amounts of (Ca + AlIV) >2.5 (Figure 4d).
4.3 Apatite chemistry
The chemical formula calculations, along with the major and trace element content of apatite, are presented in Supplementary Table S4. The apatite chemical formula was determined based on the approach outlined by (Ketcham, 2015). The CaO and P2O5 concentrations as the major constituents of apatite in Apm grains range from 53.40 to 54.22 wt% CaO and 40.84 to 41.31 wt% P2O5, while in Aph grains range from 52.61 to 53.52 wt% CaO and 41.34 to 41.89 wt% P2O5. The MgO content varies from 0.05 to 0.10 wt%, whereas FeO ranges from 0.10 to 0.36 wt% in magmatic apatite types. Al2O3 and K2O are often below the detection limits in the magmatic apatite. The amounts of FeO, MgO, and K2O range from 0.15–0.21 wt%, 0.05–0.08 wt%, and 0.01–0.03 wt% in the hydrothermal apatite, respectively, although Al2O3 concentrations in the Aph grains are generally at or below the detection limit. Furthermore, BaO measurements are generally beneath the detection limits in both types of apatites. In the SiO2-MnO diagram (Zhao et al., 2020), over half of the apatites are plotted in the magmatic apatite domain (Figure 4e), hence, the composition of the apatites often reflects the nature of the parent magma that has crystallized directly from them. Although the dataset is limited, the consistency across multiple apatite grains suggests the trend is reliable and not solely the result of sampling bias. An F-Cl-OH ternary diagram indicates OH−, Cl−, and F−compositions in the halogen site of the studied apatites (McCubbin et al., 2015). On the diagram, the Apm grains plot within the composition range of the F-Cl-OH domain (Figure 4d), which are classified as OH-bearing F-rich chlorapatite. In addition, the Aph grains predominantly consist of fluorapatite with minimal Cl and OH concentrations (Figure 4f).
4.4 Magnetite chemistry
The trace element concentrations in magnetite are provided in Supplementary Table S5. Concentrations of elements are shown on box and whisker plots to present an enhanced visualization of elemental distribution across different types of magnetite (Figure 5). The yellow boxplots represent a single-phase magnetite population, identified as primary igneous magnetite based on consistent textures and homogeneous backscattered electron images. While the compositional range appears broad, it reflects natural variability in magmatic conditions and is within expected limits for magnetite from similar systems. MtT1 contains the highest concentrations of Ti (2,232–40886 ppm; mean 15,562.00 ppm; S.D. 19,313.69 ppm), Cr (1814.53–226046.11 ppm; mean 105,787.32 ppm; S.D. 93,435.62 ppm), Mn (4,509–19051 ppm; mean 11,643.83 ppm; S.D. 5,428.45 ppm), Co (45.22–305.98 ppm; mean 179.69 ppm; S.D. 111.17 ppm), Zn (82.66–14509.90 ppm; mean 6,422.07 ppm; S.D. 5,986.13 ppm), and Ga (11.73–133.93 ppm; mean 77.70 ppm; S.D. 53.26 ppm) coupled with the lowest Fe (51.77–65.05 wt%; mean 60.38 wt%; S.D. 5.62 wt%). Distribution of trace elements in magmatic magnetite compositions may evolve significantly by solid-state diffusion processes, such as inter-grain geochemical exchange with ilmenite, mineral exsolution, and oxy-exsolution of ilmenite (Tian et al., 2021), which is consistent with the presence of oxy-exsolution ilmenite platelets in MtT1 (Figure 3k). MtT2 has the highest concentrations of Ni (34.76–359.16 ppm; mean 215.56 ppm; S.D. 137.99 ppm), Sn (1.50–76.00 ppm; mean 6.03 ppm; S.D. 3.17 ppm), and Fe (66.07–69.87 wt%; mean 67.50 wt%; S.D. 1.15 wt%) contents are moderate. MtT3 has the highest concentrations of Sc (0.10–54.60 ppm; mean 14.94 ppm; S.D. 15.12 ppm); V (1185.94–4,076.50 ppm; mean 2065.88 ppm; S.D. 940.14 ppm); Pb (1.14–663.88 ppm; mean 147.37 ppm; S.D. 150.49 ppm), and Fe (70.68–78.52 wt%, mean 74.54 wt%; S.D. 2.03 wt%). While certain magnetite grains exhibit elevated levels of Cu, S, Ca, and Si amounts, the unusually high values of these elements are probably attributable to the occurrence of other sulfides and silicates (e.g., chalcopyrite, pyrite) inclusions. The LA-ICP-MS elemental mapping reveals that magnetite grains contain micro-inclusions-bearing trace elements, silicates, and sulfide minerals (Figure 6). Elemental mapping was conducted to illustrate the element distributions in magnetite, offering comprehensive insights into elemental variations. Figure 6 explains the LA-ICP-MS elemental map of a representative magnetite grain (sample MS11). Elevated concentrations of Co, Cr, and Ni are concentrated more in the center. Cu, As, Mo, Sb, and Te display increasing concentrations from the center toward the rim. The Pd contents are low. The Pt, Os, Ir, Au, Re, Ag, Ru, Bi, and Re concentrations fall below the detection limits and thus do not show any distribution in this magnetite grain (Magnetite number 51).
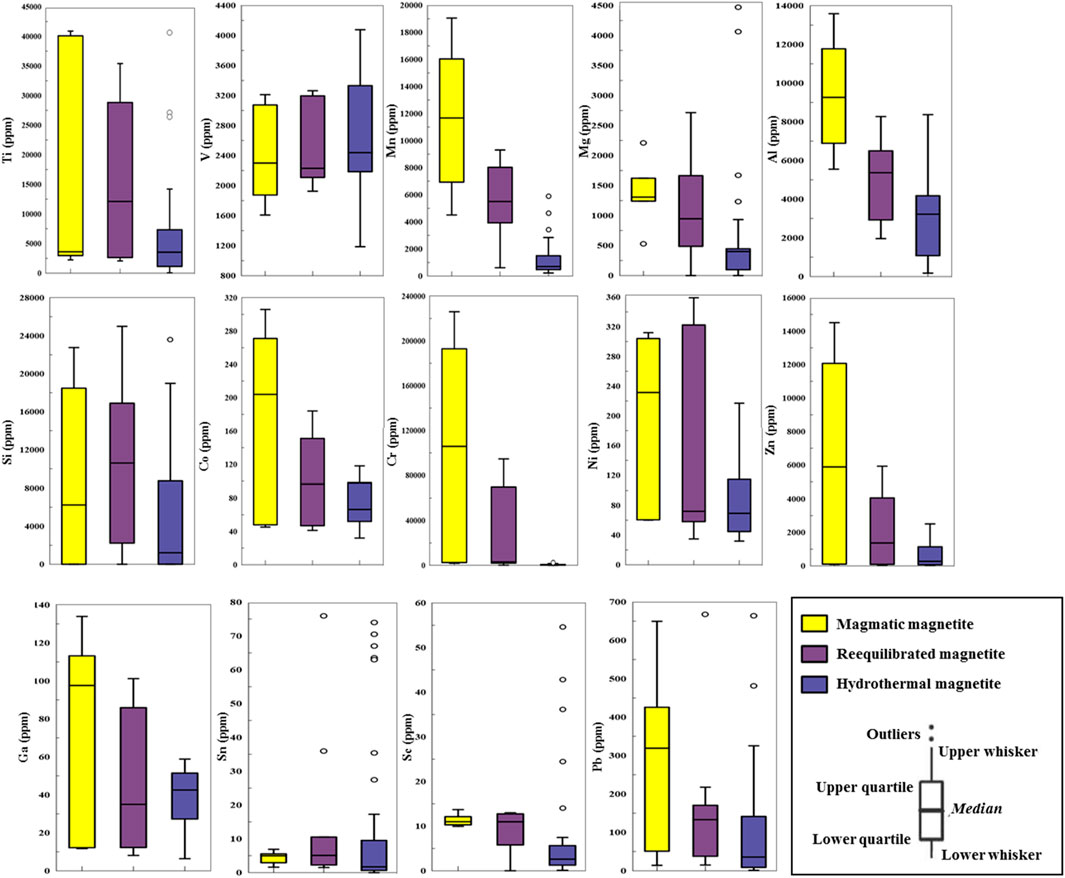
Figure 5. The element contents in magnetite were illustrated by Box and whisker plots. For specific elements, the lower whisker, lower quartile, and median values coincide since the majority of measurements are at or below the detection limit. The top 75% and bottom 25% of the data are represented by the upper and lower margins of the boxes, respectively.
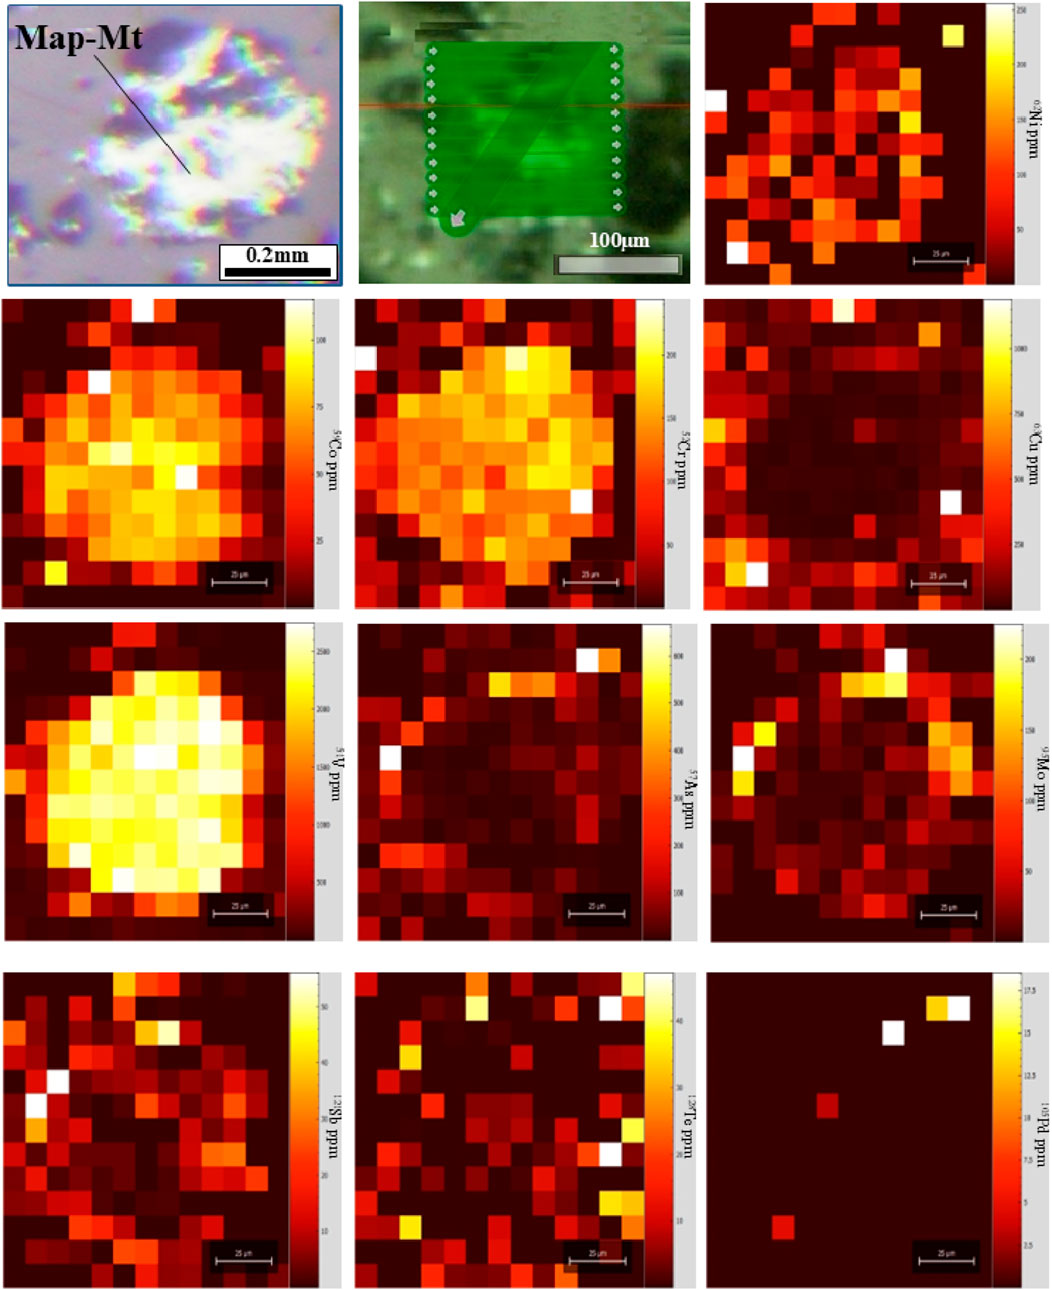
Figure 6. LA-ICP-MS elemental maps (raster) of the distribution of trace elements in magnetite (Mt) grain from the MS11 sample. Note that yellow areas represent high levels of elements, but purple areas show low concentrations.
5 Discussion
5.1 Petrogenetic implications
5.1.1 Tectono-magmatic characteristics based on biotite composition
The biotite composition is utilized to distinguish suites of alkaline anorogenic (A-type), calc-alkaline orogenic, and peraluminous (including S-type) settings in productive intrusions of porphyry systems (Abdel-Rahman, 1994). On the ternary diagram of MgO-FeOtot-Al2O3 (Abdel-Rahman, 1994), magmatic biotites from Masjeddaghi are within the calc-alkaline field (Figure 7a). In the diagram of MgO vs. Al2O3 (Abdel-Rahman, 1994), the biotites in the diorite porphyry are placed in field (C), that are related to calc-alkaline suites (Figure 7b). It suggests that the biotite of Masjeddaghi crystallized from magma with calc-alkaline features, which is related to the subduction setting. The MgO vs. FeO/(FeO + MgO) diagram is presented to determine the source of parental magma in porphyry systems (Zhou, 1986). Most biotites of the diorite porphyry are plotted in the field of mantle source. Several samples are scattered in the boundary between the mantle-crust and mantle source (Figure 7c). The diagrams suggest that the parental magma of intrusion in the Masjeddaghi porphyry deposit was formed through the interaction of subduction-derived mantle magma and crustal magma within the dioritic magma chamber.
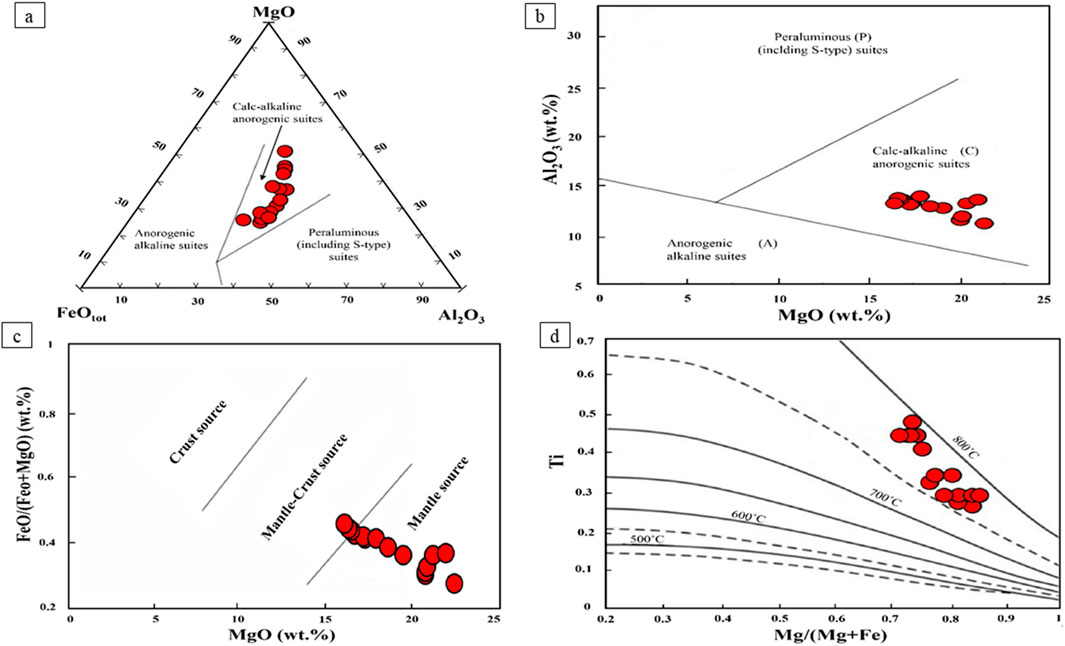
Figure 7. Biotite chemical composition from the Masjeddaghi deposit on tectonomagmatic discrimination diagrams: (a) Ternary MgO-FeOtot-Al2O3 diagram (Abdel-Rahman, 1994); (b) MgO vs. Al2O3 diagram (Abdel-Rahman, 1994); (c) MgO vs. FeO/(FeO + MgO) diagram for determining the source of parental magma in the Masjeddaghi porphyry (Zhou, 1986); (d) Temperature isotherms (°C) calculated from the surface-fit equation on Mg/(Mg + Fe) vs. Ti diagram (Henry et al., 2005). C-calc-alkaline orogenic suites; P-peraluminous suites (including S-type).
5.1.2 Ti-in-biotite thermometry
Biotite is one of the most important hosts of Ti in igneous rocks. The concentration of Ti and XMg = Mg/(Mg + Fe) can be plotted on XMg vs. Ti diagram to show that the Ti concentrations decrease with an increase in Mg/(Mg + Fe) (Henry et al., 2005). This figure shows isotherms projected for biotite. The calculated temperatures of biotites range from 723°C to 782°C (mean = 749°C) in the intrusion of the Masjeddaghi deposit (Figure 7d; Supplementary Table S2).
5.1.3 Aluminum-in-hornblende geobarometry
Numerous models were proposed based on the total Al concentration of amphibole to estimate geobarometry and geothermometry in calc-alkaline granitoid (e.g., Ridolfi and Renzulli, 2012). Ridolfi et al. (2010) provided new thermobarometric formulations for determining temperature, pressure, oxygen fugacity, and hygrometric conditions according to the phase stability and chemical balance of amphibole for calc-alkaline magmas, covering a temperature range (550°C–1120°C) and pressure (<1,200 MPa). The temperature and crystallization pressure of amphiboles in Masjeddaghi can be calculated by the subsequent Equations 1, 2 (Ridolfi et al., 2010):
The obtained temperatures are from 830 to 877°C (mean = 849°C), and also the estimated crystallization pressure of amphiboles varies between 120 and 186 MPa (mean = 144 MPa) for Masjeddaghi (Supplementary Table S3). If amphibole crystallization occurred after magma emplacement, a pressure of <200 MPa appears typical for the Masjeddaghi porphyry deposit. The diagram of T (˚C) vs. P (MPa) is presented to estimate the P-T condition of amphiboles from calc-alkaline products in subduction-related systems (Ridolfi et al., 2010). According to this diagram, selected amphiboles from Masjeddaghi are plotted mostly within the domain (1) (Figure 8a).
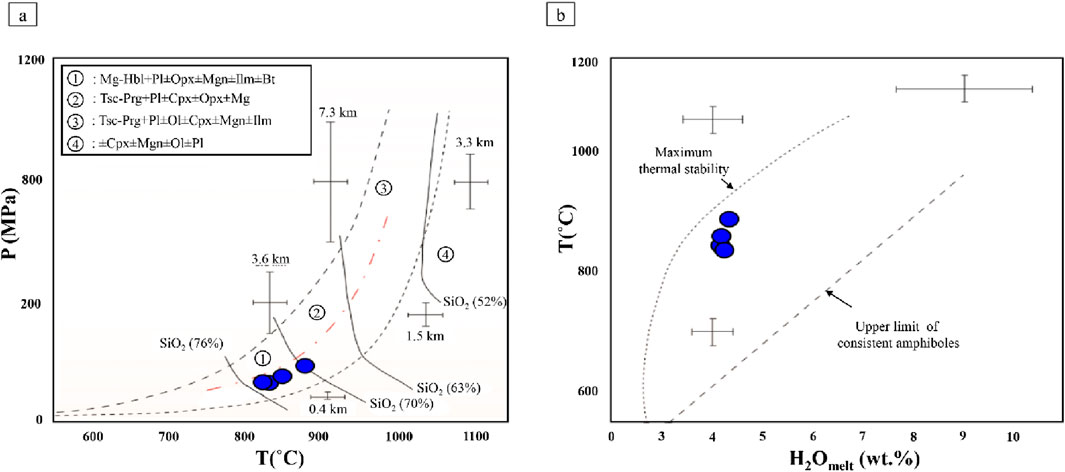
Figure 8. Amphibole compositions from the Masjeddaghi porphyry deposit plotted on: (a) Composition of calcic amphiboles on the T(°C) vs. P (MPa) diagram (Ridolfi et al., 2010); (b) H2Omelt (wt%) vs. T diagram (Ridolfi et al., 2010).
5.1.4 Crystallization conditions of apatite
In order to estimate the crystallization conditions of apatite, it is necessary to calculate the apatite saturation temperature (AST). It is assumed that the whole-rock composition represents the composition of the original melt, from which apatite crystallized, and AST can be estimated in melts with the composition of silicate (Harrison and Watson, 1984). In diorite porphyry, magmatic apatite predominantly appears as euhedral to subhedral inclusions in minerals (Figure 3i), indicating that the apatites formed at conditions near the liquidus of these rocks. For whole-rock analysis, we utilized re-processed whole-rock geochemical composition data previously published by Hassanpour and Alirezaei (2016), (Whole-rock geochemical composition data are reported in Supplementary Table S6; the AST was estimated using the equation proposed by Harrison and Watson (1984), as the following Equation 3:
here SiO2 corresponds to the weight fraction of silica in the melt, T represents temperature (K), and DP represents the partition coefficient of phosphorus between apatite and melt. AST in diorite porphyry ranges from 845°C to 918°C (mean = 888°C) (results are listed in Supplementary Table S7).
5.1.5 Estimation of water contents
The AlVI amount in amphibole is influenced by the melt’s water abundance, therefore, AlVI can serve as an indicator of the equilibrium range of amphibole formation (Ridolfi et al., 2010). The water amount of melt relative to amphibole crystallization is estimated through the subsequent Equation 4 proposed by Ridolfi et al. (2010):
where [6]Al*= ([6]Al+[4]Al/13.9 – (Si+[6]Ti)/5 – CFe2+/3 – Mg/1.7+(BCa + A[])/1.2 + ANa/2.7–1.56 K – (Fe2+/(Fe2++Mg))/1.6.
According to the diagram of H2Omelt (wt%) vs. T (Ridolfi et al., 2010), H2Omelt of the Masjeddaghi porphyry deposit ranges from 4.10 to 4.46 wt% (mean = 4.25 wt%) (Figure 8b; Supplementary Table S3). This amount of magmatic water suggests that Cu mineralization is linked to hydrous calc-alkaline magma in Masjeddaghi. The amphibole crystallization depths (km) can be estimated based on the calculated pressure, assuming standard density weights of 2.89 g/cm3 for the oceanic crust and 2.70 g/cm3 for the continental crust (Ridolfi et al., 2010). Based on the depth formula of Ridolfi et al. (2010), the amphibole formation depths are calculated within the range of 4.2–9.9 km (mean = 6.5 km) for the oceanic crust, and 3.9–9.3 km (mean = 6.08 km) for the continental crust (Supplementary Table S3). Based on amphibole crystallization data, it suggests a deep magmatic reservoir for the Masjeddaghi deposit.
5.1.6 Origin of the Masjeddaghi magnetite
Based on chemical and textural features of MtT1, MtT2, and MtT3, different origins are recognized for the three types of magnetite. MtT1 homogeneous visual textural, suggesting that it crystallized during the early phase of the cooling magma. Furthermore, the high amounts of Ti, Ni, Cr, V, Al, Mg, and Mn in the MtT1, because of high concentrations in silicate melts and/or significant distribution factors between magnetite and silicate melt at elevated temperatures (Wen et al., 2017), indicate a magmatic origin for MtT1 (Wen et al., 2017). MtT2 has lower contents for trace elements like V, Ti, and Al than the MtT1 phase, indicating MtT2 was produced by hydrothermal fluid-coupled dissolution and reprecipitation (CDRP) of the precursor magmatic magnetite. The reequilibrated magnetite in rocks is likely hydrothermal in origin due to the presence of a fluid phase. The hydrothermal alteration results in the dissolution and reprecipitation process in Magnetite MtT2. Dissolution-reprecipitation refers to the process in which the previous assemblages are substituted by more stable ones during physicochemical condition changes (Guo et al., 2020). This is generally triggered by changes in temperature, salinity, and oxygen fugacity of the fluids (Guo et al., 2020). MtT3 has low values of Cr, V, Ti, Ni, and Al, consistent with hydrothermal magnetite in porphyry deposits (e.g., Nadoll et al., 2014; Guo et al., 2020). Moreover, the trace element geochemistry in MtT3 may reflect the hydrothermal fluid conditions (Guo et al., 2020). This observation indicates that the hydrothermal fluid that precipitated MtT3 is responsible for the hydrothermal alteration zones. Magnetite is formed in a variety of geological environments, crystallizing from different types of melts or precipitating from hydrothermal fluids (Dare et al., 2014). Recent studies have tried to chemically distinguish magmatic magnetite from hydrothermal magnetite. On this basis, diverse diagrams were designed to be used to determine the origin of magnetite (Nadoll et al., 2014). Dare et al. (2014) have proposed that the behavior of Ni and Cr is a key indicator for distinguishing magmatic magnetite from hydrothermal magnetite. For example, magmatic magnetite has Ni/Cr ratios ≤1 due to both elements’ compatible behavior during the differentiation of intermediate and felsic melts. In contrast, hydrothermal magnetite has Ni/Cr ratios ≥1, as Ni has a greater dissolvability relative to Cr in fluids (Dare et al., 2014). However, in the Ti vs. Ni/Cr diagram, most of our magnetite types fall within the “magmatic magnetite” domain. Alternatively, Wen et al. (2017) have suggested a V/Ti vs. Fe classification diagram to distinguish magmatic and hydrothermal magnetite, which is divided into three fields magmatic, reequilibrated, and hydrothermal. A temperature increase enhances the Fe solubility in magnetite, leading to iron undersaturation in fluids (Wen et al., 2017), which facilitates the dissolution of primary magnetite and the crystallization of new magnetite generations. Therefore, iron concentrations serve as a key index for differentiating from magmatic and hydrothermal magnetite. Contents of V, Fe, and Ti, in Masjeddaghi plot on the Fe vs. V/Ti diagram (Wen et al., 2017) (Figure 9a). The unaltered MtT1, interpreted to have crystallized primarily from silicate melt, falls within the magmatic field. However, the observed spread in Fe content may indicate solid solution behavior involving other spinel endmembers. The widespread Fe content and the potential implications for solid solution behavior in MtT1. MtT2, which formed via coupled dissolution and reprecipitation of magmatic magnetite, was plotted in the reequilibrated field. Dissolution-reprecipitation is a fluid-assisted process in which primary magnetite may have been reequilibrated by dissolution and reprecipitation during late deformation (Wen et al., 2017). Throughout the process, trace elements (such as Al, Ga, Ti, Cr, Ca, Mn, Co, and Mg) are reduced in primary magnetite (Wen et al., 2017). Dissolution-reprecipitation processes cause an abundance of micro-porosity in the newly formed magnetite grains (Wen et al., 2017). These micropores allow hydrothermal penetration at the contact interface and facilitate the further advancement of the dissolution-reprecipitation process within the crystal (Wen et al., 2017). MtT3, which has deposited directly from hydrothermal fluids, falls in the hydrothermal field. Hydrothermal magnetite has higher concentrations of iron but lower trace elements. In the Ti vs. V diagram that is determined based on the contents of Ti and V in magmatic magnetite and hydrothermal magnetite (Nadoll et al., 2015), most magnetite samples from Masjeddaghi fall within the magmatic domain, while some hydrothermal magnetite plots in the overlapping region between magmatic and hydrothermal fields (Figure 9b). This distribution may be explained by the contribution of a Ti-rich melt and subsequent enrichment of the hydrothermal fluid in Ti, possibly derived from interaction with or leaching of earlier crystallized phases like MtT1. These patterns highlight the combined influence of magmatic and hydrothermal processes on magnetite composition.
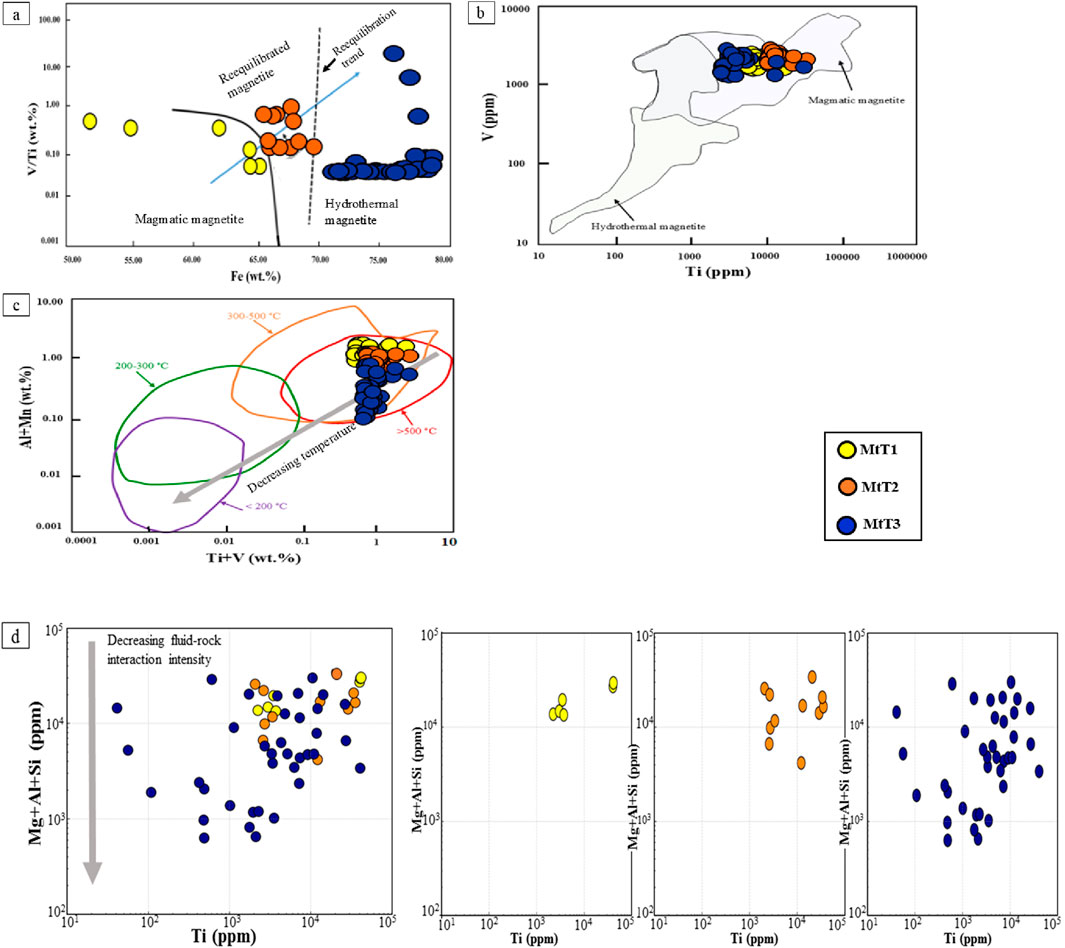
Figure 9. (a) Fe vs. V/Ti diagram (Wen et al., 2017); (b) Ti vs. V diagram (Nadoll et al., 2014); (c) Ti + V vs. Al + Mn diagram (Tian et al., 2021); (d) Ti vs. Mg + Al + Si (ppm) diagram (Tian et al., 2021).
5.1.7 Controlling factors in the chemical compositions of magnetite
The variation of trace elements across various types of magnetite is influenced by temperature, salinity, pressure, and oxygen fugacity (fO2), and fluid-rock interaction in porphyry deposits (Tian et al., 2021). Temperature plays a major role in controlling the trace element composition of magnetite, with a positive correlation observed between formation temperature and Ti content (Tian et al., 2021). In Masjeddaghi samples, the decreasing average Ti contents in the sequence of MtT1 (15,562 ppm)→ MtT2 (12,121 ppm)→ MtT3 (6,414 ppm), indicates a decreasing trend of Ti concentrations and magnetite formation temperature in hydrothermal magnetite. Moreover, the Ti, Al, V, and Mn element contents may also reflect the magnetite formation temperature (Tian et al., 2021). The Ti + V vs. Al + Mn diagram (Figure 9c; Tian et al., 2021) indicates that most of the magnetite formation of Masjeddaghi extends the increased-temperature range (i.e., 300°C–500°C, >500°C) and aligns with the decreasing temperature trend from MtT2 to MtT3. Vanadium, as another indicator element, can be used to detect the forming environment in magnetite. Because V exhibits high reactivity in low-temperature hydrothermal fluids (Wen et al., 2017). V3+ is more readily incorporated into the magnetite structure in a reducing environment because of its ionic radius being very similar to Fe3+, thus, V is an important indicator fluid fO2 evolution (Tian et al., 2021). At Masjeddaghi, the average V contents show a slight decreasing trend of MtT1 (2,395 ppm) → MtT2 (2,361 ppm), then increase from MtT2 through MtT3 (2,602 ppm). The small difference between MtT1 and MtT2 suggests a shared magmatic origin and fluid fO2. In contrast, V content increases in MtT3, indicating a shift to more reducing conditions during late-stage hydrothermal alteration. This trend suggests that while MtT1 and MtT2 formed from a common magmatic fluid, MtT3 reflects crystallization from a distinct hydrothermal fluid with lower fO2. Contents of Mg, Al, Si, and V elements can accumulate in hydrothermal magnetite by wide fluid-rock interactions. For the Masjeddaghi magnetite, the Mg, Al, Si, and Ti concentrations are displayed on the Ti vs. Mg + Al + Si diagram (Tian et al., 2021; Figure 9d) in order to provide a clearer insight into the effect of the extent of fluid-rock interactions. The higher Mg and lower Si content in MtT1 (Figure 9d) indicate minimal fluid-rock interaction, consistent with its magmatic origin. In contrast, MtT2 and MtT3 exhibit progressively lower Mg and higher Si contents, reflecting increasing degrees of fluid-rock interaction. This trend is illustrated by the grey arrow in Figure 9d, which represents increasing fluid-rock interaction from MtT1 to MtT3. MtT3 typically shows stronger fluid-rock interaction, whereas MtT1, formed during the magmatic phase, retains lower concentrations of fluid-mobile elements.
5.2 Metallogenic implications
5.2.1 Metallogenic implications based on magnetite chemistry
In the last decades, various research efforts have indicated that the trace elements in magnetite may serve to differentiate the origin and classification of deposits (e.g., Dare et al., 2014; Nadoll et al., 2014). The content of trace elements such as Ni, Cr, Si, Mg, Al, Mn, Ti, and V have been used to discriminate the different ore deposit types, and numerous diagrams were presented based on their variations between deposits like porphyry, skarn, banded iron formation (BIF), IOCG, Kiruna, and Fe-Ti-V magmatic deposits (Dupuis and Beaudoin, 2011; Nadoll et al., 2014). In this study, the (Ti + V) vs. (Al + Mn) diagram is used (Figure 10) for discriminating the ore deposit type. Some samples mainly plot in the porphyry and skarn fields (Figure 10), proposing that the magnetite grains primarily originated from magmatic-hydrothermal fluids. One of the reasons that some samples of MtT2 plot in the skarn region is probably due to intense fluid-rock interactions during MtT3 formation, while the high temperature during MtT2 evolution leads to elevated Mn and Al concentrations in magnetite (Harrison and Watson, 1984).
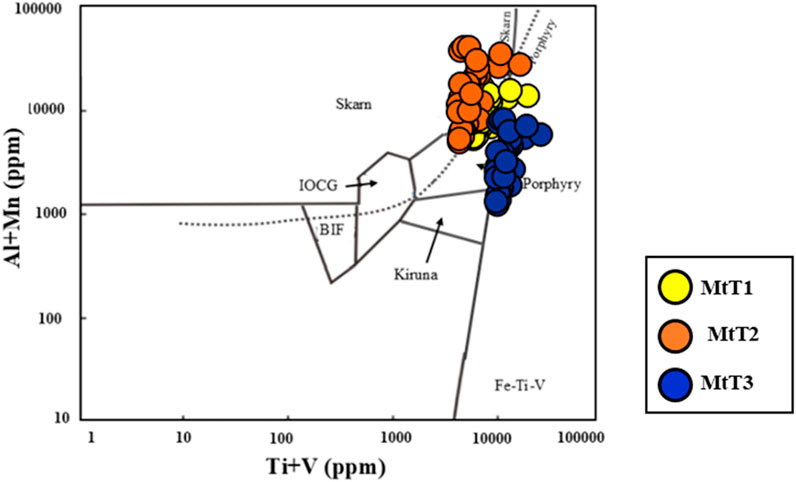
Figure 10. Discrimination plots of Ti + V vs. Al + Mn (ppm) (Nadoll et al., 2014).
5.2.2 Oxidation conditions of parental magma
Based on investigations of porphyry deposits, oxidized magmas with elevated oxygen fugacity (ƒO2) are characteristic of most porphyry copper systems. (Sun et al., 2015). Consequently, such oxidized magmas are considered favorable for porphyry mineralization. The ternary Fe3+-Fe2+-Mg2+ diagram (Wones and Eugster, 1965) shows ƒO2 according to the compositions of biotite. Biotites in the Masjeddaghi are plotted above the Ni–NiO buffer, which implies they crystallized under conditions of high ƒO2 (Figure 11a). The biotites of the mineralized Masjeddaghi indicate ƒO2 measurements vary from 10−14.23 to 10−15.63 (Supplementary Table S2). The T (°C) vs. log ƒO2 diagram is used to represent the oxygen fugacity levels in oxidized porphyry deposits [1], biotites of the Masjeddaghi deposit fall within the Ni–NiO buffer domain (Figure 11b), and selected apatites are plotted in the I-type oxidized magma curve (Figure 10b). Thus, the Masjeddaghi intrusion is classified as an oxidized I-type magma system with high oxygen fugacity.
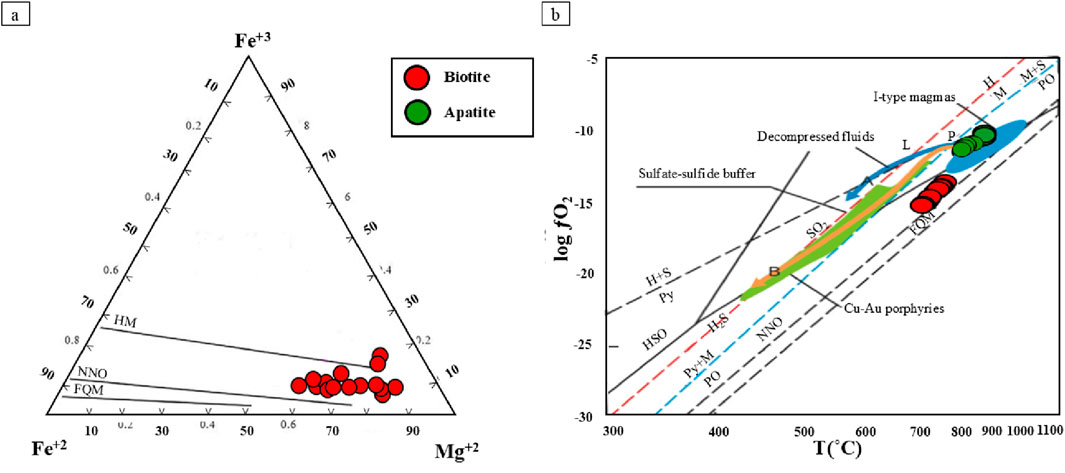
Figure 11. Compositions of biotites, and apatites from the Masjeddaghi deposit on Oxygen fugacity diagrams: (a) Ternary Fe3+-Fe2+-Mg2+ diagram in biotites (Wones and Eugster, 1965); (b) The oxygen fugacities of oxidized porphyry deposits on T(°C) vs. log ƒO2 diagram (Sun et al., 2015). Abbreviations: MH, Magnetite-Hematite buffer curve; NNO, Nickel-Nickel Oxide buffer curve; FMQ, Fayalite-Magnetite-Quartz buffer curve; IW, Iron- Wüstite.
Redox-sensitive elements like S, Ce, Mn, and Eu in apatite serve as indexes to evaluate the oxidation state of magma (Miles et al., 2014). In general, Mn2+ shows a similar ion radius to Ca2+, thus, this element enters the lattice of apatite (Sun et al., 2019). The variation of a single-element in apatite is affected by changing physicochemical conditions during mineral crystallization. For example, the Mn content in magma can fluctuate during crystallization (Sun et al., 2019). Therefore, the multi-variance elements like Mn with opposite partitioning behaviors in apatite can be efficient in determining changes in the oxidation state (Sun et al., 2019). The ƒO2 conditions of apatite in Masjeddaghi intrusion can be estimated using Mn-in-apatite as an oxybarometer and redox proxy expression based on Equation 5 (Miles et al., 2014):
The estimated ƒO2 for the diorite porphyry varies between 10–10.3 to 10–11.1, indicating that Masjeddaghi ore-forming magmas are quite oxidized (Supplementary Table S4).
5.2.3 Halogen fugacity of fluids based on apatite chemical composition
It seems the volatile diffusions in apatite appear during the prolonged cooling of magmatic rock (Zhao et al., 2020). A model presented by Piccoli et al. (1999) is used to determine the halogen fugacity ratios. This model estimates the fugacity of HCl and HF in the magmatic volatile phase (MVP) based on Cl and F contents in apatite chemical composition based on Equations 6, 7:
here T represents temperature (K), P is given in bar, and X(Clap), X(Fap), and X(Hap) correspond to mole fractions of hydroxylapatite, chlorapatite, and fluorapatite (Piccoli et al., 1999). Piccoli et al. (1999) proposed that amphibole geobarometry can serve to determine pressure in calculations. The concentrations of log(ƒH2O)/(ƒHCl) and log(ƒH2O)/(ƒHF) ratios were calculated in fluids associated with apatite. We took into account the estimated AST (Supplementary Table S7) and the amphibole crystallization pressure (120–186 MPa, mean = 144 MPa) as T and P in these equations. The concentrations of log(ƒH2O)/(ƒHCl) in fluids associated with apatite range from 1.67 to 1.84 (mean = 1.74). The log(ƒH2O/ƒHF) values in fluids associated with apatite vary from 4.34 to 4.48 (mean = 4.44) (data are presented in Supplementary Table S4), which indicates apatite was in equilibrium with Cl-rich fluids. The concentrations of log(ƒH2O)/(ƒHCl) in fluids of apatite are from 1.67 to 1.84 (mean = 1.74). The log(ƒH2O/ƒHF) contents in fluids of apatite vary between 4.34 and 4.48 (mean = 4.44) (data are presented in Supplementary Table S4), which implies apatites equilibrated with Cl-rich fluids.
5.2.4 Comparison of hydrothermal fluid fugacity ratios in biotite with other porphyry Cu deposits
The halogen fugacity values for hydrothermal fluids associated with mineralization and alteration phenomena at the Masjeddaghi porphyry Cu-Au deposit have been contrasted with those fluids linked to other porphyry copper systems (Figures 12a,b). Various factors affect the combination of fluids related to types of porphyry deposits; the most important of them is the composition of the source and the volatile composition (especially F/Cl and F/H2O ratios of the reservoir and magma) (Afshooni et al., 2013). The log(ƒH2O/ƒHCl) and log(ƒHF/ƒHCl) values for the Masjeddaghi plot in the domain of those of Bingham, Santa Rita, and Babine Lake porphyry deposits (Figure 12a). On the log(ƒH2O/ƒHCl) vs. log(ƒH2O/ƒHF) diagram (Figure 12b), the halogen fugacity ratios of biotite do not overlap with other deposits. The Masjeddaghi porphyry deposit, characterized by its negative log(ƒHF/ƒHCl) fugacity ratios, have similarities with those observed in other porphyry Cu systems, such as Bingham, Santa Rita, and Babine Lake, where negative values of log(ƒHF/ƒHCl) imply a comparatively Cl-rich hydrothermal system (Figure 12a). Chloride is the most abundant ligand in aqueous solutions that form strong complexes with Cu and Au (Xiao et al., 1998). Therefore, it seems that Cu and Au are carried by Cl-rich fluids as metal-chloride ligands to form the Masjeddaghi porphyry deposit.
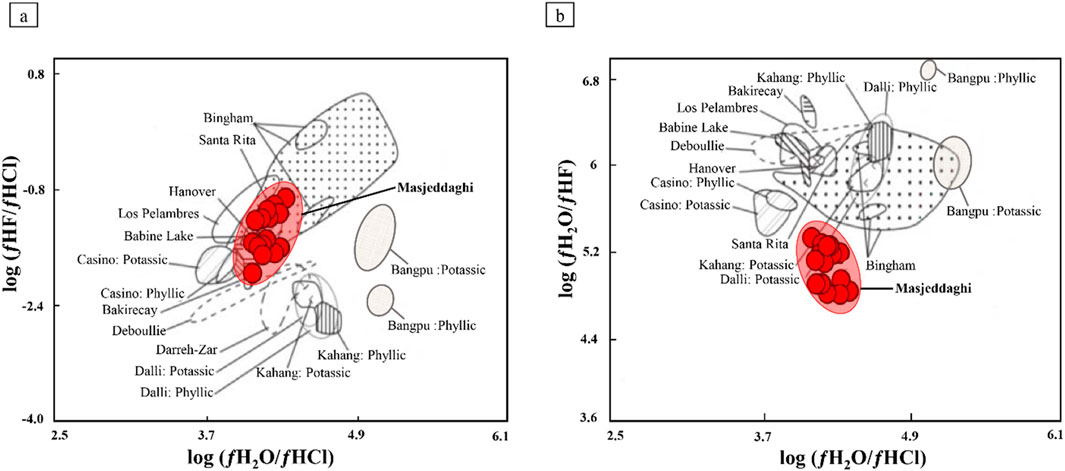
Figure 12. Comparison of the Masjeddaghi porphyry Cu-Au deposit with other porphyry systems: (a) log(ƒH2O/ƒHCl) vs. log(ƒHF/ƒHCl) and (b) log(ƒH2O/ƒHCl) vs. log(ƒH2O/ƒHF) ratios. The fugacity ratios for the Santa Rita, Los Pelambres, Bakircay, Hanover, Bingham, Babine Lake, Casino, and Deboullie porphyry Cu deposits are from Afshooni et al. (2013).
5.2.5 Thermodynamic modeling of the evolution of volatile elements in apatite
H2O, S, Cl, and F as volatile elements in silicate melts play a key role in volcanic eruptions and the magmatic evolution (Li and Costa, 2020). Additionally, volatile elements influence the transportation and metal deposition and determine the development of porphyry copper deposits (Li, et al., 2020). The crystal structure of apatite contains various volatile elements, including CO2, S, Cl, F, and H2O (OH) (Li and Costa, 2020), and apatite commonly appears as inclusions within other igneous minerals. In this research, to examine the distribution behavior of the F, OH, and Cl in apatite and its associated melt and to estimate volatile values in the melt, we utilize thermodynamic modeling of apatite chemical compositions following the approach suggested by (Li and Costa, 2020). Li and Costa (2020) introduced equations to estimate the Cl, F, and OH (KD) exchange coefficients between silicate melts and apatite as follows Equations 8–10:
here, apatite chemical compositions are given as mole fractions of OH, F, and Cl in apatite. (XApi), T denotes temperature in Kelvin, while R stands for the constant of the universal gas. Thus, using this model, we estimate the melt H2O content, the OH, F, and Cl activity coefficients of apatite (γApi), the OH, F, and Cl exchange coefficients (KD) between melts and apatite, the OH content in the melt, and OH, F, and Cl the mole fractions in apatite at equilibrium with the melt chemistry composition (data are reported in Supplementary Table S9). According to data, in diorite porphyry, apatite reveals F melt values between 700 and 900 ppm (mean = 780 ppm) and Cl melt contents vary from 5,000–5,900 ppm (mean = 5,360 ppm) (Supplementary Table S8). The XF/XCl and XCl/XOH ratios in the diorite porphyry of Masjeddaghi are evaluated in comparison to measurements of these proportions in ore-bodies of the Duolong porphyry system (Li et al., 2020; Figure 13a). The XF/XCl and XCl/XOH concentrations in the apatite of Masjeddaghi reveal a trend indicative of magmatic evolution. This indicates a trend of volatile-undersaturated crystallization, suggesting that the apatite crystallized from the magma before it reached vapor saturation (Figure 13a) (Li et al., 2020). Therefore, the apatite grains formed from a melt with diorite composition at elevated temperatures. The SO3 and XF/XCl concentrations in apatite of Masjeddaghi are plotted on the XF/XCl and SO3 diagram. A significant resemblance is observed within apatite grains in the diorite porphyry of Masjeddaghi and apatite inclusions in amphibole from the diorite intrusion of Duolong (Figure 13b). The trend of SO3 variations, along with a relatively increasing XF/XCl ratio, suggests that volatile separation likely took place at temperatures ranging from 880°C to 890°C (Figure 13b). Therefore, the variations in volatile elements observed in magmatic apatite from diorite porphyry likely indicate the crystallization of apatite from volatile-undersaturated melts and magmatic evolution in ore-forming magmas.
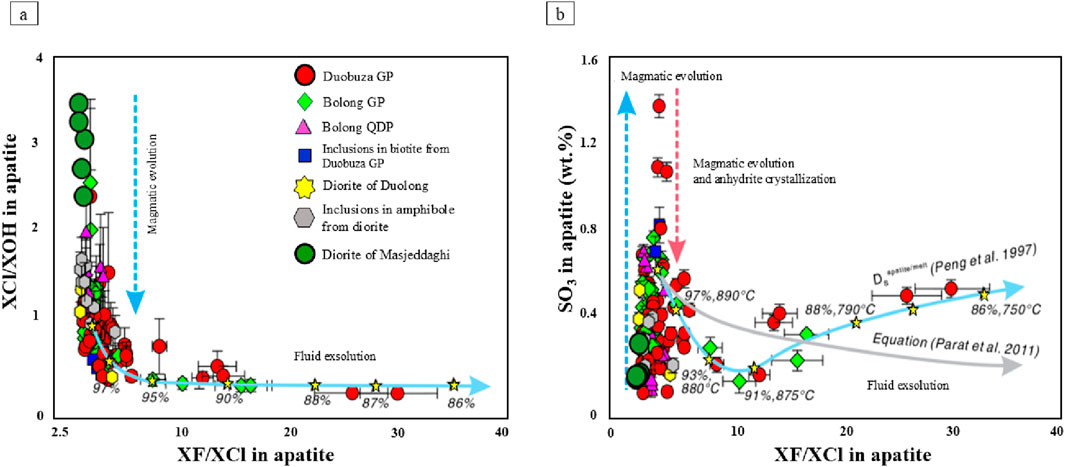
Figure 13. A comparison of apatite volatile elements variations between diorite porphyry of Masjeddaghi and the intrusions of the Duolong porphyry deposit. These figures illustrate the compositional variations in apatite volatile elements during their evolution from volatile-undersaturated to volatile-saturated magma. (a) XF/XCl vs. XCl/XOH in apatite; (b) XF/XCl vs. SO3 in apatite. The blue solid curves in (a,b), derived from the Rayleigh fractionation model, depict the variation of volatile elements in apatite during fluid exsolution. Each yellow star represents calculated apatite composition corresponding to the fraction of the remaining melt (ƒ shown as %) and temperature (°C) in the Rayleigh fractionation model. Gray solid curve in (b) represents the variation of apatite SO3 contents that were estimated by the empirical equation (Li et al., 2020). The ore-bearing granodiorite porphyries of the Duolong porphyry system contain biotite phenocrysts with apatite inclusions, as documented by (Li et al., 2020). Abbreviations: GP, granodiorite porphyry; QDP, quartz diorite porphyry.
5.3 Implications for the formation of the Masjeddaghi porphyry Cu-Au deposit
According to the data presented, we suggest the following model for magmatic evolution linking the formation of the Masjeddaghi porphyry Cu-Au deposit to the sequences of mineral crystallization within a dioritic magma chamber (Figure 14). Magmatic apatite grains began crystallizing from the early stage of Masjeddaghi dioritic magmas at ∼918°C (Figure 14a). Based on mineral thermometry and petrography that magmatic magnetite crystallized coeval or nearly coeval with magmatic apatite at ∼918°C in the early stages of the Masjeddaghi dioritic magma evolution (Figure 14a). Magmatic magnetite is often found intergrown with magmatic apatite (Figures 3i,k), indicating that it formed during the same magmatic pulse. It is also characterized by high Ti, Cr, Mn, and Co contents, which are compatible elements in high-temperature melts. The presence of zoned amphibole (Figure 3h) suggests that mafic magma was injected into the dioritic magma chamber, with mixing possibly taking place across several phases of amphibole crystallization at a depth of approximately ∼10 km (Figure 14b). Subsequently, magmatic biotite formed at shallower depths and lower temperatures (∼4 km and ∼782°C) as the mixed magma continued to rise; it may have intruded into the surrounding wall rocks (Figure 14b). During this ascent and magma-hydrothermal transition, partial reequilibrated magnetite occurred via fluid-coupled dissolution-reprecipitation, resulting in subhedral magnetite with reduced trace element contents. The mineral thermometer, based on the established empirical equation, confirmed the mineral crystallization sequences, where the calculated apatite saturation temperature (∼845°C-918°C) falls within the range of Al-amphibole (∼830°C-877°C) and above that of biotite temperature (∼723°C to 782°C). At a depth of 4–10 km, an oxidized and hydrous mafic magma derived from a deeper source intruded into the dioritic magma chamber (Figure 14b). The introduction of oxidized and hydrous mafic magma from the resource into the evolved dioritic magma chamber led to significant magma mixing and continuous fractional crystallization of apatite, magnetite, amphibole, and biotite, causing the formation of the Masjeddaghi deposit with ore-forming fluid exsolution (Figure 14b). Thus, the continued fractional crystallization of apatite, magnetite, amphibole, and biotite, associated with high oxygen fugacity, enhanced water amount, and metal concentrations in the mafic magma, is crucial for the formation of ore-forming porphyry in the Masjeddaghi deposit.
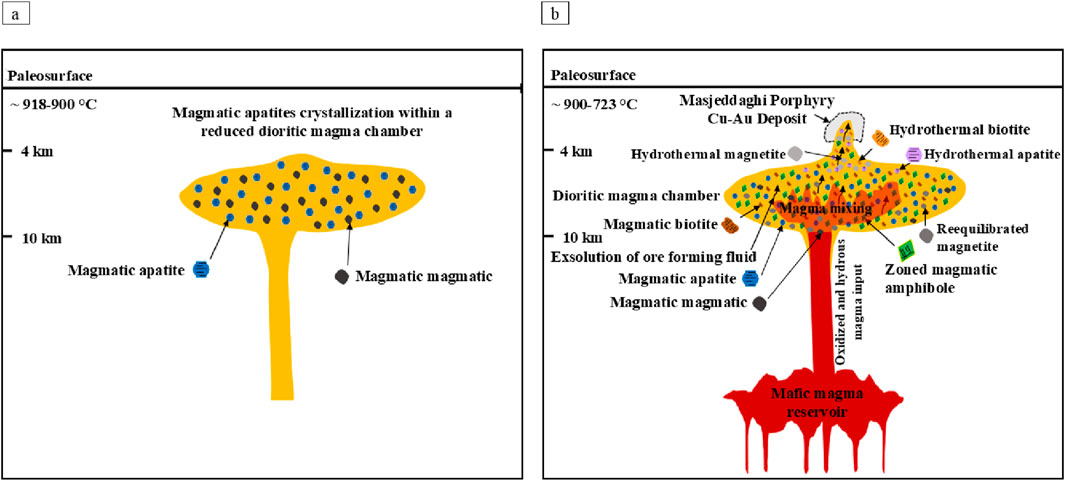
Figure 14. Conceptual model depicting the stages of mineral formation in the Masjeddaghi mature dioritic magma chamber (Rahnama, 2021): (a) Simultaneously, magmatic apatite and magnetite grains were formed in a reduced dioritic magma chamber at ∼918°C; (b) The intrusion of oxidized and hydrous mafic magma from a deeper magma source introduced significant magma interaction and sustained fractional crystallization of apatite, magnetite, amphibole, and biotite in an evolved dioritic magma chamber with fluid exsolution, leading to the formation of the Masjeddaghi deposit.
6 Conclusion
According to the analysis and discussions, we derived the subsequent conclusions:
1. Biotite and amphibole compositions show a parental magma with calc-alkaline features, suggesting a source comprised of subduction-related mantle and crustal materials.
2. The Al-in-amphibole geothermometer, the apatite saturation temperature, and the Ti-in-biotite geothermometer show ranges of calculated temperatures (830°C–877°C) (845°C-918°C) and (723°C–782°C), respectively, whereas the Al-in-amphibole geobarometer exhibits pressures (120–186 MPa; equating to depths of 4–10 km), indicating the existence of a deep magmatic origin beneath the deposit. The H2Omelt contents of amphibole (4.10–4.46 wt%) display that the mineralization is associated with a hydrous calc-alkaline magma.
3. According to concentrations of trace elements and mineral associations, magnetites are classified into magmatic, reequilibrated, and hydrothermal types in the Masjeddaghi porphyry deposit. Some Masjeddaghi magnetite samples overlap between the porphyry and skarn fields in the Ti + V vs. Al + Mn (ppm) diagram, suggesting that the diagram may not be reliable for distinguishing porphyry-related deposits.
4. The estimated log ƒO2 for biotites ranges from 10–14.23 to 10–15.63 and for apatites ranges from 10–10.3 to 10–11.1, suggesting that the ore-forming magmas are consistent with characteristics of oxidized I-type magmas.
5. The Masjeddaghi porphyry system, with its negative log(ƒHF/ƒHCl) fugacity ratios, has similarities with those of the other porphyry systems, such as Bingham, Santa Rita, and Babine Lake, where negative values of log(ƒHF/ƒHCl) imply a relatively Cl-rich hydrothermal system. It seems that Cu and Au are transported by Cl-rich fluids as metal-chloride ligands to form the Masjeddaghi porphyry deposit.
6. The observed trends in the XF/XCl and XCl/XOH ratios of apatite from the Masjeddaghi deposit display a pattern of magmatic evolution characterized by volatile-undersaturated crystallization. The variation in volatile elements in apatite suggests that primary volatile exsolution likely took place at temperatures ranging from ∼880°C to 890°C.
7. The intrusion of oxidized hydrous mafic magma from a deeper magma source likely promoted wide magma mixing and prolonged fractional crystallization within the evolved dioritic magma chamber, resulting in the exsolution of ore-forming fluids and the formation of the Masjeddaghi deposit.
Data availability statement
The dataset generated for this study has been deposited in the Zenodo repository and is available at: 10.5281/zenodo.15741844.
Author contributions
ZR: Writing - original draft, Writing - review and editing, Conceptualization, Data curation, Formal Analysis, Investigation, Project administration, Methodology, Resources, Supervision, Software, Validation, Visualization. SH: Writing - review and editing, Conceptualization, Resources, Supervision, Validation. DS: Writing - review and editing, Data curation, Methodology, Validation. ZS: Writing - review and editing, Software, Data curation, Validation.
Funding
The author(s) declare that no financial support was received for the research and/or publication of this article.
Acknowledgments
The first author thanks the Islamic Azad University of Tehran, Iran, for the possibility to carry out her PhD research, where part of the unpublished results are presented here. We sincerely thank Reimar Seltmann and David R. Lentz for their valuable feedback and suggestions, which significantly enhanced the quality of earlier versions of this manuscript. We would like to express our gratitude to the Editors and Reviewers of this journal for their very useful comments and suggestions, which have greatly improved the quality of the manuscript.
Conflict of interest
Author ZR was employed by ANGLO REM CA Exploration Mining Ltd.
The remaining authors declare that the research was conducted in the absence of any commercial or financial relationships that could be construed as a potential conflict of interest.
Generative AI statement
The author(s) declare that no Generative AI was used in the creation of this manuscript.
Publisher’s note
All claims expressed in this article are solely those of the authors and do not necessarily represent those of their affiliated organizations, or those of the publisher, the editors and the reviewers. Any product that may be evaluated in this article, or claim that may be made by its manufacturer, is not guaranteed or endorsed by the publisher.
Supplementary material
The Supplementary Material for this article can be found online at: https://www.frontiersin.org/articles/10.3389/feart.2025.1603296/full#supplementary-material
References
Abdel-Rahman, A. M. (1994). Nature of biotites from alkaline, calc-alkaline, and peraluminous magmas. J. Petrology 35 (2), 525–541. doi:10.1093/petrology/35.2.525
Afshooni, S. Z., Mirnejad, H., Esmaeily, D., and Haroni, H. A. (2013). Mineral chemistry of hydrothermal biotite from the Kahang porphyry copper deposit (NE Isfahan), Central Province of Iran. Ore Geol. Rev. 54, 214–232. doi:10.1016/j.oregeorev.2013.04.004
Aghazadeh, M., Hou, Z., Badrzadeh, Z., and Zhou, L. (2015). Temporal spatial distribution and tectonic setting of porphyry copper deposits in Iran: constraints from zircon U-Pb and molybdenite Re-Os geochronology. Ore Geol. Rev. 70, 385–406. doi:10.1016/j.oregeorev.2015.03.003
Dare, S. A. S., Barnes, S. J., Beaudoin, G., M´eric, J., Boutroy, E., and Potvin-Doucet, C. (2014). Trace elements in magnetite as petrogenetic indicators. Min. Deposita. 49, 785–796. doi:10.1007/s00126-014-0529-0
Deer, W. A., Howie, R. A., and Zussman, J. (1992). An introduction to the rock forming minerals. London: Longman, 696.
Dupuis, C., and Beaudoin, G. (2011). Discriminant diagrams for iron oxide trace element fingerprinting of mineral deposit types. Min. Deposita 46, 319–335. doi:10.1007/s00126-011-0334-y
Giret, A., Bonin, B., and Leger, J. M. (1980). Amphibole compositional trends in oversaturated and undersaturated alkaline plutonic ring-complexes. Can. Mineral. 18 (4), 481–495.
Guo, J. H., Leng, C. B., Zhang, X. C., Zafar, T., Chen, W. T., Zhang, W., et al. (2020). Textural and chemical variations of magnetite from porphyry Cu–Au and Cu skarn deposits in the Zhongdian region, northwestern Yunnan, SW China. Ore Geol. Rev. 116, 103245. doi:10.1016/j.oregeorev.2019.103245
Harrison, T. M., and Watson, E. B. (1984). The behavior of apatite during crustal anatexis: equilibrium and kinetic considerations. Geochim. Cosmochim. Acta. 48, 1467–1477. doi:10.1016/0016-7037(84)90403-4
Hassanpour, S., and Alirezaei, S. (2016). Eocene Masjeddaghi porphyry Cu-Au deposit, an example of island arc porphyry type deposit in NW Iran. Sci. Q. J. Geosciences 26 (104). doi:10.22071/gsj.2017.50166
Henry, D. J., Guidotti, C. V., and Thomson, J. A. (2005). The Ti-saturation surface for low to medium pressure metapelitic biotite: implications for geothermometry and Ti substitution mechanisms. Am. Mineralogist 90 (1), 316–328. doi:10.2138/am.2005.1498
Jochum, K. P., Nohl, U., Herwig, K., Lammel, E., Stoll, B., and Hofmann, A. W. (2005). GeoReM: a new geochemical database for reference materials and isotopic standards. Geostand. Geoanal. Res. 29 (3), 333–338. doi:10.1111/j.1751-908x.2005.tb00904.x
Ketcham, R. A. (2015). Technical Note: calculation of stoichiometry from EMP data for apatite and other phases with mixing on monovalent anion sites. Am. Mineralogist 100, 1620–1623. doi:10.2138/am-2015-5171
Leake, B. E., Woolley, A. R., Arps, C. E. S., Birch, W. D., Gilbert, M. C., Grice, J. D., et al. (1997). Nomenclature of amphiboles: report of the subcommittee on amphiboles of the International Mineralogical Association, commission on new minerals and mineral names. Can. Mineral. 35, 219–246. doi:10.1127/ejm/9/3/0623
Li, J. X., Li, G. M., Evans, N. J., Zhao, J. X., Qin, K. Z., and Xie, J. (2020). Primary fluid exsolution in porphyry copper systems: evidence from magmatic apatite and anhydrite inclusions in zircon. Min. Deposita 56 (2), 407–415. doi:10.1007/s00126-020-01013-4
Li, W., and Costa, F. (2020). A thermodynamic model for F-Cl-OH partitioning between silicate melts and apatite including non-ideal mixing with application to constraining melt volatile budgets. Geochim. Cosmochim. Acta 269, 203–222. doi:10.1016/j.gca.2019.10.035
Li, W. K., Cheng, Y. Q., and Yang, Z. M. (2019). Geo-ƒO2: integrated software for analysis of magmatic oxygen fugacity. G-cubed 20 (5), 2542–2555. doi:10.1029/2019GC008273
McCubbin, F. M., Vander Kaaden, K. E., Tartese, R., Boyce, J. W., Mikhail, S., Whitson, E. S., et al. (2015). Experimental investigation of F, Cl, and OH partitioning between apatite and Fe-rich basaltic melt at 1.0-1.2 GPa and 950-1000°C. Am. Mineral. 100, 1790–1802. doi:10.2138/am-2015-5233
Miles, A., Graham, C., Hawkesworth, C., Gillespie, M., Hinton, R., and Bromiley, G. (2014). Apatite: a new redox proxy for silicic magmas. Geochim. Cosmochim. Acta. 132, 101–119. doi:10.1016/j.gca.2014.01.040
Munoz, J. L. (1984). F-OH and Cl-OH exchange in micas with applications to hydrothermal ore deposits. Rev. Mineralogy Geochem. 13 (1), 469–493. doi:10.1515/9781501508820-015
Nabavi, H. (1976). An introduction to the geology of Iran. Tehran, Iran: Geological Survey of Iran, 109.
Nachit, H., Ibhi, A. B., Abia, E.-H., El Hassan, A., and Ben Ohoud, M. (2005). Discrimination between primary magmatic biotites, reequilibrated biotites, and neoformed biotites. C. R. Geosci. 337, 1415–1420. doi:10.1016/j.crte.2005.09.002
Nadoll, P., Angerer, T., Mauk, J. L., French, D., and Walshe, J. (2014). The chemistry of hydrothermal magnetite: a review. Ore Geol. Rev. 61, 1–32. doi:10.1016/j.oregeorev.2013.12.013
Nadoll, P., Mauk, J. L., Leveille, R. A., and Koenig, A. E. (2015). Geochemistry of magnetite from porphyry Cu and skarn deposits in the southwestern United States. Min. Depos. 50, 493–515. doi:10.1007/s00126-014-0539-y
Pan, T., Yuchuan, C., Juxing, T., Ying, W., Wenbao, Z., Qiufeng, L., et al. (2019). Advances in research of mineral chemistry of magmatic and hydrothermal biotites. Acta Geol. Sin. Engl. Ed. 93 (6), 1947–1966. doi:10.1111/1755-6724.14395
Paton, C., Hellstrom, J., Paul, B., Woodhead, J., and Hergt, J. (2011). Iolite: freeware for the visualisation and processing of mass spectrometric data. At. Spectrom. 26, 2508–2518. doi:10.1039/c1ja10172b
Piccoli, P., Candela, P., and Williams, T. (1999). Estimation of aqueous HCl and Cl concentrations in felsic systems. Lithos 46, 591–604. doi:10.1016/S0024-4937(98)00084-X
Piccoli, P. M., and Candela, P. A. (2002). 6. Apatite in igneous systems. Rev. Mineral. Geochem. 48, 255–292. doi:10.1515/9781501509636-009
Rahnama, Z. (2021). “Platinum-Group elements distribution in haftcheshmeh and Masjeddaghi porphyry copper deposits, NW Iran,” in Ph.D thesis, islamic Azad university science and research branch. Iran: Faculty of Sciences-Department of Geology.
Rahnama, Z., Hassanpour, Sh., Lentz, D. R., and Nezafati, N. (2021). Platinum-group elements and gold distribution in ores of the Haftcheshmeh porphyry Cu-Mo-Au deposit, NW Iran. Ore Geol. Rev. 137, 104298. doi:10.1016/j.oregeorev.2021.104298
Rajabpour, S., Hassanpour, S., and Rahnama, Z. (2023). A regional petrogenetic–metallogenic perspective on the Kighal porphyry Cu deposit in the Sungun cluster, the Arasbaran magmatic belt of NW Iran. Min. Deposita 58, 1171–1189. doi:10.1007/s00126-023-01174-y
Ridolfi, F., and Renzulli, A. (2012). Calcic amphiboles in calc-alkaline and alkaline magmas: thermobarometric and chemometric empirical equations valid up to 1130 oC and 2.2 GPa. Contributions Mineralogy Petrology 163, 877–895. doi:10.1007/s00410-011-0704-6
Ridolfi, F., Renzulli, A., and Puerini, M. (2010). Stability and chemical equilibrium of amphibole in calc-alkaline magmas: an overview, new thermobarometric formulations and application to subduction-related volcanoes. Contributions Mineralogy Petrology 160, 45–66. doi:10.1007/s00410-009-0465-7
Shah, Z., Bayramov, E., Neafie, J., Seltmann, R., and Rahnama, Z. (2025). Determination of geospatial criteria and prediction of potential areas for porphyry copper deposits in Kazakhstan. Front. Earth Sci. 13, 1489969. doi:10.3389/feart.2025.1489969
Sun, S. J., Yang, X. Y., Wang, G. J., Sun, W. D., Zhang, H., Li, C. Y., et al. (2019). In situ elemental and Sr-O isotopic studies on apatite from the Xu-Huai intrusion at the southern margin of the North China Craton: implications for petrogenesis and metallogeny. Chem. Geol. 510, 200–214. doi:10.1016/j.chemgeo.2019.02.010
Sun, W. D., Huang, R. F., Li, H., Hu, Y. B., Zhang, C. C., Sun, S. J., et al. (2015). Porphyry deposits and oxidized magmas. Ore Geol. Re. 65, 97–131. doi:10.1016/j.oregeorev.2014.09.004
Tian, J., Zhang, Y., Gong, L., Francisco, D. G., and Berador, A. E. (2021). Genesis, geochemical evolution and metallogenic implications of magnetite: perspective from the giant Cretaceous Atlas porphyry Cu–Au deposit (Cebu, Philippines). Ore Geol. Rev. 133, 104084. doi:10.1016/j.oregeorev.2021.104084
Wen, G., Li, J. W., Hofstra, A. H., Koenig, A. E., Lowers, H. A., and Adams, D. (2017). Hydrothermal reequilibration of igneous magnetite in altered granitic plutons and its implications for magnetite classification schemes: insights from the Handan-Xingtai iron district, North China Craton. Geochim. Cosmochim. Acta. 213, 255–270. doi:10.1016/j.gca.2017.06.043
Wones, D. R., and Eugster, H. P. (1965). Stability of biotite: experiment, theory, and application. Am. Mineral. 50, 1228–1272. Available online at: http://www.minsocam.org/ammin/AM50/AM50_1228.pdf
Xiao, Z., Gammons, C. H., and Williams-Jones, A. E. (1998). Experimental study of copper(I) chloride complexing in hydrothermal solutions at 40 to 300°C and saturated water vapor pressure. Geochim. Cosmochim. Acta. 62, 2949–2964. doi:10.1016/S0016-7037(98)00228-2
Yavuz, F., and Döner, Z. (2017). WinAmptb: a Windows program for calcic amphibole thermobarometry. Period. Mineral. 86, 135–167. doi:10.2451/2017PM710
Zhao, J., Qin, K., Evans, N. J., Li, G., and Shi, R. (2020). Volatile components and magma-metal sources at the Sharang porphyry Mo deposit, Tibet. Ore Geol. Rev. 126 (4), 103779. doi:10.1016/j.oregeorev.2020.103779
Zhong, S., Li, S., Feng, C., Liu, Y., Santosh, M., He, S., et al. (2021). Porphyry copper and skarn fertility of the northern Qinghai-Tibet Plateau collisional granitoids. Earth Sci. Rev. 214, 103524. doi:10.1016/j.earscirev.2021.103524
Keywords: biotite, amphibole, apatite, magnetite, Masjeddaghi porphyry Cu-Au deposit, Iran
Citation: Rahnama Z, Hassanpour S, Savard D and Shah Z (2025) Mineral chemistry of apatite, amphibole, biotite, and magnetite from the Masjeddaghi porphyry Cu-Au deposit, NW Iran: petrogenetic and metallogenic implications. Front. Earth Sci. 13:1603296. doi: 10.3389/feart.2025.1603296
Received: 31 March 2025; Accepted: 12 June 2025;
Published: 27 June 2025.
Edited by:
Claudia Belviso, National Research Council (CNR), ItalyReviewed by:
Tristan Childress, KeyLogic Systems, United StatesXianke Fan, Chinese Academy of Geologi-cal Sciences (CAGS), China
Copyright © 2025 Rahnama, Hassanpour, Savard and Shah. This is an open-access article distributed under the terms of the Creative Commons Attribution License (CC BY). The use, distribution or reproduction in other forums is permitted, provided the original author(s) and the copyright owner(s) are credited and that the original publication in this journal is cited, in accordance with accepted academic practice. No use, distribution or reproduction is permitted which does not comply with these terms.
*Correspondence: Zohreh Rahnama, em9ocmVocmFobmFtYXJAZ21haWwuY29t