 Faranak Dalvand
 Adriana Dutkiewicz
 Nicky M. Wright
 Dietmar Müller
- EarthByte Group, School of Geosciences, University of Sydney, Sydney, NSW, Australia
Deep-sea carbonates constitute the primary deep carbon reservoir, playing a critical role in regulating the long-term global carbon cycle. Reconstructing the temporal evolution of carbonate flux to the seafloor requires estimating the changes in carbonate compensation depth (CCD), a key proxy, revealing the depth where the rate of calcium carbonate supply from biogenic ooze equals the rate of dissolution. However, regional CCD estimates across the Pacific, the deepest and largest ocean basin, remain poorly constrained, except for the eastern equatorial region. Here, we present six new regional reconstructions of the CCD across the Pacific Ocean, using a linear reduced major-axis regression of the carbonate accumulation rate (CAR) versus paleo-water depth, that include the effects of dynamic topography and eustasy. The CCDs show significant fluctuations of ∼1–1.2 km across the Pacific over the Neogene. Regional CCD models since the early Miocene suggest the influence of climate perturbations, Antarctic ice-sheet growth, and Pacific gateway reorganization on Pacific deep-water circulation and carbonate production. The western Pacific CCD shows a distinct deepening after ∼24 Ma, not seen in the eastern tropical Pacific, which we interpret as a delayed consequence of changes in deep water circulation in response to the expansion of the West Antarctic ice sheet into the marine realm at ∼26 Ma. Our models also reveal two significant late Miocene events, the carbonate crash and biogenic bloom, across both the western and eastern equatorial Pacific. However, a ∼1 Ma lag is noted for both events in the western tropical CCD, likely attributed to the successive effects of Panama Gateway constriction and shifts in the Western Pacific Warm Pool, respectively. The absence of the carbonate crash event from the western North Pacific reflects the regional nature of this event, predominantly influencing the Pacific equatorial region. Our analysis offers new insights into regional CCD variability across the Pacific Ocean and can be used to evaluate the evolution of deep-sea carbonate carbon reservoirs in the context of the long-term carbon cycle.
1 Introduction
The burial of marine planktic organism remains on the seafloor represents the capture and storage of carbon from the atmosphere, and a significant component of the long-term carbon cycle (Ridgwell and Hargreaves, 2007). A recent study indicates that carbon sequestered through pelagic sediments has become the dominant source of the deep carbon cycle since the early Cenozoic, peaking at ∼277 Mt C/yr of carbonate carbon flux at present, out of a total deep carbon input of 311 Mt C/yr across the oceanic plate system (Müller et al., 2022). These computations are based on the global carbonate compensation depth (CCD) estimates of Boss and Wilkinson (1991). The CCD is defined as the water depth at which the supply of carbonate is balanced by its dissolution, leading to the absence of carbonate-bearing sediments below the CCD (Lyle, 2003; Rea and Lyle, 2005). The amount of carbonate deposited in deep-sea sediments over time is critically linked to CCD variations over geological time because the position of the CCD determines the area of seafloor available for carbonate sedimentation (Dutkiewicz et al., 2018). Factors affecting carbonate burial, such as ocean saturation state and alkalinity feedback, the biological pump, and atmospheric CO2, exhibit strong links to CCD shifts (Xiao et al., 2024). All these factors result in significant variability of the CCD between ocean basins (e.g., Campbell et al., 2018; van Andel, 1975; Xiao et al., 2024). For example, Campbell et al.’s (2018) results indicate that the CCD has varied by ∼300 m in the equatorial Pacific Ocean since the Pliocene, whereas the equatorial Indian Ocean has experienced fluctuations of ∼1 km during the same period. Recent reconstructions of regional CCDs within the Atlantic Ocean demonstrate that the CCD can differ contemporaneously by as much as 1.2 km even within a single ocean basin due to regional variabilities in productivity and ocean chemistry (Dutkiewicz and Müller, 2022). This highlights the importance of regional CCD reconstructions for robust calculations of deep-sea carbonate storage across the global ocean, which provide significantly more accurate inputs for solid Earth carbon cycle modeling (e.g., Müller et al., 2022). To date, such detailed computations have only been carried out for the Atlantic Ocean (Dutkiewicz and Müller, 2022).
The Pacific occupies a vast area of the Earth’s total surface covered by oceans, and plays a critical role in the recycling of carbon via its associated network of subduction zones (Müller et al., 2022). Yet, despite its latitudinally-variable accumulation of carbonate (Lyle, 2003) related to productivity (Pennington et al., 2006), upwelling (Gray et al., 2018), oceanic gateway configurations (Straume et al., 2020), geochemistry (Ma et al., 2018) and deep water circulation (Yin et al., 2022), our understanding of regional long-term variations of the CCD and carbonate flux throughout the Pacific is incomplete. The eastern equatorial Pacific is the only region that has been extensively studied (e.g., Campbell et al., 2018; Komar and Zeebe, 2021; Leon-Rodriguez and Dickens, 2010; Pälike et al., 2012; Rea and Lyle, 2005; van Andel, 1975), exhibiting slightly divergent CCD reconstructions for this region spanning the Cenozoic. Limited low-resolution CCD reconstructions based on a small number of deep-sea drill sites also exist for the northwestern Pacific (Rea et al., 1995) and the southeastern Pacific (Rea and Leinen, 1986). However, in the absence of regional CCDs, the high-resolution CCD of Pälike et al. (2012) in an unusually high-productivity region of the eastern equatorial is usually taken to represent the entire Pacific. Here, we present new CCD reconstructions for six regions of the Pacific spanning the Neogene and examine the influence of climate and oceanography changes on carbonate burial and CCD variability over time. The new CCD models will improve constraints on deep carbon cycling computation across the Pacific Ocean.
2 Methods and procedure
2.1 Drill sites and data sources
Our analysis uses 92 scientific ocean drilling sites from the Pacific Ocean (Figure 1), comprising 44 Deep Sea Drilling Project (DSDP) sites, 40 sites from Ocean Drilling Program (ODP) and 8 sites from Integrated Ocean Drilling Program (IODP). Drill sites are primarily located on oceanic crust, with nine sites on continental crust at water depths greater than 1,100 m (Supplementary Material, Table 1). These were chosen based on complete data availability consisting of good core recovery, reliable age-depth models, CaCO3 content, and dry bulk density measurements from http://deepseadrilling.org/, http://www-odp.tamu.edu/ and http://web.iodp.tamu.edu/LORE/ databases (accessed November 2022–July 2023). Age-depth models were obtained from the Neptune Sandbox Berlin (NSB; https://nsb.mfn-berlin.de/, Renaudie et al., 2020; accessed January–March 2023). The NSB data are also available as an archive at https://zenodo.org/records/10057363. For drill sites where the NSB database lacked age-depth models, age-depth plots from Lyle (2002) and initial reports were used. All age-depth models were converted to the Gradstein et al. (2020) timescale. All input data files are available via https://doi.org/10.5281/zenodo.15116747 and the digital supplement.
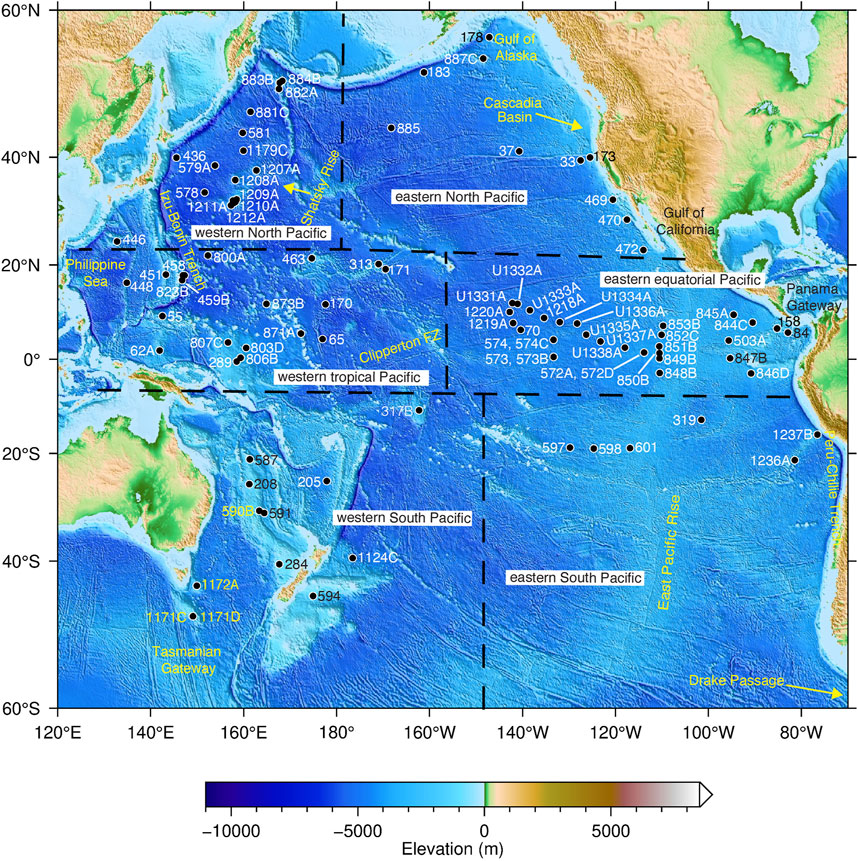
Figure 1. Location of 92 sites drilled by the Deep Sea Drilling Project (DSDP), the Ocean Drilling Program (ODP), and the Integrated Ocean Drilling Program (IODP) in the Pacific Ocean used in this study. Black dashed lines define six regions for which we reconstruct the carbonate compensation depth (CCD). Elevation from ETOPO1 global relief model (https://www.ngdc.noaa.gov/mgg/global/; Amante and Eakins, 2009). Mercator projection.
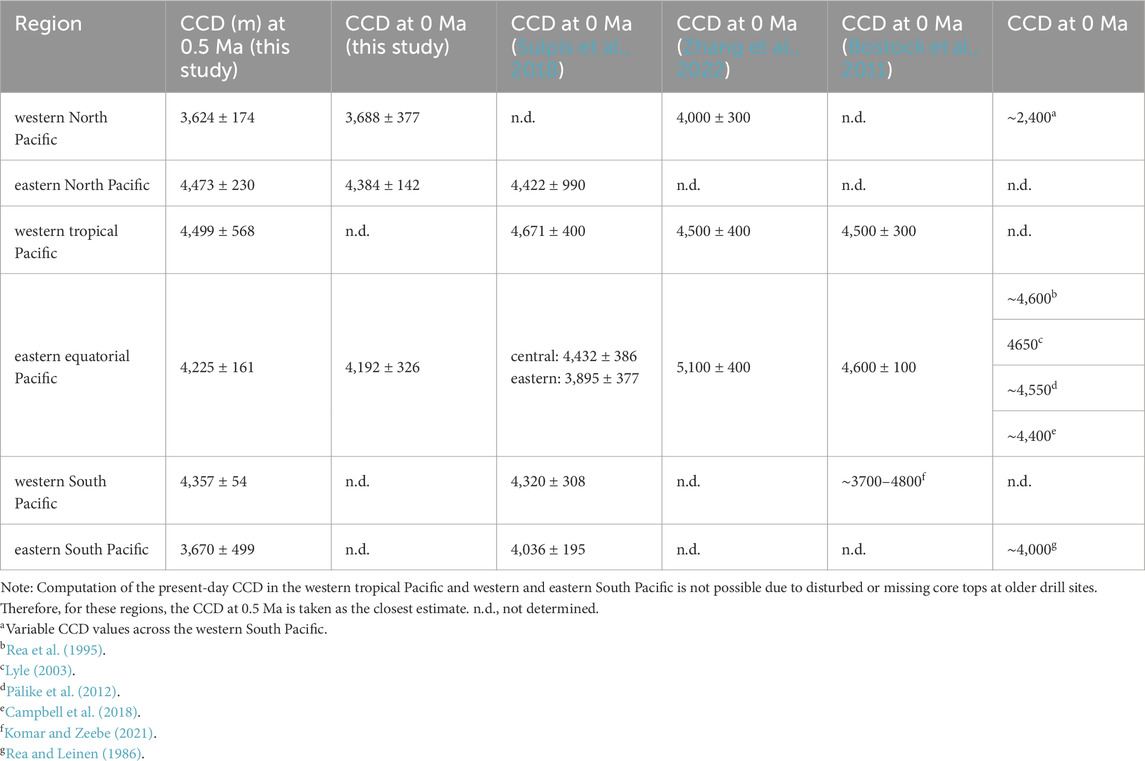
Table 1. Comparison of published present-day CCD reconstructions and this study.
Significant portions of the South Pacific and central North Pacific have not been sampled because scientific ocean drilling expeditions predominantly focus on deep basins with high probable carbonate content (Wade et al., 2020). Hence, our study includes relatively few deep-sea drill sites from these regions.
2.2 CCD reconstruction
In order to reconstruct the regional CCDs, we split the Pacific Ocean into six regions (western North Pacific, eastern North Pacific, western tropical Pacific, eastern equatorial Pacific, western South Pacific and eastern South Pacific; Figure 1) following Lyle’s (2003) approach based on careful considerations of north-south and west-east oceanographic variations such as carbonate productivity and the thermocline. This approach aligns with our assessment of regional CCD reconstructions, ensuring a division of the Pacific into sub-regions based on distinct oceanographic domains.
For computing the CCD through time, we use the workflow developed by Dutkiewicz and Müller (2021), age-depth models and lithological data from each drill site, and pyBacktrack 1.4 software (Müller et al., 2018) to backtrack each site and compute the paleowater depth (Supplementary Material, Figure 1). Paleobathymetry is computed by isostatically decompacting the sediment column for each drill site while considering the effects of tectonic subsidence (Sclater et al., 1985) on both oceanic and continental crusts, time-dependent dynamic topography (Braz et al., 2021) and eustatic sea level (Haq et al., 1987) as modified by Miller et al. (2005), following Braz et al. (2021). Lithology-specific decompaction of the sediment column was carried out in 10 m intervals or less in order to capture lithology variations using the lithology library in pyBacktrack 1.4 (Müller et al., 2018).
We combine the paleowater depths with computations of carbonate accumulation rates (CAR) from multiple drill sites in each region to reconstruct the CCD through time. For each drill site, the CAR value is computed by multiplying the weight % of CaCO3 of a sample by its dry bulk density and the linear sedimentation rate (Lyle, 2003). All data on carbonate content (with an average error of <0.8%) and dry bulk density are provided in Supplementary Material. For each drill site, the CAR values are partitioned into 1 Myr-wide moving window and 0.5 Myr time steps. For times where data points are sparse, the CAR values are averaged into a 1 Myr-wide moving window with 1 Myr time steps. We follow Campbell et al. (2018) method and use a linear reduced major axis regression on the CAR values versus paleo-water depth, while also detecting using GMT 6.4.0 gmtregress (https://docs.generic-mapping-tools.org/6.4/gmtregress.html; Wessel et al., 2019) to define the CCD for each time step, at 95% confidence. It is essential to exclude statistical outliers when combining data from many sediment cores across broad oceanic regions. Since the CCD is inferred as the depth at which CAR approaches zero, the presence of anomalously high CAR values at great depths, or small accumulation rates at shallow depths, produce outliers which can bias the slope and intercept of regression models, resulting in unrealistic or physically implausible CCD estimates. Outliers often reflect local rather than regional processes. These may include enhanced or anomalously low carbonate productivity or reworking of sediments. Their exclusion from regional analyses is important to avoid violating assumptions of regional environmental homogeneity and erroneous generalizations about basin-scale CCD evolution.
To estimate the CCD, we assume that CAR approaches zero due to a progressive increase in dissolution below the lysocline (Lyle, 2003). Therefore, the y-intercept of the regression line determines the CCD at each time step (Figure 2). However, it should be noted that the variability in the shape of the lysocline over time, driven by changes in rates of surface carbonate productivity (Broecker, 2008) and dissolution (Broecker, 2008; Pälike et al., 2012), remains poorly understood. For instance, Broecker (2008) highlighted a greater offset between the carbonate undersaturation and saturation horizons at higher carbonate burial rates compared to the smoother transition of the saturation horizon at lower carbonate deposition rates. Furthermore, determining carbonate dissolution rates in deep-sea sediments presents challenges due to insufficient knowledge of the different factors involved, such as the hydrodynamic boundary layer’s (bottom water layer) role in resisting seafloor dissolution and the duration over which carbonate can resist dissolution on the seafloor. Thus, our computations follow the simple linear regression approach of Pälike et al. (2012) and Campbell et al. (2018).
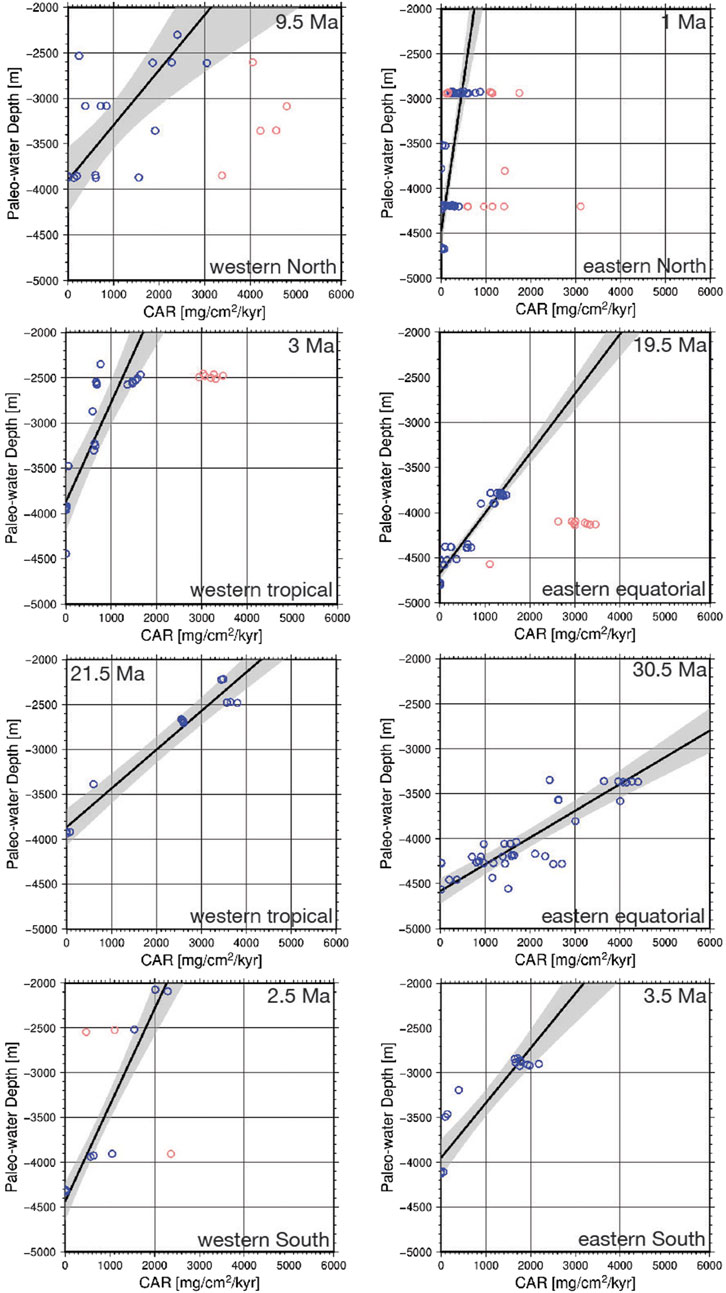
Figure 2. Examples of CCD computations using linear reduced major-axis regression analysis with outlier detection. This regression analysis includes the dynamic topography model D10 (Braz et al., 2021). The CCD is defined by the carbonate accumulation rate (CAR) values extrapolating to zero as a function of the paleowater depth (i.e., the y-intercept). Data points (blue and red circles) represent multiple drill sites at each time interval. Red circles represent outliers. Gray band indicates 95% confidence envelope. Note that the slope of the line is only used to determine the location of the CCD. Multiple times have been excluded from the analysis due to insufficient data to generate regression plots. Our robust regression approach detects outliers based on the mean of the squared residuals across three thresholds: the standard approach identifies outliers for the absolute value of standardized residuals >2.5, with two narrower thresholds set at >1.5 and >0.5. We also examine the standard regression analysis without identifying outliers, particularly in cases of oddly distributed sparse data points, where three thresholds of outlier detection result in incorrectly identified outliers (by visual inspection). For example, during the time interval centered at 19.5 Ma in the eastern equatorial region, regression analysis identified drill sites DSDP 70, 574 (and 574-hole C) as outliers due to deviations in CAR values from the standardized residuals (>2.5). Sites 574 and 574C exhibited anomalously high CAR values exceeding 2,600 mg/cm2/k.y at a paleowater depth of ∼4.2 km. These anomalies fell outside the CAR value cutoff for exclusion through the computational analysis. Site 70 is represented at this time by two distinct CAR values: CAR value 99 mg/cm2/k.y at a paleowater depth of 4,580 m and CAR value 1,109 mg/cm2/k.y at a paleowater depth of 4,571 m, with the latter value reflecting a notable CAR anomaly considering the relatively similar paleowater depth at the same sampling window with the CCD located at a paleowater depth of ∼4.6 km. While these sites were consistently flagged as outliers in earlier intervals before 19.5 Ma, only site 574 continued to exhibit anomalies after 19.5 Ma. Site 574 (and 574C) exhibited higher CAR values during the early Miocene despite being located farther from the narrow equatorial high-productivity zone compared to other drill sites, such as site 573 (with significantly lower CAR values < 1,100 mg/cm2/k.y at a shallower paleowater depth ∼3.8 km). The anomalously high CAR values at these drill sites during this time period may be attributable to downslope carbonate transport processes. The regression analysis without accounting for outliers at this time interval resulted in a ∼100 m shallower CCD.
Linear reduced major axis regression analysis is employed to account for uncertainties both in the CAR value and in the paleowater depth. The primary uncertainty in CCD reconstruction arises from paleobathymetry computations, while additional sources of uncertainty include sediment decompaction, the presence of unconformities, and carbonate measurements (Dutkiewicz et al., 2018). The total uncertainty resulting from regression analysis for each reconstruction time and sub-region reflects various error sources such as age-depth errors, carbonate content, and sedimentation rates (see also Dutkiewicz et al., 2018; van Andel et al., 1975). Additionally, following a similar approach to Dutkiewicz and Müller (2022), we consider a cutoff for CAR values of <1,500 mg/cm2/kyr for paleo-water depths <2.5 km (i.e., water depth above the mid-ocean ridge). CAR values exceeding 2,000 mg/cm2/kyr at paleo-water depths >4.5 km are also excluded following the approach of Dutkiewicz and Müller (2022), because they represent anomalies related to processes such as downslope transport of carbonate sediments.
We perform a linear regression on CAR values versus paleo-water depth (Figure 2) using three approaches, incorporating two recently published dynamic topography methods. The first approach uses the “D10” dynamic topography model (Braz et al., 2021) combined with eustatic sea level from Haq et al. (1987) with modifications by Miller et al. (2005). The second approach uses the “M6” model, which is a dynamic topography model from which long-term sea-level fluctuations are computed (Müller et al., 2018), while the third approach excludes the effects of dynamic topography and sea level. Our preferred model, D10 (a compressible mantle flow model) was used because it accounts for mantle plumes, which are essential for Pacific dynamic topography estimations due to the significant mantle upwelling in the Pacific.
3 Results: regional CCD reconstructions in the Pacific
The Pacific CCD of van Andel et al. (1975) over the Cenozoic generally tracks the global CCD variations (e.g., Boss and Wilkinson, 1991; Delaney and Boyle, 1988). Van Andel et al. (1975) described the CCD in the equatorial Pacific as distinct from the entire Pacific CCD since 50 Ma, primarily in terms of the magnitude of fluctuations (∼500 m deeper), which aligns with the overall trend of the equatorial Pacific CCD of Berger (1973). However, our results show significant regional variability in the CCD fluctuations across the entire Pacific Ocean, highlighting the shortcomings of a single representative CCD over the entire Pacific (Figures 3, 4, 6). However, given that the eastern equatorial CCD is the most detailed and intensely studied CCD in the Pacific (Campbell et al., 2018; Lyle, 2003; Pälike et al., 2012), and is also well-defined in our reconstructions, we explore regional CCD changes in the Pacific in relation to the CCD model of the eastern equatorial area.
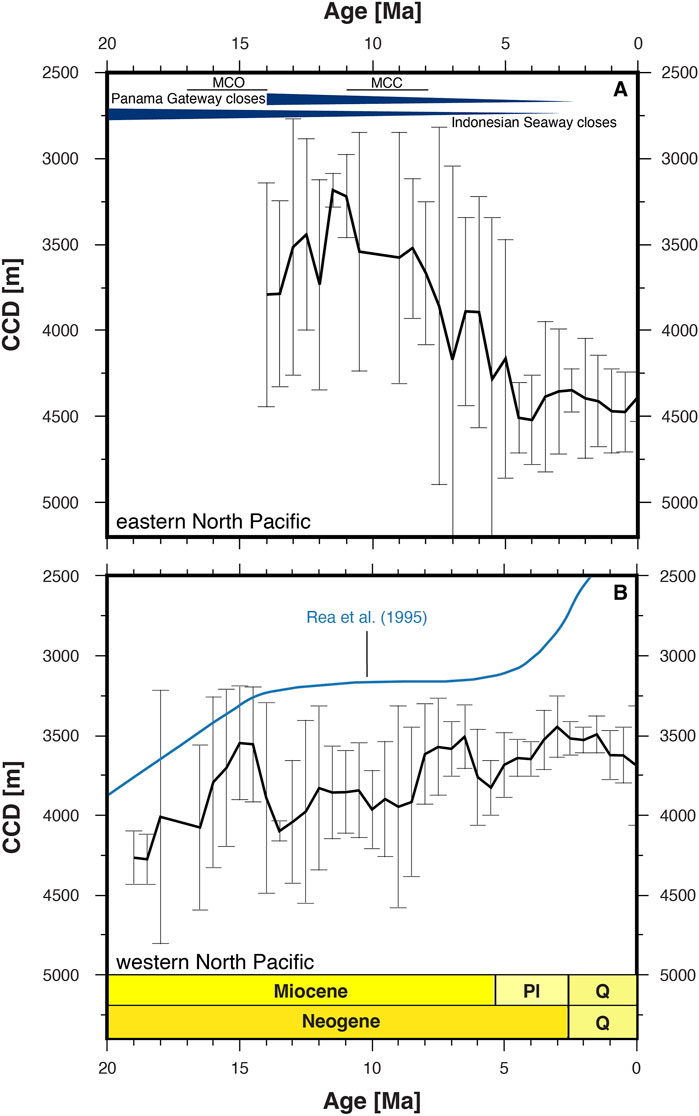
Figure 3. CCD reconstructions for the North Pacific spanning the last 20 Ma, covering the regions defined in Figure 1, including (A) eastern North Pacific and (B) western North Pacific. The northwest Pacific CCD curve from Rea et al. (1995) is shown in (B). Solid black line is the portion of the CCD reconstructed using regression analysis, and error bars indicate uncertainty represented by the gray envelope as shown in Figure 2. The timing of Miocene Climate Optimum (MCO) from Westerhold et al. (2020) and the Miocene Carbonate Crash (MCC) in the equatorial Pacific from Lyle et al. (1995). Timing of ocean gateway closing from Schmittner et al. (2004) for the Panama Gateway, and from Bahr et al. (2023) and Kuhnt et al. (2004) for the Indonesian Seaway.
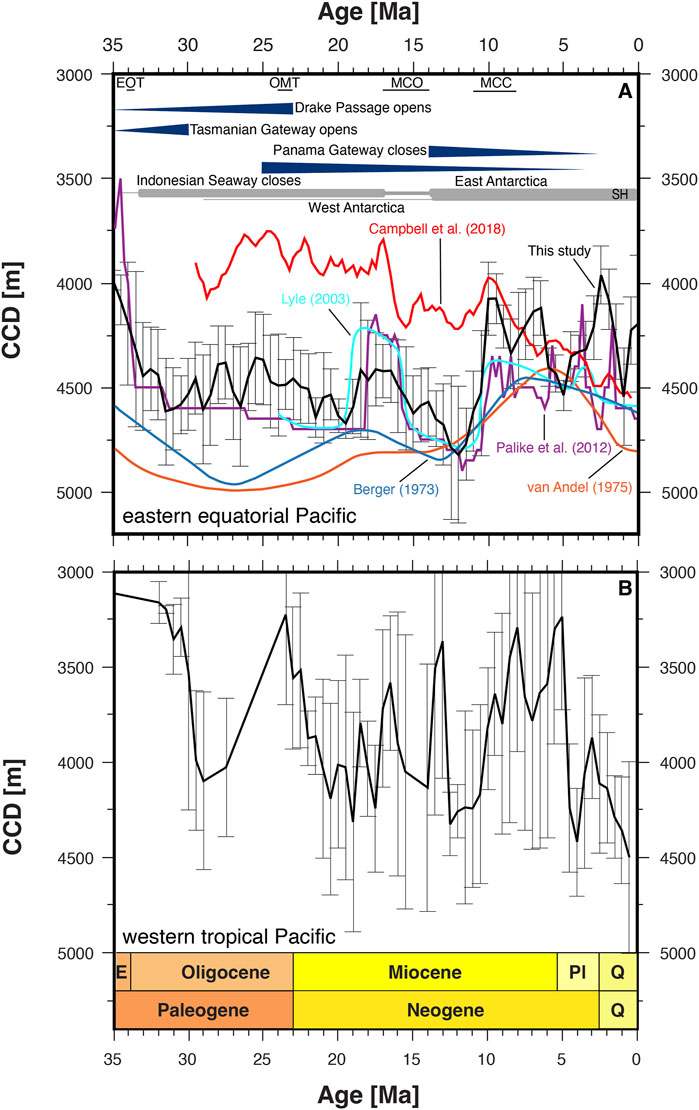
Figure 4. CCD reconstructions for the equatorial Pacific spanning the last 35 Ma, covering the regions defined in Figure 1, including (A) eastern equatorial Pacific and (B) western tropical Pacific. Regional CCD curves from published studies are shown in A. Solid black line is the portion of the CCD reconstructed using regression analysis, and error bars indicate uncertainty represented by the gray envelope as shown in Figure 2. The timing of Eocene/Oligocene Transition (EOT), Oligocene/Miocene Transition (OMT), Miocene Climate Optimum (MCO), and the Southern Hemisphere (SH) glaciation from Westerhold et al. (2020). Approximate timing of the Miocene Carbonate Crash (MCC) in the equatorial Pacific from Lyle et al. (1995). Timing of ocean gateway opening and closing from Eagles and Jokat (2014) for the Drake Passage, from Straume et al. (2020) for the Tasmanian Gateway, from Schmittner et al. (2004) for the Panama Gateway, and from Bahr et al. (2023) and Kuhnt et al. (2004) for the Indonesian Seaway.
3.1 North Pacific CCD modeling
3.1.1 Eastern North Pacific
Due to data scarcity, our CCD reconstruction in the eastern north area cannot extend before the middle Miocene, as the regression analysis fails to provide the CCD estimates. During the late middle Miocene, considering the associated errors of ∼±100–700 m, rarely exceeding ∼1 km, the CCD in this region is relatively shallow, between ∼3.2 and 3.9 km (Figure 3A), compared to the much deeper CCD of ∼4.4–4.8 km observed in the eastern equatorial region during this interval (Figure 4A). However, the CCD of ∼3.5 km at ∼8.5 Ma gradually deepens, reaching a maximum depth of ∼4.5 km in the Pliocene in this region. Since 4.5 Ma, the CCD model exhibits a lower level of uncertainties (<±400 m) compared to uncertainties of earlier segments (∼±700 m and occasionally > ±1 km). The CCD has remained relatively stable between ∼4.3 and ∼4.4 km since 4 Ma. The present-day CCD in the eastern North Pacific, at ∼4.3 km, is comparable with the modern CCD of ∼4.4 km determined by Sulpis et al. (2018) for this region (Table 1).
3.1.2 Western North Pacific
In the western North Pacific, our model estimates the CCD at ∼4.2 km by ∼19 Ma, which gradually shoals to ∼3.4 km during the middle Miocene, as also indicated by Rea et al. (1995), Figure 3B. The middle Miocene shallow CCD is followed by a series of smaller deepening and shoaling episodes (ranging between ∼3.5–4 km) towards the Pliocene, which broadly correlates with the shoaling trend of the CCD observed by Rea et al. (1995) for this region within this period. The western North Pacific CCD remains at ∼3.8–3.9 km between 12 Ma and 8.5 Ma, with no evidence for the sharp CCD shoaling attributed to well-known carbonate crash of the late Miocene in the eastern equatorial region (e.g., Lyle et al., 1995). The CCD has remained shallow since the Pliocene, varying between ∼3.4 and 3.7 km, with smaller uncertainties (<±200 m) than prior to the Pliocene (up to ∼±700 m). In this study, the present-day CCD of the western North region, at ∼3.6 km, appears to be the shallowest modern CCD modeled in all the regions of the Pacific. This is consistent with Zhang et al.’s (2022) findings of a shallower CCD (∼4 km) in this region compared to a CCD of ∼5.1 km and ∼4.5 km in the western and central equatorial Pacific, respectively (Table 1). The shallow CCD from our model is much deeper (∼1.2 km) than Rea et al.’s (1995) estimate of present-day CCD of ∼2.4 km in the western North Pacific.
3.2 Eastern equatorial Pacific CCD modeling
The CCD across the eastern equatorial Pacific has been the subject of multiple reconstructions (e.g., Campbell et al., 2018; Lyle, 2003; Pälike et al., 2012). Our eastern equatorial CCD spans 35 Ma to 0 Ma and exhibits a comparable long-term trend with that of Berger (1973), van Andel (1975), Lyle (2003), Pälike et al. (2012) and Campbell et al. (2018), with some differences in short-term fluctuations (Figure 4A). Our regression analysis indicates the early Oligocene CCD deepening from ∼4 km at ∼35 Ma to ∼4.6 km at ∼31.5 Ma. The deep CCD throughout the Oligocene experiences some modest fluctuations (∼300 m) up to the early Miocene. The CCD shoaling between 19 and 16 Ma (Figure 4A), agrees with that modeled by Pälike et al. (2012) and Lyle (2003). After 16 Ma, the CCD deepens to ∼4.8 km by 12 Ma, the deepest Cenozoic CCD in this region. In the latest Neogene, the CCD shallows to ∼4 km. Previously modeled shallow CCD maxima in the latest Neogene (e.g., Campbell et al., 2018; Lyle et al., 1995; Pälike et al., 2012) are observed in our model at 10–9 Ma and 7–6.5 Ma, along with the shoaling episode in the Pliocene-Pleistocene (reaching ∼3.9 km by 2.5 Ma).
Our present-day CCD of ∼4.2 km in the eastern equatorial region is in good agreement with independent estimates such as ∼4.4 km for the central equatorial Pacific from Sulpis et al. (2018), ∼4.6 km from Bostock et al. (2011), and ∼4.6 km from Pälike et al. (2012) (Table 1).
3.2.1 Reproducibility of the eastern equatorial CCD reconstruction
The CCD reconstruction of Pälike et al. (2012) for the eastern equatorial region extending back to the early Eocene is extremely detailed and shows major and frequent fluctuations on 250 kyr timescales. However, their analysis does not include a computation of uncertainties, which prohibits an evaluation of the true significance of some of these fluctuations. Because the Pälike et al. (2012) reconstruction used a similar approach to ours we are able to reproduce their CCD and show that their errors are large and comparable to those in our model, which includes a subset of drill sites used in the Pälike et al. (2012) dataset. In order to assess the associated errors in Pälike et al’s. (2012) model, we reconstruct the CCD based on the authors’ dataset. We use our preferred regression analysis, together with three alternative methods (Figure 5) to find the regression method that best fits the Pälike et al. (2012) CCD curve because the exact method that they used is not described. Similar to Campbell et al. (2018), we were not able to reproduce the Pälike et al. (2012) CCD exactly using their dataset, but we find a close match with the published curve using the least squares with reduced axis regression (LSR; Figure 5A) and the standard least squares regression with y-axis errors only (LWR; Figure 5C). However, the uncertainties are substantial for the period 33–0 Ma, ranging between ±100 m and ±1,783 m (mean = ±490 m) for LSR, and ±35 m to ±1,750 m (mean = ±355 m) for LWR. The LSY method produces a relatively poor match with the published curve and relatively large errors (Figure 5B), while the LWY regression (Figure 5D) produces smaller errors but worse fit than either LSR and LWR. The uncertainties for older times are smaller because fewer data points are used in the regression, resulting in tighter fits to sparse data. However, this does not imply that the model is more accurate, as regressions based on sparse data points reduce the confidence in resulting interpretations, which should be used with caution.
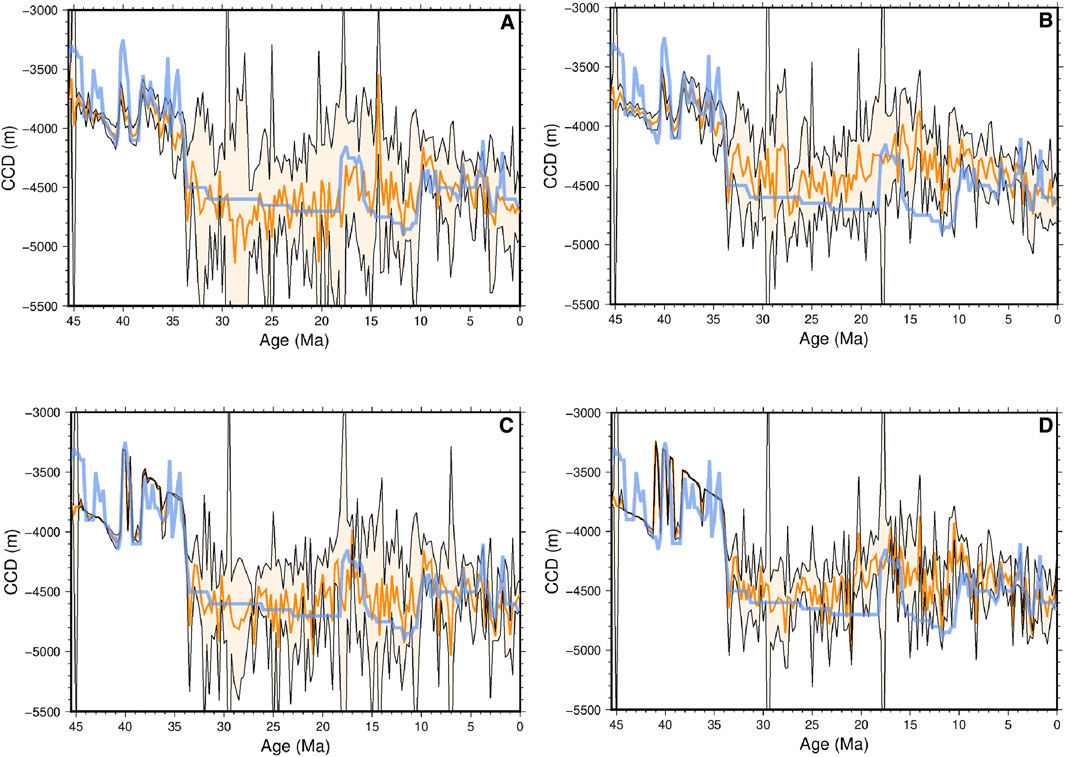
Figure 5. Assessment of uncertainties in the eastern equatorial Pacific CCD model of Pälike et al. (2012), which was reported without errors (blue curve) and without details of their regression method. Our re-assessment is based on carbonate accumulation data (CAR) and paleo-water depths used by Pälike et al. (2012) and applies four different regression methods to produce a CCD curve (orange line) with an uncertainty envelope (light orange). (A) LSR—least squares with reduced axis regression calculating errors on the x-axis (CAR) and the y-axis (paleo-water depth), (B) LSY method—least squares regression computing errors on the y-axis, (C) LWR—weighted least squares with reduced axis regression and outlier detection, (D) LWY—weighted least squares with outlier detection and error computation on the y-axis. Note that LWR results in the best match to the published curve of Pälike et al. (2012) with a large error envelope between 33 Ma and 0 Ma. Smaller errors prior to 33 Ma reflect fewer data points used in the regression.
Our eastern equatorial CCD broadly tracks Pälike et al’s. (2012) CCD, with a slight divergence from the Oligocene to the early Miocene and a notable decoupling between the late Pliocene and the Pleistocene (Figure 4A). The disparity in these results can be attributed to a larger dataset of drill sites used in our CCD model versus that of Pälike et al. (2012) for this region. However, the uncertainties in our CCD are generally smaller (±75–345 m; mean = ±184 m) than those calculated for the Pälike et al. (2012) CCD. Our results illustrate that CCD fluctuations over timescales less than ∼0.5 million years are typically within the errors of the data used for this purpose, even if high-resolution stratigraphic data are used, and irrespective of the type of regression analysis.
3.3 Western tropical Pacific CCD modeling
In the western tropical region, the CCD between 32 Ma and 29 Ma is inferred to have deepened from ∼3.2 to 3.9 km within this period (Figure 4B). The CCD drop at the beginning of the Oligocene shows a delay of ∼2 Ma in the western tropical region compared to the eastern equatorial area. The CCD of ∼3.2 km during the latest Oligocene deepens to ∼4 km toward the early Miocene. Compared to other regions of the Pacific, the western tropical area has experienced significant CCD fluctuations during the Neogene, although the uncertainties are quite large (up to ∼±700 m). Throughout the Miocene, the western tropical Pacific exhibits various CCD fluctuations, marking a significant deepening between 12.5 Ma and 10.5 Ma, succeeded by a lowered CCD in the late Miocene. Notably, an ∼0.5–1 km shallower CCD compared to the eastern equatorial Pacific is evident in this region during the latest Miocene. This is followed by a CCD deepening in the early Pliocene and a shallower CCD during the latest Pliocene. Since the Pleistocene, there has been a gradual deepening of the CCD to ∼4.5 km at 0.5 Ma. The 0.5 Ma CCD from our study is comparable with the present-day CCDs of ∼4.5–4.6 km from Sulpis et al. (2018), Zhang et al. (2022), and Bostock et al. (2011) across this region (Table 1).
3.4 South Pacific CCD modeling
3.4.1 Eastern South Pacific
Data limitation makes it challenging to compute the CCD prior to the middle Miocene using regression analysis. The CCD in the eastern South Pacific has remained above ∼4 km since the middle Miocene (uncertainties are generally < ±300 m, Figure 6A). Similar to the CCD shoaling of the eastern equatorial region, this area shows a shallower CCD between 19.5 Ma and 17 Ma (∼3.5–3.6 km) compared to the middle Miocene segment, followed by a significant shoaling to ∼3.2 km at 10.5 Ma. The CCD deepening reconstructed between 15 Ma to 11 Ma across the equatorial region (Lyle, 2003; Pälike et al., 2012; and this study; Figure 4A) correlates with the CCD shoaling (∼700 m) in this region. While the data are insufficient between 10.5 Ma to 8.5 Ma to generate regression plots, interpolation suggests a deepening CCD, reaching around 4 km by 8.5 Ma. The CCD has remained shallow since the late Neogene, ranging between ∼3.6 and 3.9 km, with minor fluctuations, consistent with the CCD of Rea and Leinen (1986). Our modern CCD at 0.5 Ma is ∼400 m shallower than the present-day CCD of Sulpis et al. (2018) and Rea and Leinen (1986) estimated to be ∼4 km (Table 1).
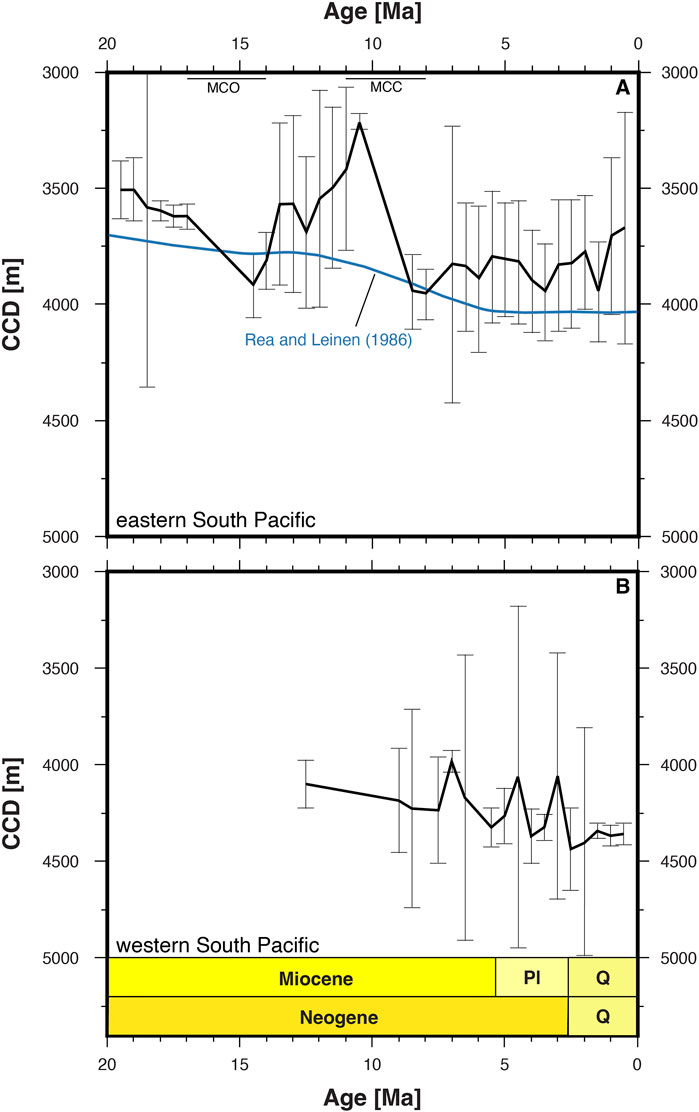
Figure 6. CCD reconstructions for the South Pacific spanning the last 20 Ma, covering the regions defined in Figure 1, including (A) eastern South Pacific and (B) western South Pacific. The southeast Pacific CCD curve from Rea and Leinen (1986) is shown in A. Solid black line is the portion of the CCD reconstructed using regression analysis, and error bars indicate uncertainty represented by the gray envelope as shown in Figure 2. The timing of Miocene Climate Optimum (MCO) from Westerhold et al. (2020) and the Miocene Carbonate Crash (MCC) in the equatorial Pacific from Lyle et al. (1995).
3.4.2 Western South Pacific
Owing to the complexity of the seafloor topography and deep ocean circulation in the western South Pacific over time (Bostock et al., 2011), it would be advantageous to reconstruct the CCD at sub-basin scales in this region. However, sparse data coverage only allows us to model the CCD for the entire western South Pacific. Our CCD model is confined to the late Neogene (Figure 6B). The late Miocene CCD is between ∼4.1 and 4.2 km, with no evidence of shoaling that is associated with the eastern equatorial Pacific between ∼12 Ma and 8 Ma (Figure 4A). A brief CCD rise of ∼300 m from 7.5 Ma to 6.5 Ma coincides with a shoaling episode of the eastern equatorial Pacific (Figures 4A, 6B). A CCD of ∼4.3 km at 0.5 Ma is significantly deeper than that of the eastern south region (∼3.6 km).
4 Causes of regional CCD variations in the Pacific over the Neogene
Our CCD reconstructions provide new insights into regional CCD variations across the Pacific since the early Miocene, particularly in the equatorial region that includes the first CCD model for the western tropical Pacific. Distinct CCD fluctuations in the western and eastern equatorial regions of the Pacific (Figures 4A,B) highlight the importance of longitudinal CCD variability beyond the previously discussed latitudinal gradient (Lyle, 2003). Previous studies (Campbell et al., 2018; Lyle, 2003; Pälike et al., 2012) have documented the eastern equatorial Pacific CCD evolution in detail. However, our complementary western tropical CCD model represents a new CCD reconstruction in this region (Figure 4B), revealing two significant (∼1 km) CCD deepening pulses from the early Oligocene to the early Miocene not seen in the eastern equatorial region. The first deepening, from ∼3.2 km at 30.5 Ma to ∼4 km at 29 Ma, remains enigmatic. It cannot be linked to regional gateway modifications due to a lack of any significant changes in tropical Pacific gateways before the Miocene (Lyle et al., 2008), nor to the early Oligocene East Antarctic glaciation, as this continental glaciation did not lead to deep ocean circulation changes or associated cooling (Lear et al., 2000; Mackensen, 2004). Further constraints from additional drill sites with reliable age models covering the earliest Oligocene, which are currently not available, are essential to determine whether this shift represents a regional response to primary carbonate productivity (e.g., Lyle et al., 2008; Moore Jr et al., 2004; Van Andel and Moore Jr, 1974).
The second CCD deepening in this region, from ∼3.2 km at 23.5 Ma to ∼4.1 km at 20.5 Ma following a gradual rise, may be associated with the significant growth of West Antarctic Ice Sheet (WAIS) at this time. A recent study by Klages et al. (2024) based on Earth system and ice sheet models, utilizing multiproxy data from both terrestrial and marine microfossils from West Antarctica’s Pacific margin, revealed that the West Antarctic ice sheet initially expanded into the marine realm at ∼26 Ma, lagging the East Antarctic glaciation by ∼7–8 Ma. A delayed response to this late Oligocene growth in Antarctic ice sheet has also been observed in ocean cooling of ∼1°C after ∼24 Ma based on geochemical proxies (Billups and Schrag, 2002). Thus, the western tropical CCD deepening after ∼24 Ma may be ascribed to the ocean’s delayed cooling in response to the late Oligocene WAIS, coinciding with a notable decrease in atmospheric CO2 during the earliest Miocene (Hönisch et al., 2023). Our results suggest that the early Miocene Antarctic Bottom Water (AABW) formation (Woodruff and Savin, 1989), following the expansion of the WAIS and its northward flow along the western South Pacific, may have impacted the western tropical Pacific during the earliest Miocene. This glacial cooling may be incorporated with low sea surface temperature (SST) affected by the distributed Western Pacific Warm Pool (WPWP) to the Indian Ocean during this time, resulting in this early Miocene CCD deepening. Episodes of higher nutrient concentration favoring carbonate productivity (small-size coccolith production) in the western tropical Pacific over the Miocene correspond to cooling and a shallower thermocline affected by the Western Pacific Warm Pool (WPWP) dynamics (Imai et al., 2015; Yuwono and Sato, 2020). During the early Miocene, when the Indonesian Seaway was still open, the Indo-Pacific water exchange and westward WPWP flow to the Indian Ocean created a shallow thermocline across the western tropical region (Von Der Heydt and Dijkstra, 2011), which could possibly contribute to carbonate accumulation. The role of the thermocline in calcareous biogenic productivity across the western tropical and western North Pacific during the Miocene and Pliocene (Imai et al., 2015; Pratiwi and Sato, 2016) suggests that it may have played a major role in driving CCD variations in the western tropical Pacific since the Miocene. For instance, the cooling and shoaling of the thermocline and enhanced water mixing across the western tropical Pacific since 4 Ma, with intensified episodes between ∼3.1 Ma and ∼0.7 Ma (Dang et al., 2024), agree with our modelled CCD deepening from ∼3.8 km at 3 Ma to ∼4.5 km at 0.5 Ma in this region. The western tropical Pacific thermocline and its vertical changes, affected by the East Antarctic glaciation and the progressively reduced Indo-Pacific water exchange through the Indonesian Seaway constriction during the Miocene (Gallagher et al., 2009; Gasperi and Kennett, 1993; Nathan and Leckie, 2009), and its effect on the CCD variability of this region require further investigation.
Although Imai et al. (2015) described a similar effect of the thermocline changes on carbonate production in the western North Pacific over the Neogene, the inferred timing by the authors (e.g., shoaling of the thermocline since 5 Ma) does not exhibit a clear pattern correlative with our western North Pacific CCD fluctuations. In the middle Miocene, a CCD shoaling in the western North Pacific, peaking at ∼3.5 km between 15 Ma and 14.5 Ma (Figure 3B), could be associated with the Miocene Climate Optimum (MCO: 17–14 Ma; Westerhold et al., 2020). Holbourn et al. (2014) used benthic foraminiferal isotope signatures from the eastern equatorial Pacific during the MCO combined with astronomically tuned δ18O and δ13C proxies from the southeast and northwest Pacific covering the same interval from an earlier study (Holbourn et al., 2007) to suggest that the Southern Hemisphere warming led to an ∼5 °C increase in Pacific deep ocean temperature between 15.7 and 14.7 Ma, which in turn resulted in enhanced deep-sea carbonate dissolution and a CCD rise. According to the authors, carbonate preservation recovered during the next cooling phase at ∼13.8 Ma, associating with Antarctic ice sheet expansion, which correlates with a reduction in atmospheric CO2 (Hönisch et al., 2023). This pattern and subsequent recovery are reflected in a CCD shoaling within MCO, peaking at ∼3.5 km between∼15 and ∼14.5 Ma, followed by a deepening to ∼4 km at 13.5 Ma in our model from the western North region. A recent study by Holbourn et al. (2024) based on a multi-proxy record from Site U1490 in the western equatorial Pacific shows an increased carbonate accumulation over the MCO followed by a decrease during the Middle Miocene Climate Transition (MMCT). These excursions agree with our CCD model for the western tropical Pacific (Figure 4B), which shows a CCD deepening from ∼3.6 km at ∼16.5 Ma to ∼4.1 km at its end, followed by a short-lived CCD shallowing to 3.5 km at the start of the MMCT. Holbourn et al. (2024) attribute the carbonate accumulation high during the MCO to increased primary productivity, possibly related to an increase in weathering (Bolton et al., 2016; Si and Rosenthal, 2019), which compensated for increased carbonate dissolution related to the increased formation and northward expansion of corrosive deep waters in the western tropical Pacific. During the MMCT, carbonate preservation improved due to reduced CO2 uptake at deep-water formation sites in the Southern Ocean, while carbonate accumulation decreased (Holbourn et al., 2024) suggesting that primary productivity also decreased at this time.
Since the late Miocene, the CCD fluctuated between ∼3.4 km and ∼3.9 km in the western North Pacific (Figure 3B), which could be linked to the impact of the Panama Gateway constriction on the deep-water chemistry of the Pacific. At present, the Pacific deep water is becoming enriched in dissolved silica, while displaying relatively low carbonate ion concentrations as deep water flows and ages toward the North Pacific (Zhang et al., 2022). This northward silica gradient across the Pacific mirrors the late Miocene pattern, following the formation of AABW and its northward flow to the North Pacific (Woodruff and Savin, 1989). This silica gradient is triggered by reduced Atlantic-Pacific water exchange through the restriction of the Panama Gateway and enhanced nutrient concentration and productivity across the eastern equatorial Pacific (Schneider and Schmittner, 2006). Productivity increases result in opal sedimentation due to faster rain of opal and its higher preservation compared to carbonate (Lyle and Baldauf, 2015). Recycling and dissolution of biogenic opal before complete burial (Ragueneau et al., 2000) could result in enhanced dissolved silica (DSi) toward the North Pacific. Additionally, Panama Gateway constriction enhanced the North Atlantic Deep Water (NADW) production (Butzin et al., 2011; Schneider and Schmittner, 2006) and accompanied by Antarctic cooling, led to an increased AABW flow to the Pacific enriched in dissolved silica (Keller and Barron, 1983), triggering the DSi pool to the North Pacific (Cortese et al., 2004). All these occurrences have resulted in enhanced silica burial in the western North Pacific over the late Neogene (Barron, 1998; Rea et al., 1995), which is reflected in the overall shoaling trend of our CCD model since the late Miocene. We interpret this CCD rise in relation to silica flux because diatom productivity surpasses coccolith accumulation under relatively high nutrient supply conditions (Litchman, 2007), and higher silica productivity intervals coincide with carbonate dissolution (Lyle and Baldauf, 2015), which leads to a shoaling trend of the CCD. This is supported by the stratigraphy of ODP sites 881, 882, 883 and 884 from the western North region (Figure 1), which is dominated by post-late Miocene diatom ooze. In addition, our CCD reconstruction in the western North Pacific shows shoaling peaks at 6.5 Ma and 3 Ma, which correlate with two notable peaks of silica accumulation (at ∼6 Ma and ∼3 Ma) in this region (Rea et al., 1995).
Our eastern equatorial CCD model shows two shallowing pulses in relation to two major events of the late Miocene, encompassing the carbonate crash and biogenic bloom, in this region (Figure 4A). The first shoaling, with an onset at ∼11.5 Ma, corresponds to the carbonate crash event recognized by Lyle et al. (1995) in different parts of the eastern equatorial Pacific between 11 and 8 Ma. Lyle and Baldauf (2015) determined that this event occurred between 13.2 and 8 Ma in the Pacific eastern equatorial region. Our CCD reconstructions suggest that the peak of the carbonate crash occurred between 10.5 and 9 Ma over a regional scale across the eastern equatorial Pacific, coinciding with the lowest carbonate preservation of ∼9.7 Ma from Lyle et al. (2019). This event is reflected in the CCD shoaling of ∼800 m from ∼4.8 km at 12 Ma to ∼4 km at 10 Ma in our model, ∼300 m shallower than the value computed by Pälike et al. (2012) for this period (Figure 4A). The carbonate crash may be explained as a consequence of the Panama Gateway constriction by enhanced carbonate dissolution due to intensified AABW flow and corrosive water circulation to the Pacific (Lyle et al., 1995; Roth et al., 2000). Furthermore, in the western tropical Pacific, the CCD shoals by ∼900 m, from ∼4.2 km at ∼11 Ma to ∼3.2 km at ∼8 Ma (Figure 4B), indicating the occurrence of the carbonate crash event in this region. This marked shift further suggests that the equatorial region of the Pacific has experienced a substantial response to the carbonate crash event during the late Miocene. Based on our CCD data, we propose the initiation of carbonate crash in the eastern equatorial Pacific at ∼11.5 Ma and in the western tropical Pacific at ∼10.5 Ma. Additionally, the CCD shallowing corresponding to the carbonate crash peaks at ∼8 Ma in the western tropical region, compared to that of the eastern equatorial of ∼10–9.5 Ma. These patterns may offer the east-west lag in the onset and intensification of the carbonate crash. Nathan and Leckie (2009) described a ∼1 Ma delay in the initiation of the carbonate crash event from the Caribbean to the eastern equatorial Pacific, which we argue may have further extended into the western tropical region of the Pacific. However, considering the 0.5 Ma resolution of our analysis, this interpretation should be regarded with caution. We also note a signal of this event in our model for the eastern South Pacific expressed by a rise of the CCD from ∼3.5 to ∼3.2 km between 12 and 10.5 Ma (Figure 6A). The carbonate crash event was also inferred in the eastern South Pacific by Preiss-Daimler et al. (2021) based on a carbonate accumulation decline at ∼11 Ma. The occurrence of the carbonate crash event in the eastern South Pacific suggests that the oceanographic effect of the Panama Gateway constriction extended beyond the Pacific equatorial region. However, our findings indicate that the carbonate crash may not have occurred as a basin-wide event across the Pacific Ocean. The spatially variable expression of the carbonate crash within the Pacific broadly corresponds to the carbonate crash signals observed in the low-to mid-latitude Atlantic and Indian Oceans (Lübbers et al., 2019; Preiss-Daimler et al., 2021). Notably, our CCD model reveals no evidence of this occurrence in the western North Pacific, where the CCD remained relatively stable between ∼3.9 and ∼3.8 km from ∼12 to ∼8.5 Ma (Figure 3B). Moreover, examining core sediments from deep-sea drill sites in this region, like those from the Shatsky Rise (Figure 1), which extend into the middle Miocene, demonstrate well-preserved carbonate sequences predominantly composed of nannofossil ooze, with CaCO3 concentrations averaging ∼60–70% during this interval.
The subsequent CCD shallowing in the eastern equatorial region of the latest Miocene, peaking between ∼7 and ∼6.5 Ma (Figure 4A), corresponds to the late Miocene biogenic bloom event of the eastern equatorial Pacific, which may be another response to the Panama Gateway constriction and the resulting differentiation in Atlantic-Pacific deep water (Farrell et al., 1995; Lyle and Baldauf, 2015; Lyle et al., 2019; Pillot et al., 2023). The occurrence of the biogenic bloom from our model is coeval with the late Miocene carbon isotope shift between 7.7 and 6.4 Ma (Drury et al., 2017). While the underlying mechanisms of the late Miocene biogenic bloom remain debated, Pillot et al. (2023) argue that the heterogeneous distribution of biogenic bloom (with peak intensity at ∼7 Ma) across the global ocean may be driven by the strengthening of thermohaline circulation or intensified wind-driven upwelling on a global scale, both influenced by climate variability and gateway dynamics. Here, our CCD record correlates with the highest biogenic opal accumulation rates recorded between 7.1 and 6.4 Ma from Lyle and Baldauf (2015), and between 7 and 6.5 Ma from Lyle et al. (2019) in the eastern equatorial region. Lyle et al. (2019) suggest that despite high carbonate burial since 14 Ma (apart from the carbonate crash interval), enhanced diatom productivity during the biogenic bloom was accompanied by reduced carbonate accumulation across the equatorial high-productivity region of the Pacific. Supporting this, Lyle et al.’s (2019) data indicate that an average of ∼20% increase in biogenic opal wt% corresponded with a ∼20% decrease in CaCO3 wt% between ∼7 and ∼6.5 Ma at drill site U1338, which is part of a cluster of eight drill sites, identified within the biogenic bloom manifestation zone in the eastern equatorial Pacific (Pillot et al., 2023). Within this period, opal wt% peaked at ∼39%, while carbonate content declined to ∼44%, representing a ∼35% reduction from ∼7.5 Ma. These observations may suggest that enhanced opal accumulation is captured in our CCD model by a peak of shoaling (∼7–6.5 Ma) across the eastern equatorial region. However, in the western tropical region, CCD shoaling reached its peak between ∼5.5 and ∼5 Ma (∼3.3–3.2 km), when the eastern equatorial CCD deepened to ∼4.5 km by ∼5 Ma (Figures 4A,B). The observed offset in CCD trends between the western and eastern equatorial Pacific until ∼4 Ma may reflect perturbations between biogenic opal production and carbonate accumulation, modulated by thermocline variability across the equator. The thermocline shifts, influenced by the Pacific warm pool dynamics, contributed to longitudinal asymmetry in species distribution across the equatorial Pacific during the late Miocene (Nathan and Leckie, 2009). Our results also represent a subsequent relative convergence of CCD patterns across the western tropical and eastern equatorial regions between ∼4 Ma and ∼1 Ma, which coincides with a diminished west-east thermocline gradient (Wara et al., 2005) and the disappearance of a nannofossil content gradient across the equatorial Pacific during this interval (Bolton et al., 2010). Nevertheless, a more comprehensive understanding of the interplay between CCD variability, Pacific warm pool fluctuations, and the differential contributions of opal and carbonate productivity across the equatorial Pacific necessitates further examination of high-resolution proxy data.
5 Conclusions
We present new models of the CCD across the entire Pacific Ocean, split into six regions (western North Pacific, eastern North Pacific, western tropical Pacific, eastern equatorial Pacific, western South Pacific, and eastern South Pacific). Our results demonstrate distinct regional variability in CCD fluctuations across the Pacific, which differ from the reconstructed average CCD that characterizes the overall Pacific basin. We find the deepest CCD in the eastern equatorial area, ranging between ∼3.7 and ∼4.7 km prior to the middle Miocene. In contrast, the western North Pacific region features a relatively shallow CCD (∼2.3–4 km) over the majority of the Neogene, rarely exceeding 4 km. Coupled with the diverse CCD changes between the eastern equatorial and western tropical regions of the Pacific, our CCD models highlight substantial latitude-longitude heterogeneity in carbonate flux across the Pacific Ocean over the late Cenozoic. We interpret the CCD changes across the Pacific regions to reflect the effect of climate variability, the Antarctic glaciation, and the configurations of the Indonesian and the Panama gateways on regional carbonate productivity across the Pacific over the Neogene. Our model of the western tropical Pacific CCD, the first of its kind, demonstrates a distinct drop at the earliest Miocene that may be related to marine West Antarctic ice sheet growth at 26 Ma (Klages et al., 2024), suggesting a delayed deep ocean cooling after ∼2 Ma. We propose the peaks of CCD shoaling ∼10–9.5 Ma and ∼7–6.5 Ma corresponding to the carbonate crash and biogenic bloom events, respectively, in the eastern equatorial Pacific. These occurrences are also observed in the western tropical region from our CCD models, which may imply these events are characterized over the equatorial region of the Pacific.
Our study provides constraints on CCD perturbations on regional scales. The particularly deeper CCD of the eastern equatorial Pacific, compared to the western tropical and western North regions during the Miocene, offers a caution against the common practice of using the eastern equatorial CCD to represent the entire Pacific (e.g., Bogumil et al., 2024; Boudreau and Luo, 2017) in long-term carbon cycle modeling. However, there is a vital need for future drilling targeting oceanic crust older than 60 Ma in the western Pacific to gain deeper insights into CCD behavior during the warm intervals of the Cretaceous and Paleogene. Additionally, future research could focus on better constraining the CCD and carbonate accumulation in other regions of the global ocean, noting that their evolution is poorly-defined in the Indian and Southern oceans.
Data availability statement
Data supporting the results of this study can be found online at https://doi.org/10.5281/zenodo.15116747.
Author contributions
FD: Data curation, Formal Analysis, Investigation, Visualization, Writing – original draft. AD: Conceptualization, Formal Analysis, Funding acquisition, Methodology, Supervision, Writing – review and editing. NW: Formal Analysis, Supervision, Writing – review and editing. BM: Formal Analysis, Supervision, Writing – review and editing. DM: Conceptualization, Formal Analysis, Methodology, Supervision, Writing – review and editing.
Funding
The author(s) declare that financial support was received for the research and/or publication of this article. This research was supported by an Australian Research Council (ARC) PhD scholarship to FD and an ARC Future Fellowship to AD via grant FT190100829. NW was supported by BHP through the Spatio TEmporaL expLorAtion for Resources “STELLAR” project and an ARC Early Career Industry Fellowship via grant IE230100098. BM and DM were also supported by the “STELLAR” project, and by the AuScope Simulation, Analysis and Modelling node funded by the Australian Government through the National Collaborative Research Infrastructure Strategy, NCRIS.
Acknowledgments
We thank the reviewers for their thoughtful and constructive feedback, which greatly enhanced the quality of this article.
Conflict of interest
The authors declare that the research was conducted in the absence of any commercial or financial relationships that could be construed as a potential conflict of interest.
Generative AI statement
The author(s) declare that no Generative AI was used in the creation of this manuscript.
Publisher’s note
All claims expressed in this article are solely those of the authors and do not necessarily represent those of their affiliated organizations, or those of the publisher, the editors and the reviewers. Any product that may be evaluated in this article, or claim that may be made by its manufacturer, is not guaranteed or endorsed by the publisher.
Supplementary material
The Supplementary Material for this article can be found online at: https://www.frontiersin.org/articles/10.3389/feart.2025.1605906/full#supplementary-material
References
Amante, C., and Eakins, B. W. (2009). ETOPO1 arc-minute global relief model: procedures, data sources and analysis. Boulder, CO: National Geophysical Data Center, NOAA, NOAA Technical Memorandum NESDIS NGDC-24. Available online at: https://repository.library.noaa.gov/view/noaa/1163.
Bahr, A., Kaboth-Bahr, S., and Karas, C. (2023). The opening and closure of oceanic seaways during the Cenozoic: pacemaker of global climate change? Straits and seaways: controls, processes and implications in modern and ancient systems. Editors V. M. Rossi, S. G. Longhitano, C. Olario, and F. L. Chiocci (London, UK: Geological Society, London, Special Publication), 523, 141–171. doi:10.1144/SP523-2021-54
Barron, J. A. (1998). Late Neogene changes in diatom sedimentation in the North Pacific. J. Asian Earth Sci. 16 (1), 85–95. doi:10.1016/S0743-9547(97)00046-9
Berger, W. H. (1973). Cenozoic sedimentation in the eastern tropical Pacific. Geol. Soc. Am. Bull. 84 (6), 1941–1954. doi:10.1130/0016-7606(1973)84<1941:CSITET>2.0.CO;2
Billups, K., and Schrag, D. P. (2002). Paleotemperatures and ice volume of the past 27 Myr revisited with paired Mg/Ca and 18O/16O measurements on benthic foraminifera. Paleoceanography 17 (1), 3-1-3-11. doi:10.1029/2000PA000567
Bogumil, M., Mittal, T., and Lithgow-Bertelloni, C. (2024). The effects of bathymetry on the long-term carbon cycle and CCD. Earth, Atmos. Planet. Sci. 121 (21), e2400232121. doi:10.1073/pnas.2400232121
Bolton, C. T., Gibbs, S. J., and Wilson, P. A. (2010). Evolution of nutricline dynamics in the equatorial Pacific during the late Pliocene. Paleoceanogr. Paleoclimatology 25 (1). doi:10.1029/2009PA001821
Bolton, C. T., Hernández-Sánchez, M. T., Fuertes, M., González-Lemos, S., Abrevaya, L., Mendez-Vicente, A., et al. (2016). Decrease in coccolithophore calcification and CO2 since the middle Miocene. Nat. Commun. 7 (10284), 10284. doi:10.1038/ncomms10284
Boss, S. K., and Wilkinson, B. H. (1991). Planktogenic/eustatic control on cratonic/oceanic carbonate accumulation. J. Geol. 99 (4), 497–513. doi:10.1086/629513
Bostock, H. C., Hayward, B. W., Neil, H. L., Currie, K. I., and Dunbar, G. B. (2011). Deep-water carbonate concentrations in the southwest Pacific. Deep Sea Res. Part I Oceanogr. Res. Pap. 58 (1), 72–85. doi:10.1016/j.dsr.2010.11.010
Boudreau, B. P., and Luo, Y. (2017). Retrodiction of secular variations in deep-sea CaCO3 burial during the Cenozoic. Earth Planet. Sci. Lett. 474, 1–12. doi:10.1016/j.epsl.2017.06.005
Braz, C., Zahirovic, S., Salles, T., Flament, N., Harrington, L., and Müller, R. D. (2021). Modelling the role of dynamic topography and eustasy in the evolution of the Great Artesian Basin. Basin Res. 33 (6), 3378–3405. doi:10.1111/bre.12606
Broecker, W. S. (2008). A need to improve reconstructions of the fluctuations in the calcite compensation depth over the course of the Cenozoic. Paleoceanography 23 (1), PA1204. doi:10.1029/2007PA001456
Butzin, M., Lohmann, G., and Bickert, T. (2011). Miocene ocean circulation inferred from marine carbon cycle modeling combined with benthic isotope records. Paleoceanogr. Paleoclimatology 26 (1). doi:10.1029/2009PA001901
Campbell, S. M., Moucha, R., Derry, L. A., and Raymo, M. E. (2018). Effects of dynamic topography on the Cenozoic carbonate compensation depth. Geochem. Geophys. Geosystems 19 (4), 1025–1034. doi:10.1002/2017GC007386
Cortese, G., Gersonde, R., Hillenbrand, C.-D., and Kuhn, G. (2004). Opal sedimentation shifts in the world ocean over the last 15 myr. Earth Planet. Sci. Lett. 224 (3-4), 509–527. doi:10.1016/j.epsl.2004.05.035
Dang, H., Ren, Y., Peng, N., Ma, X., Liu, F., Luo, L., et al. (2024). Long-term changes in the Western Pacific Warm Pool upper-water structure over the last 4 Ma. Palaeogeogr. Palaeoclimatol. Palaeoecol. 651, 112396. doi:10.1016/j.palaeo.2024.112396
Delaney, M. L., and Boyle, E. A. (1988). Tertiary paleoceanic chemical variability: unintended consequences of simple geochemical models. Paleoceanogr.Paleoclimatology 3 (2), 137–156. doi:10.1029/PA003i002p00137
Drury, A. J., Westerhold, T., Frederichs, T., Tian, J., Wilkens, R., Channell, J. E., et al. (2017). Late miocene climate and time scale reconciliation: accurate orbital calibration from a deep-sea perspective. Earth Planet. Sci. Lett. 475, 254–266. doi:10.1016/j.epsl.2017.07.038
Dutkiewicz, A., and Müller, R. D. (2021). The carbonate compensation depth in the South Atlantic Ocean since the late cretaceous. Geology 49 (7), 873–878. doi:10.1130/G48404.1
Dutkiewicz, A., and Müller, R. D. (2022). The history of Cenozoic carbonate flux in the Atlantic Ocean constrained by multiple regional carbonate compensation depth reconstructions. Geochem. Geophys. Geosystems 23 (11), e2022GC010667. doi:10.1029/2022GC010667
Dutkiewicz, A., Müller, R. D., Cannon, J., Vaughan, S., and Zahirovic, S. (2018). Sequestration and subduction of deep-sea carbonate in the global ocean since the Early Cretaceous. Geology 47 (1), 91–94. doi:10.1130/G45424.1
Eagles, G., and Jokat, W. (2014). Tectonic reconstructions for paleobathymetry in Drake passage. Tectonophysics 611, 28–50. doi:10.1016/j.tecto.2013.11.021
Farrell, J. W., Raffi, I., Janecek, T. R., Murray, D. W., Levitan, M., Dadey, K. A., et al. (1995). “35. Late Neogene sedimentation patterns in the eastern equatorial Pacific Ocean,”. Editors N. G. Pisias, L. A. Mayer, T. R. Janecek, A. Palmer-Julson, and T. H. van Andel (College Station, TX: Ocean Drilling Program), 138, 2419–2426. doi:10.2973/odp.proc.sr.138.143.1995Proc. Ocean Drill. Program, Sci. Results
Gallagher, S. J., Wallace, M. W., Li, C. L., Kinna, B., Bye, J. T., Akimoto, K., et al. (2009). Neogene history of the West Pacific warm pool, Kuroshio and Leeuwin currents. Paleoceanogr. Paleoclimatology 24 (1), 1–27. doi:10.1029/2008PA001660
Gasperi, J. T., and Kennett, J. P. (1993). Vertical thermal structure evolution of Miocene surface waters: western equatorial Pacific DSDP Site 289. Mar. Micropaleontol. 22 (3), 235–254. doi:10.1016/0377-8398(93)90046-Z
Gradstein, F. M., Ogg, J. G., Schmitz, M. D., and Ogg, G. M. (2020). Geologic time scale 2020, 1. Netherlands: Elsevier. doi:10.1016/C2020-1-02369-3
Gray, W. R., Rae, J. W. B., Wills, R. C. J., Shevenell, A. E., Taylor, B., Burke, A., et al. (2018). Deglacial upwelling, productivity and CO2 outgassing in the North Pacific ocean. Nat. Geosci. 11 (5), 340–344. doi:10.1038/s41561-018-0108-6
Haq, B. U., Hardenbol, J., and Vail, P. R. (1987). Chronology of fluctuating sea levels since the Triassic. Science 235 (4793), 1156–1167. doi:10.1126/science.235.4793.1156
Holbourn, A., Kuhnt, W., Kulhanek, D. K., Mountain, G., Rosenthal, Y., Sagawa, T., et al. (2024). Re-Organization of Pacific overturning circulation across the Miocene climate Optimum. Nat. Commun. 15 (8135), 8135. doi:10.1038/s41467-024-52516-x
Holbourn, A., Kuhnt, W., Lyle, M., Schneider, L., Romero, O., and Andersen, N. (2014). Middle Miocene climate cooling linked to intensification of eastern equatorial Pacific upwelling. Geology 42 (1), 19–22. doi:10.1130/G34890.1
Holbourn, A., Kuhnt, W., Schulz, M., Flores, J.-A., and Andersen, N. (2007). Orbitally-paced climate evolution during the middle Miocene “Monterey” carbon-isotope excursion. Earth Planet. Sci. Lett. 261 (3-4), 534–550. doi:10.1016/j.epsl.2007.07.026
Hönisch, B., Royer, D. L., Breecker, D. O., Polissar, P. J., Bowen, G. J., Henehan, M. J., et al. (2023). Toward a Cenozoic history of atmospheric CO2. Science 382 (6675), eadi5177. doi:10.1126/science.adi5177
Imai, R., Farida, M., Sato, T., and Iryu, Y. (2015). Evidence for eutrophication in the northwestern Pacific and eastern Indian oceans during the Miocene to Pleistocene based on the nannofossil accumulation rate, Discoaster abundance, and coccolith size distribution of Reticulofenestra. Mar. Micropaleontol. 116, 15–27. doi:10.1016/j.marmicro.2015.01.001
Keller, G., and Barron, J. A. (1983). Paleoceanographic implications of Miocene deep-sea hiatuses. Geol. Soc. Am. Bull. 94 (5), 590–613. doi:10.1130/0016-7606(1983)94<590:PIOMDH>2.0.CO;2
Klages, J. P., Hillenbrand, C.-D., Bohaty, S. M., Salzmann, U., Bickert, T., Lohmann, G., et al. (2024). Ice sheet–free West Antarctica during peak early Oligocene glaciation. Science 385, 322–327. doi:10.1126/science.adj3931
Komar, N., and Zeebe, R. E. (2021). Reconciling atmospheric CO2, weathering, and calcite compensation depth across the Cenozoic. Sci. Adv. 7 (4), eabd4876. doi:10.1126/sciadv.abd4876
Kuhnt, W., Holbourn, A., Hall, R., Zuvela, M., and Käse, R. (2004). “Neogene history of the Indonesian throughflow,” in Continent-Ocean interactions within east asian marginal seas, geophysical monograph. Editors P. Clift, W. Kuhnt, P. Wang, and D. Hayes, (Washington, DC: American Geophysical Union), 149, 299–320. doi:10.1029/149GM16
Lear, C. H., Elderfield, H., and Wilson, P. A. (2000). Cenozoic deep-sea temperatures and global ice volumes from Mg/Ca in benthic foraminiferal calcite. Science 287 (5451), 269–272. doi:10.1126/science.287.5451.269
Leon-Rodriguez, L., and Dickens, G. R. (2010). Constraints on ocean acidification associated with rapid and massive carbon injections: the early paleogene record at ocean drilling program site 1215, equatorial Pacific Ocean. Palaeogeogr. Palaeoclimatol. Palaeoecol. 298 (3-4), 409–420. doi:10.1016/j.palaeo.2010.10.029
Litchman, E. (2007). “Resource competition and the ecological success of phytoplankton,” in Evolution of primary producers in the seas. Editors P. G. Falkowski, and A. H. Knoll (Burlington, MA: Elsevier), 351–375. doi:10.1016/B978-012370518-1/50017-5
Lübbers, J., Kuhnt, W., Holbourn, A. E., Bolton, C. T., Gray, E., Usui, Y., et al. (2019). The middle to late Miocene “carbonate crash” in the equatorial Indian ocean. Paleoceanogr. Paleoclimatology 34 (5), 813–832. doi:10.1029/2018PA003482
Lyle, M. (2002). “Age-depth profiles for Pacific DSDP and ODP drillsites,” in Center for geophysical investigation of the shallow subsurface. Boise, Idaho: Boise State University.
Lyle, M. (2003). Neogene carbonate burial in the Pacific Ocean. Paleoceanogr. Paleoclimatology 18 (3). doi:10.1029/2002PA000777
Lyle, M., and Baldauf, J. (2015). Biogenic sediment regimes in the Neogene equatorial Pacific, IODP Site U1338: burial, production, and diatom community. Palaeogeogr. Palaeoclimatol. Palaeoecol. 433, 106–128. doi:10.1016/j.palaeo.2015.04.001
Lyle, M., Barron, J., Bralower, T. J., Huber, M., Olivarez Lyle, A., Ravelo, A. C., et al. (2008). Pacific Ocean and cenozoic evolution of climate. Rev. Geophys. 46 (2). doi:10.1029/2005RG000190
Lyle, M., Dadey, K. A., and Farrell, J. W. (1995). “42. The late Miocene (11–8 Ma) eastern Pacific carbonate crash: evidence for reorganization of deep-water circulation by the closure of the Panama gateway,” Proceedings of the ocean drilling program, scientific results. Editors N. G. Pisas, L. A. Mayer, T. R. Janecek, Palmer-Julson, and T. H. van Andel (College Station, TX: Ocean Drilling Program), 138, 821–838. doi:10.2973/odp.proc.sr.138.157.1995
Lyle, M., Drury, A. J., Tian, J., Wilkens, R., and Westerhold, T. (2019). Late Miocene to Holocene high-resolution eastern equatorial Pacific carbonate records: stratigraphy linked by dissolution and paleoproductivity. Clim. Past 15 (5), 1715–1739. doi:10.5194/cp-15-1715-2019
Ma, X., Tian, J., Ma, W., Li, K., and Yu, J. (2018). Changes of deep Pacific overturning circulation and carbonate chemistry during middle Miocene East Antarctic ice sheet expansion. Earth Planet. Sci. Lett. 484, 253–263. doi:10.1016/j.epsl.2017.12.002
Mackensen, A. (2004). Changing Southern Ocean palaeocirculation and effects on global climate. Antarct. Sci. 16 (4), 369–386. doi:10.1017/S0954102004002202
Miller, K. G., Kominz, M. A., Browning, J. V., Wright, J. D., Mountain, G. S., Katz, M. E., et al. (2005). The Phanerozoic record of global sea-level change. Science 310 (5752), 1293–1298. doi:10.1126/science.1116412
Moore Jr, T. C., Backman, J., Raffi, I., Nigrini, C., Sanfilippo, A., Pälike, H., et al. (2004). Paleogene tropical Pacific: clues to circulation, productivity, and plate motion. Paleoceanogr. Paleoclimatology 19 (3). doi:10.1029/2003PA000998
Müller, R. D., Cannon, J., Williams, S., and Dutkiewicz, A. (2018). PyBacktrack 1.0: a tool for reconstructing paleobathymetry on oceanic and continental crust. Geochem. Geophys. Geosystems 19 (6), 1898–1909. doi:10.1029/2017GC007313
Müller, R. D., Mather, B., Dutkiewicz, A., Keller, T., Merdith, A., Gonzalez, C. M., et al. (2022). Evolution of Earth’s tectonic carbon conveyor belt. Nature 605 (7911), 629–639. doi:10.1038/s41586-022-04420-x
Nathan, S. A., and Leckie, R. M. (2009). Early history of the Western Pacific Warm Pool during the middle to late Miocene (∼13.2–5.8 Ma): role of sea-level change and implications for equatorial circulation. Palaeogeogr. Palaeoclimatol. Palaeoecol. 274 (3-4), 140–159. doi:10.1016/j.palaeo.2009.01.007
Pälike, H., Lyle, M. W., Nishi, H., Raffi, I., Ridgwell, A., Gamage, K., et al. (2012). A Cenozoic record of the equatorial Pacific carbonate compensation depth. Nature 488, 609–614. doi:10.1038/nature11360
Pennington, J. T., Mahoney, K. L., Kuwahara, V. S., Kolber, D. D., Calienes, R., and Chavez, F. P. (2006). Primary production in the eastern tropical Pacific: a review. Prog. Oceanogr. 69 (2-4), 285–317. doi:10.1016/j.pocean.2006.03.012
Pillot, Q., Suchéras-Marx, B., Sarr, A. C., Bolton, C., and Donnadieu, Y. (2023). A global reassessment of the spatial and temporal expression of the Late Miocene Biogenic Bloom. Paleoceanogr. Paleoclimatology 38 (3), e2022PA004564. doi:10.1029/2022PA004564
Pratiwi, S. D., and Sato, T. (2016). Reconstruction of paleoceanography significance in the Western Pacific and Atlantic oceans during the Neogene based on calcareous nannofossil productivity and size variations, related to the global tectonic events. Open J. Geol. 6 (8), 931–943. doi:10.4236/ojg.2016.68070
Preiss-Daimler, I., Zarkogiannis, S. D., Kontakiotis, G., Henrich, R., and Antonarakou, A. (2021). Paleoceanographic perturbations and the marine carbonate system during the middle to late Miocene carbonate crash—a critical review. Geosciences 11 (2), 94. doi:10.3390/geosciences11020094
Ragueneau, O., Tréguer, P., Leynaert, A., Anderson, R. F., Brzezinski, M. A., DeMaster, D. J., et al. (2000). A review of the Si cycle in the modern ocean: recent progress and missing gaps in the application of biogenic opal as a paleoproductivity proxy. Glob. Planet. Change 26 (4), 317–365. doi:10.1016/S0921-8181(00)00052-7
Rea, D. K., Basov, I. A., and Krissek, L. A. (1995). “Scientific results of drilling the North Pacific transect,” Proceedings of the Ocean Drilling Program, scientific results. Editors D. K. Rea, I. A. Basov, D. W. Scholl, and J. F. Allan (College Station, TX: Ocean Drilling Program), 145, 577–596. doi:10.2973/odp.proc.sr.145.1995
Rea, D. K., and Leinen, M. (1986). “Crustal subsidence and calcite deposition in the South Pacific ocean,”. Initial reports of the Deep Sea Drilling project. Editors M. Leinen, and D. K. Rea (Washington, U.S: Government. Printing Office), 92, 299–303. doi:10.2973/dsdp.proc.92.112.1986
Rea, D. K., and Lyle, M. W. (2005). Paleogene calcite compensation depth in the eastern subtropical Pacific: answers and questions. Paleoceanogr. Paleoclimatology 20 (1), 1–9. doi:10.1029/2004PA001064
Renaudie, J., Lazarus, D. B., and Diver, P. (2020). NSB (Neptune Sandbox Berlin): an expanded and improved database of marine planktonic microfossil data and deep-sea stratigraphy. Palaeontol. Electron. 23 (1), 1–28. doi:10.26879/1032
Ridgwell, A., and Hargreaves, J. C. (2007). Regulation of atmospheric CO2 by deep-sea sediments in an Earth system model. Glob. Biogeochem. Cycles 21 (2), 1–14. doi:10.1029/2006GB002764
Roth, J. M., Droxler, A. W., and Kameo, K. (2000). “The Caribbean carbonate crash at the middle to late Miocene transition: linkage to the establishment of the modern global ocean conveyor,” in Proceedings of the Ocean Drilling Program, scientific results. Editors R. M. Leckie, H. Sigurdsson, G. D. Acton, and G. Draper (College Station, TX: Ocean Drilling Program), 165. doi:10.2973/odp.proc.sr.165.013.2000
Schmittner, A., Sarnthein, N., Kinkel, H., Bartoli, G., Bickert, T., Crucifix, M., et al. (2004). Global impact of the Panamanian seaway closure. Eos, Trans. AGU 85 (49), 526. doi:10.1029/2004EO490010
Schneider, B., and Schmittner, A. (2006). Simulating the impact of the Panamanian seaway closure on ocean circulation, marine productivity and nutrient cycling. Earth Planet. Sci. Lett. 246 (3-4), 367–380. doi:10.1016/j.epsl.2006.04.028
Sclater, J. G., Meinke, L., Bennett, A., and Murphy, C. (1985). “The depth of the ocean through the Neogene,” in The Miocene ocean: paleoceanography and biogeography. Editor J. P. Kennett (Geological Society of America Memoirs), 163, 1–20. doi:10.1130/MEM163-p1
Si, W., and Rosenthal, Y. (2019). Reduced continental weathering and marine calcification linked to late Neogene decline in atmospheric CO2, Nat. Geosci. 12, 833–838. doi:10.1038/s41561-019-0450-3
Straume, E. O., Gaina, C., Medvedev, S., and Nisancioglu, K. H. (2020). Global Cenozoic paleobathymetry with a focus on the Northern Hemisphere oceanic gateways. Gondwana Res. 86, 126–143. doi:10.1016/j.gr.2020.05.011
Sulpis, O., Boudreau, B. P., Mucci, A., Jenkins, C., Trossman, D. S., Arbic, B. K., et al. (2018). Current CaCO3 dissolution at the seafloor caused by anthropogenic CO2. Proc. Natl. Acad. Sci. U. S. A. 115 (46), 11700–11705. doi:10.1073/pnas.1804250115
van Andel, T. H. (1975). Mesozoic/Cenozoic calcite compensation depth and the global distribution of calcareous sediments. Earth Planet. Sci. Lett. 26 (2), 187–194. doi:10.1016/0012-821X(75)90086-2
van Andel, T. H., Heath, G. R., Moore, J., and Theodore, C. (1975). “Cenozoic history and paleoceanography of the central equatorial Pacific Ocean,” Cenozoic history and paleoceanography of the central equatorial Pacific Ocean. Editors T. H. van Andel, G. R. Heath, J. Moore, and T. Carlton (Boulder, CO: Geological Society of America Memoris), 143, 1–223. doi:10.1130/MEM143-p1
Van Andel, T. H., and Moore, J. , T. (1974). Cenozoic calcium carbonate distribution and calcite compensation depth in the central equatorial Pacific Ocean. Geology 2 (2), 87–92. doi:10.1130/0091-7613(1974)2<87:CCCDAC>2.0.CO;2
Von Der Heydt, A. S., and Dijkstra, H. A. (2011). “The impact of ocean gateways on ENSO variability in the Miocene,” The SE asian gateway: history and tectonics of the australia-asia collision. Editors R. Hall, M. A. Cottam, and M. E. J. Wilson (London, UK: Geological Society, London, Special Publications), 355, 305–318. doi:10.1144/SP355.15
Wade, B. S., O’Neill, J. F., Phujareanchaiwon, C., Ali, I., Lyle, M., and Witkowski, J. (2020). Evolution of deep-sea sediments across the Paleocene-Eocene and Eocene-Oligocene boundaries. Earth-Science Rev. 211, 103403. doi:10.1016/j.earscirev.2020.103403
Wara, M. W., Ravelo, A. C., and Delaney, M. L. (2005). Permanent el niño-like conditions during the Pliocene warm period. Science 309 (5735), 758–761. doi:10.1126/science.1112596
Wessel, P., Luis, J. F., Uieda, L., Scharroo, R., Wobbe, F., Smith, W. H. F., et al. (2019). The generic mapping tools version 6. Geochem. Geophys. Geosystems 20 (11), 5556–5564. doi:10.1029/2019GC008515
Westerhold, T., Marwan, N., Drury, A. J., Liebrand, D., Agnini, C., Anagnostou, E., et al. (2020). An astronomically dated record of Earth’s climate and its predictability over the last 66 million years. Science 369 (6509), 1383–1387. doi:10.1126/science.aba6853
Woodruff, F., and Savin, S. M. (1989). Miocene deepwater oceanography. Paleoceanogr. Paleoclimatology 4 (1), 87–140. doi:10.1029/PA004i001p00087
Xiao, K., Hu, X., Jiang, J., and Wang, J. (2024). Unraveling the Cenozoic carbon cycle by reconstructing carbonate compensation depth (CCD). Sci. China Earth Sci. 67 (6), 1743–1758. doi:10.1007/s11430-023-1291-5
Yin, S., Hernández-Molina, F. J., Jutzeler, M., and Li, J. (2022). Progressive intensification of Pacific deep water circulation since the early Pliocene. Geophys. Res. Lett. 49 (9), e2022GL098051. doi:10.1029/2022GL098051
Yuwono, F. S., and Sato, T. (2020). Miocene Sea surface dynamics in the western equatorial pacific based on calcareous nannofossil records. IOP Conf. Ser. Earth Environ. Sci. 618, 012006. Paper presented at the IOP Conference Series: Earth and Environmental Science. doi:10.1088/1755-1315/618/1/012006
Keywords: Pacific Ocean, Neogene, carbonate compensation depth, carbon cycle, paleowater depth, carbonate accumulation
Citation: Dalvand F, Dutkiewicz A, Wright NM, Mather BR and Müller D (2025) Regional carbonate compensation depth variability in the Pacific Ocean since the Oligocene. Front. Earth Sci. 13:1605906. doi: 10.3389/feart.2025.1605906
Received: 04 April 2025; Accepted: 30 May 2025;
Published: 18 June 2025.
Edited by:
Claudia Belviso, National Research Council (CNR), ItalyCopyright © 2025 Dalvand, Dutkiewicz, Wright, Mather and Müller. This is an open-access article distributed under the terms of the Creative Commons Attribution License (CC BY). The use, distribution or reproduction in other forums is permitted, provided the original author(s) and the copyright owner(s) are credited and that the original publication in this journal is cited, in accordance with accepted academic practice. No use, distribution or reproduction is permitted which does not comply with these terms.
*Correspondence: Faranak Dalvand, ZmFyYW5hay5kYWx2YW5kQHN5ZG5leS5lZHUuYXU=