 Feifei Jin1,2,3*
- 1School of Highway, Chang’an University, Xi’an, China
- 2The Key Laboratory of lntelligent Construction and Maintenance of CAAC, Chang’an University, Xi’an, China
- 3Xi’an Key Laboratory of Geotechnical Engineering for Green and Intelligent Transport, Xi’an, China
Large-scale shaking table model tests were conducted to investigate the seismic performance of geocell retaining walls. The variation laws of lateral confinement pressure, acceleration amplification factor, horizontal displacement of wall and settlement of slope under different ground motion parameters are analyzed, and the failure mode of retaining wall is discussed. At the same time, FLAC3D numerical software is used to establish and analyze the slope ratio and height width ratio of retaining wall. The following conclusions are derived from the aforementioned data: (1) The results indicate that as seismic amplitude increases, the lateral confinement pressure within the cells, the peak horizontal displacement, and the slope crest settlement all increase gradually. Furthermore, the acceleration amplification coefficient exhibits an amplification effect along the elevation. (2) When the frequency is less than 4 Hz, the geocell lateral confinement pressure, acceleration amplification factor, and slope settlement are relatively small, and displacement decreases with increasing frequency. Conversely, when the frequency exceeds 4 Hz, the four seismic indices increase pro-gressively. (3) The dynamic response of the model is more pronounced under X-direction vibrations, and natural waves have a greater impact on the model. (4) After vibration at an amplitude of 0.9 g concludes, the non-uniform settlement value is 0.593%, which is below the 2% wall height recommended by specifications, demonstrating excellent settlement control capability. (5)When the amplitude exceeds 0.5 g (i.e., seismic intensity greater than VI degrees), reinforcement belts should be added at the 3H/16 and 8H/16 positions to enhance the stability of the retaining wall. (6) Upon completion of the 1.0 g amplitude test, the permanent horizontal displacement of the retaining wall measures 31.58 mm, accounting for 1.97% of the wall height—below the 2% limit specified by AASHTO standards and thus not meeting the failure criteria. (7) The failure process of the retaining wall can be divided into three stages: vibration compaction, intensified deformation, and convex sliding. After the entire vibration ended, no large-scale collapse or other phenomena occurred in the wall, and it has good seismic performance. (8) Reducing the slope ratio and aspect ratio of the retaining wall significantly improves its stability, and these parameters can be prioritized to 1:0.3 and 1.8, to meet seismic requirements while conserving resources. (9) These findings provide valuable references for the seismic design of geocell retaining wall structures.
1 Introduction
Geocell-reinforced retaining walls have gained widespread application in slope protection projects, such as highways and railways, due to their multiple advantages, including lightweight structures, convenient construction, and ecological aesthetics (Song et al., 2019). However, research on the dynamic response characteristics and seismic performance of geocell retaining walls under earthquake action remains relatively scarce. This lack of knowledge significantly hinders their application and development in seismic engineering, making it both necessary and urgent to investigate the seismic behavior of geocell retaining walls.
Under static conditions, many scholars have conducted research on the stability of geocell retaining walls and achieved remarkable results (Chen et al., 2013; Song and Tian, 2019; Onyekwena et al., 2024; Ari and Misir, 2021). Song et al. (2018) conducted a systematic study on the number of layers of the horizontal reinforced layer based on the centrifugal model test. Liu et al. (2019) conducted tensile tests on the lattice strips and their nodes to explore the mechanical properties of the lattice strips and the failure mechanism of the nodes. Liu et al. (2014), Khorsandi et al. (2021) adopted the limit equilibrium method to study the stability of geocell reinforced slopes. Tavakoli and Motarjemi (2018) studied the influence of the physical and mechanical parameters of fillers on the shear strength of the stiff-soil interface through indoor direct shear tests. Li H. et al. (2021) studied the shear strength and bulk variation characteristics of fine sand reinforced by geocells through large-scale direct shear tests. Under dynamic conditions, certain progress has also been made in related research (Leshchinsky et al., 2008; Madhavi and Manju, 2016; Madhavi and Manju, 2018). Komak et al. (2015) established a numerical model in OpenSees and studied the seismic performance of geosynthetic reinforced soil retaining walls through the pseudo-static method. Anindya et al. (2017) used the FLAC3D numerical software to reveal the failure mechanism of geocell retaining walls under seismic action. Sukrit and Amit (2023) analyzed the seismic performance of retaining walls under two models, namely, vertical panel and inclined panel, through shaking table model tests. Zhu et al. (2021) investigated the effect of geocell reinforcement on the liquefaction and post-liquefaction shear response of saturated sandy soil through cyclic triaxial experiments. Krishnaraj et al. (2023) explored the influence of four types of retaining wall section types on slope stability through shaking table model tests.
To date, although some scholars have investigated the dynamic characteristics of geocell retaining walls, most of these studies are limited to analyses under a single seismic wave pattern. Research on the dynamic response mechanisms under different seismic wave patterns and ground motion parameters is still scarce, particularly regarding the core factor affecting retaining wall stability—the lateral confinement pressure within the geocells—which has rarely been reported. In light of this, a large-scale shaking table model test was conducted to systematically analyze the dynamic response of retaining walls under various seismic wave patterns and ground motion parameters, reveal the variation laws of geocell lateral confinement pressure, and deeply discuss the failure modes of retaining walls. Simultaneously, a numerical model was established using FLAC3D software to verify the experimental results, and the parameters of geocells were analyzed based on the calibrated numerical model. This research can provide a foundation for the seismic design of geocell retaining walls.
2 Shaking table test design
2.1 Shaking table parameters
This test scheme is based on the geocell retaining wall structure developed by Prerana et al. (2025), Sedaght and Ghalandarzadeh (2023) during the Yan’an Airport relocation project. Yan’an Airport is located in the heart of the Loess Plateau, characterized by a thick accumulation of loess layers with a loose and porous structure. It is situated at the intersection of multiple active fault zones, resulting in relatively high seismic intensity and significant risks of geological disasters such as landslides and collapses. The shaking table tests were performed at the Lanzhou Institute of Seismology, China Earthquake Administration, using a shaking table with dimensions of 4 m × 6 m, featuring three directions and six degrees of freedom, as shown in Figure 1. The normal operating frequency range of the shaking table was 0.1–70 Hz. A rigid model box with interior dimensions of 2.8 m × 1.46 m × 1.8 m (length × width × height) was utilized. The side walls on the left and right were made of transparent acrylic, allowing observations of the model’s state changes during vibration. The front and rear walls were composed of steel plates, and a layer of foam board (thickness = 5 cm) was strategically placed at each end of the model box to absorb seismic waves and mitigate the impact of reflected waves. The tested model is geometrically similar to the prototype; thus, material similarity for fillers and reinforcement materials was not considered. This may lead to certain differences in the mechanical performance of the geocell retaining walls compared to the prototype. Nevertheless, this test remains highly valuable for investigating the dynamic response characteristics of geocell retaining walls under seismic conditions.
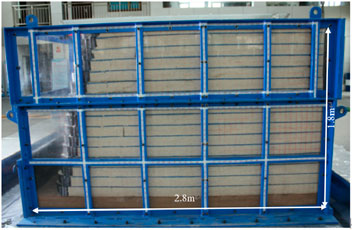
Figure 1. Shaking table and model box (unit:m).
2.2 Material selection
The model materials utilized in this study included loess, quartz sand, geocells, and steel connectors.
2.2.1 Loess Foundation
Natural loess from the Lanzhou area was selected as the foundation material. The initial mechanical properties are summarized in Table 1. To ensure optimal performance, the moisture content was controlled to approximately 6% during preparation. Based on the findings of Song and Tian (2019), loess exhibits relatively high strength when its moisture content is low. In this experiment, the natural moisture content of the loess foundation was measured at 6.6%. After compaction, the loess demonstrated both high strength and excellent bearing capacity. Given that the primary focus of this study is the dynamic characteristics of geocell retaining walls, a separate triaxial shear test for the loess was not conducted.
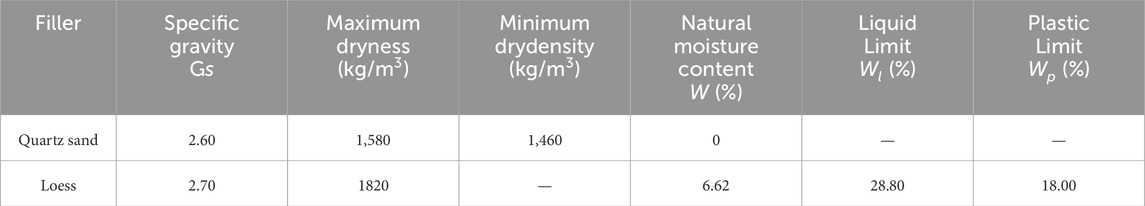
Table 1. Initial material parameters.
2.2.2 Filling Material
Two types of quartz sand with particle sizes ranging from 0.42 mm to 0.85 mm and 0.85mm–2.00 mm were selected and uniformly mixed in a mass ratio of 1:1 for use inside the geocells and on the slope. The initial mechanical parameters are presented in Table 1. Non-drained triaxial shear tests were performed using the TLSY-30 string-controlled triaxial instrument manufactured by Jiangsu Yongchang Science and Education Instrument Manufacturing Co., Ltd. The lateral confinement pressure range was set between 50∼ 400 kPa, as illustrated in Figures 2a,b. The results indicated a cohesive force of 1.96 kPa and an internal friction angle of 38.03°. Additionally, the inclined plate test (Song et al., 2018) revealed an interfacial friction angle of approximately 27.77°, corresponding to a converted interfacial friction coefficient of 0.53. Particle screening tests determined the average particle size of the mixed quartz sand to be d30 = 0.722 mm, d60 = 1.115 mm, and the effective particle size to be d10 = 0.527 mm. The uniformity coefficients Cu and Cc were calculated as 2.12 and 0.89, respectively, as shown in Figure 2c. The well-graded quartz sand ensured uniform distribution of the filler system and stable interface characteristics, thereby enhancing the stability of load transfer between the geocell and the filler and ensuring consistent test data.
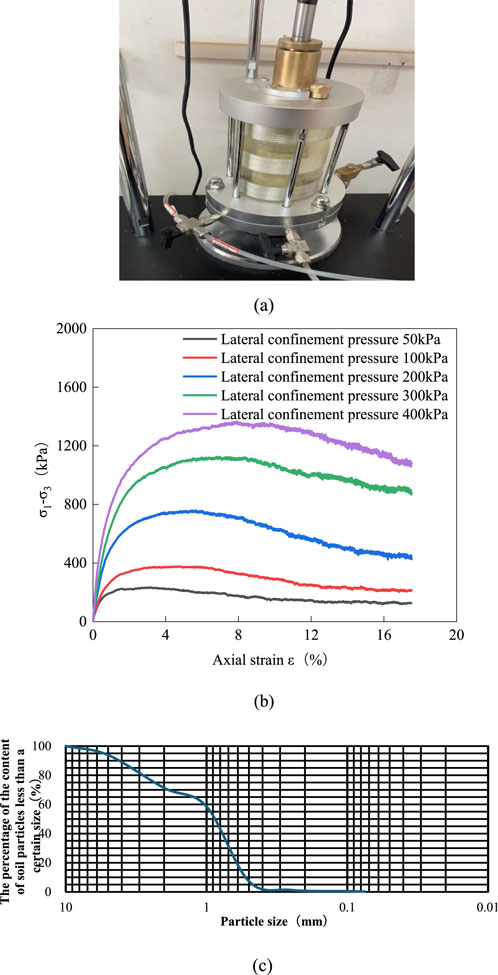
Figure 2. Quartz sand test. (a) Triaxial testing instrument. (b) Curve graph of the relationship between the principal stress difference (σ1-σ3) and the axial strain andepsi;1. (c) Quartz sand grading curve.
2.2.3 Geocell
The geocell utilized in this study has a wall thickness of 1.34 mm, a height of 100 mm, and an equivalent diameter of 283 mm. It is constructed from high-density polyethylene (HDPE) material, with nodes welded using ultrasonic technology. Tensile tests revealed an ultimate strength of 33.2 kN/m for a single strip and an ultimate tensile strength of 35.1 kN/m at the node, as depicted in Figure 3. The geocell’s high strength minimizes plastic deformation under seismic loads and enhances the overall rigidity of the system. Furthermore, the welding strength of the geocell nodes exceeds that of the strip material itself, ensuring the structural integrity and collaborative working performance of the geocell system.
Figure 3. Geocell geotechnical test.
2.2.4 Connectors
The connectors consist of HRB400 steel bars with a diameter of 8 mm and a length of 30 cm. These connectors pass vertically through the mesh holes of adjacent geocell layers, forming a spatial connection system. This design effectively constrains relative displacement between multiple geocell layers and improves the structural system’s resistance to horizontal sliding and overturning moments.
2.3 Model fabrication and measurement point layout
The model comprises two components: the foundation and slope. The foundation, with dimensions of 2.7 m (length)
The test measurements encompass acceleration, geocell strain, slope displacement, and slope top settlement. A total of 19 acceleration monitoring points were arranged in four columns, numbered sequentially as A1 to A19.Strain measuring points were strategically placed on the inner walls of the geocells to obtain the geocell strain. Five settlement monitoring points were placed at the top of the model, with a spacing of 283 mm between adjacent points, as shown in Figure 4a. The noncontact 3D optical measurement system by XTDIC was employed to assess the displacement of the retaining wall, with the measuring points arranged, as shown in Figure 4b.
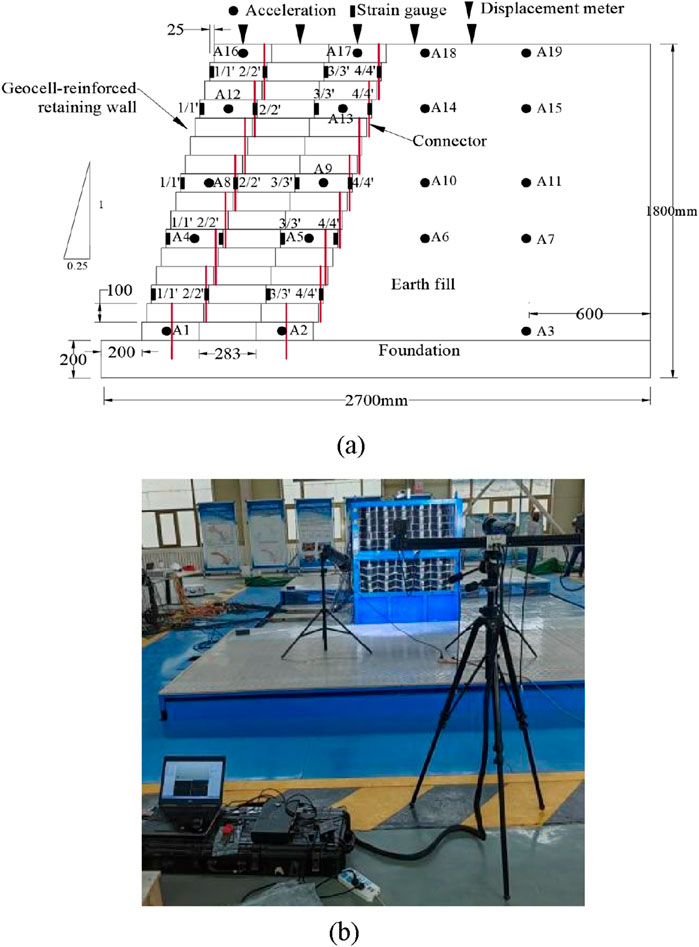
Figure 4. Slope models and measurement point layout. (a) Slope models. (b) Displace ment monitoring point layout.
2.4 Loading scheme
This test utilized three distinct types of load waveforms: EI-Centro, Wolong, and Sin waves. The initial amplitude was set at 0.1 g, and increased in 0.1 g increments, as shown in Table 2. Following the completion of loading for each level of seismic waves, a sinusoidal sweep frequency excitation with an amplitude of 0.05 g, a frequency range spanning from 1 to 50 Hz, and a duration of 235 s was applied. This excitation served to evaluate the dynamic characteristics of the model and partially mitigate the residual deformation induced during the vibration process, as shown in Figure 5. To comply with seismic design specifications (Song et al., 2016), the acceleration amplitude was based on the seismic wave in the X-direction when bidirectional XZ seismic waves were applied, and the amplitude of the seismic wave in the Z-direction was set at 65% of the amplitude of the seismic wave in the X-direction.
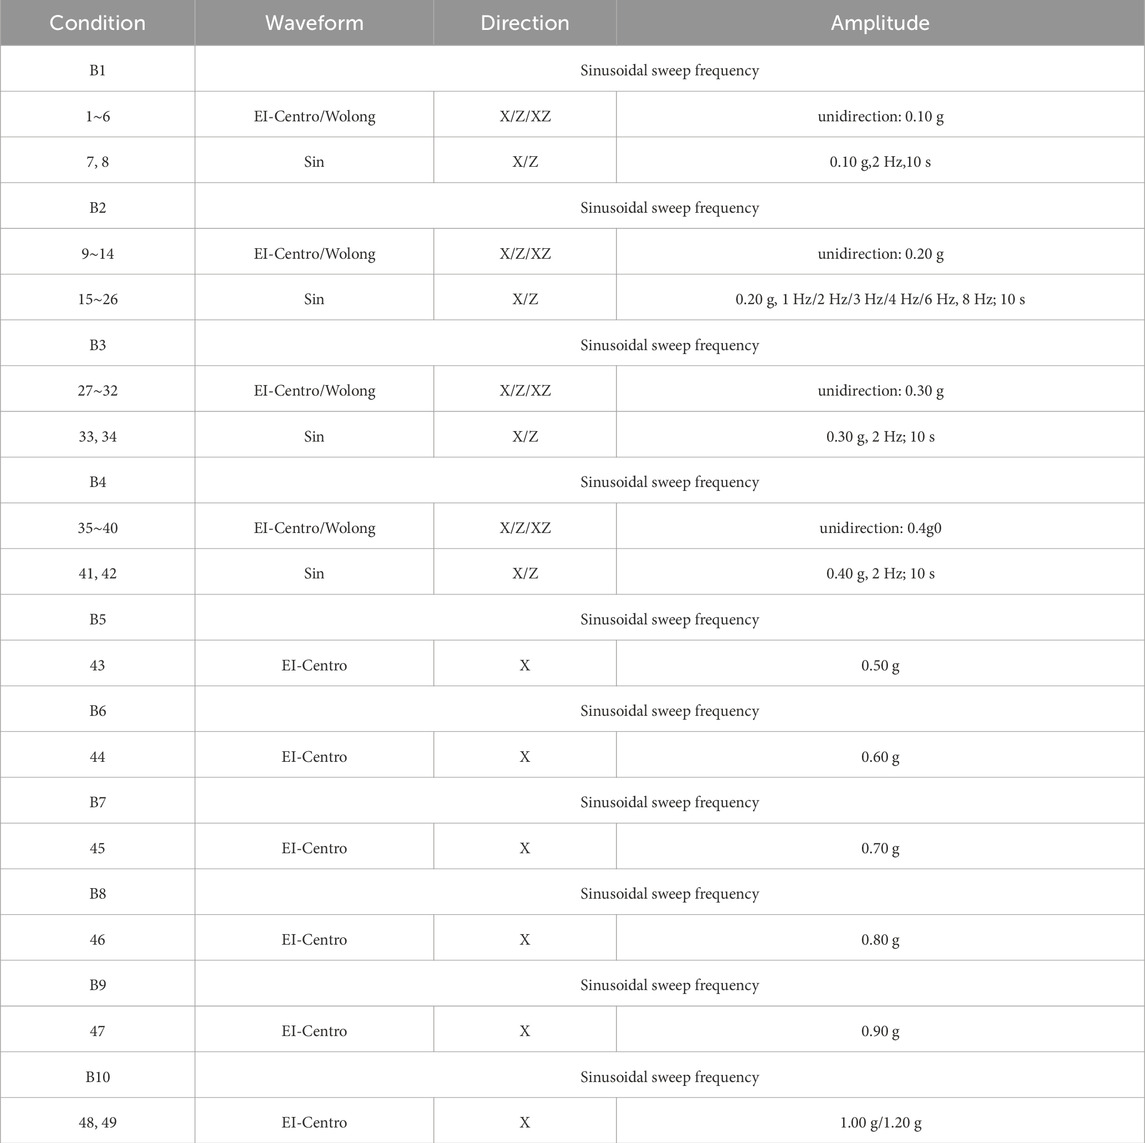
Table 2. Loading scheme design.
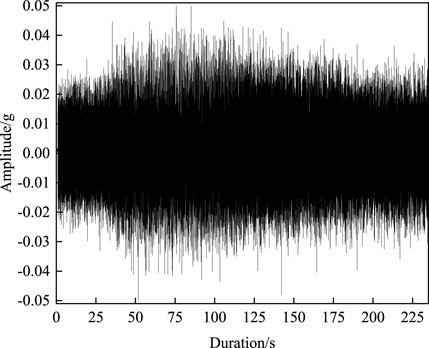
Figure 5. Time history curve of sine sweep.
3 Analysis of test results
The acceleration amplification coefficient was defined as the ratio of the peak acceleration at each measuring point to the peak acceleration at measuring point A1.
3.1 Influence of seismic wave amplitude
To analyze the effects of seismic wave amplitudes on the dynamic response of retaining walls, the EI-Centro wave in the X-direction was used as an example. The study focuses on conditions with amplitudes of 0.1 g, 0.3 g, 0.5 g, 0.7 g, and 1.0 g.
As illustrated in Figure 6, the variation of peak value of horizontal displacement along elevation under different amplitudes. As demonstrated, when the amplitude is less than 0.5 g, the peak value of horizontal displacement changes approximately linearly along the elevation. When the amplitude exceeds 0.7 g, the peak value of horizontal displacement gradually increases with the increase of the amplitude, and the trend of change along the elevation is first increasing and then decreasing, and the maximum value of displacement peak appears at the 15th layer geocell position. Due to the vibration density settlement of the packing inside the geocell under the action of earthquake, lateral expansion deformation occurs, resulting in the geocell stretching and tensile stress. This tensile stress exerts lateral binding force on the packing inside the geocell, that is, the lateral confinement pressure of the geocell effectively limits the lateral movement of the packing, resulting in the increase of the stiffness of the packing, and the upper retaining wall structure is affected by the free surface on both sides. The displacement increases with the increase of the amplitude, which also indicates that the interaction mechanism between the geocell and the filler has an important influence on the seismic performance of the retaining wall structure.
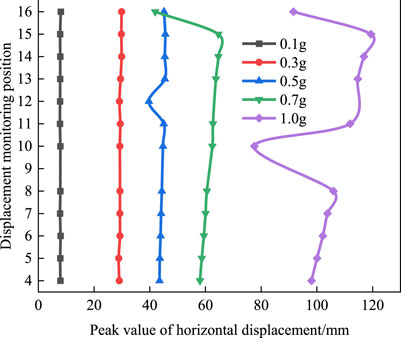
Figure 6. Variation of peak value of horizontal displacement with different amplitudes along elevation.
The lateral confinement pressure of the geocell on the filler can be calculated according to Equations 1–3 (Wang et al., 2024; GB50011-2010, 2010; Rajagopal et al., 1999):
where
As illustrated in Figure 7, the variation of lateral confinement pressure of geocell along elevation under different amplitudes. As demonstrated, when the amplitude is less than 0.3 g, the lateral confinement pressure of the wall and the wall size is similar, and it changes approximately linearly along the elevation. When the amplitude exceeds 0.5 g, the lateral confinement pressure under geocell confinement increases significantly. Because of the significant nonlinear characteristics of quartz sand packing, when the amplitude is small, the interparticle friction makes the particles in a static state, so the lateral confinement pressure under geocell confinement is small. With the increase of the amplitude, the particles overcome the friction between the particles and produce shear slip, and the packing gradually sinks, resulting in greater tensile strain on the cell. In addition, the lateral confinement pressure of the wall compartment is greater than that of the wall physical chamber, and the maximum lateral confinement pressure of the wall compartment appears in the area below 850 mm elevation, while the lateral confinement pressure of the wall physical chamber appears at the top of the wall. Since the wall compartment is at the free surface, its deformation is not restricted and it can be fully developed, resulting in a larger lateral confinement pressure of the wall compartment. The deformation of the wall structure chamber is restricted by the surrounding geocell and the packing material, so the lateral confinement pressure of the cell is small.
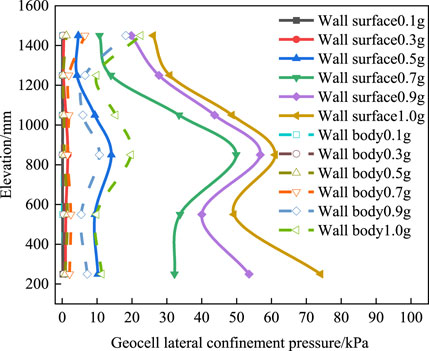
Figure 7. Variation of geocell lateral confinement pressure in different cell amplitudes along.
As illustrated in Figure 8, the variation of the acceleration amplification coefficient along elevation under different amplitudes. As demonstrated,the acceleration amplification factors at both columns of monitoring points exhibit an elevation amplification effect across various amplitudes. Specifically, the acceleration amplification coefficient at the first column of monitoring points demonstrates a three-stage trend of “increase-decrease-increase” along the elevation, whereas the second column shows a two-stage trend of “decrease-increase”. Overall, the acceleration amplification coefficient varies rhythmically with increasing amplitude, generally trending downward. This trend is attributed to the gradual compaction of the filler due to shear slip as seismic conditions accumulate. Once the amplitude reaches a certain threshold, the filler ceases to experience shear slip, predominantly undergoing inter-particle shear friction. Consequently, slope damping and shear modulus increase, leading to heightened seismic energy attenuation and a decreasing trend in the acceleration amplification coefficient.
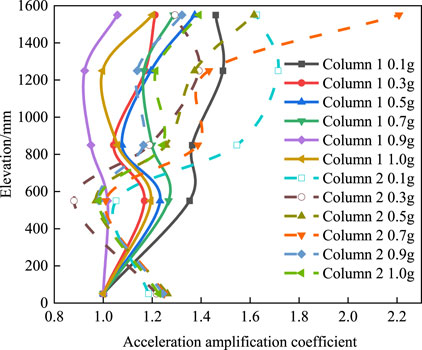
Figure 8. Variation of acceleration amplification coefficients with different amplitudes along elevation.
As illustrated in Figure 9, the horizontal variation pattern of slope top settlement under varying amplitudes. As demonstrated, the slope top settlement initially decreases and then increases horizontally across different amplitudes, with the maximum value occurring at the wall geocell location. Additionally, as the amplitude increases, the slope top settlement gradually augments. The differential settlement value, Δx/H (settlement value/wall height), serves as an indicator of settlement magnitude. Upon completion of vibration at an amplitude of 0.9 g, the maximum settlement reaches 9.5 mm, representing 0.593% of the wall height. This value is significantly lower than the 2% of wall height recommended by the AASHTO (WU, 2019) standard, highlighting the effective settlement suppression capability of the geocell retaining wall.
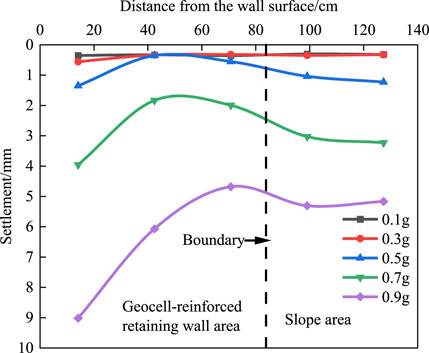
Figure 9. Variation of slope top settlement along horizontal direction with different amplitudes.
In conclusion, when the seismic amplitude exceeds 0.5 g (corresponding to a seismic intensity greater than VI), it becomes necessary to install additional tie bars at positions 3H/16 and 1H/2 to enhance the stability of the retaining wall.
3.2 Influence of seismic wave frequency
3.2.1 The influence of different frequencies on the dynamic response of retaining walls
To analyze the effects of seismic wave frequency on the dynamic response of retaining walls, the Sin wave with an amplitude of 0.2 g in the X-direction was used as an example, with frequencies set at 1 Hz, 2 Hz, 3 Hz, 4 Hz, 6 Hz, and 8 Hz.
As demonstrated in Figure 10a, the variation of the geocell lateral confinement pressure as a function of elevation is contingent upon the frequency of the waves. As demonstrated, for the wall compartment, when the frequency increases from 1 Hz to 4 Hz, the lateral confinement pressure of the compartment is small and changes approximately linearly along the elevation. When the frequency exceeds 4 Hz, the lateral confinement pressure of the compartment gradually increases. When the frequency is 8 Hz, the lateral confinement pressure of the compartment reaches the maximum value, which is 20.71 kPa at the height of 1050 mm. When the frequency is less than 6 Hz, the lateral confinement pressure of the geocell is small; when the frequency is increased to 8 Hz, the lateral confinement pressure of the geocell increases significantly, and the maximum lateral confinement pressure appears at the height of 1250 mm, which is 3.35 kPa. On the whole, in the frequency range of 1∼4 Hz, the lateral confinement pressure of the geocell is small, and when it exceeds 4 Hz, the lateral confinement pressure of the cell gradually increases. Under the action of low frequency earthquake, the intergranular friction resistance is large and it is in a static state, while under the action of high frequency earthquake, the intergranular shear slip is intensified, and the vibration density of the packing is sinking, so the lateral confinement pressure of the geocell increases.
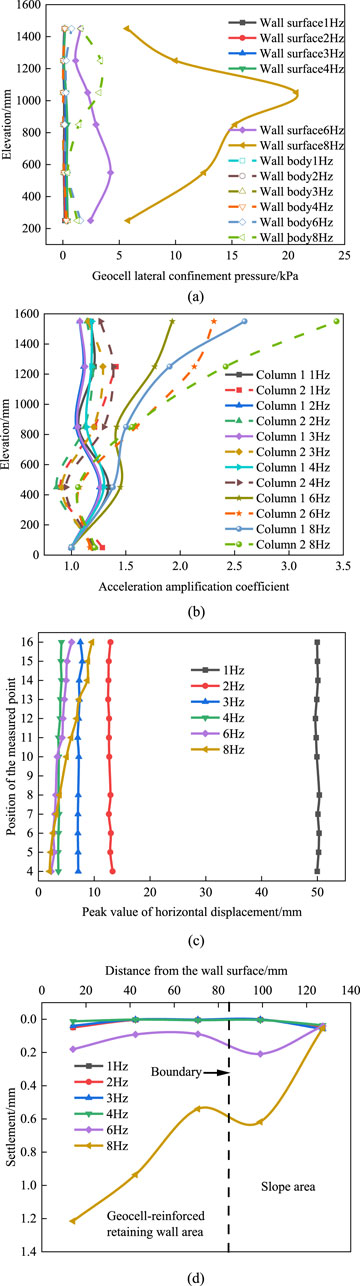
Figure 10. Influence of frequency on dynamic response of geocell retaining wall. (a) Variation of geocell lateral confinement pressure as a function of elevation at different frequencies. (b) Variations of acceleration amplification coefficient as a function of elevation at different frequencies. (c) Variation of the peak value of horizontal displacement as a function of elevation at different frequencies. (d) Horizontal variation of slope top settlement at different frequencies.
As demonstrated in Figure 10b, the variation of the acceleration amplification coefficient along elevation under different frequencies. As demonstrated, within the frequency range of 1 Hz–4 Hz, the acceleration amplification coefficient exhibits no elevation amplification effect. However, when the frequency surpasses 4 Hz, a pronounced elevation amplification effect becomes evident. Overall, under low-frequency seismic conditions, the dynamic response of the retaining wall remains minimal. In contrast, under high-frequency seismic conditions, its dynamic response significantly intensifies. This behavior correlates with the natural frequency of the slope. As seismic waves propagate upward from the slope’s base, the bottom region initially vibrates, leading to a more pronounced dynamic response compared to the upper region. As frequency increases, the density of the filler at the bottom rises, elevating the system’s natural frequency. Additionally, due to the proximity of the upper part of the retaining wall to two free surfaces, namely, the wall and the wall’s top, this region experiences a more significant dynamic response.
As demonstrated in Figure 10c, the variation of peak horizontal displacement along the elevation of the wall surface at various frequencies. As demonstrated, as the frequency rises from 1 Hz to 4 Hz, the peak horizontal displacement of the wall gradually diminishes, exhibiting an approximate linear variation with elevation. At a frequency of 1 Hz, the peak horizontal displacement of the wall reaches its maximum, averaging 50.02 mm. However, when the frequency surpasses 4 Hz, the peak displacement gradually increases. As the frequency increases, the confined pressure within the geocell gradually rises, enhancing the overall stiffness of the retaining wall and significantly improving its structural stability, thereby reducing horizontal displacement. When the frequency increases to a certain level, seismic forces trigger wall movement, leading to a subsequent increase in displacement.
As demonstrated in Figure 10d, the horizontal variation of slope top settlement under different frequencies. As demonstrated, when the frequency increases from 1 Hz to 4 Hz, there is essentially no settlement at the slope top. However, as the frequency rises to 6 Hz, the settlement at the slope top begins to significantly increase, extending from the wall towards the slope. The settlement trend follows a pattern of “decrease-increase-decrease.” At 8 Hz, the settlement reaches its maximum value of 1.22 mm, occurring at the wall surface. This is because the wall geocell directly faces the open face, making the filling within the geocell more susceptible to vibration compaction and shear slip, resulting in significant settlement. Conversely, due to the lateral restraint of the retaining wall, the vibration compaction effect on the slope is weaker, leading to a relatively smaller settlement.
3.2.2 The Influence of frequency on the dynamic response of retaining walls under different amplitudes
To investigate the influence of seismic wave frequencies on the dynamic response of retaining walls under varying amplitudes, a sinusoidal wave with x-direction vibration and a frequency of 2 Hz was selected as an example. Working conditions with amplitudes of 0.1 g, 0.2 g, 0.3 g, and 0.4 g were analyzed.
As demonstrated in Figures 11a–d, the variation patterns of geocell lateral confinement pressure, acceleration amplification factor, horizontal displacement peak and slope roof settlement under different amplitudes. As shown in the figures, the lateral confinement pressure in the compartments increases significantly with the increase in seismic amplitude. This increase is most pronounced at an elevation of 450 mm, where the lateral confinement pressure in the wall compartments consistently exceeds that in other areas. The acceleration amplification coefficient exhibits nonlinear variations along the elevation. It gradually increases as the amplitude rises from 0.1 g to 0.2 g but decreases when the amplitude exceeds 0.2 g. Under each working condition, its distribution along the elevation follows a three-stage variation pattern of “increase - decrease - increase,” with values ranging between 1.0 and 3.7. With increasing amplitude, the peak value of horizontal displacement progressively increases, showing particularly significant growth when the amplitude reaches 0.4 g. Horizontal displacement is approximately linearly distributed along the elevation, with the maximum occurring at the top of the wall. Moving from the wall toward the deeper parts of the slope, the horizontal settlement demonstrates a three-stage characteristic of “decrease - increase - decrease.” The maximum settlement occurs at the position of the wall cell, and within the amplitude range of 0.1 g–0.3 g, the settlement changes relatively gently. However, a notable increase in settlement is observed when the amplitude increases to 0.4 g.
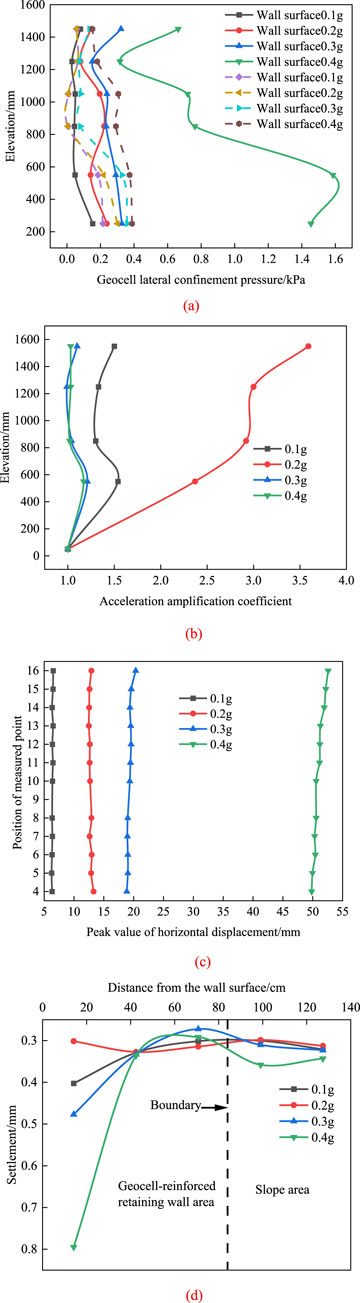
Figure 11. The influence of frequency on the dynamic response of retaining walls under different amplitudes. (a) The lateral confinement pressure of compartments with different amplitudes varies along the elevation. (b) The acceleration amplification coefficients of different amplitudes varies along the elevation. (c) The peak values of horizontal displacements of different amplitudes varies along the elevation. (d) The variation law of settlement at the top of slopes with different amplitudes.
3.3 Influences of seismic wave direction
To analyze the effects of seismic wave direction on the dynamic response of retaining walls, the EI-Centro waves with amplitudes of 0.4 g in the X,Z and XZ directions were used as examples for investigation.
As demonstrated in Figures 12a–d, the variation patterns of geocell lateral confinement pressure, acceleration amplification factor, horizontal displacement peak and slope roof settlement under different directions. As demonstrated, the lateral confinement pressure of the geocell, the acceleration amplification factor and the settlement of the slope top are all larger in the x-direction vibration, while the peak value of the horizontal displacement is larger in the XZ direction vibration. On the whole, among the three vibration directions, the dynamic response of the retaining wall under X and XZ vibration is more significant, and the influence of X vibration is more prominent. Therefore, in the seismic design, we should pay attention to the role of X vibration and take it as the main design basis.
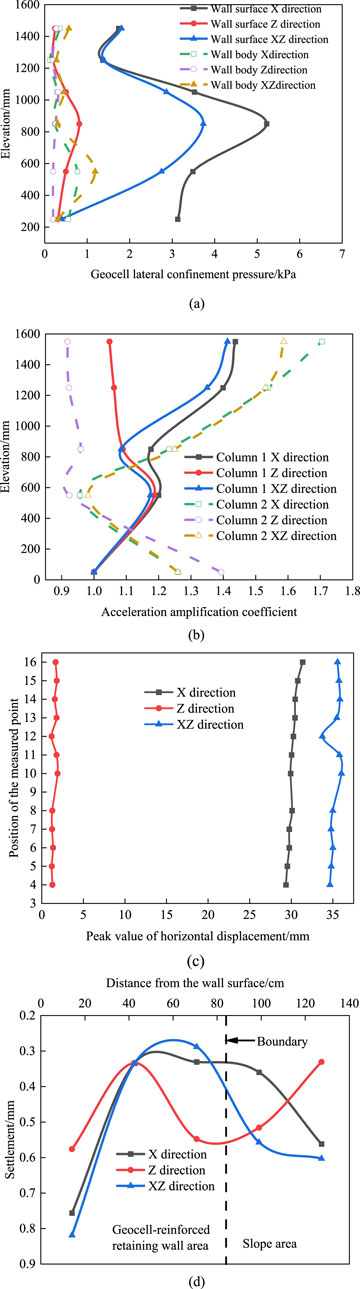
Figure 12. Influence of direction on dynamic response of geocell retaining wall. (a) Variation of geocell lateral confinement pressure of cells as a function of elevation in different directions. (b) Variation of acceleration amplification coefficients as a function of elevation in different directions. (c) Variation of peak values of horizontal displacements as a function of elevation in different directions. (d) Settlement of the descending slope in different directions varies horizontally.
3.4 Influences of seismic wave types
To analyze the effects of seismic wave types on the dynamic responses of retaining walls, the unidirectional EI-Centro, Wolong, and Sin waves were used as examples for investigation with amplitudes equal to 0.4 g in the X-direction.
As demonstrated in Figures 13a–d, the variation of geocell lateral confinement pressure, acceleration amplification factor, peak of horizontal displacement and settlement of slope top under different wave patterns. As demonstrated, geocell lateral confinement pressure, acceleration amplification factor and slope top settlement all exhibit significant dynamic response of the retaining wall under the action of natural seismic waves. This is due to the complex composition of natural seismic waves, including multiple frequency and amplitude components and wide frequency band, which have large energy and will induce complex dynamic response when interacting with the structure. However, the frequency and amplitude of the sine wave are relatively fixed, and the interaction process with the structure is relatively simple, resulting in a small dynamic response of the retaining wall. However, the peak of horizontal displacement is larger under the action of sine wave, because the retaining wall is easy to resonate with the specific frequency of sine wave, resulting in a larger displacement response.
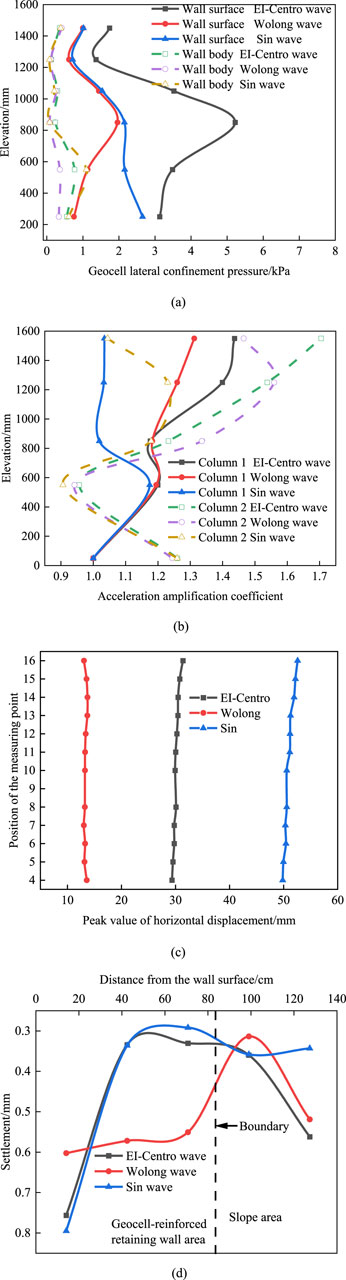
Figure 13. Influence of waveform on dynamic response of geocell retaining wall. (a) Variation of geocell lateral confinement pressure s as a function of elevation for different waveforms. (b) Variation of acceleration amplification coefficients as a function of elevation for different waveforms. (c) Variation of peak displacements as a function of elevation for different waveforms. (d) Horizontal variations of slope top settlements for different waveforms.
In summary, the dynamic response of the geocell retaining wall is more significant under the action of natural seismic waves, which is mainly due to the characteristics of wide spectrum and uneven energy distribution of natural seismic waves, and its influence on the dynamic response of the structure is more complex and significant. Therefore, the effect of natural seismic waves should be considered in seismic design.
3.5 Analysis of retaining wall failure patterns
3.5.1 Permanent horizontal displacement analysis
As demonstrated in Figure 14, the distribution pattern of permanent horizontal displacement along the wall height. As observed from the figure, an increase in the amplitude of seismic waves corresponds to an increase in permanent horizontal displacement. Based on the statistical analysis by Bathurst and Karpurapu (1993) regarding the displacement index (horizontal displacement/retaining wall height) for various types of retaining walls, at the conclusion of the 1.0 g amplitude test, the permanent horizontal displacement of Model 1 was measured at 31.58 mm, accounting for 1.97% of the wall height. This value is below the 2% threshold specified in the AASHTO standard (Madhavi et al., 2008), indicating that the structure does not meet the failure criterion.
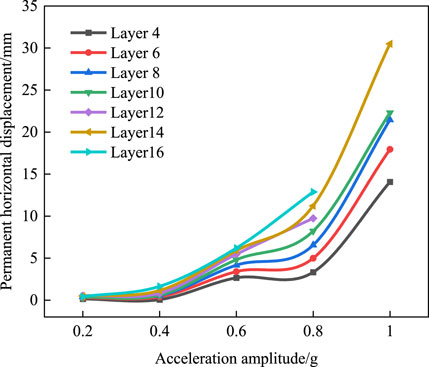
Figure 14. The variation law of permanent horizontal displacement along elevation.
3.5.2 Analysis of the failure mode of the retaining wall
The failure mode of the retaining wall can be divided into three progressive development stages:
Stage 1: Vibration compaction stage. When the seismic wave amplitude increases from 0.1 g to 0.5 g, the fill in the slope body and the interior of the lattice is mainly vibratory compaction, and the whole retaining wall does not have significant deformation and damage, only the colored sand on the upper part of the retaining wall has a slight staggered phenomenon, as shown in Figure 15a.
Stage 2: Deformation intensification stage. When the seismic amplitude increases to 0.8 g, the deformation of the retaining wall shows an aggravating trend. The dislocation range of the upper colored sand extends downward to the middle area of the retaining wall, forming a second dislocation zone in the middle of the slope. At the same time, the boundary between the wall and the slope began to settle slightly. Despite the increased deformation, the structural integrity of the wall remains in good condition with no obvious signs of damage, and the retaining wall as a whole still maintains a stable state, as shown in Figure 15b.
Stage 3: Convex slip stage. When the seismic wave amplitude reaches 1.2 g, sand leakage occurs in the middle and upper part of the retaining wall, and the sand body scatters to the front loess foundation. At the same time, convex deformation occurs in the middle of the retaining wall, the dislocation phenomenon between the slope and the filler colored sand continues to extend downward, and the inclined upward glide surface appears in the lower part of the slope, and the settlement of the upper part of the retaining wall is intensified, showing a “human” type change along the horizontal direction, as shown in Figure 15c.
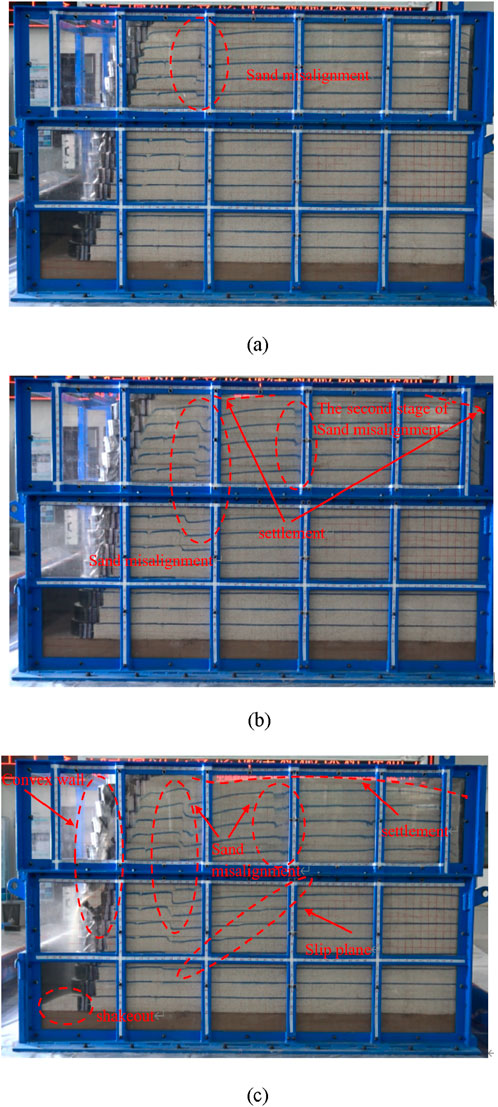
Figure 15. Photographs showing failure of geocell retaining wall. (a) Stage 1. (b) Stage 2. (c) Stage 3.
Overall, in the process of vibration, the retaining wall is in a stable state as a whole, and there is no collapse, collapse and other phenomena, so as to win more rescue time for earthquake relief.
4 Numerical simulation analysis
Owing to the inherent limitations of conditions and scale in model tests, a numerical modeling software program was employed to construct a numerical model. The model’s validity was initially established by referencing the outcomes of shaking table tests. Subsequently, a sensitivity analysis of aspect ratio and height-width ratio was performed using the calibrated numerical model. The objective of this approach was to furnish substantial support for the optimization design and practical application of the model.
4.1 Establishment of the numerical model
A numerical model was developed using the FLAC3D.6.0 software program, with its dimensions shown in Figure 16. The slope ratio was 1:0.25. Contact surfaces were established between the fillers, which obey the Mohr–Coulomb criterion. In accordance with the findings of preceding studies (Krishnaraj et al., 2023; Li S. H. et al., 2021), an elastoplastic constitutive relationship was adopted for the geocell, gravel, and sand. The yield criterion employed was the Mohr–Coulomb criterion, a suitable model for describing the mechanical behavior of geotechnical materials. The numerical model employs a viscous boundary condition at the bottom and free-field boundaries surrounding it. Local damping was selected, with a damping coefficient of 0.158. The seismic input consisted of the EI-Centro wave with a peak acceleration of 0.4 g, applied in the X direction.
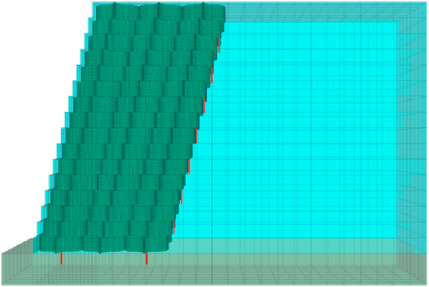
Figure 16. Numerical model (unit:mm).
4.2 Verification of the numerical model
To verify the accuracy of the numerical simulation, a numerical model with the same size as the shaking table model test was established. Parameter Settings, test conditions, test elements, monitoring point layout, monitoring indicators and seismic wave selection in the numerical model were all set according to the shaking table test conditions, as shown in Figure 17. The numerical simulation results are similar to the shaking table test results and their variation rules, which shows that the numerical simulation results are accurate and reliable.
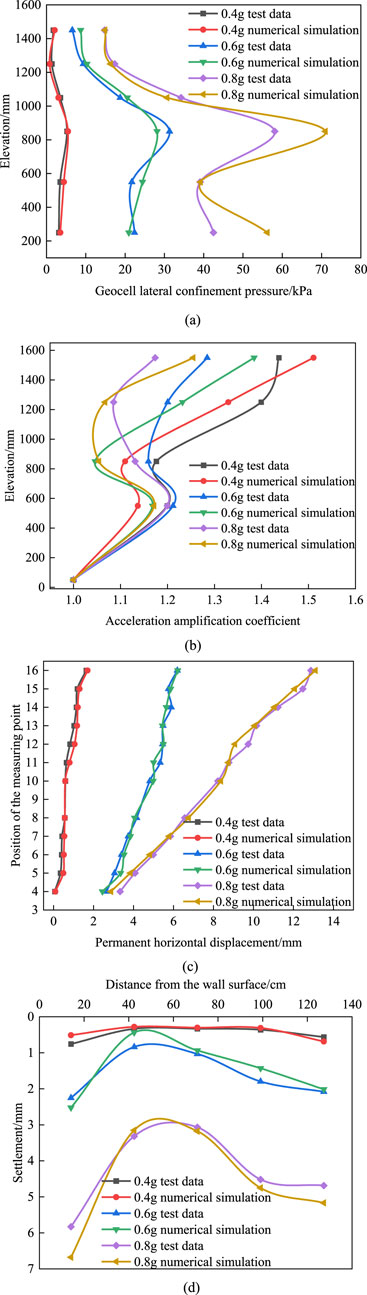
Figure 17. Numerical simulation verification. (a) Verification of the geocell lateral confinement pressure. (b) Verification of the acceleration amplification coefficient. (c) Verification of permanent horizontal displacement. (d) Settlement verification.
4.3 Influence of slope ratio
According to the provisions in the existing norms (Steudle, 2014), the slope ratio of the retaining wall is generally 1:0.25 ∼ 1:0.75, and the slope ratio of 1:0.2, 1:0.3, 1:0.4, 1:0.5 and 1:0.6 is selected for research.
As demonstrated in Figures 18a–d, the variation of geocell lateral confinement pressure, permanent horizontal displacement, acceleration amplification factor and slope top settlement under different slope ratios. As demonstrated, with the decrease of the slope ratio, the above four indexes gradually decrease, and the stability of the retaining wall is significantly improved, which is because the center of gravity of the wall moves down with the decrease of the slope ratio, and the anti-overturning ability is enhanced. At the same time, the stress distribution in the interior of the geogrid is more uniform, reducing the phenomenon of stress concentration, so as to absorb and disperse seismic energy more effectively, reduce the impact on the wall, and improve the seismic performance. In addition, when the slope ratio decreases from 1:0.2 to 1:0.3, the dynamic response increases significantly, while when the slope ratio exceeds 1:0.3, the increase is relatively gentle. This is because when the retaining wall is steeper, the wall stiffness is larger, the natural vibration frequency is higher, and it is easy to resonate with the seismic wave frequency. At the same time, the contact area between the filler and the geocell is small, and the friction is limited, resulting in a significant increase in dynamic response. The easy-going slope ratio decreases, the wall stiffness decreases, the natural vibration frequency decreases, the resonance effect weakens, the contact area between the packing and the geocell increases, the friction is enhanced, and the interaction is more stable, thus inhibiting the increase of the dynamic response.
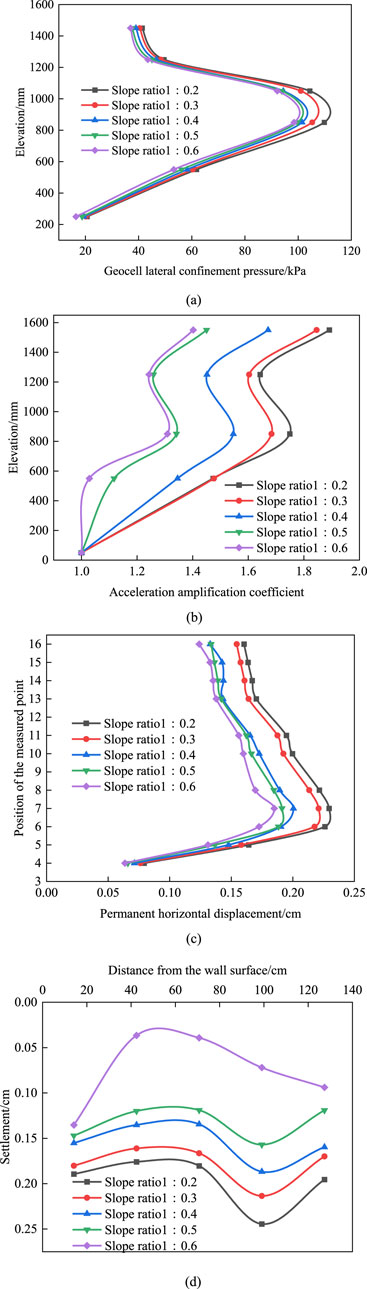
Figure 18. Influence of slope ratio on dynamic response of retaining wall. (a) Variation of geocell lateral confinement pressure as a function of elevation. (b) Variation of acceleration amplification coefficients as a function of elevation. (c) Variations of the Permanent horizontal displacement as a function of elevation. (d) Horizontal variation of slope top settlements.
In summary, the downslope ratio of seismic action has a significant effect on the stability of the slope. With the decrease of slope ratio, the stability of slope is improved significantly, and the seismic resistance is enhanced. However, too small slope ratio will lead to the increase of retaining wall area, resulting in waste of resources. Therefore, considering the economy and seismic performance, it is suggested that the slope ratio of retaining wall should be prefered to be about 1:0.3 to meet the seismic demand while saving resources.
4.4 Influence of retaining wall height to width ratio
To analyze the influence of the height to width ratio of retaining wall (retaining wall height H/retaining wall thickness B), the retaining wall height remained unchanged, and the retaining wall thickness was studied with 1, 2, 3, 4 and 5 geocell thickness.
As demonstrated in Figures 19a–d, the variation laws of geocell lateral confinement pressure, permanent horizontal displacement, acceleration amplification factor and hilltop settlement under different aspect ratios. As can be seen from the figure, with the decrease of the aspect ratio, the above four indicators are gradually reduced, and the stability of the retaining wall is improved. This is because the overall stiffness of the retaining wall is significantly increased with the decrease of the aspect ratio, and it can better resist the deformation and displacement under the action of earthquake. At the same time, the anti-overturning moment and shear section area of the wall increase, which can more effectively resist the overturning force and shear force generated by the earthquake, thus improving the anti-overturning and shear stability of the wall, so the stability is enhanced. In addition, when the ratio of height to width is large, the deflection of the retaining wall itself is large, and the wall appears as a convex parabola shape. The maximum value of permanent horizontal displacement and lateral confinement pressure of the geocell appears at about H/3 away from the bottom of the wall, which is because the position of the resultant point of earth pressure is about H/3 away from the bottom of the wall, and the bottom of the retaining wall is constrained by the foundation friction force. Therefore, under the combined action of earth pressure and bottom friction, the wall forms a convex parabola form. With the increase of the thickness of the retaining wall, the weight and flexural stiffness of the retaining wall also increase, and the deformation of the wall changes. When the height to width ratio is 1.4, the wall body almost shifts, which is because with the increase of the width of the retaining wall, its deformation characteristics gradually approach from the characteristics of the flexible retaining wall to the characteristics of the rigid retaining wall, so its bending deformation decreases.
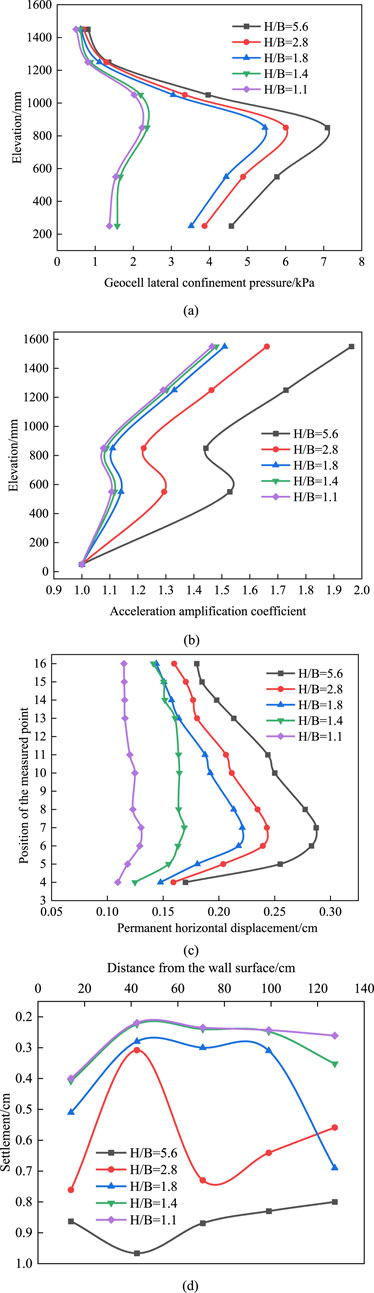
Figure 19. Influence of height-width ratio on dynamic response of retaining wall. (a) Variation of geocell lateral confinement pressure as a function of elevation. (b) Variation of acceleration amplification coefficients as a function of elevation. (c) Variations of the Permanent horizontal displacement as a function of elevation. (d) Horizontal variation of slope top settlements.
In conclusion, the aspect ratio is closely related to the stability of slope under earthquake action. As the aspect ratio decreases, the seismic performance increases. It should be pointed out that although blindly increasing the thickness of the retaining wall can improve the stability, it has limited effect on deformation control, and will significantly increase the project cost and reduce the construction efficiency. Therefore, on the premise of meeting the requirements of seismic fortification, it is recommended that the aspect ratio should be preferred at about 1.8 to achieve the balance between economy and seismic performance.
5 Conclusion
This study systematically investigates the dynamic response characteristics and failure mechanisms of geocell-reinforced retaining walls under seismic loads through large-scale shaking table model tests. The research findings can provide valuable references for the seismic design and optimization of structures in the Loess Plateau region. The main conclusions are summarized as follows:
(1) With the increase of seismic wave amplitude, the lateral confinement pressure of the geocell, the peak of horizontal displacement and the settlement of the slope top all increase gradually, and the acceleration amplification coefficient shows an amplification effect along the elevation. When the frequency is less than 4 Hz, the geocell lateral confinement pressure, acceleration amplification factor and slope settlement are small, and the displacement decreases with the increase of frequency. When the frequency is greater than 4 Hz, the four seismic indexes are gradually increased. In addition, the dynamic response of the model is significant in the x-direction vibration. The natural wave has great influence on the model. The influence of holding time is less.
(2) Geocell retaining wall has good settlement inhibition ability. The amplitude of 0.9 g vibration ends, and the non-uniform settlement value is 0.593%, which is far less than the 2% wall height recommended by AASHTO specification (WU, 2019). When the amplitude is greater than 0.5 g (that is, the seismic intensity is greater than VI degree), it is necessary to add reinforcement belts at the positions of 3H/16 and 8H/16 to improve the stability of the retaining wall.
(3) Under the action of earthquake, the failure process of geocentric retaining wall can be divided into three stages: vibration compaction stage (0.1g∼0.5 g), deformation intensification stage (0.6g∼0.8 g), convex sliding stage (0.9g∼1.2 g). The whole vibration ended, the wall did not occur large-scale collapse, collapse and other phenomena, with good seismic performance.
(4) Under earthquake action, the stability of retaining wall is significantly improved with the decrease of slope ratio and aspect ratio. In the seismic design, the slope ratio and the aspect ratio of the retaining wall are set to 1:0.3 and 1.8 respectively, so as to meet the seismic demand while saving resources.
6 Discussion
Although some scholars have conducted research on the dynamic behavior of geocell-reinforced retaining walls, existing studies have primarily focused on dynamic response analysis under single seismic waveforms. There remains a notable lack of systematic investigations into the dynamic response mechanisms of retaining walls under varying seismic waveforms and combinations of ground motion parameters. In particular, the influence of geocell-confined lateral pressure—a critical factor governing wall stability—has yet to be thoroughly examined.This study systematically analyzes the effects of seismic parameters on the dynamic response of geocell-reinforced retaining walls and elucidates their failure modes. However, due to limitations in the shaking table test conditions, further research is required to advance the following aspects:
(1) Comparative studies on geocell-reinforced retaining walls with different cross-sectional configurations to establish optimized design schemes applicable to seismic fortification zones of varying intensities;
(2) Indepth exploration of the interaction mechanisms between seismic wave parameters (amplitude, frequency, waveform) and factors such as wave incidence direction and site geological conditions, aiming to refine the seismic design theory for geocell-reinforced retaining walls.
Data availability statement
The raw data supporting the conclusions of this article will be made available by the authors, without undue reservation.
Author contributions
FJ: Methodology, Data curation, Supervision, Software, Visualization, Writing – review and editing, Writing – original draft, Investigation.
Funding
The author(s) declare that no financial support was received for the research and/or publication of this article.
Conflict of interest
The author declares that the research was conducted in the absence of any commercial or financial relationships that could be construed as a potential conflict of interest.
Generative AI statement
The author(s) declare that no Generative AI was used in the creation of this manuscript.
Publisher’s note
All claims expressed in this article are solely those of the authors and do not necessarily represent those of their affiliated organizations, or those of the publisher, the editors and the reviewers. Any product that may be evaluated in this article, or claim that may be made by its manufacturer, is not guaranteed or endorsed by the publisher.
References
Anindya, P., Deepankar, C., and Bhattacharyya, S. K. (2017). Effect of dynamic soil properties and frequency content of harmonic excitation on the internal stability of reinforced soil retaining structure. Geotext. Geomembranes 45, 471–486. doi:10.1016/j.geotexmem.2017.07.003
Ari, A., and Misir, G. (2021). Three-dimensional numerical analysis of geocell reinforced shell foundations. Geotext. Geomembranes 49, 963–975. doi:10.1016/J.GEOTEXMEM.2021.01.006
Bathurst, R. J., and Karpurapu, R. (1993). Large-scale triaxial compression testing of geocell-reinforced granular soils. Geotechnical Test. J. 16, 296–303. doi:10.1520/GTJ10050J
Chen, R. H., Wu, C. P., Huang, F. C., and Shen, C. W. (2013). Numerical analysis of geocell-reinforced retaining structures. Geotext. Geomembranes 39, 51–62. doi:10.1016/j.geotexmem.2013.07.003
GB50011-2010 (2010). “Code for seismic design of buildings [S],”. Beijing: China Building and Construction Press. doi:10.13924/j.cnki.cecs.2010.09.004
Khorsandi, N., and Ghazavi, M. (2021). Static stability analysis of geocell-reinforced slopes. Geotext. Geomembranes 49, 852–863. doi:10.1016/J.GEOTEXMEM.2020.12.012
Komak, P. A., Yazdi, M., and Ghalandarzadeh, A. (2015). Shaking table tests on soil retaining walls reinforced by polymeric strips. Geotext. Geomembranes 43, 148–161. doi:10.1016/j.geotexmem.2015.01.001
Krishnaraj, P., Manju, G. S., and Latha, G. M. (2023). Physical and numerical shaking table studies on geocell-reinforced retaining walls. Int. J. Geosynth. Ground Eng. 9, 62–21. doi:10.1007/S40891-023-00482-7
Leshchinsky, D., Ling, H. I., Wang, J. P., Arik, R., and Yoshiyuki, M. (2008). Equivalent seismic coefficient in geocell retention systems. Geotext. Geomembranes 27, 9–18. doi:10.1016/j.geotexmem.2008.03.001
Li, H., Yang, X. H., Zeng, H., and Zhao, X. (2021). Shear plane characteristics of geocell-reinforced fine sand through direct shear test. Arabian J. Geosciences 14, 2226–11. doi:10.1007/S12517-021-08604-Z
Li, S. H., Cai, X. G., Jing, L. P., Xu, H. L., Huang, X., and Zhu, C. (2021). Lateral displacement control of modular-block reinforced soil retaining walls under horizontal seismic loading. Soil Dyn. Earthq. Eng. 141, 106485. doi:10.1016/J.SOILDYN.2020.106485
Liu, H., Yang, G., and Ling, I. H. (2014). Seismic response of multi-tiered reinforced soil retaining walls. Soil Dyn. Earthq. Eng. 43, 1–12. doi:10.1016/j.soildyn.2014.01.012
Liu, Y., Deng, A., and Jaksa, M. (2019). Failure mechanisms of geocell walls and junctions. Geotext. Geomembranes 47, 104–120. doi:10.1016/j.geotexmem.2018.11.003
Madhavi, L. G., Dash, S. K., and Rajagopal, K. (2008). Equivalent continuum simulations of geocell reinforced sand beds supporting strip footings. Geotechnical Geol. Eng. 26, 387–398. doi:10.1007/s10706-008-9176-5
Madhavi, L. G., and Manju, G. S. (2016). Seismic response of geocell retaining walls through shaking table tests. Int. J. Geosynth. Ground Eng. 2, 1–15. doi:10.1007/s40891-016-0048-4
Madhavi, L. G., and Manju, G. S. (2018). Effect of Facing Slope on the seismic response of geocell walls. Geotech. Eng. 49, 73–83.
Onyekwena, C. C., Li, Q., Alvi, I. H., Ghaffar, A., and Zhang, X. W. (2024). Geomechanical performances of geocell reinforced retaining wall backfilled with magnesia-based cement stabilized marine fill. Mar. Georesources Geotechnol. 42, 617–633. doi:10.1080/1064119X.2023.2211060
Prerana, K., and Latha, G. M. (2025). Quantitative benefits of geocells in controlling liquefaction in sands. Soil Dyn. Earthq. Eng. 188, 109098. doi:10.1016/J.SOILDYN.2024.109098
Rajagopal, K., Krishnaswamy, N. R., and Madhavi, L. G. (1999). Behaviour of sand confined with single and multiple geocells. Geotext. Geomembranes 17, 171–184. doi:10.1016/S0266-1144(98)00034-X
Sedaght, A., and Ghalandarzadeh, A. (2023). Shaking table tests on geocell reinforced model walls. Found. Retaining Struct. Geosynth. 52, 309–318. doi:10.5030/jcigsjournal.20.39
Song, F., Liu, H. B., and Ma, L. Q. (2016). Engineering application of a new type geocell retaining wall with variable cross-section. Int. J. Earth Sci. Eng. 9, 1602–1606.
Song, F., Liu, H. B., Hu, H. B., and Xie, Y. L. (2018). Centrifuge tests of geocell-reinforced retaining walls at limit equilibrium. J. Geotechnical Geoenvironmental Eng. 144, 04018005. doi:10.1061/(ASCE)GT.1943-5606.0001849
Song, F., Liu, H. B., Yang, B., and Zhao, J. (2019). Large-scale triaxial compression tests of geocell-reinforced sand. Geosynth. Int. 26, 388–395. doi:10.1680/jgein.19.00019
Song, F., and Tian, Y. H. (2019). Three-dimensional numerical modelling of geocell reinforced soils and its practical application. Geomechanics Eng. 17, 1–9. doi:10.12989/gae.2019.17.1.001
Steudle, K. T. (2014). AASHTO LRFD bridge design specifications:LRFDUS⁃7⁃2014[S]. Washington,DC: American Association of State Highway and Transportation Officials.
Sukrit, S., and Amit, P. (2023). Seismic coefffcients for pseudo-static analysis of wrap-faced GRS walls with nonlinear soil fflls. Soil Dyn. Earthq. Eng. 23, 1–13. doi:10.1016/j.soildyn.2023.107960
Tavakoli, M., and Motarjemi, F. (2018). Interfacial properties of geocell-reinforced granular soils. Geotext. Geomembranes 46, 384–395. doi:10.1016/j.geotexmem.2018.03.002
Wang, Y. Q., Chen, Y. Q., He, Y. S., and Li, C. (2024). Experimental study of loess mechanical properties with different water content. J. Civ. Eng. 28, 2210–2220. doi:10.1007/S12205-024-1381-0
Wu, J. T. H. (2019). Geosynthetic reinforced soil (GRS) walls [M]. John Wiley and Sons, Inc. doi:10.1002/9781119375876
Keywords: geocell retaining wall, shaking table, ground motion parameters, numerical simulation, dynamic response, failure mode
Citation: Jin F (2025) Large-scale shaking table test and numerical analysis of seismic performance of geocell retaining wall. Front. Earth Sci. 13:1607359. doi: 10.3389/feart.2025.1607359
Received: 07 April 2025; Accepted: 16 June 2025;
Published: 17 July 2025.
Edited by:
Binbin Yang, Xuchang University, ChinaReviewed by:
Junlong Sun, Kunming University of Science and Technology, ChinaLei Xu, Southeast University, China
Copyright © 2025 Jin. This is an open-access article distributed under the terms of the Creative Commons Attribution License (CC BY). The use, distribution or reproduction in other forums is permitted, provided the original author(s) and the copyright owner(s) are credited and that the original publication in this journal is cited, in accordance with accepted academic practice. No use, distribution or reproduction is permitted which does not comply with these terms.
*Correspondence: Feifei Jin, MTI3NTg4MTc1MEBxcS5jb20=