 Maria S. Dunin-Borkowski1*
 Marina Farías de Reyes2
 Fausto W. Asencio3
 Jorge Demetrio Reyes-Salazar2
 Pablo Ochoa-Cueva4
- 1Faculty of Engineering, Universidad Tecnológica del Perú, Lima, Peru
- 2Department of Civil Engineering, Universidad de Piura, Piura, Peru
- 3Posgraduate School, Universidad Nacional de Piura, Campus Universitario s/n. Urb, Miraflores/Piura, Peru
- 4Department of Biological and Agricultural Sciences, Universidad Técnica Particular de Loja, Campus San Cayetano Alto, Loja, Ecuador
The Poechos Reservoir, which began operations in 1976 with an initial water storage capacity of 885 hm3, has undergone severe sedimentation. By 2018, bathymetric surveys from the Chira–Piura Special Project (PEChP), the institution responsible for its operation and maintenance, reported an accumulated volume of 520 hm3, representing a 58.8% loss in storage. This situation raises concerns about long-term water security and sediment source dynamics. The present study aims to quantify the total mass and annual origin of sediment inflows to the reservoir. The study analyzed the Transboundary Catamayo–Chira Basin for the period 2001–2017, selected according to data availability: MODIS vegetation cover mosaics (available since February 2000), PISCOp precipitation datasets from SENAMHI (available until mid-2018), and annual reservoir bathymetries from PEChP (available until 2018). Sediment supply was estimated using the sediment delivery ratio (SDR) model implemented in the Integrated Valuation of Ecosystem Services and Tradeoffs (InVEST 3.13.0) software and validated against bathymetric measurements. Results show that the basin supplies an annual median of 6.91 × 10⁶ t yr−1, a value consistent with 6.53 × 10⁶ t yr−1, derived from bathymetric data for the same period. Eastern sub-basins dominated contributions, with Macará (2.34 × 10⁶ t yr−1), Quiroz (1.98 × 10⁶ t yr⁻¹), and Catamayo (1.50 × 10⁶ t yr−1) accounting for 84.3% of the load, while Alamor and La Solana contributed only 0.65 and 0.18 × 10⁶ t yr−1, respectively. However, the 2017 El Niño–Southern Oscillation (ENSO) event altered this pattern: basin-wide supply surged to 34.92 × 10⁶ t, with western sub-basins contributing more than half of the total, including a 57-fold increase from La Solana. These findings demonstrate that sediment supply is strongly controlled by climatic variability, with ENSO events shifting the spatial dominance of sediment sources. The predominance of eastern sub-basins under normal conditions contrasts with the episodic but extreme contributions from western sub-basins during El Niño. This highlights the need for adaptive management strategies that combine vegetation cover restoration with basin-wide monitoring, especially in semi-arid Andean systems where reservoir capacity is critical for water security.
Introduction
Soil is a nonrenewable resource that supports a large portion of the planet’s biodiversity and numerous anthropogenic activities. Understanding its current condition is essential for reducing erosion and sediment supply (SSup), particularly in areas affected by intense rainfall (Bruinsma, 2017). In semi-arid Andean basins, where tropical dry forests, pastures, and agriculture are predominant, precipitation is the main source of water (Ochoa et al., 2016). However, it is also one of the most critical factors contributing to erosion and sediment transport (Arteaga et al., 2022).
According to Madadi (2022), regional factors such as climate, geomorphology, and hydrological dynamics influence both the rate of sediment transport within a basin and the pattern of sediment accumulation in downstream reservoirs. Sumi and Hirose (2009) further indicated that sedimentation can significantly reduce the river flow and the storage capacity or useful life of a reservoir, leading to severe challenges regarding water supply, flood control, hydropower generation, and basin ecology. Madadi (2022) estimated that the average annual loss of reservoir storage capacity is approximately 1%, with the national averages ranging from 0.1% in the United Kingdom to 2.3% in China.
Rahmani et al. (2018) used bathymetric studies and found that 24 reservoirs located in the tributary basins of the Mississippi River in Kansas (United States), with an average age of 52 years, had lost approximately 17% of their original capacity due to sedimentation since 2006. They estimated the annual capacity losses ranging from 0.02% to 0.84%, with higher sedimentation rates typically observed in smaller reservoirs. Sediment supply (SSup) from these tributary basins ranged from 7 to 1,688 m3 km-2·yr-1, which are considered acceptable values when compared to the tolerable soil rates of 600 t km-2·yr-1, and the soil formation rates were between 1,000 and 1,400 t km-2· yr-1, as indicated by Gashaw et al. (2021).
In South America, particularly in the northern Andes of Peru and southern Ecuador, SSup shows high spatial and temporal variability. Vanacker et al. (2007) and Molina et al. (2008) reported sediment yields ranging from 26 to 15,100 t km-2 yr-1 in the Paute River Basin (Ecuador). Similarly, Rosas et al. (2020) and Rosas et al. (2023) analyzed 3 decades of data from basins between 3° S and 5° S in Peru and found variations ranging from 12 to 2,330 t km-2 yr-1.
Barboza Castillo (2022) stated that the Poechos Reservoir basin, located in northern Peru and southern Ecuador, is one of the most affected areas in South America by land-use and land-cover (LULC) changes, mainly due to deforestation and agricultural expansion. In addition, Farías de Reyes et al. (2024) and Richter and Ise (2005) indicated that this region is subject to significant temporal and spatial variability in precipitation. On the other hand, Obialor et al. (2019) emphasized that effective reservoir management requires the integrated application of various available methods, ranging from soil conservation measures in contributing sub-basins to mechanical sediment removal within these reservoirs. However, in the case of Poechos Reservoir, although annual bathymetric surveys have been carried out since 1997, the specific areas within the basin that supply the highest sediment loads are unknown.
Additionally, Bjerknes (1969) stated that the climate along the coasts of Ecuador and Peru is strongly influenced by the El Niño–Southern Oscillation (ENSO) climate anomaly. This phenomenon, which can persist for several months, is characterized by abnormally warm seawater temperatures, leading to increased cloud formation, heavy rainfall, and intense flooding. Takahashi (2017) indicated that ENSO can occur as a global or local event; on a global scale, it involves large-scale interactions between the central–equatorial Pacific Ocean and the atmosphere; on a local scale, it is known as a coastal El Niño, involving sea surface temperature anomalies limited to the coasts of Peru and Ecuador. Finally, Farías de Reyes and Montero (2023) reported that the most intense ENSO events of the last century occurred in 1925, 1983, 1998, 2017, and 2023, when the annual precipitation over the Poechos Reservoir Basin reached its highest recorded levels.
In context of the subjects described above, the sediment delivery ratio (SDR) model included in the Integrated Valuation of Ecosystem Services and Tradeoffs (InVEST 3.13.0) software (Natural Capital Project, 2022) offers a suitable approach for addressing sediment-released issues. This model is based on the concept of hydrological connectivity, which quantifies the linkage between sediment sources—typically located on slopes—and downstream water bodies such as streams or reservoirs (Borselli et al., 2008; Vigiak et al., 2012). Areas with sparse vegetation cover and steep slopes exhibit higher spatial connectivity, which increases the likelihood of eroded material reaching a reservoir (Ferreira et al., 2015).
Recent studies conducted in tropical transboundary basins Othman et al. (2024), Patel et al. (2024), and Gashaw et al. (2021) in Africa and Arteaga et al. (2022) for the Poechos Reservoir in South America) have applied the SDR model. These studies highlight its effectiveness in estimating the soil loss potential, especially in regions with poor integrated basin management. Their findings support the use of SDR as a valuable tool for guiding land-use planning, improving management practices, and mitigating land-use impacts at the basin scale.
Accordingly, the main objective of this study is to analyze the sediment sources in the sub-basins within the Catamayo–Chira hydrographic system and to assess their impact on the storage capacity of the Poechos Reservoir using the SDR model, while accounting for the influence of ENSO events and land cover.
Materials and methods
Study area
This study was conducted in the South American Andes, within the Catamayo–Chira transboundary river basin, which extends between 03°40′–05°07′ S and 79°05′–80°47′ W and ultimately discharges into the Pacific Ocean. The study focused on the upper portion of the basin, which drains into the reservoir formed by the Poechos Dam, which is located at 4°41′ S and 80°31’ W. Foucher et al. (2023) stated that the basin covers an area of approximately 13,565 km2, with 54% of the total area situated in the province of Loja (Ecuador) and 46% situated in the department of Piura (Peru). As seen in Figure 1, the basin comprises the Chira system (1), the Alamor (2), and La Solana (3) sub-basins, which are located in the western and lower sectors, in proximity to the Poechos Reservoir, together with the Catamayo (4), Macará (5), and Quiroz (6) sub-basins, situated in the eastern and upper regions.
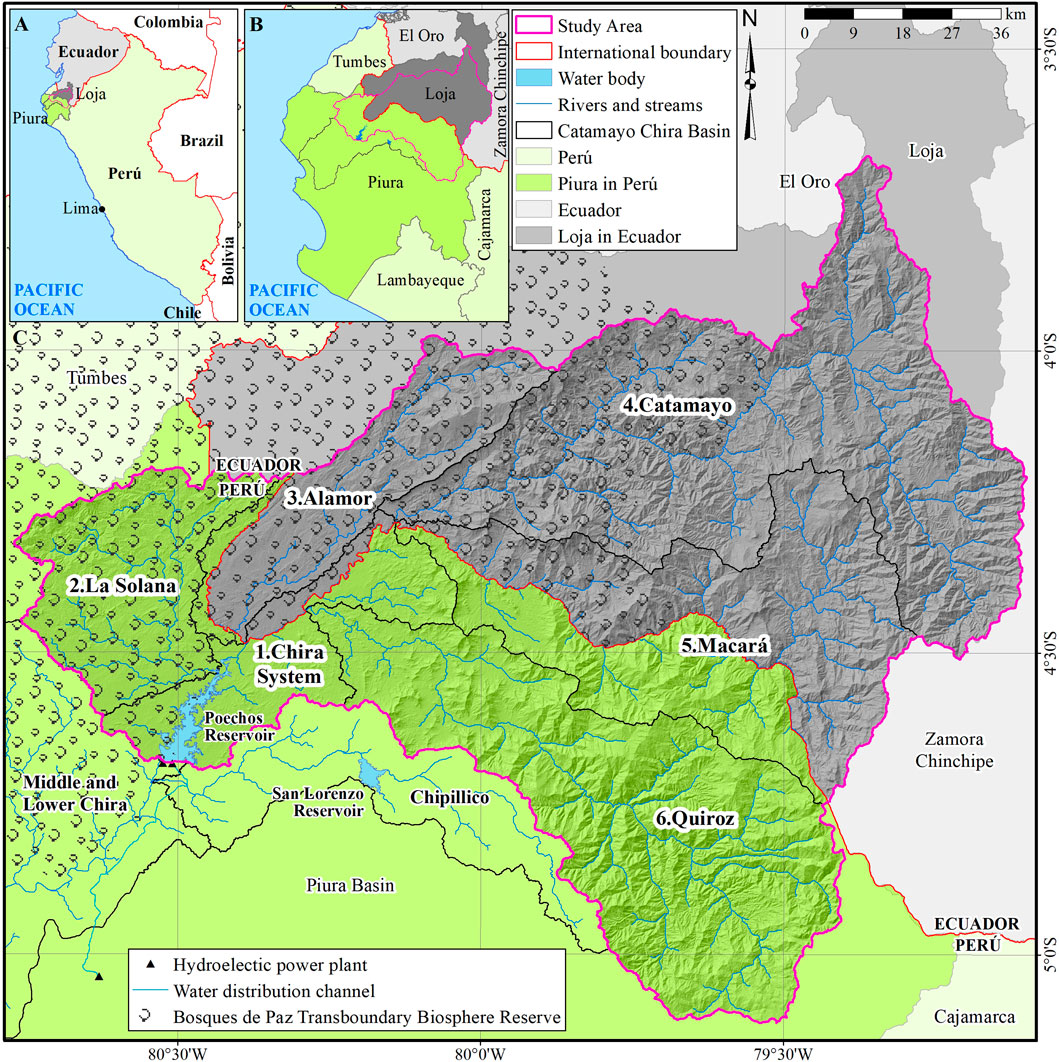
Figure 1. (A) Location map of the Study Area in Ecuador and Peru. (B) Location map of the Catamayo-Chira Transboundary Basin in the Ecuadorian–Peruvian border. (C) Six sub-basins of the Catamayo-Chira Transboundary Basin: 1. Chira System; 2. La Solana; 3. Alamor; 4. Catamayo; 5. Macará; and 6. Quiroz.
The basin’s elevation ranges from 81 meters above sea level (m a.s.l.) at the catchment outlet to 3,958 m a.s.l., rising from the Poechos Reservoir to the highest headwaters in the eastern part of the basin (Foucher et al., 2023). The rainy season occurs during the southern summer (December to May), when the prevailing tropical easterlies are frequently disrupted by low-level westerlies that transport moisture from the Pacific Ocean toward the study area. In contrast, the dry season extends from June to November and is dominated by persistent tropical easterlies that cause dry and sunny conditions. During this period, the elevated Eastern Cordillera acts as an orographic barrier, impeding the transport of moisture from the Amazon Basin (Ochoa et al., 2016).
According to the land-cover map generated by Foucher et al. (2023), the dominant land cover in the basin is rain-fed agriculture land, accounting for 35.2% (4,775 km2) of the total area. Dry forest covers 30.5% (4,142 km2) of the total area and is particularly well adapted to the rainfall regime and amounts that are characteristic of the study area. Herbaceous and/or shrubby vegetation occupies 22.4% (3,032 km2) of the area, primarily in areas where agricultural activity is limited. Montane forested areas, including both natural forests and plantations, cover 6.6% (896 km2) of the basin.
The Poechos Reservoir currently has an annual water demand of 2,343 hm3 (Ruiz Rosales, 2019). This volume is primarily managed by the Chira–Piura Special Project (PEChP), which operates both the reservoir and its associated hydraulic infrastructure (Seminario Gastelo, 2021). It supplies drinking water to approximately one million inhabitants in the cities of Piura, Sullana, Paita, and Talara (INEI, 2017). In addition, it irrigates 1,500 km2 of agricultural land in the Chira and Piura valleys and provides water for two hydroelectric power plants located at the base of the dam and a plant situated at the end of the distribution channel to the neighboring Piura River Basin (Aguilar Villena, 2016).
Poechos began operating in 1976 with an original water storage capacity of 885 hm3 at its normal operating level of 112 m a.s.l. However, according to the bathymetric survey conducted at the end of 2018, 42 years after its inauguration, the reservoir’s capacity had decreased to just 365 hm3, a volume that is significantly lower than 437 hm3 projected for 2026 (Barboza Castillo, 2022; Foucher et al., 2023). In this context, Tote et al. (2011) and Aguilar Villena (2016) reported that nearly 49% of the reservoir’s sedimentation between 1976 and 2005 occurred during the El Niño events of 1983 and 1998, resulting in a loss of 150 hm3 in those 2 years alone. Reyes et al. (2019) pointed out that two other particularly wet years, 2008 and 2017, caused the loss of another 67 hm3.
The sediment accumulation (SA) in Poechos primarily originates from runoff and sheet water erosion occurring on the slopes of the Catamayo–Chira Basin (Arteaga et al., 2022). Additional contributions are linked to agricultural practices in the riverbeds of the tributary streams (Barboza Castillo, 2022). Furthermore, Foucher et al. (2023) observed that SA in the floodplains during dry periods is subsequently deposited in the reservoir during ENSO events.
Determination of the sediment supply (SSup)
The SSup from the Catamayo–Chira Basin was estimated using the SDR model from the InVEST 3.13.0 software (Natural Capital Project, 2022) to determine the annual mass and origin of the SA in the Poechos Reservoir. The annual soil-loss maps were generated using the revised universal soil-loss equation (RUSLE) proposed by Renard (1997), and each map was multiplied, on a per-cell basis, by its corresponding annual SDR map, following the workflow shown in Figure 2.
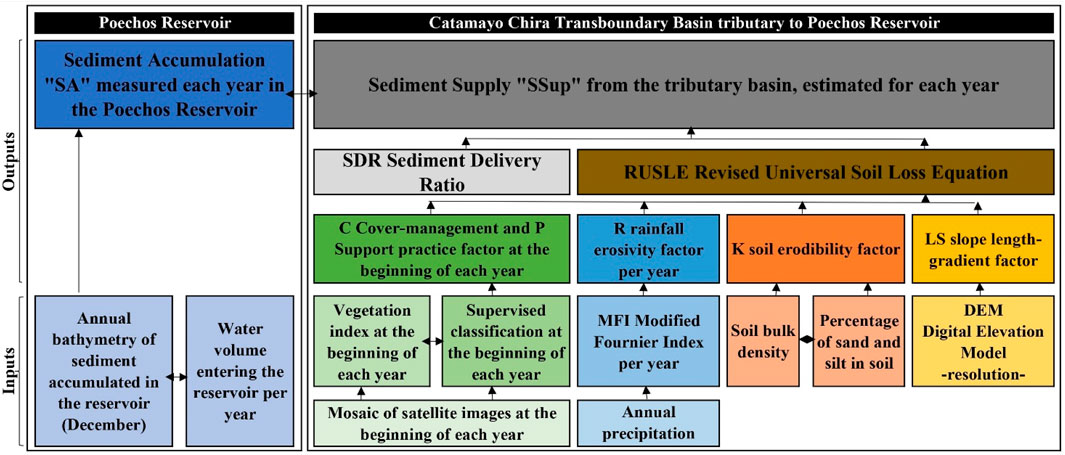
Figure 2. Flowchart of the methodological scheme for estimating the sediment supply (SSup).
The matrix model of RUSLE used by Ochoa et al. (2015) for an Andean Basin is shown in Equation 1:
Here, A(x,y) is the estimated average annual soil loss by water erosion per unit area (t ha-1 yr -1), R(x,y) is the rainfall erosivity factor (MJ mm ha-1 h-1 yr-1), K(x,y) is the soil erodibility factor (t ha h MJ-1 mm-1 ha-1), LS(x,y) is the dimensionless factor reflecting the length and slope steepness, C(x,y) is a dimensionless factor representing land use and land cover, and P(x,y) is a dimensionless factor for soil conservation practices.
Rainfall and runoff erosivity (R factor)
The R factor for each year was estimated using monthly precipitation data from the Peruvian interpolated data of the SENAMHI’s Climatological and Hydrological Observations (PISCOp V2.1) database (Aybar et al., 2020). Based on these data, the modified Fournier index (F) proposed by Arnoldus (1977) was calculated. This index evaluates the contribution of the wettest month relative to the total annual precipitation and is particularly suitable when only monthly or daily precipitation records are available. Its application in an Andean Basin in southern Ecuador by Ochoa et al. (2016) supports its relevance in similar climatic and topographic contexts. This method enables the spatial characterization of rainfall intensity, thereby facilitating the assessment of soil erosion risk and vulnerability (Equation 2).
Here, pi is the precipitation of month i or of each month of the year (mm), and P is the average annual precipitation (mm). Once F was calculated, the rainfall erosivity factor R (MJ mm ha-1 h-1 yr-1) was estimated with Equation 3 using the empirical equation proposed by Renard and Freimund (1994):
Here, R is the R-factor in MJ mm ha-1 h-1 yr-1 and F is the modified Fournier index proposed by Arnoldus (1977).
Soil erodibility (K factor)
The K factor was determined using Equation 4 proposed by Paulet (1973) and applied for this basin by Arteaga et al. (2022).
Here, K is the soil erodibility index in (t ha h); C = % clay, S = % silt, and Bd = bulk density (t · m-3). The denominator accounts for the unit conversion from t ha · h t -1 mm -1 ha -1 to t ha h MJ -1 mm -1 ha -1. The soil texture and bulk density data used in this analysis correspond to the average values of the topsoil layer (0 cm–5 cm depth). These data have a spatial resolution of 500 m and were obtained from the SoilGrids database. They are available at https://www.isric.org/explore/soilgrids (Poggio et al., 2021).
Slope length and steepness (LS factor)
The LS factor was calculated using the automated method for USLE developed by Desmet and Govers (1996), which is applicable to a two-dimensional surface. This calculation was based on a digital elevation model (DEM) with a 12.5-m resolution, which was downloaded from the ALOS PALSAR data portal https://search.asf.alaska.edu/#/.
LULC and C-factor estimates
The C factor was calculated for each grid cell (x, y) using the annual land-use/land-cover maps corresponding to each year evaluated (2001–2017). For this purpose, Moderate Resolution Imaging Spectroradiometer (MODIS) imagery was processed using the Google Earth Engine platform. The MODIS Terra Vegetation Indices 16-Day Global collection was retrieved from the Earth Engine Data Catalog (https://developers.google.com/earth-engine/datasets/catalog/MODIS_061_MOD13Q1). Then, a seasonal mosaic was generated for each of the 17 years analyzed, using imagery from the dry season (May to December). The median composite was applied as it is robust to extreme outliers—typically caused by clouds and shadows in satellite data. The Soil-Adjusted Vegetation Index (SAVI) was estimated using Equation 5 to quantify the vegetation vigor:
Here, NIR and R refer to the near-infrared and red bands, respectively, of the MODIS satellite imagery. The SAVI was applied to the 17 annual mosaics to assess the vegetation cover vigor, thereby enabling the subsequent classification of the mosaics (Linares-Palomino et al., 2022).
Factor C maps were obtained based on the supervised classification on the 17 tiles, applying random forest (Svoboda et al., 2022). Two-thirds of the spectral seeds were used as training sites for the model, and the remaining third was used to validate the classification (Belgiu and Dragut, 2016). To determine the accuracy of the classification model, the Kappa statistical coefficient was applied, which is a metric to evaluate the agreement between two classifications in a random manner (Ali et al., 2024). The Kappa coefficient ranged from 0.75 to 0.80. Values above 0.67 are considered acceptable classifications as described by Carletta (1996).
Considering this supervised classification, the C factor implies the P factor of soil conservation according to Benavidez et al. (2018). The values of the C factor used are those proposed for Peru by Sabino Rojas et al. (2017): 0 for water bodies and moors, assuming that the erosion generated in them tends to be null; 0.003 for montane forest; 0.005 for TDF in hills and mountains with greater vigor; 0.05 for TDF in hills with less vigor; 0.09 for the urban area; 0.22 for scrubland; 0.25 for dry areas and pastures; and finally, 0.63 for the irrigated agricultural area, because this land-use type generates greater erosion in the studied basin (Arteaga et al., 2022).
As shown in the maps in Figure 3, the vegetation vigor and cover vary significantly from year to year, depending on precipitation. At the end of a dry year, areas dedicated to rain-fed agriculture typically exhibit bare soil. In regions dominated by dry forest—characterized by predominantly deciduous vegetation—foliage and understory cover are lost, leading to a decrease in vegetation vigor. In both cases, soil protection is reduced, increasing susceptibility to erosion.
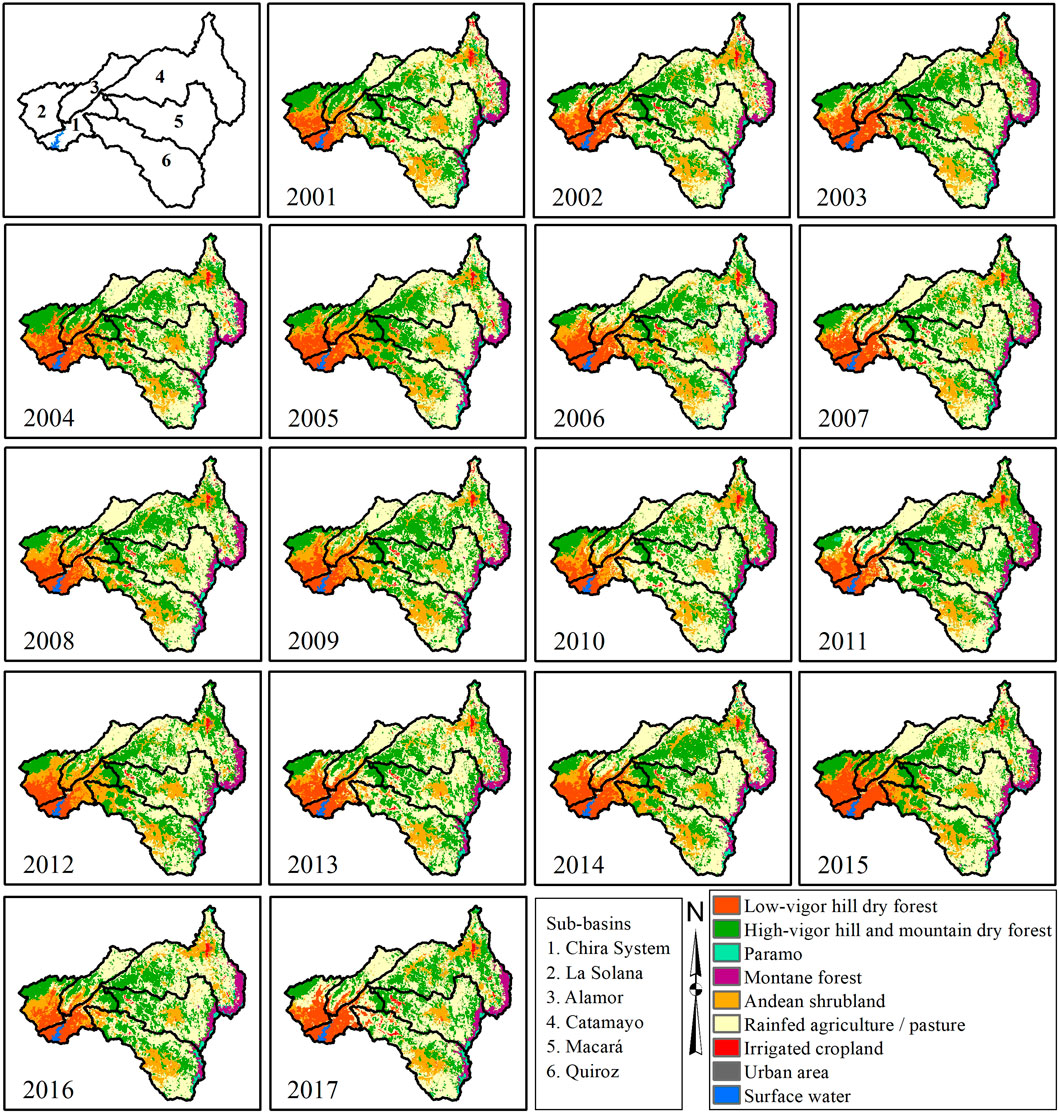
Figure 3. Vegetation cover dynamics map 2001 – 2017.
Sediment delivery ratio (SDR)
The sediment delivery rate, SDR(x,y), was determined by applying the SDR model described in the Natural Capital Project (2022). These results (SDR(x,y)) were multiplied with the corresponding cells of the A (x,y), and Equation 6 was used to estimate the sediment supplied (SSup(x,y)) in t km-2 from each cell of the basin map (x,y).
Thus, the flux of water supplied by the basin and deposited in the Poechos Reservoir was determined (Benavidez et al., 2018; Borselli et al., 2008). To estimate the total sediment supply SSup(t) from the basin to the reservoir, the sediment contributions from all the cells in the basin, SSup(x,y), were added, as shown in Equation 7.
Statistical relationship between sediment accumulation (SA) and sediment supply (SSup)
Finally, a simple regression analysis was performed between the series of volume (hm3) values of SA and the series of mass (t) values of SSup from the basin, considering a soil bulk density of 1.22 t m-3 in the basin, based on the cartographic data from https://www.isric.org/explore/soilgrids. To perform this analysis, a 95% confidence level was considered, and it was assumed that both variables coincide at the origin of the coordinate axis (Mejía et al., 2024). Zero SSup contributes with zero SA in the reservoir, and, therefore, β0 = 0.
Results
Relationship between erosivity and vegetation cover
Figure 4 shows that the highest values of the R factor (erosivity) in a specific year have a strong relationship with the amount of SSup estimated. The spatial distribution of erosivity by the sub-basin is provided in the figure in the supplementary material accompanying this article. Moreover, a clear relationship is observed in the annual course between SSup and SA, except for 2008, when the bathymetric measurement tripled the estimate. Specifically, this year saw the occurrence of a coastal El Niño phenomenon described by Farías de Reyes and Montero (2023). Because the occurrence of these coastal events was not yet understood, the event was underestimated, leading to poor reservoir management and high sediment retention. The coastal El Niño was first detected by the Geophysical Institute of Peru (IGP) in 2012 and became widely recognized in 2017 (Takahashi, 2017).
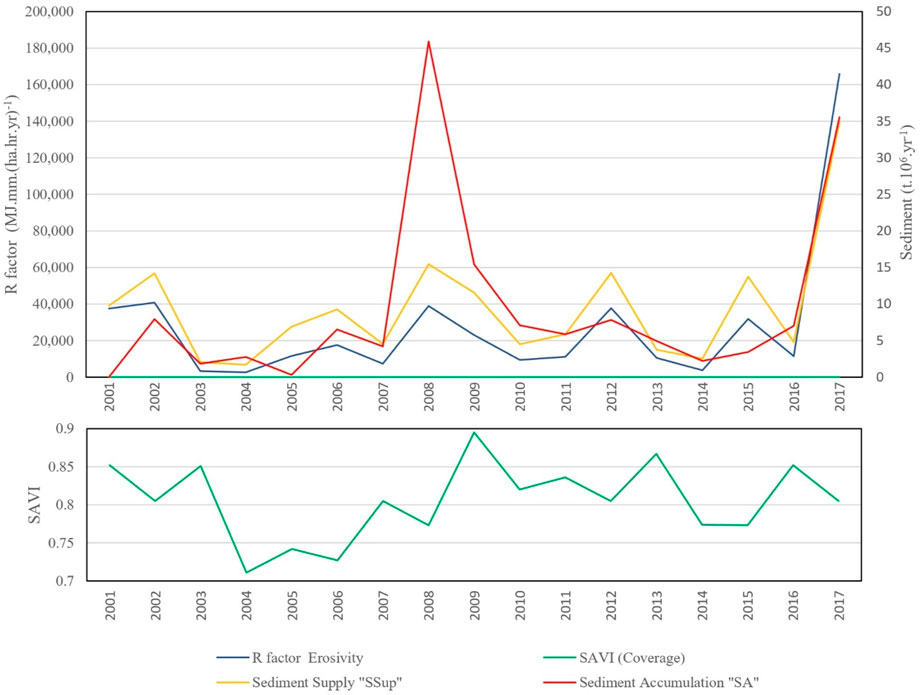
Figure 4. Courses of the erosivity factor R, SAVI, SSup from the basin, and SA in Poechos (t 106 yr-1) 2001–2017.
Figure 4 also confirms the trend line associated with the annual course between SA and SSup. The correlation coefficient r (p < 0.05) for the period 2001–2017 is 0.8424 and increases to 0.9403 when the 2008 ENSO data are excluded, indicating a strong positive correlation. Similarly, the adjusted coefficient of determination R2 is 0.6474, which may appear modest. However, when 2008 is excluded from the time series, R2 increases to 0.8174. This suggests that 81.74% of the variance in SA is explained by the independent variable SSup, supporting the use of the SSup variable to better understand soil erosion and sediment transport processes within the basin.
Sediment supply (SSup) from the basin
Using the SDR model, it was estimated that the basin supplied a median of 6.91 x 10⁶ t yr-1 of sediment during the period 2001–2017, a value close to 6.53 x 10⁶ t yr-1 of sediment accumulation measured through bathymetry over the same period. Additionally, the highest SSup to the Poechos Reservoir during the evaluated period occurred during the 2017 El Niño event, reaching 34.92 x 10⁶ t, which is approximately five times the median value (Figure 5).
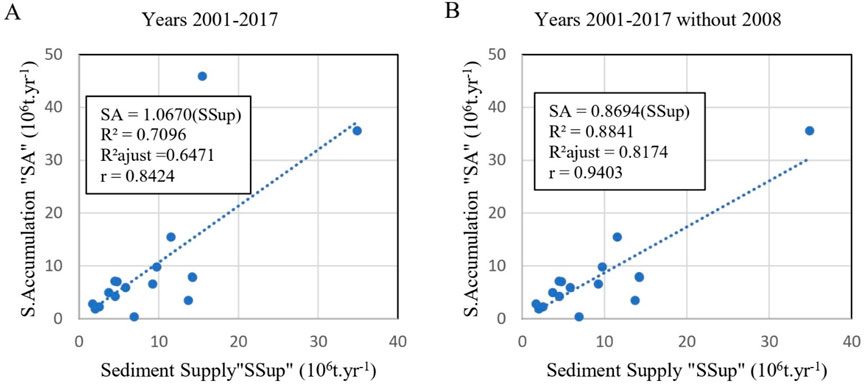
Figure 5. Trend line between SSup and SA β0 = 0: (A) 2001–2017 and (B) without data from 2008.
Contribution of SSup by each sub-basin
Figure 6 presents the annual distribution of SSup by the sub-basins to the Poechos Reservoir for the period 2001–2017. The Catamayo, Macará, and Quiroz sub-basins located in the eastern part of the study area contributed 84.3% of the total SSup, with median values of 1.50, 2.34, and 1.98 x 10⁶ t yr-1, respectively. These sub-basins are characterized by dryland agriculture on steep terrain, with slopes exceeding 25%, which results in high LS, C, and P factors. In contrast, the remaining sub-basins, namely, Alamor (0.65 x 10⁶ t yr-1), La Solana (0.18 x 10⁶ t yr-1), and Chira (0.05 x 10⁶ t yr-1), accounted for 12.8% of SSup. These are located in the western portion of the study area, where the seasonally dry forest is confined to the mountainous zones.
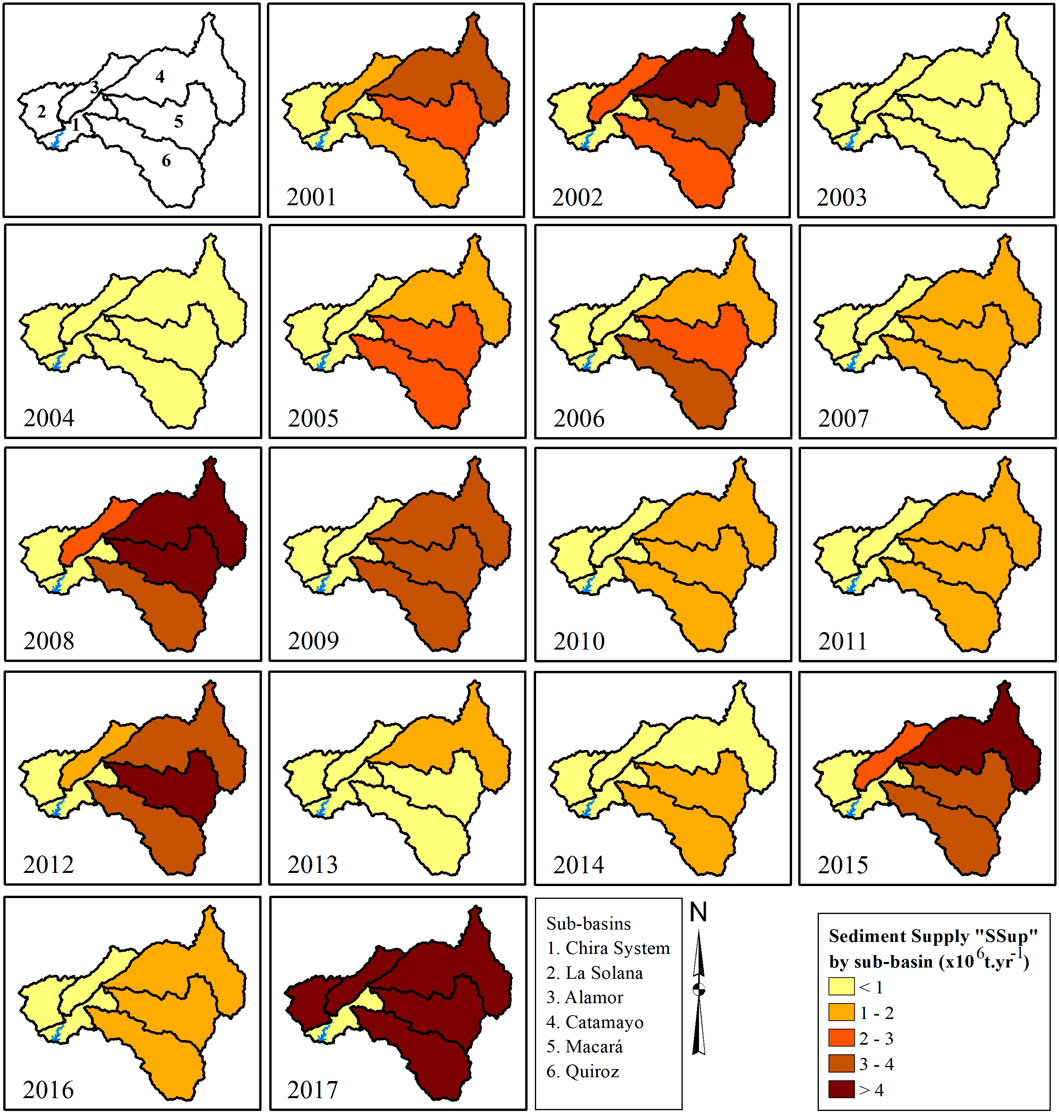
Figure 6. Sediment supply SSup (x 106 t yr-1) by each sub-basin 2001–2017.
An analysis of SSup from the sub-basins revealed that Catamayo, Macará, and Quiroz exhibited lower interannual variability in SSup than the La Solana and Alamor sub-basins throughout the study period. The eastern sub-basins contributed between 1 and 6 x 10⁶ t yr -1, whereas the western sub-basins supplied between 0 and 10.5 x 10⁶ t yr -1.
In 2017, during the occurrence of the so-called “coastal” El Niño event, the total SSup from the basin reached 34.92 x 10⁶ t. Each of the three eastern sub-basins tripled their median sediment contribution, reaching approximately 5.60 x 10⁶ t. Meanwhile, Alamor increased its sediment contribution tenfold to 6.68 x 10⁶ t and La Solana supplied 10.50 x 10⁶ t, which represents a 57-fold increase compared to its median value. During that year, approximately 52% of the SSup to the Poechos Reservoir originated from the western sub-basins, as illustrated in Figures 6, 7.
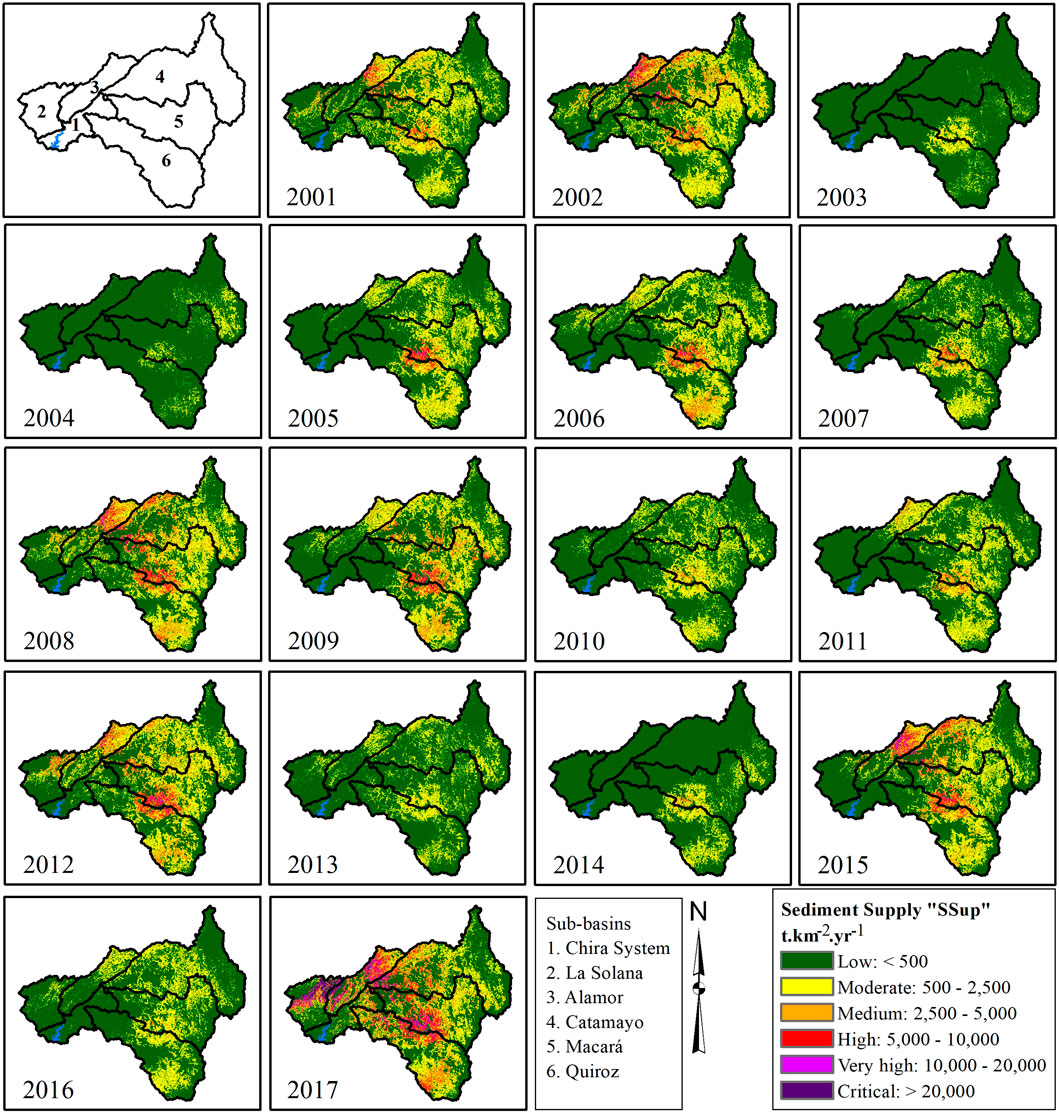
Figure 7. Specific sediment supply (t km-2 yr-1) estimated for the study period 2001–2017.
Sediment supply (SSup) per unit area
By dividing the annual median of the total sediment mass supplied from the basin, 6.91 x 10⁶ t yr-1, by its area, the median sediment yield was estimated at 510 t km-2 yr-1, a value close to the tolerable soil loss rate of 600 t km-2 yr-1 (Gashaw et al., 2021). When analyzing the sediment yield per unit area, the Macará and Quiroz sub-basins exhibited median values of 828 and 632 t km-2 yr-1, respectively, and both exceeded the tolerable limit. They were followed by Alamor (547 t km-2 yr-1), Catamayo (358 t km-2 yr-1), La Solana (152 t km-2 yr-1), and the Chira system (46.3 t km-2 yr-1).
Figure 7 shows that the highest SSup occurred in 2017, when the basin supplied an estimated 2,578 t km-2 in that year alone. This value is slightly higher than that reported by Rosas et al. (2023) for a neighboring basin. Notably, in 2017, the La Solana and Alamor sub-basins, where slopes (the LS factor) are the least pronounced in the study area, supplied 8,723 and 5,610 t km-2, respectively. In contrast, the eastern sub-basins, that is, Macará, Quiroz, and Catamayo, which are characterized by steeper slopes, supplied 1,997, 1,822, and 1,306 t km-2, respectively.
A detailed analysis of the sediment sources reveals extensive areas within the basin where SSup is recurrent. The highest contributions were estimated to originate from the basin region between the Quiroz and Macará sub-basins, particularly in the districts of Jililí, Montero, and Sícchez (Ayabaca Province, Peru), where seasonally dry forests and rain-fed agriculture dominate on slopes greater than 16% (Figure 7). Even during dry years, this area supplied more than 500 t km-2·yr-1, whereas in the wet years, it exceeded 5,000 t km-2·yr-1, reaching up to 20,000 t km-2·yr-1 in certain zones.
The Alamor sub-basin also contributed more than 2,000 t km-2· yr-1 during dry years. However, Figure 7 highlights specific areas within this sub-basin, particularly in the Cantons of Pindal and Célica (Loja Province, Ecuador), that exhibited much higher sediment yields. These zones are characterized by rain-fed maize cultivation (Ochoa et al., 2022). During wet years, sediment exports in this region reached 10,000 t km-2·yr-1 and peaked at 20,000 t km-2·yr-1 in 2017. Similarly, the lower part of the Catamayo sub-basin, which is also located in the Célica Canton, exported between 5,000 and 20,000 t km-2·yr-1 of sediment during wet years.
Discussion
The results obtained in this study show a significant statistical correlation between SSup and SA in the transboundary Poechos Reservoir Basin, with a correlation coefficient r = 0.8424 (p < 0.05) for the period 2001–2017. This correlation increases to r = 0.9403 when excluding outlier data from 2008. These findings are consistent with those of previous research in this basin (Foucher et al., 2023; Rosas et al., 2023), which has shown that extreme climatic events have a disproportionate impact on the sediment dynamics.
An analysis of the relationship between the rainfall erosivity factor R and SSup reveals that years with high R values coincide with elevated SSup rates (Ochoa et al., 2016). This pattern has also been documented in other Andean basins in Peru, where SSup increases significantly during ENSO episodes (Morera et al., 2017). These findings underscore the need for improved control of sediment mobilization from the basin through soil and water conservation practices (Arteaga et al., 2022). Specifically, this study contributes additional information by identifying specific sub-basin areas within the basin that are critical sources of sediment supply, especially during wet years.
The spatial distribution of SSup indicates that the Catamayo, Macará, and Quiroz sub-basins, located in the eastern area, accounted for 84.3% of the total SSup during the study period. These sub-basins are characterized by steep slopes (>25%); high LS, C, and P factors; and a prevalence of rain-fed agriculture on unstable terrain (Ochoa et al., 2022). These results highlight the importance of incorporating environmental, social, and economic variables into integrated watershed management (IWM), as emphasized by Arteaga et al. (2020) and Mera-Parra et al. (2021) in similar Andean contexts in southern Ecuador.
Notably, there was marked interannual variability in sediment source areas. During 2017, the western sub-basins of Alamor and La Solana contributed significantly to the total SSup (Figures 6, 7). This shift aligns with findings reported by Foucher et al. (2023), who reported increased SSup from seasonally dry forest areas during ENSO events. Such changes may be attributed to the higher susceptibility of soils in these regions to intense rainfall events, as well as temporary reductions in vegetation cover due to the expansion of agricultural or urban frontiers (Ochoa et al., 2015).
The estimated rates of SSup per unit area exceeded the tolerable soil loss threshold of 600 t km-2·yr-1 in the Macará and Quiroz sub-basins, with annual medians of 828 and 632 t km-2·yr-1, respectively. These values are comparable to those reported by Gashaw et al. (2021) in similar Ethiopian basins, where the combination of steep slopes, intensive agriculture, and extreme weather events has led to severe erosion rates. In 2017, SSup rates in La Solana and Alamor sub-basins reached exceptionally high values of 8,723 and 5,610 t km-2·yr-1, respectively. Given that SA in the Poechos Reservoir was also high in 2017, it is essential to examine land-cover dynamics from that specific year to inform targeted and adaptive management strategies.
It is also important to analyze the specific meteorological conditions of 2017, along with the frequency of such events, to support the development of predictive models for future scenarios (Mera-Parra et al., 2021). Special attention should be given to areas typically affected by water scarcity, such as the headwaters of the Catamayo River in Ecuador (Fries et al., 2020), and the Quiroz sub-basin in the province of Ayabaca, Piura (Peru), where SSup values reached up to 10,000 t km-2 yr-1 during wet years.
In 2026, the Poechos Reservoir will reach its 50th anniversary. The economy of Piura (Peru) relies heavily on the water it provides. If sedimentation continues at its current rate, the reservoir will soon be unable to store the water that sustains over one million people, irrigates approximately 1,500 km2 of agricultural land, and supports the generation of 38 MW of electricity. Although sediment removal is necessary, preventing sediment inflow is even more critical.
Most sediment originates in the upper basin shared by Peru and Ecuador, particularly during the late dry season, in areas dominated by dry forests and rain-fed agriculture. This underscores the need to establish mechanisms that foster collaboration between water users and those capable of safeguarding water quality. In this study, the reservoir’s water is specified to be used for human consumption, irrigation, and hydroelectric power generation. Unfortunately, there are no studies that specifically describe the quality of the drinking water, In addition, certain agro-industrial activities, such as fish farms, are observed near the reservoir; however, there are still no specific studies evaluating their impact on the reservoir’s water quality.
Several binational cooperation initiatives are underway within the basin, which, if effectively coordinated, could significantly reduce soil erosion and, consequently, the transport of sediments to the reservoir. One such initiative is the development of a binational conservation corridor in the eastern region of the basin, specifically in the upper Catamayo, Macará, and Quiroz sub-basins. This corridor aims to connect and integrate protected areas across both countries; it is already operational on the Ecuadorian side and is currently being implemented on the Peruvian side.
In the western part of the basin, the UNESCO designated the Bosques de Paz Transboundary Biosphere Reserve in 2017, the first one in South America, with the goal of promoting forest conservation, sustainable development of local communities, and integrated natural resource management along the Peru–Ecuador border. The reserve covers the La Solana and Alamor sub-basins, as well as the lower Catamayo sub-basin—areas predominantly characterized by dry forest and rain-fed agricultural systems, and are known for generating high sediment yields during ENSO events.
In line with this approach, at least three water funds operate within the basin, linking downstream water users and communities with upstream farming populations, while also supporting restoration efforts primarily focused on soil conservation and hydrological regulation. In Ecuador, the Fondo Regional del Agua (Regional Water Fund, foragua.org) is active. In Peru, two funds are in place: the Fondo de Agua Andes del Norte (Northern Andes Water Fund, faan.com.pe) and the Fondo Regional del Agua FORASAN (Piura Regional Water Fund). Collectively, these three water funds operate across the basin, promoting sustainable land management practices and the restoration of key ecosystems.
All these initiatives offer valuable opportunities for community engagement through agroforestry systems and soil conservation measures. Priority actions include zero tillage, the construction of dykes and earth dams, and the adoption of sustainable agricultural practices to reduce soil loss and mitigate environmental degradation (Arteaga et al., 2022). We agree with some authors (Ali et al. (2024) and Rosas et al. (2023)), who state that the management of transboundary basins depends on binational coordination and the active involvement of local stakeholders.
Conclusion
In this study, the InVEST model was used to estimate the spatial distribution of SSup to the transboundary basin study area. This primarily depends on the spatial location of erosivity, heavy rainfall on steep slopes, and rain-fed crops or seasonally dry forests after a period of low water (C factor), when it is easier for the eroded soil to be supplied and transported to the Poechos Reservoir.
It is advisable for large and transnational basins to study all the variables related to integrated basin management at the sub-basin scale. This makes it possible to observe, for example, the spatial distribution of SSup between years with a normal rainy season and years with ENSO. During the ENSO event in 2017, the SSup from all the basins tripled with respect to the “normal” years. Each of the three sub-basins located to the east of the study area doubled its supplies, whereas the sub-basins located to the west on less rugged terrain showed different values. Alamor quintupled its sediment supply, and La Solana supplied 12 times more than in an average year. Therefore, half of the total amount of sediment accumulated in Poechos in 2017 came from La Solana and Alamor.
In this study, we provide a deeper understanding of sedimentological processes in the transboundary basin of the Poechos Reservoir, highlighting the influence of climatic, geomorphological, and LULC factors on sediment dynamics. The findings presented here not only contribute to scientific knowledge on transboundary basins but also provide a strong foundation for the development of sustainable land and water management policies in vulnerable regions.
Data availability statement
The original contributions presented in the study are included in the article/Supplementary Material; further inquiries can be directed to the corresponding author.
Author contributions
MD-B: Writing – review and editing, Data curation, Conceptualization, Methodology, Writing – original draft, Software, Resources, Formal Analysis. MF: Software, Methodology, Writing – review and editing, Writing – original draft. FA: Supervision, Software, Writing – review and editing, Writing – original draft, Methodology, Conceptualization. JR-S: Methodology, Software, Writing – review and editing, Writing – original draft, Conceptualization. PO-C: Writing – review and editing, Writing – original draft, Visualization, Investigation, Software.
Funding
The author(s) declare that no financial support was received for the research and/or publication of this article.
Acknowledgments
The authors thank the Chira Piura Special Project for providing the annual bathymetry data for the Poechos Reservoir.
Conflict of interest
The authors declare that the research was conducted in the absence of any commercial or financial relationships that could be construed as a potential conflict of interest.
Generative AI statement
The author(s) declare that no Generative AI was used in the creation of this manuscript.
Any alternative text (alt text) provided alongside figures in this article has been generated by Frontiers with the support of artificial intelligence and reasonable efforts have been made to ensure accuracy, including review by the authors wherever possible. If you identify any issues, please contact us.
Publisher’s note
All claims expressed in this article are solely those of the authors and do not necessarily represent those of their affiliated organizations, or those of the publisher, the editors and the reviewers. Any product that may be evaluated in this article, or claim that may be made by its manufacturer, is not guaranteed or endorsed by the publisher.
Supplementary material
The Supplementary Material for this article can be found online at: https://www.frontiersin.org/articles/10.3389/feart.2025.1607597/full#supplementary-material
References
Aguilar Villena, R. (2016). Predicción de caudales en el Río Chira con fines de descolmatación del embalse de Poechos.
Ali, J., Islam, F., Bibi, T., Islam, I., Mughal, M. R., Sabir, M., et al. (2024). Quantifying the impact of climate change and urbanization on groundwater resources using geospatial modeling. Front. Earth Sci. 12, 1377367. doi:10.3389/feart.2024.1377367
Arnoldus, H. (1977). Methodology used to determine the maximum potential average annual soil loss due to sheet and rill erosion in Morocco. FAO Soils Bull. 34, 39–51. Available online at: https://eurekamag.com/research/000/430/000430166.php?srsltid=AfmBOoo6L0u30VLCo5VUCpANb7vgP87a4hhwUuaHIqi2y888HCkJ-XrP.
Arteaga, J., Ochoa, P., Fries, A., and Boll, J. (2020). Identification of priority areas for integrated management of semiarid watersheds in the Ecuadorian Andes. JAWRA J. Am. Water Resour. Assoc. 56 (2), 270–282. doi:10.1111/1752-1688.12837
Arteaga, J., Mejía, D., and Ochoa, P. (2022). Estimation of sediment production by soil management practices in a transboundary basin. Rev. Int. Contam. Ambient. 38, 1–12. doi:10.20937/RICA.54315
Aybar, C., Fernández, C., Huerta, A., Lavado, W., Vega, F., and Felipe-Obando, O. (2020). Construction of a high-resolution gridded rainfall dataset for Peru from 1981 to the present day. Hydrological Sci. J. 65 (5), 770–785. doi:10.1080/02626667.2019.1649411
Barboza Castillo, J. J. (2022). Evaluación del proceso de sedimentación y medidas de mitigación en el reservorio Poechos. Piura-Perú: Universidad Nacional de Piura. Thesis. Available online at: https://alicia.concytec.gob.pe/vufind/Record/RUMP_ac6a4814a087c85f214350ec846a2ba9.
Belgiu, M., and Dragut, L. (2016). Random forest in remote sensing: a review of applications and future directions. Isprs J. Photogrammetry Remote Sens. 114, 24–31. doi:10.1016/j.isprsjprs.2016.01.011
Benavidez, R., Jackson, B., Maxwell, D., and Norton, K. (2018). A review of the (Revised) Universal Soil Loss Equation ((R) USLE): with a view to increasing its global applicability and improving soil loss estimates. Hydrology Earth Syst. Sci. 22 (11), 6059–6086. doi:10.5194/hess-22-6059-2018
Bjerknes, J. (1969). Atmospheric teleconnections from the equatorial Pacific. Mon. weather Rev. 97 (3), 163–172. doi:10.1175/1520-0493(1969)097<0163:atftep>2.3.co;2
Borselli, L., Cassi, P., and Torri, D. (2008). Prolegomena to sediment and flow connectivity in the landscape: a GIS and field numerical assessment. Catena 75 (3), 268–277. doi:10.1016/j.catena.2008.07.006
Bruinsma, J. (2017). World agriculture: towards 2015/2030: an FAO study. London: Earthscan Publications Ltd. Available online at: https://www.fao.org/4/y4252e/y4252e.pdf.
Desmet, P. J., and Govers, G. (1996). A GIS procedure for automatically calculating the USLE LS factor on topographically complex landscape units. J. soil water conservation 51 (5), 427–433. doi:10.1080/00224561.1996.12457102
Farías de Reyes, M., and Montero, K. (2023). “Increased recurrence of global and coastal el Niño events on the South American coasts,” in Proceedings of the 40th IAHR world congress (Vienna, Austria), 21–25.
Farías de Reyes, M., Chávarri-Velarde, E., Cotrina, V., Aguilar, P., and Vegas, L. (2024). Space-time variability of maximum daily rainfall in Piura River Basin in Peru related to el Niño occurrence. Water 16 (23), 3452. doi:10.3390/w16233452
Ferreira, V., Panagopoulos, T., Andrade, R., Guerrero, C., and Loures, L. (2015). Spatial variability of soil properties and soil erodibility in the Alqueva reservoir watershed. Solid earth. 6 (2), 383–392. doi:10.5194/se-6-383-2015
Foucher, A., Morera, S., Sanchez, M., Orrillo, J., and Evrard, O. (2023). El Niño–southern oscillation (ENSO)-driven hypersedimentation in the Poechos reservoir, northern Peru. Hydrology Earth Syst. Sci. 27 (17), 3191–3204. doi:10.5194/hess-27-3191-2023
Fries, A., Silva, K., Pucha-Cofrep, F., Oñate-Valdivieso, F., and Ochoa-Cueva, P. (2020). Water balance and soil moisture deficit of different vegetation units under semiarid conditions in the andes of southern Ecuador. Climate 8 (2), 30. doi:10.3390/cli8020030
Gashaw, T., Bantider, A., Zeleke, G., Alamirew, T., Jemberu, W., Worqlul, A. W., et al. (2021). Evaluating InVEST model for estimating soil loss and sediment export in data scarce regions of the Abbay (Upper Blue Nile) Basin: implications for land managers. Environ. Challenges 5, 100381. doi:10.1016/j.envc.2021.100381
INEI (2017). Piura compendio estadístico 2017. Lima, Perú: Instituto Nacional de Estadística e Informática. Available online at: https://www.inei.gob.pe/media/MenuRecursivo/publicaciones_digitales/Est/Lib1505/libro.pdf.
Linares-Palomino, R., Huamantupa-Chuquimaco, I., Padron, E., La Torre, M., Roncal-Rabanal, M., Choquecota, N., et al. (2022). The seasonally dry forests of Peru: a re-analysis of their diversity patterns and floristic Relationships. Rev. Peru. Biol. 29 (4), NA. doi:10.15381/rpb.v29i4.21613
Madadi, M. R. (2022). Reservoir sedimentation management: a state-of-the-art review. J. Appl. Res. Water Wastewater 9 (2), 194–202. doi:10.22126/arww.2023.8195.1277
Mejía, D., Ochoa, P., and Arteaga, J. (2024). Evaluation of the hydrological response to land use change scenarios in urban and non-urban mountain basins in Ecuador. Land 13 (11), 1907. doi:10.3390/land13111907
Mera-Parra, C., Oñate-Valdivieso, F., Massa-Sánchez, P., and Ochoa-Cueva, P. (2021). Establishment of the baseline for the IWRM in the Ecuadorian andean basins: land use change, water recharge, meteorological forecast and hydrological modeling. Land 10 (5), 513. doi:10.3390/land10050513
Molina, A., Govers, G., Poesen, J., Van Hemelryck, H., De Bièvre, B., and Vanacker, V. (2008). Environmental factors controlling spatial variation in sediment yield in a central Andean mountain area. Geomorphology 98 (3-4), 176–186. doi:10.1016/j.geomorph.2006.12.025
Morera, S. B., Condom, T., Crave, A., Steer, P., and Guyot, J. L. (2017). The impact of extreme El Niño events on modern sediment transport along the western Peruvian Andes (1968–2012). Sci. Rep. 7 (1), 11947. doi:10.1038/s41598-017-12220-x
Natural Capital Project (2022). InVEST 3.13.0. Stanford University, University of Minnesota, Chinese Academy of Sciences, The Nature Conservancy, World Wildlife Fund. Stockholm Resilience Centre and the Royal Swedish Academy of Sciences. doi:10.60793/natcap-invest-3.16.2
Obialor, C., Okeke, O., Onunkwo, A., Fagorite, V., and Ehujuo, N. (2019). Reservoir sedimentation: causes, effects and mitigation. Int. J. Adv. Acad. Res. 5 (10), 92–109.
Ochoa, P., Fries, A., Montesinos, P., Rodríguez, J. A., and Boll, J. (2015). Spatial estimation of soil erosion risk by land-cover change in the Andes of southern Ecuador. Land Degrad. and Dev. 26 (6), 565–573. doi:10.1002/ldr.2219
Ochoa, P., Fries, A., Mejía, D., Burneo, J., Ruíz-Sinoga, J., and Cerdà, A. (2016). Effects of climate, land cover and topography on soil erosion risk in a semiarid basin of the Andes. Catena 140, 31–42. doi:10.1016/j.catena.2016.01.011
Ochoa, P. A., Arteaga, J., Arévalo, A. P., and Kolok, A. S. (2022). A potential pesticides exposure index (PPEI) for developing countries: applied in a transboundary basin. Integr. Environ. Assess. Manag. 18 (1), 187–197.
Othman, A., Ali, S., and Scheytt, T. (2024). Comparison between multi RUSLE-SDR models for estimation of reservoir sedimentation: a case study of Dokan Lake Basin, Iraq–Iran. Environ. Earth Sci. 83 (13), 419. doi:10.1007/s12665-024-11713-z
Patel, A., Singh, M., Bhatt, S., de Oliveira-Júnior, J., Singh, S., Rathore, V., et al. (2024). Assessment of soil loss from a Trans-National Rapti River Basin using empirical and InVEST-based models. Geomatica 76 (2), 100016. doi:10.1016/j.geomat.2024.100016
Paulet, I. (1973). Guía para el planeamiento del uso de las tierras agrícolas en las zonas de lluvia del Perú, 3. Lima, Peru: Programa de Conservación de Suelos-Publicación.
Poggio, L., De Sousa, L. M., Batjes, N. H., Heuvelink, G. B., Kempen, B., Ribeiro, E., et al. (2021). SoilGrids 2.0: producing soil information for the globe with quantified spatial uncertainty. Soil 7 (1), 217–240. doi:10.5194/soil-7-217-2021
Rahmani, V., Kastens, J. H., DeNoyelles, F., Jakubauskas, M. E., Martinko, E. A., Huggins, D. H., et al. (2018). Examining storage capacity loss and sedimentation rate of large reservoirs in the central US Great Plains. Water 10 (2), 190. doi:10.3390/w10020190
Renard, K. G. (1997). Predicting soil erosion by water: a guide to conservation planning with the Revised Universal Soil Loss Equation (RUSLE). US Department of Agriculture.
Renard, K. G., and Freimund, J. R. (1994). Using monthly precipitation data to estimate the R-factor in the revised USLE. J. hydrology 157 (1-4), 287–306. doi:10.1016/0022-1694(94)90110-4
Reyes, J., Farías, M., Sánchez, I., and Tesén, K. (2019). Evaluación de la aplicación de metodología de descolmatación UDEP al Reservorio Poechos durante el Fenómeno El Niño Costero 2017. E-Proceedings of the 38th IAHR World Congress. doi:10.3850/38WC092019-1765
Richter, M., and Ise, M. (2005). Monitoring plant development after el Niño 1997/98 in northwestern Perú. Erdkunde 59, 136–155. doi:10.3112/erdkunde.2005.02.05
Rosas, M. A., Vanacker, V., Viveen, W., Gutierrez, R. R., and Huggel, C. (2020). The potential impact of climate variability on siltation of Andean reservoirs. J. hydrology 581, 124396. doi:10.1016/j.jhydrol.2019.124396
Rosas, M. A., Viveen, W., and Vanacker, V. (2023). Spatial variation in specific sediment yield along the Peruvian western Andes. Catena 220, 106699. doi:10.1016/j.catena.2022.106699
Ruiz Rosales, E. (2019). Evaluación ambiental del uso y gestión del agua de riego en la Junta De Usuarios del sector hidráulico Chira, provincia de Sullana–región Piura. Available online at: https://renati.sunedu.gob.pe/handle/renati/961977.
Sabino Rojas, E., Felipe-Obando, O., and Lavado-Casimiro, W. (2017). Atlas de erosión de suelos por regiones hidrológicas del Perú. Nota Técnica N. 002 SENAMHI-DHI-2017. Available online at: https://hdl.handle.net/20.500.12542/261.
Seminario Gastelo, J. (2021). Modelos de predicción para el caudal del río Chira en la estación Ardilla Universidad de Piura. Available online at: https://hdl.handle.net/11042/4986.
Sumi, T., and Hirose, T. (2009). Accumulation of sediment in reservoirs, Water storage, transport and distribution. Paris, France: UNESCO-IHE and EOLSS Publishers Co. Ltd.
Svoboda, J., Štych, P., Laštovička, J., Paluba, D., and Kobliuk, N. (2022). Random forest classification of land use, land-use change and forestry (LULUCF) using sentinel-2 data—a case study of Czechia. Remote Sens. 14 (5), 1189. doi:10.3390/rs14051189
Takahashi, K. (2017). Fenómeno El Niño:“Global” vs “Costero”. Instituto Geofísico del Perú,“Generación de información y monitoreo del Fenómeno El Niño”. Bol. Técnico 4 (4), 1–7.
Tote, C., Govers, G., Van Kerckhoven, S., Filiberto, I., Verstraeten, G., and Eerens, H. (2011). Effect of ENSO events on sediment production in a large coastal basin in northern Peru. Earth Surf. Process. Landforms 36 (13), 1776–1788. doi:10.1002/esp.2200
Vanacker, V., Molina, A., Govers, G., Poesen, J., and Deckers, J. (2007). Spatial variation of suspended sediment concentrations in a tropical Andean river system: the Paute River, southern Ecuador. Geomorphology 87 (1-2), 53–67. doi:10.1016/j.geomorph.2006.06.042
Keywords: ENSO, erosivity, LULC, InVEST model, remote-sensing, sediment delivery ratio, soil erosion
Citation: Dunin-Borkowski MS, Farías de Reyes M, Asencio FW, Reyes-Salazar JD and Ochoa-Cueva P (2025) Sediment origins in the Catamayo-Chira Transboundary Basin: impacts on Poechos Reservoir capacity under ENSO influence. Front. Earth Sci. 13:1607597. doi: 10.3389/feart.2025.1607597
Received: 07 April 2025; Accepted: 26 August 2025;
Published: 29 September 2025.
Edited by:
Kevin Tansey, University of Leicester, United KingdomReviewed by:
Dawid Szatten, Kazimierz Wielki University of Bydgoszcz, PolandNese Yilmaz, Istanbul University, Türkiye
Copyright © 2025 Dunin-Borkowski, Farías de Reyes, Asencio, Reyes-Salazar and Ochoa-Cueva. This is an open-access article distributed under the terms of the Creative Commons Attribution License (CC BY). The use, distribution or reproduction in other forums is permitted, provided the original author(s) and the copyright owner(s) are credited and that the original publication in this journal is cited, in accordance with accepted academic practice. No use, distribution or reproduction is permitted which does not comply with these terms.
*Correspondence: Maria S. Dunin-Borkowski, YzI4NTcxQHV0cC5lZHUucGU=