 Li Gao
 Jianjun Cheng*
- College of Water and Architectural Engineering, Shihezi University, Shihezi, China
Strong wind and dusty weather are the main factors causing wind-sand disasters in cotton fields in desert oasis area. In order to investigate the effect of sand-dust weather on wind speed fluctuation over near-surface cotton fields, field observations of wind speed and direction were carried out using a two-dimensional ultrasonic anemometer, and the characteristics of wind speed fluctuation during clear-sky, blowing dust and sandstorm were analyzed. The results showed that the fluctuating wind speed at each height level increased with increasing height and wind speed in the three kinds of weather, with the fluctuation ranges being largest during sandstorms, followed by blowing dust, and smallest under clear-sky days. The correlation coefficient of fluctuating wind speed at each height level were all larger than 0.7, and the values at the heights of 1.5 and 2.0 m were all larger than 0.9, which indicated that there is a significant correlation between the fluctuating wind speed at each height. The wind speed fluctuation intensity is positively correlated with both height and average wind speed, the average values of fluctuation intensity in blowing dust and sandstorm are 1.375 and 2.33 times higher than those in the clear-sky days, respectively. Turbulence intensity decreases with the increase of height and average wind speed, and it is the smallest in the sandstorm. The results revealed the differential effects of extreme aeolian environments on the near-surface wind field in cotton fields, and provided a theoretical foundations for the prevention and control of wind and sand hazards in cotton fields in desert oasis.
1 Introduction
Xinjiang is located in the northwest inland of China. Because of its unique light and heat conditions, it has become an important high-quality cotton producing base in China. However, cotton fields in Xinjiang are mostly located around the desert. Strong wind, abundant sand sources and arid climatic conditions also make it one of the most seriously damaged areas by wind and sand (Wang et al., 2006; Wang et al., 2008; Baidourela et al., 2018; Wang et al., 2024). After the wind-blown sand invaded the cotton field, the stems of cotton seedlings were broken, the leaves were dropped, and the plastic film and drip irrigation belt were damaged (Figure 1). Wind-blown sand disasters not only affect the growth and yield of cotton, but also cause huge economic losses to farmers (Gao et al., 2023). Therefore, it is of great significance to study the characteristics of wind speed fluctuation near the surface of cotton field for understanding the law of wind-sand movement, revealing the disaster-causing mechanism and formulating effective measures to prevent and mitigate wind-sand disasters in cotton field.
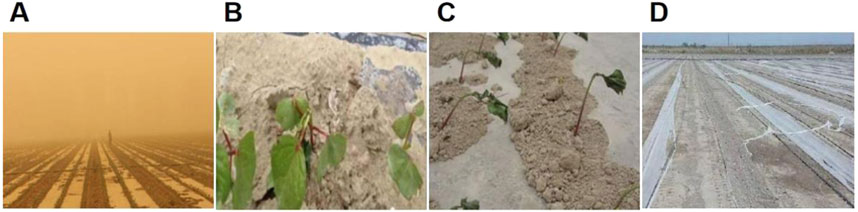
Figure 1. Wind-sand disaster in cotton field in desert oasis area. (A) Sandstrom sweep through cotton fields. (B) Broken stalks of cotton seedlings. (C) Curved stalks and withered leaves. (D) Damaged plastic film and drip irrigation tap.
In recent years, numerous studies have used field observation (Wang and Zheng, 2013; Zheng et al., 2019; Zhang et al., 2020; Li et al., 2022), wind-tunnel experiment (Gao et al., 2017), satellite remote sensing identification and other methods (Isazade et al., 2021; Isazade et al., 2022; Isazade et al., 2023; Chen et al., 2024) to conduct wind speed fluctuation and its relationship with wind-blown sand movement. The study of wind speed fluctuation characteristics of different surface types shows that wind speed fluctuation is related to underlying surface roughness and ground turbulence. The average wind speed of underlying surfaces increases with the increase of height in the shifting sand land, semi-fixed sand land, fixed sand land and oasis, the fluctuation intensity of wind speed increases first and then decreases (Mao et al., 2017). There is a linear positive correlation between the near-surface wind speed fluctuation intensity and the average wind speed in Gobi, grassland and bare farmland (Zhang et al., 2020; Liu et al., 2020). Through the study of the characteristics of wind speed fluctuation in different weather, it is found that the fluctuating wind speed of the desert-oasis ecotones and the near surface of the desert hinterland has a good correlation in different weather conditions, the fluctuation range of fluctuating wind speed is proportional to height and wind speed, and the fluctuation intensity is positively correlated with wind speed (Zheng et al., 2019). Through the comparative study of wind speed profile and wind speed fluctuation characteristics in net wind field and wind-sand flow, it is concluded that the fluctuation intensity in net wind field and wind-sand flow generally increases with the increase of wind speed and decreases with the increase of height (Gao et al., 2017). The moving sand particles have a certain inhibitory effect on the process of wind speed fluctuation, weakens the average wind speed, and enhances the fluctuating wind speed. The turbulence intensity of net wind field is greater than that of wind-sand flow (Zhang et al., 2020). In addition, Butterfield (1998) found that the near-surface sediment transport rate has a good correlation with wind speed fluctuations. Sand transport is related to the fluctuation or turbulence of wind, and the fluctuation of wind speed will lead to the fluctuation of sand transport rate (Butterfield, 1991; Leenders et al., 2005; Liu et al., 2012). The turbulent structure of boundary layer is closely related to the non-stationary characteristics of wind-sand transport (Wang and Zheng, 2013), which further shows that there is a mutual influence and restriction relationship between wind speed fluctuation and sand movement and transport.
In order to characterize the size and strength of wind speed fluctuations, fluctuating wind speed, wind speed fluctuation intensity, turbulence intensity, correlation coefficient and other parameters were often used to reflect wind speed variability, amplitude, correlation, wind speed distribution and turbulence status (Mao et al., 2017; Ren et al., 2018; Zhang et al., 2020; Kang et al., 2023; Chen, et al., 2025). Existing research results have confirmed that the characteristics of wind speed fluctuation are closely related to the roughness of the underlying surface, ground turbulence and weather conditions (Mao et al., 2017; Zheng et al., 2019). Most research results focus on homogeneous underlying surfaces such as deserts, sandy land and grassland (Zhang et al., 2020; Liu et al., 2020), while the surface of cotton fields has significant heterogeneity - with a plastic film coverage rate of 90% and periodic distribution of soil ridges, and the influence of its roughness combination characteristics on wind speed fluctuation remains unclear. In addition, research results mainly focus on the wind field characteristics of bare land, sand dunes or shelterbelts, and there is a lack of systematic observations and quantitative analysis of characteristic parameters of wind speed fluctuation near the surface of cotton fields under different weather conditions, especially blowing dust and sandstorms.
This study employed a method combining high-frequency in-situ observation and data analysis. Two-dimensional ultrasonic anemometers and air temperature, humidity and pressure sensors were installed in cotton fields in the desert-oasis transition zone of Xinjiang, China. Wind speed, wind direction, temperature, humidity and pressure data were simultaneously collected during clear-sky days, blowing dust and sandstorm. Through the analysis of turbulence statistical characteristics, turbulence intensity and correlation coefficient calculation, the impact of sand-dust weather on the wind speed fluctuation in cotton fields was revealed, providing theoretical support for the refined forecast and targeted prevention and control of agricultural wind-sand disasters.
2 Materials and methods
2.1 Overview of study area
The study area is located in the third Division 53rd Regiment (40°02′40″ N, 79°23′37″ E, elevation 1,042.8 m) of Tumxuk City, Xinjiang Uygur Autonomous Region, China (Figure 2). It is located in the northwest edge of the Taklamakan Desert and belongs to the continental desert climate. It is windy in spring, hot in summer, and cold in winter. The average annual gale days are about 30 days. The average wind speed is 4.5 m/s in spring, and northeast (NE) was the prevailing wind direction. The annual average temperature is 11.6°C, the maximum temperature is 42.2°C, and the minimum temperature is −24.2°C. The annual precipitation is about 70 mm, and the annual evaporation is about 2051.5 mm. The major natural disasters are drought, gale and sandstorm. The cotton field covers an area of 66,500 m2, running in an east-west direction. The cotton variety grown is Tahe No. 2. Cotton sowing is carried out in a one-plastic film six-row mode, with drip irrigation under the film and conventional field management.
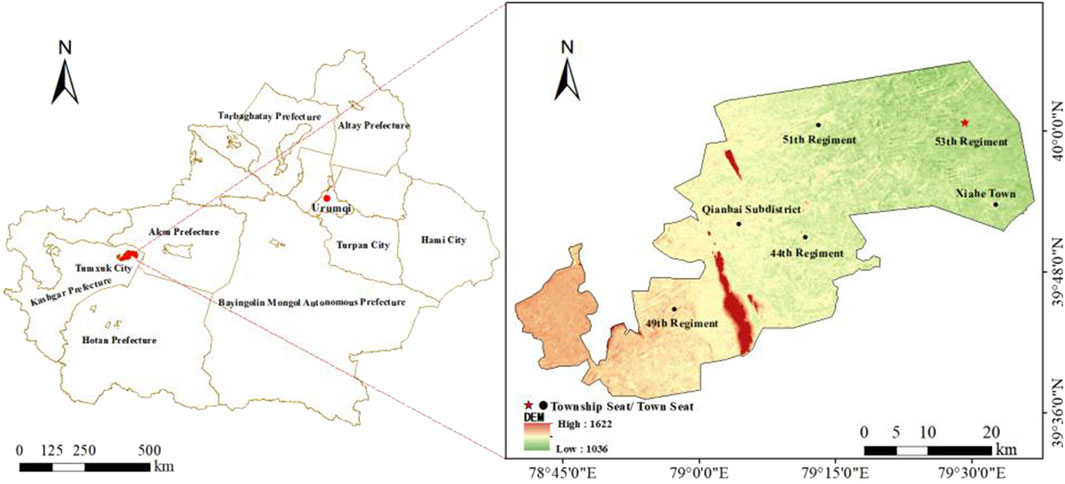
Figure 2. Location of test sites (

2.2 Wind conditions in study area
In this study, we selected the latitude and longitude coordinates of 79°23′37″E, 40°02′40″N in the cotton field as the monitoring point, and used the Global atmospheric reanalysis climate data (ERA5) as the data source to obtain the wind speed and direction data of the study area in 2021, 2022 and 2023 (Hersbach et al., 2020; Li et al., 2023). In 2021, 2022 and 2023, the statistical analysis of data revealed that the NE azimuth frequency is 18.57%, 21.06% and 18.30%, respectively, and the average wind speed is 3.73 m/s, 3.82 m/s and 3.77 m/s, respectively. The NE azimuth frequencies in spring are 21.75%, 22.66% and 20.28% in 2021, 2022 and 2023, respectively. The average wind speed and maximum wind speed in spring are 4.5 m/s and 11.99 m/s, respectively. The maximum wind speed occurs in April or May (Figure 3). The time when the wind speed in spring is greater than the threshold wind speed in 2021, 2022 and 2023 accounts for 21.29%, 23.99% and 29.48% of the whole quarter, respectively. In general, the maximum frequency of NE direction in the whole year and spring are 21.06% and 22.66%. Therefore, NE was the prevailing wind direction in the whole year and spring.
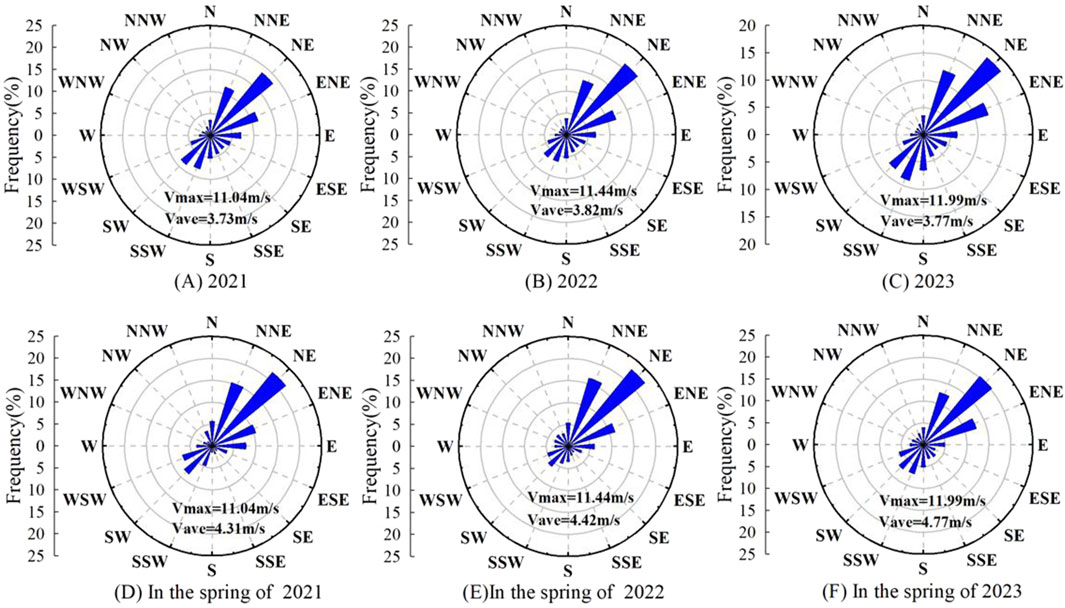
Figure 3. Wind rose diagrams of the study area over the past 3 years. (A) 2021; (B) 2022; (C) 2023; (D) In the spring of 2021; (E) In the spring of 2022; (F) In the spring of 2023. Vmax: Max wind speed; Vave: Average wind speed; N, north; NNE, north-northeast; NE, northeast; ENE, east-northeast; E, east; ESE, east-southeast; SE, southeast; SSE, south-southeast; S, south; SSW, south-southwest; SW, southwest; WSW, west-southwest; W, west; WNW, west-northwest; NW, northwest; NNW, north-northwest.
2.3 Experimental instruments and research methods
In the study area, seven two-dimensional ultrasonic anemometers (Gill WindSonic) are used to measure the wind speed and direction (Figure 4A). The anemometer range is 0–60 m/s, with a measurement accuracy of ±2%. The wind direction range is 0°–359°, with a measurement accuracy of ±2° (Figure 4B). The collected data in the u and v directions correspond to the wind speed in the x and y coordinate systems. The measurement frequency is 20 Hz, and the total measurement height is 2.0 m. There are 7 measurement heights, which are 0.05 m, 0.25 m, 0.5 m, 0.75 m, 1.0 m, 1.5 m and 2.0 m respectively. The anemometer is installed in an open area in the middle of the cotton field, with flat terrain and far from the protective forest. The temperature, humidity, and pressure sensor (TBR3, accuracy:±0.2°C, ±0.15%) is installed at a height of 1.0 m (Figure 4D). Before conducting field observations, the anemometers were uniformly calibrated (Figure 4C). During the observation of wind speed and direction, abnormal periods with relative humidity greater than 60% or temperature drops sharply by more than 5°C/h have been screened and excluded to ensure the consistency of the meteorological background during the data analysis period. The observation period is from April 15th to April 18th 2023, with a total valid observation duration of 60 h. The observation data of the clear-sky period from 12:41 to 12:45 on 15 April 2023, the blowing dust period from 18:50 to 18:54 on 17 April 2023, and the sandstorm period from 15:06 to 15:10 on 18 April 2023 were selected respectively. It is shown that the greater the statistical time interval of wind speed, the greater the gap between average wind speed and instantaneous wind speed; the wind speed time interval less than 5 min can better reflect the characteristics of wind speed fluctuation (Zhang et al., 2020). Therefore, the analysis time of wind speed and wind direction observation data in clear-sky days, blowing dust and sand storm is 5 min.
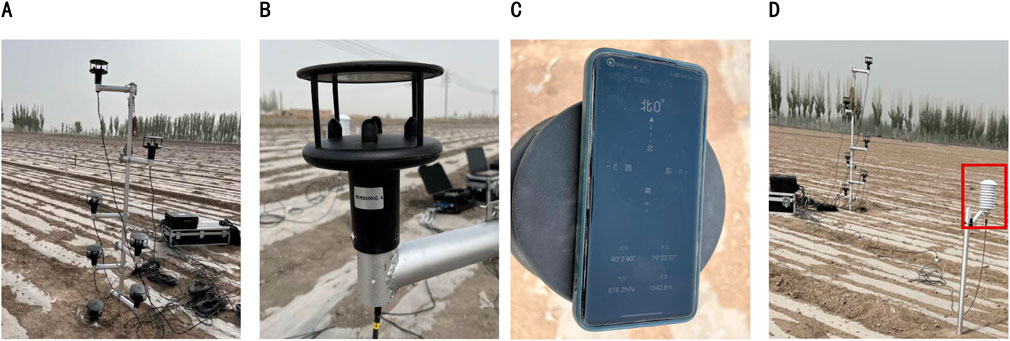
Figure 4. The layout of measure instruments. (A) Measurement height arrangement (B) The two-dimensional ultrasonic anemometer (C) Positioning to the north direction. (D) The temperature, humidity, and pressure sensor.
Based on the standards of the World Meteorological Organization (WMO), and the Chinese national standard “Classification of sand and dust weather” (GB/T 20480–2017) (Standardization Administration of China, 2017), clear sky days, blowing dust, and sandstorm are precisely defined in Table 1.
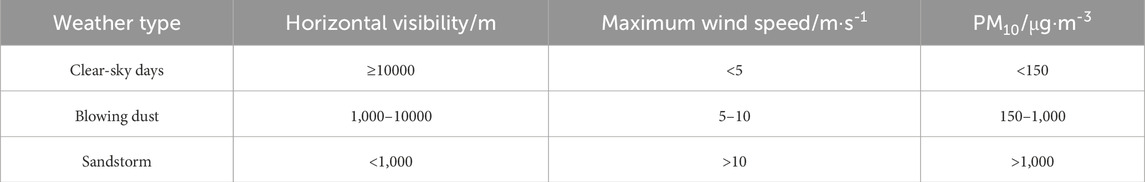
Table 1. Classification criteria of clear-sky days, blowing dust and sandstorm.
In this paper, the characteristics of wind speed fluctuation near-surface of cotton field are described by fluctuating wind speed, wind speed fluctuation intensity, turbulence intensity and correlation coefficient. The fluctuating wind speed (
The fluctuation intensity of wind speed (
The turbulence intensity(g) is defined as the ratio of wind speed fluctuation intensity to average wind speed, which describes the degree of wind speed change with time and space, and reflects the relative intensity of fluctuating wind speed (Kang et al., 2023).
In Formula 1–3:
In Formula 4,
3 Results and analysis
3.1 Average wind speed and fluctuating wind speed
As shown in Table 2, the average wind speed increases with the increase of height in clear-sky days, blowing dust and sandstorm. The fluctuation range of average wind speed is 1.488–3.923 m/s, 1.73–6.36 m/s, 6.158–10.254 m/s, respectively. At the same height and time, the average wind speed is as follows: sandstorm is the largest, blowing dust is the second, and clear-sky days is the smallest. The fluctuation range of fluctuating wind speed is proportional to the height in three kinds of weather conditions. The greater the height, the greater the fluctuation range of the fluctuating wind speed. At the same height, the fluctuation range of fluctuating wind speed is as follows: sandstorm is the largest, blowing dust is the second, and clear-sky days is the smallest (Figure 5).
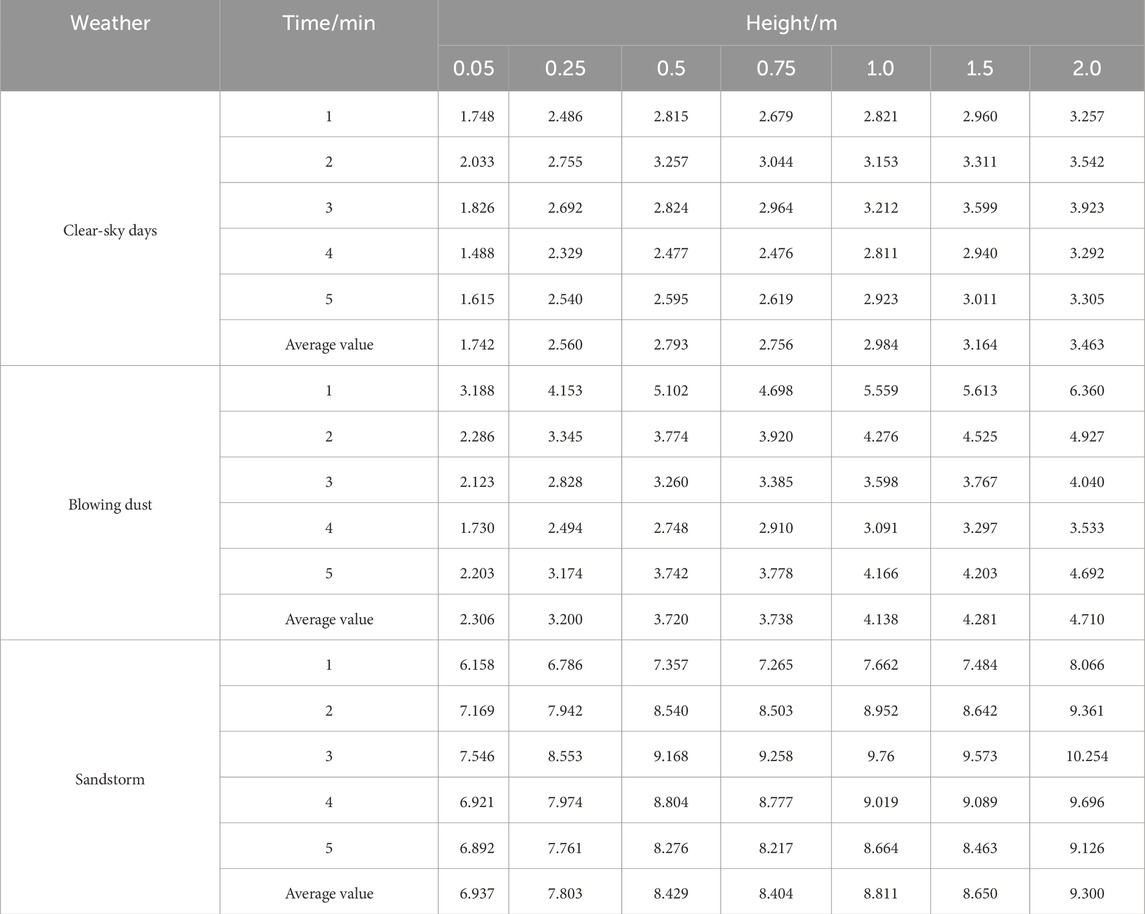
Table 2. Variation of average wind speed with height in different weather (Unit: m·s-1).
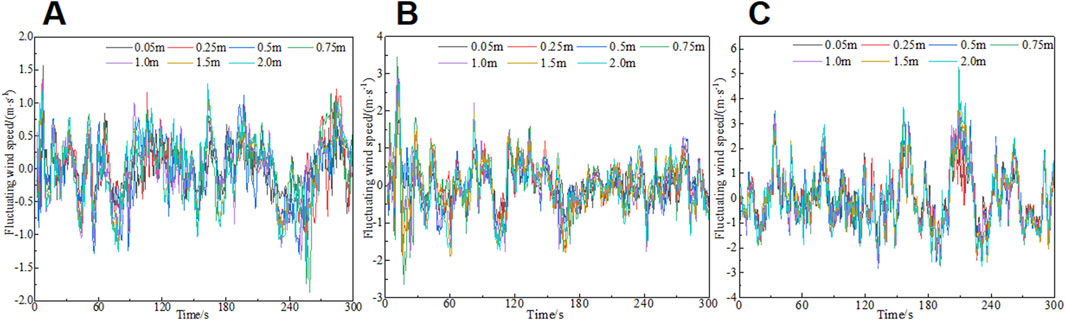
Figure 5. Fluctuating wind speed in different weather. (A) Clear-sky days (B) Blowing dust (C) Sandstorm.
3.1.1 Fluctuating wind speed in clear-sky days
As shown in Figure 5A, in clear-sky days, the fluctuation range of fluctuating wind speed in each height is close to each other and the fluctuation value is between −1.86 m/s and 1.57 m/s at different heights and periods. The fluctuation range of fluctuating wind speed at the height of 0.25 m and 2.0 m heights is −1.0 m/s∼1.35 m/s and −1.49 m/s∼1.3 m/s, respectively. The reason is that the instantaneous wind speed is generally low in clear-sky days, and the difference between average wind speed and instantaneous wind speed is small. The wind speed fluctuation shows a certain correlation at different heights, and the correlation coefficient is more than 0.7. Among them, the correlation coefficient of fluctuating wind speed at the height of 1.5 m and 2.0 m is as high as 0.96, while at the height of 0.25 m and 2.0 m is 0.73, indicating that the correlation of wind speed fluctuation between adjacent heights is particularly significant. The reason is that within a height range of 0.25 m above the cotton field surface, the airflow is strongly disturbed by the cotton field film, soil ridge, cotton seedlings, etc., the randomness of the instantaneous wind speed is significant, while the airflow at 2.0 m is less affected by the underlying surface.
3.1.2 Fluctuating wind speed in blowing dust
As shown in Figure 5B, in blowing dust, the fluctuation range of fluctuating wind speed at different heights and periods is between −2.64 m/s and 3.44 m/s, which is greater than the corresponding value of clear-sky days. The fluctuation range of fluctuating wind speed at the height of 0.25 m and 2.0 m heights is −1.175 m/s∼1.77 m/s and −1.645 m/s∼2.77 m/s, respectively. The correlation coefficient between the fluctuating wind speed at the heights of 1.5 m and 2.0 m is 0.95, while at the height of 0.25 m and 2.0 m is 0.76. The reason is that the instantaneous wind speed in the blowing dust is generally greater than that in the clear-sky days, and saltation sand particles in the airflow below 0.25 m have a certain degree of disturbance to the airflow, which weakens the correlation of fluctuating wind speed between the two heights.
3.1.3 Fluctuating wind speed in sandstorm
As shown in Figure 5C, in sandstorm, the maximum value of fluctuating wind speed reaches 5.28 m/s, and fluctuation range is the largest among the three kinds of weather. The fluctuation range of fluctuating wind speed at the height of 0.25 m and 2.0 m is −2.504 m/s∼3.461 m/s and −2.746 m/s∼ 5.279 m/s, respectively. The correlation coefficient between the fluctuating wind speed at 1.5 m and 2.0 m is 0.96, while at the height of 0.25 m and 2.0 m is 0.74. The reason is that the instantaneous wind speed (maximum wind speed is 13.63 m/s) in sandstorm is larger than that in clear-sky days and blowing dust, and high sand and dust concentration in the near-surface airflow. The sand particles movement weaken the speed fluctuation of the airflow, and the fluctuation range is reduced.
3.2 Wind direction fluctuation
During field observation in cotton field, the wind direction data at the height of 0.25 m and 2.0 m were selected to analyze the characteristics of wind direction fluctuation. As shown in Figure 6, the fluctuating wind direction at 0.25 m and 2.0 m has a good correlation in clear-sky days, blowing dust and sandstorm, and the fluctuating wind direction angle is close to each other. The fluctuating wind direction does not change significantly with height. The fluctuation range of fluctuating wind direction at each height is the largest in clear-sky days, followed by blowing dust, and the smallest in sandstorm.
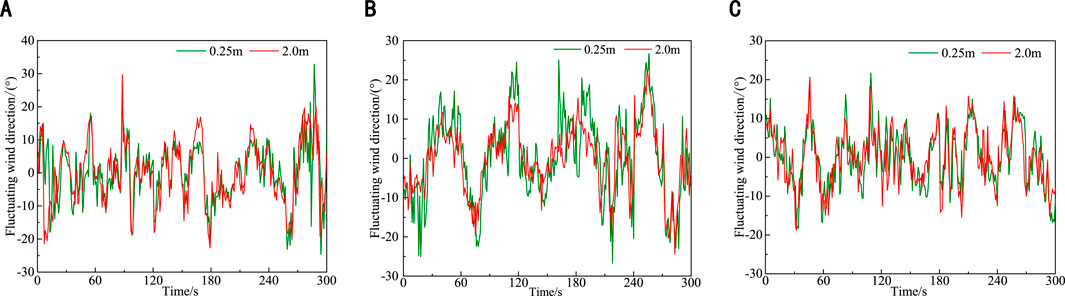
Figure 6. Fluctuating wind direction in different weather. (A) Clear-sky days (B) Blowing dust (C) Sandstorm.
In blowing dust, the fluctuation range of wind direction fluctuation at the height of 2.0 m is obviously smaller than that at 0.25 m, which indicates that the fluctuation range of wind direction fluctuation decreases with the increase of height. The reason is that the wind speed at the height of 0.25 m is small, and the airflow is easily dissipated by the influence of the surface fluctuation of the cotton field, resulting in a significant change in the wind direction, while there is a higher wind speed at 2.0 m, which is less affected by the underlying surface. In clear-sky days, the maximum value of fluctuating wind direction appears at the height of 0.25 m, and the fluctuation range of fluctuating wind direction at the height of 0.25 m and 2.0 m is close to each other. In sandstorm,the correlation of the wind direction fluctuation at the height of 0.25 m and 2.0 m is significant, indicating that the wind direction fluctuation has no significant change with the increase of height. The reason is that the average wind speed is high in sandstorm, and the local turbulence after the airflow passes through the cotton field is not enough to change the main wind direction, and the wind direction tends to be stable.
3.3 Wind speed fluctuation intensity and its relationship with average wind speed
It can be seen from Table 3 that the variation range of wind speed fluctuation intensity in clear-sky days, blowing dust and sandstorm is 0.249 m/s-0.716 m/s, 0.28 m/s-1.09 m/s and 0.766 m/s-1.364 m/s respectively, and the average fluctuation intensity is 0.466 m/s, 0.641 m/s and 1.086 m/s respectively, that is, the average fluctuation intensity of blowing dust and sandstorm is 1.375 times and 2.33 times that of clear-sky days respectively, indicating that sand particles have significant amplification effect on airflow disturbance. At the same time and height, the fluctuation intensity is the largest in sandstorm, followed by blowing dust, and the smallest in clear-sky days.
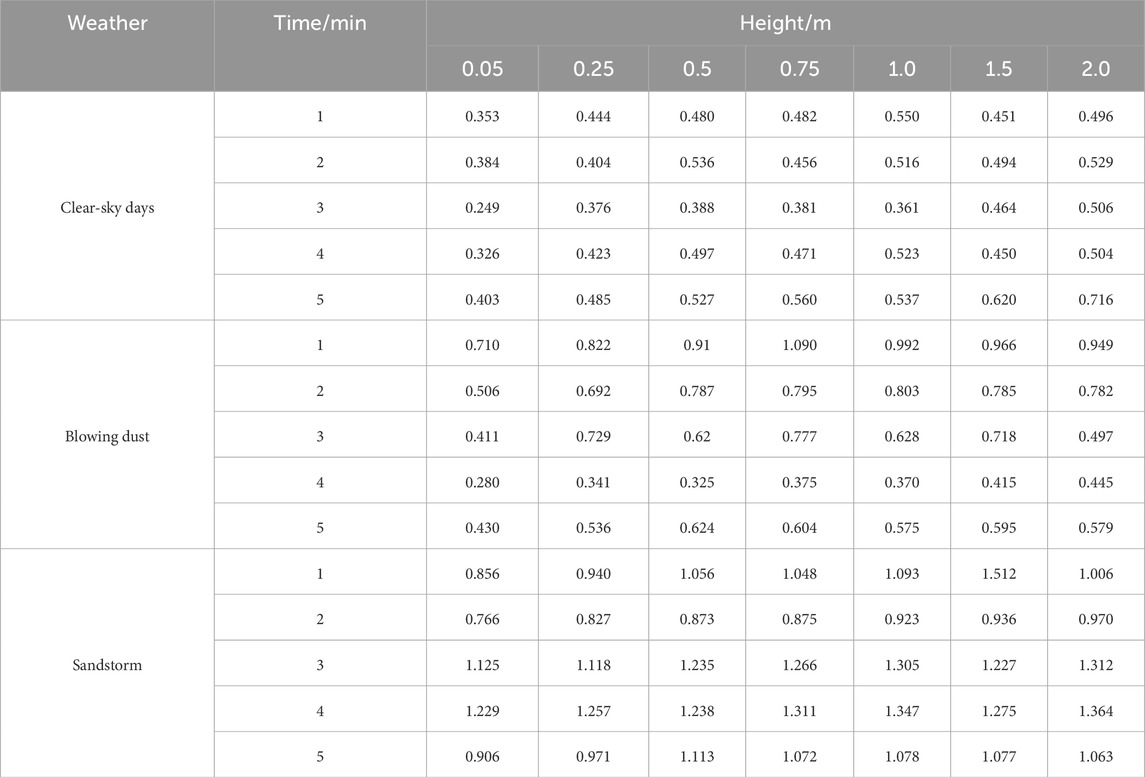
Table 3. Variation of wind speed fluctuation intensity with height in different weather (Unit:m·s-1).
The fluctuation intensity increases with the increase of height in three weather conditions. The fluctuation intensity shows a fluctuating increasing trend in clear-sky days, and increases steadily in blowing dust and sandstorm. This law is also consistent with the trend of fluctuating wind speed, which further confirms that the fluctuation range of instantaneous wind speed is the largest in sandstorm, and the fluctuation range of wind speed is the smallest in clear-sky days.
Figure 7 shows the relationship between fluctuation intensity and average wind speed in three kinds of weather. It can be seen that the fluctuation intensity is positively correlated with the average wind speed. The greater the average wind speed, the greater the wind speed fluctuation intensity, and the greater the fluctuation range of the fluctuating wind speed. There are differences in the slope and intercept of the fitting curve in three kinds of weather. The slope of blowing dust is the largest, followed by sandstorm, and the slope of clear-sky day is the smallest. It shows that when the average wind speed is the same, the fluctuation intensity of wind speed in blowing dust and sandstorm is greater than that in clear-sky days, which further shows that the fluctuation intensity of wind-sand flow is greater than that of pure airflow. This conclusion also verifies the essential difference of wind speed fluctuation characteristics between pure airflow field and wind-sand flow.
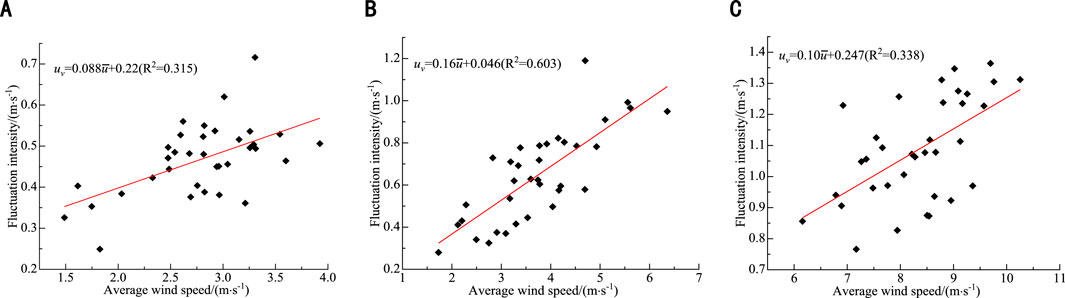
Figure 7. The relationship between fluctuation intensities and average wind speed.(A) Clear-sky days (B) Blowing dust (C) Sandstorm.
3.4 Turbulence intensity and its relationship with average wind speed
It can be seen from Table 4 that the turbulence intensity gradually decreases with the increase of height in different weathers and periods. In clear-sky days, blowing dust and sandstorm, the variation range of turbulence intensity is 0.112–0.25, 0.102–0.206, 0.102–0.178 respectively, and the average turbulence intensity is 0.171, 0.173, 0.14 respectively, which belongs to high turbulence intensity. The variation range of turbulence intensity in blowing dust and sandstorm is smaller than that in clear-sky days. The reason is that the sand particles have a disturbance effect on the airflow in the blowing dust and sandstorm. The sand concentration and the influence of moving sand on turbulence decreases with the increase of height.
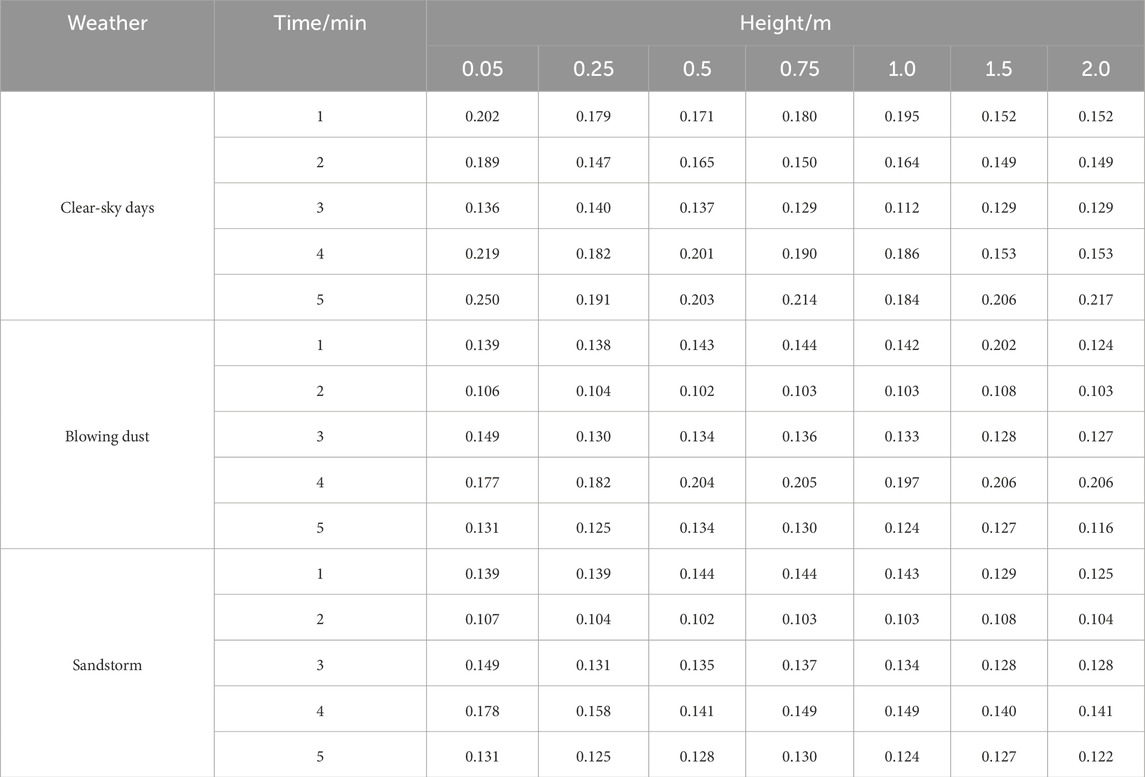
Table 4. Variation of turbulence intensity with height in different weather.
Figure 8 shows the relationship between turbulence intensity and average wind speed in three kinds of weather. Under the condition of low average wind speed, the distribution of turbulence intensity near the surface of cotton field shows obvious dispersion, and its variation range is wide. As the average wind speed increases, the range of turbulence gradually decreases. When the average wind speed exceeds 5.0 m/s, the turbulence intensity varies from 0.1 to 0.2, and the turbulence intensity distribution tends to be concentrated.
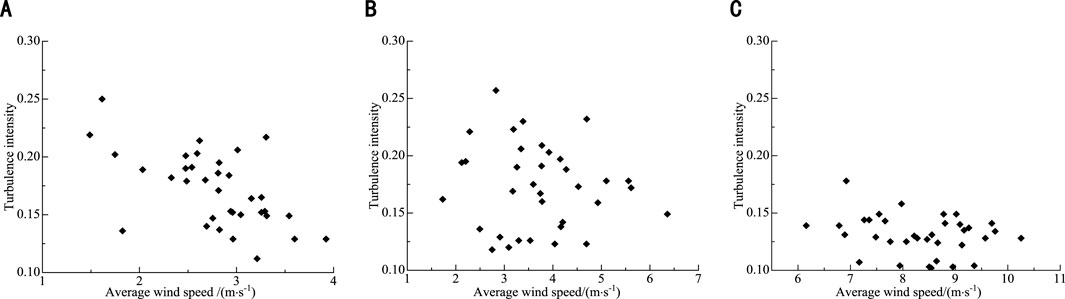
Figure 8. The relationship between turbulence intensity and average wind speed. (A) Clear-sky days (B) Blowing dust (C) Sandstorm.
4 Discussions
Through the analysis of the characteristics of near-surface wind speed fluctuation in Tumxuk cotton field in southern Xinjiang, it is found that the fluctuating wind speed at different heights has certain correlation in three kinds of weather, and the correlation of fluctuating wind speed at adjacent heights is more significant. The wind speed fluctuation and fluctuation intensity in sandstorm and blowing dust are greater than the corresponding values in clear-sky days, which is consistent with previous research conclusions (Mao et al., 2017; Zheng et al., 2019).
It is found that the fluctuation intensity of increases with the increase of height and average wind speed, which is different from the conclusion of Gao et al. (2017) that the fluctuation intensity decreases with the increase of height in both net wind field and wind-blown sand flow. There are two reasons. First, the research methods are different. Gao et al. (2017) are based on wind tunnel experiments, which have high airflow stability and good speed uniformity. However, this study adopts the field measurement, and the measurement data are easily affected by weather, equipment stability and other factors. Second, the spatiotemporal scales selected for the research are different. This paper analyzes the field wind speed data at a height range of 0.05 m–2.0 m near the surface for a period of 60 h, while Gao et al. (2017) selected the wind tunnel experimental data within a height range of 0.03 m–0.3 m near the sand bed for approximately 20 min. The above comparison shows that the characteristics of wind speed fluctuation are sensitive to the measurement environment, and the boundary condition control of wind tunnel experiment and the natural disturbance effect of field measurement are the main factors leading to the difference.
The wind speed fluctuation intensity in blowing dust and sandstorm is 1.375–2.33 times that of the clear-sky days, indicating that in sandstorm, the wind speed is large and the change is violent, the sand-carrying capacity of the wind-sand flow is enhanced, and the cotton seedlings are more vulnerable to the damage of the wind sand flow. From a global perspective, the optimal practices for wind control in different dryland farming regions vary depending on environmental and socio-economic conditions, but the core objective remains the same: reducing surface wind speed, increasing surface roughness, and stabilizing surface sand (Figure 9). The choice of specific measures is limited by regional resources (water, materials, capital investment) and economic level (mechanization level, land scale, labor costs) (Leys et al., 2008; Xiao et al., 2023). Considering the regional environmental characteristics of the desert oasis areas, it is recommended to adopt physical or biological protection measures, establishing a dual protection system around and within the cotton fields, including peripheral protective forests, internal windproof net, and windbreak straw (Zhang et al., 2016), in order to alleviate or control wind and sand disasters in the cotton fields (Figure 10). It should be noted that these protective measures have their own limitations in practice. For example, protective forests are constrained by water resources and the growth cycle (Fan et al., 2017), windproof nets have the drawbacks of aging and wear, as well as interference from farming activities (Dong et al., 2023; Maraveas, 2020), and windbreak straw face problems of raw material shortage and microbial degradation. Therefore, on the basis of a comprehensive assessment of regional conditions and various restrictive factors of protective measures, scientific decisions should be made and one or more measures should be flexibly combined and applied to achieve continuous and efficient wind-sand control effects.
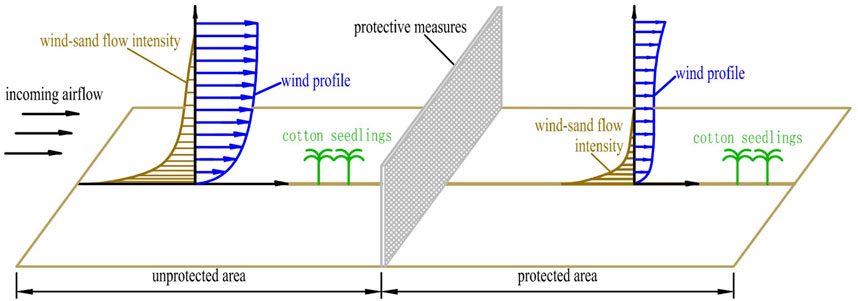
Figure 9. Protective mechanism of protective measures in cotton field.
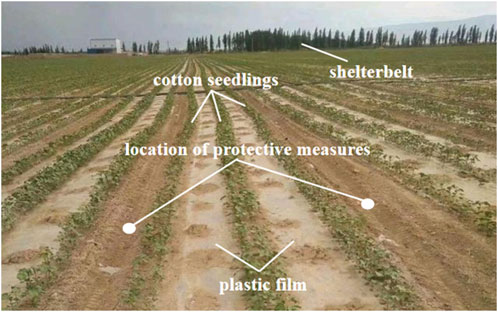
Figure 10. Layout of protective measures.
Furthermore, this study was limited by observation time, location and equipment conditions, and did not consider the interannual variation of wind speed fluctuation and the influence of heterogeneous underlying surface. In the future, it is necessary to conduct multi-scale and multi-source observations, combined with wind tunnel experiments and numerical simulations, to establish a near-surface wind-sand transport model in cotton fields, further revealing the universal laws of the impact of sand-dust weather on the near-surface wind field and its ecological-climate effects, and providing a theoretical basis for the prevention and control of wind-sand disasters in farmland in the desert oasis area.
5 Conclusion
Based on the field observation of near-surface wind speed and direction in cotton field in desert oasis, the average wind speed, fluctuating wind speed and direction, wind speed fluctuation intensity, turbulence intensity and other fluctuation characteristics of cotton field in clear-sky days, blowing dust and sandstorm were analyzed. The following conclusions are drawn:
In the height range of 0.25 m–2.0 m from the surface of cotton field, the average wind speed and fluctuating wind speed at each height increase with the increase of height. The wind speed fluctuation shows a certain correlation at different heights, and the correlation coefficient is greater than 0.70. The correlation of wind speed fluctuation between adjacent heights is particularly significant, and the correlation coefficient of fluctuating wind speed at 1.5 m and 2.0 m is greater than 0.90. The fluctuation range of fluctuating wind speed in the same period and height is the largest in sandstorm, followed by blowing dust, and the smallest in clear-sky days. The fluctuation range of fluctuating wind direction is the largest in blowing dust, followed by clear-sky days, and the smallest in sandstorm.
The fluctuation intensity of wind speed increases with the increase of height and average wind speed. The fluctuation intensity in the same period and at the same height is the largest in sandstorms, followed by blowing dust, and the smallest in clear-sky days. The average fluctuation intensity of blowing dust and sandstorm is 1.375 times and 2.33 times that of clear-sky days.
Turbulence intensity decreases with the increase of height and average wind speed, and it is the smallest in the sandstorm. With the increase of average wind speed, the variation of turbulence intensity decreases.
The research results quantified the significant impact of sand-dust weather on the near-surface turbulent structure of farmland, providing key parameters for the precise assessment of wind erosion risk in cotton fields and the optimization design of sand prevention measures. It also provided empirical evidence for regional sustainable development plans such as ecological co-protection and co-control in the core area of “The Belt and Road Initiative”.
Data availability statement
The original contributions presented in the study are included in the article/supplementary material, further inquiries can be directed to the corresponding author.
Author contributions
LG: Data curation, Writing – original draft, Writing – review and editing. JC: Writing – original draft, Writing – review and editing. XW: Data curation, Writing – review and editing. ZP: Data curation, Investigation, Writing – original draft.
Funding
The author(s) declare that financial support was received for the research and/or publication of this article. The author(s) declare that financial support was received for the research and/or publication of this article. This research was supported by the National Natural Science Foundation of China (12362035), the Guiding Science and Technology Program of Corps (2023ZD069) and the Interdisciplinary Research Program (JCYJ202317).
Conflict of interest
The authors declare that the research was conducted in the absence of any commercial or financial relationships that could be construed as a potential conflict of interest.
Generative AI statement
The author(s) declare that no Generative AI was used in the creation of this manuscript.
Publisher’s note
All claims expressed in this article are solely those of the authors and do not necessarily represent those of their affiliated organizations, or those of the publisher, the editors and the reviewers. Any product that may be evaluated in this article, or claim that may be made by its manufacturer, is not guaranteed or endorsed by the publisher.
References
Baidourela, A., Zhen, J., Zhayimu, K., Abulaiti, A., Ubuli, H., Trincone, A., et al. (2018). “Temporal and spatial variation of maximum wind speed days during the past 20 years in major cities of Xinjiang,” in The 6th International Conference on Biotechnology and Bioengineering (ICBB), Offenburg, Germany, 26–28 September 2017.
Butterfield, G. R. (1991). Grain transport rates insteady and unsteady turbulent air flows. Acta. Mech. Suppl. 1, 97–122. doi:10.1007/978-3-7091-6706-9_6
Butterfield, G. R. (1998). Transitional behaviour of saltation: wind tunnel observations of unsteady winds. J. Arid. Envion. 39 (3), 377–394. doi:10.1006/jare.1997.0367
Chen, S. Y., Du, S. K., Bi, H. R., Zhao, D., Zhang, Y., Chen, Y., et al. (2024). Review on identification and forecasting of dusty weather. J. Desert Res. 44 (1), 11–21. doi:10.7522/j.issn.1000-694X.2023.00054
Chen, X., Ye, X. L., Zhang, Y. C., and Xiong, X. (2025). Analysis of wind speed characteristics along a high-speed railway. Appl. Sci. 15, 138. doi:10.3390/app15010138
Dong, G. N., Chen, T. G., Ren, C. J., and Wang, K. (2023). Wind tunnel investigation of wind reduction effect under porous fences protection. J. Wind Eng. Ind. Aerod. 232 (Suppl. C), 105250. doi:10.1016/j.jweia.2022.105250
Fan, J. L., Wei, Y. P., Xu, X. W., and Yang, X. H. (2017). Effect of drip irrigation with saline water on the construction of shelterbelts for soil and groundwater protection in the hinterland of the Taklimakan Desert. China. Tecnol. Cienc. agua. 8 (2), 19–30. doi:10.24850/j-tyca-2017-02-02
Gao, L., Cheng, J. J., Wang, Y. S., Wang, Y., Wu, X., and Lei, J. (2023). Research progress on theory, prevention and control of wind-blown sand hazard of crops in Southern Xinjiang. J. Huazhong Agric. Univ. 42 (5), 64–71. doi:10.13300/j.cnki.hnlkxb.2023.05.008
Gao, Y. Q., Kang, L. Q., Zhang, J. J., Zou, X. Y., Zhang, C. L., and Cheng, H. (2017). Comparison of instantaneous horizontal wind velocity profile in aeolian sand transport and clean air. J. Desert Res. 37 (1), 48–56. doi:10.7522/j.issn.1000-694X.2015.00206
Hersbach, H., Bell, B., Berrisford, P., Hirahara, S., Horányi, A., Muñoz-Sabater, J., et al. (2020). The ERA5 global reanalysis. Q. J. R. Meteorological Soc. 146 (730), 1999–2049. doi:10.1002/qj.3803
Isazade, V., Isazade, E., Qasimi, A. B., and Serwa, A. (2023). Integrating passive and active remote sensing data with spatial filters for urban growth analysis in Urmia, Iran. Russ. J. Earth Sci. 23, 1–16. doi:10.2205/2023es000861
Isazade, V., Qasimi, A. B., and Isazade, E. (2022). Environmental dust effect phenomenon on the sustainability of urban areas using remote sensing data in GEE. Saf. Extreme Environ. 5 (1), 59–67. doi:10.1007/s42797-022-00067-z
Isazade, V., Qasimi, A. B., and Kaplan, G. (2021). Investigation of the effects of salt dust caused by drying of Urmia Lake on the sustainability of urban environments. J. Clean WAS . 2 (5), 78–84. doi:10.26480/jcleanwas.02.2021.78.84
Kang, L. Q., Zhang, C. L., and Zou, X. Y. (2023). Observation and simulation of aeolian process. Beijing: Science Press.
Leenders, J. K., van Boxel, J. H., and Sterk, G. (2005). Wind forces and related saltation transport. Geomorphology 71, 357–372. doi:10.1016/j.geomorph.2005.04.008
Leys, J., McTainsh, G., Strong, C., Heidenreich, S., and Biesaga, K. (2008). Dustwatch: using community networks to improve wind erosion monitoring in Australia. Earth Surf. Proc. Land 33 (12), 1912–1926. doi:10.1002/esp.1733
Li, J. X., Zhu, Y., Xu, J., and Yao, Y. (2023). A comparative study on the applicability of ERA-Interim and ERA5 reanalysis wind data in the coastal waters of China. Mar. Sci. Bull. 42 (3), 260–271. doi:10.11840/j.issn.1001-6392.2023.03.003
Li, Q. L., Cheng, X. L., Zeng, X. D., Zhou, G. Q., Huang, J., Wu, L., et al. (2022). Study of the air-sea momentum flux of the coastal marine boundary layer during typhoons. J. Geophys. Res-Atmos. 127, e2022JD036839. doi:10.1029/2022JD036839
Liu, J., Wang, Y., and Yang, B. (2012). Wavelet packet analysis of particle response toturbulent fluctuation. Adv. Powder Technol. 23, 305–314. doi:10.1016/j.apt.2011.04.002
Liu, X. Y., Zhang, C. L., Zhang, H., Dai, Y. J., Ceng, S. B., and Shen, Y. P. (2020). Characteristics of wind velocity pulsation and its relation to average wind velocity and friction wind velocity. Bull. Soil Water Conserv. 40 (5), 60–63. doi:10.13961/j.cnki.stbctb.2020.02.010
Mao, D. L., Cai, F. Y., Yang, Y. H., Lei, J. Q., Xue, J., and Lai, F. B. (2017). Wind speed fluctuation near ground surface over four typical underlying surfaces in Qira. Xinjiang. Arid. Zone Res. 34 (1), 126–135. doi:10.13866/j.azr.2017.01.17
Maraveas, C. (2020). The sustainability of plastic nets in agriculture. Sustainability 12 (9), 3625. doi:10.3390/su12093625
Ren, G. R. ., Liu, J. F., Wan, J., Li, F., Guo, Y. F., and Yu, D. R. (2018). The analysis of turbulence intensity based on wind speed data in onshore wind farms. Renew. energy 123, 756–766. doi:10.1016/j.renene.2018.02.080
Standardization Administration of China (2017). Classification of sand and dust weather. Beijing: Standards Press of China. (GB/T 20480-2017).
Wang, P., and Zheng, X. J. (2013). Fluctuating of wind-blown sand flux in field wind condition. J. Desert Res. 33 (6), 1622–1628. doi:10.7522/j.issn.1000-694X.2013.00241
Wang, X., Huang, J. P., Ji, M. X., and Higuchi, K. (2008). Variability of East Asia dust events and their long-term trend. Atmos. Env. 42 (13), 3156–3165. doi:10.1016/j.atmosenv.2007.07.046
Wang, X. M., Zhou, Z. J., and Dong, Z. B. (2006). Control of dust emissions by geomorphic conditions, wind environments and land use in Northern China: an examination based on dust storm frequency from 1960 to 2003. Geomorphology 81 (3/4), 292–308. doi:10.1016/j.geomorph.2006.04.015
Wang, X. Q., Lu, X. Y., Li, Q. L., Zhou, H. K., Li, C., and Zou, X. H. (2024). Study of the characteristics of the long-term persistence of hourly wind speed in Xinjiang based on detrended fluctuation analysis. Atmosphere 15, 37. doi:10.3390/atmos15010037
Xiao, L. G., You, Z. T., Zhang, H. F., Xie, Z. X., Zhao, R. Q., and Greenwood, P. (2023). Effects of conservation practices on global wind erosion control: evidence from experimental data. Land Degrad. Dev. 34 (14), 4386–4398. doi:10.1002/ldr.4784
Zhang, C. L., Li, Q., Zhou, N., Zhang, J. Q., Kang, L. Q., Shen, Y. P., et al. (2016). Field observations of wind profiles and sand fluxes above the windward slope of a sand dune before and after the establishment of semi-buried straw checkerboard barriers. Aeolian Res. 20, 59–70. doi:10.1016/j.aeolia.2015.11.003
Zhang, H., Zhang, C. L., Liu, X. Y., Dai, Y. J., Ceng, S. B., and Shen, Y. P. (2020). Characteristics of wind speed pulsation above a bare farmland surface. J. Desert Res. 40 (5), 57–64. doi:10.7522/j.issn.1000-694X.2020.00050
Keywords: wind speed fluctuation, fluctuation intensity, turbulence intensity, wind-sand flow, correlation, cotton fields
Citation: Gao L, Cheng J, Wu X and Pan Z (2025) Effects of sand-dust weather on wind speed fluctuation over near-surface of cotton fields in desert oasis area. Front. Earth Sci. 13:1609235. doi: 10.3389/feart.2025.1609235
Received: 10 April 2025; Accepted: 30 June 2025;
Published: 18 July 2025.
Edited by:
Prakash Kumar Jha, Mississippi State University, United StatesReviewed by:
Ying Zhu, Xi’an University of Architecture and Technology, ChinaMohamed A.E. AbdelRahman, National Authority for Remote Sensing and Space Sciences, Egypt
Copyright © 2025 Gao, Cheng, Wu and Pan. This is an open-access article distributed under the terms of the Creative Commons Attribution License (CC BY). The use, distribution or reproduction in other forums is permitted, provided the original author(s) and the copyright owner(s) are credited and that the original publication in this journal is cited, in accordance with accepted academic practice. No use, distribution or reproduction is permitted which does not comply with these terms.
*Correspondence: Jianjun Cheng, Y2hlbmdkZXNpZ25AMTI2LmNvbQ==