Abstract
Introduction:
Deep tight sandstone reservoirs exhibit significant heterogeneity in both reservoir quality and gas-bearing properties. Although research on the quality of tight sand-stone reservoirs has been relatively thorough, the relationship between the sedimentary-diagenetic-hydrocarbon accumulation processes experienced by different lithofacies and their gas-bearing properties remains to be further explored.
Methods:
This study focuses on the deep tight reservoirs of the He 8 Member of the Permian Shihezi Formation in the Huanjiang area of the Ordos Basin. By utilizing core samples, well logging data, and laboratory analysis, the basic characteristics of reservoir lithofacies were first analyzed. Subsequently, the distribution patterns of tight gas reservoir quality were clarified, and the controlling effects of sedimentary-diagenetic-hydrocarbon accumulation processes on gas-bearing properties were further investigated.
Results:
The study reveals that the He 8 Member reservoirs develop seven types of lithofacies, which can be categorized into two major groups: coarse-grained and fine-grained lithofacies. The overall porosity and permeability of the He 8 Member tight reservoirs are low, indicating dense reservoirs.
Discussion:
Due to significant differences in diagenetic processes between coarse-grained and fine-grained lithofacies, the coarse-grained lithofacies exhibit better physical properties. The fluid inclusion data suggest that natural gas may have preferentially migrated into coarse-grained, favorable lithofacies zones during the charging period, when the reservoirs were likely already in a relatively compacted state. This possible migration pattern could potentially lead to some degree of correlation between gas-bearing properties and reservoir quality, though further evidence is needed to confirm this relationship. The heterogeneity in gas-bearing properties of tight reservoirs is primarily controlled by the combined effects of lithofacies composition and structure, diagenetic processes, and the history of natural gas charging. This study proposes a geological model for the development of gas-bearing geological sweet spots controlled by favorable lithofacies. The sweet spot model has been validated through exploration practices and has guided the discovery of industrial gas flow wells.
1 Introduction
Tight sandstone gas reservoirs have become a crucial domain in global unconven-tional hydrocarbon exploration and development, making significant contributions to worldwide energy supply. Notably, deltaic sedimentary facies have also proven to be im-portant settings for the formation of productive tight sandstone gas reservoirs. Substantial discoveries with considerable resource potential and promising development prospects have been made in major basins including the Ordos Basin, Sichuan Basin, Tarim Basin, and Bohai Bay Basin (Cao et al., 2022; Yang et al., 2015; Dai et al., 2012), highlighting the global significance of these unconventional resources. Extensive research has been conducted on the controlling factors of gas-bearing properties in tight sandstone reservoirs (Yang et al., 2022; Wu et al., 2020; Wang et al., 2018; Deng et al., 2022; Yin et al., 2020). Among these factors, lithofacies have been consistently identified as one of the primary controls governing reservoir gas-bearing characteristics (Liu et al., 2020; Yang et al., 2022; Feng et al., 2021; Zhu et al., 2023). As rock units or associations formed under specific depositional en-vironments, lithofacies provide essential information about: the hydrodynamic conditions during clastic sedimentation, and the subsequent evolution of reservoir spaces during di-agenesis (Liu et al., 2020). This dual perspective makes lithofacies analysis particularly valuable for understanding and predicting gas accumulation in tight sandstone reservoirs.
The formation of tight sandstone gas reservoirs results from complex interactions among multiple geological processes, including depositional environment controls, diagenetic alterations, and hydrocarbon charging dynamics, which collectively lead to heterogeneous gas-bearing property distributions. The quality of a hydrocarbon reservoir is strongly controlled by the depositional and diagenetic facies nature. Therefore, building a precise geological depositional model of the reservoir rock is critical to reducing risks while exploring for petroleum (Elatrash et al., 2021).
While previous studies on tight reservoirs have employed macro- to microscopic analyses to investigate the influence of pore-throat characteristics on gas-bearing properties, there remains a limited comprehensive under-standing of how depositional-diagenetic-accumulation processes vary across different lithofacies and ultimately control gas-bearing characteristics. Thus, significant gaps still remain in understanding combination control of sedimentary facies and diagenetic process on sweet point of gas reservoirs for deep buried tight sandstones. In particular, the funda-mental controls of lithofacies on gas-bearing potential in tight sandstone reservoirs spanning from initial sediment deposition to final gas accumulation—require further systematic investigation.
The Ordos Basin, recognized as China’s most prolific tight gas production base, has recently achieved significant exploration breakthroughs in deep Upper Paleozoic tight sandstone gas reservoirs within its southwestern region, leading to the discovery of the large-scale Qingyang gas field (Fu et al., 2019; Meng et al., 2021). This basin serves as an ideal object for investigating lithofacies controls on reservoir quality and gas-bearing characteristics, owing to its well-developed depositional systems and pronounced reservoir heterogeneity. Compared with the extensively studied northwestern basin, fundamental geological research on Upper Paleozoic gas reservoirs in the southwestern Ordos Basin remains relatively insuffi-cient. Recent studies have revealed that deep tight sandstone gas reservoirs in this region exhibit strong heterogeneity and complex gas-water distribution patterns, resulting in substantial exploration and development challenges including low single-well productivity, significant inter-well production variations, and unexpected water production in gas wells (Zhang et al., 2016; Gao, 2020; Liu et al., 2023). These operational difficulties underscore that understanding the geological controls on gas reservoir distribution has become a critical factor for successful deep tight sandstone hydrocarbon exploration. This study focuses on the Permian Shihezi Formation (Member 8) in the Huanjiang area of the southwestern Ordos Basin. By integrating sedimentological, petrophysical, and gas content data, we systematically investigate how different lithofacies control gas-bearing characteristics in these deep tight sandstone reservoirs. The findings provide crucial insights for improving tight gas exploration efficiency and reservoir development strategies in similar geological settings.
2 Geological setting
The Ordos Basin is bounded by the Yinshan Mountains in the north, the Qinling Mountains in the south, the Lüliang Mountains in the east, and the Tengger Desert in the west. It is divided into six tectonic units: the Northern Shaanxi Slope, the Weibei Uplift, the Yimeng Uplift, the Western Shanxi Flexural Fold Belt, the Western Margin Thrust Belt, and the Tianhuan Depression (Guo et al., 2020). The Huanjiang area of the study area is located in the southwestern part of the Ordos Basin (Figure 1), in the northern part of Huan County, Gansu Province. Tectonically, it belongs to the western part of the Yishan Slope and the southern part of the Tianhuan Depression. The southeastern part of the study area is ad-jacent to the Qingyang Gas Field. The Upper Paleozoic tight sandstones in this area have great natural gas exploration potential (Wei et al., 2021). The Late Paleozoic strata in the study area are mainly composed of a set of clastic rock series in the transgressive-regressive facies, with a total sedimentary thickness of about 700 m. From bottom to top, the Benxi Formation of the Carboniferous System, the Taiyuan Formation, the Shanxi Formation, the Lower Shihezi Formation, the Upper Shihezi Formation, and the Shiqianfeng Formation of the Permian System are successively developed. Among them, the coal measure source rocks of the Benxi Formation, the Taiyuan Formation, and the Shanxi Formation continuously supply hydrocarbons to the overlying strata (Wang et al., 2016). The research object of this paper is the He 8 member of the Lower Shihezi Formation, which is the main gas-producing layer in this area. The He 8 Member can be classified as a third-order sequence, composed of a complete transgressive-regressive cycle (Xia et al., 2022). It is further subdivided into lowstand systems tract (LST), lacustrine transgressive systems tract (TST), and highstand systems tract (HST). The lower section of He 8 Member primarily consists of the lowstand systems tract, characterized by large-scale fluvial-dominated shallow-water delta distributary channel sand bodies. These deltaic sand bodies, through diagenetic processes and natural gas charging, form tight sandstone reservoirs.Previous studies have shown that during the Permian period, the sedimentary environment of the Ordos Basin was relatively warm and humid, and the depth of the lake water was about 20 m (Wang et al., 2018; Feng et al., 2021). The terrain slope in the study area is relatively gentle, large-scale faults are not developed, and the structure is stable. The strong hydrodynamic conditions are conducive to the transportation and deposition of a large amount of sedi-ments, providing favorable conditions for the development of shallow-water deltas (Zhu et al., 2021; Ma et al., 2021).
FIGURE 1

Geological setting of He 8 member in Huanjiang area, southwestern Ordos Basin. (a) Tectonic unit of Ordos Basin, with geographical location map of the Huanjiang area; (b) Upper Paleozoic strata comprehensive histogram.
The Upper Paleozoic tight sandstone reservoirs in the study area are deeply buried (3,500–4,500 m), classified as deep tight reservoirs. These reservoirs exhibit low porosity (average <7%), ultra-low permeability (average < 0.5 × 10⁻³ μm2), complex microscopic pore-throat structures, and diverse pore types (Li et al., 2021; Zhu et al., 2021). Recent hydrocarbon exploration has confirmed tight sandstone gas enrichment in the He 8 Member of the Shihezi For-mation, with multiple exploration wells demonstrating favorable gas-bearing potential. However, understanding of reservoir quality and gas-bearing properties in this interval remains preliminary, necessitating further systematic investigation.
3 Materials and methods
This study integrates drilling-logging data, cast thin sections, mercury injection capillary pressure (MICP) experiments, and fluid inclusion microthermometry analysis from the Permian Shihezi Formation (He 8 Member) in the Huanjiang area of the southwestern Ordos Basin. The multi-scale experimental approach is designed to systematically characterize reservoir pore characteristics, diagenetic evolution, and gas-bearing mechanisms in deep tight sandstone reservoirs.
3.1 Facies analysis
Lithofacies description and interpretation were conducted based on 71 m of sedimentary records from seven cored wells in the Huanjiang area. Core observations at a centimeter-scale resolution identified sedimentary structures, grain size distributions, and lithological compositions. These data were integrated with wireline logs (gamma ray, resistivity, and density) to establish lithofacies classification schemes. A total of 440 core plug samples were collected from the cored intervals for subsequent petrophysical and pore structure analyses.
3.2 Reservoir characterization
Forty standard thin sections (30 μm thickness) were prepared and analyzed under polarized light microscopy to quantify mineral compositions, pore types (intergranular, dissolution, microfractures), and diagenetic sequences (e.g., cementation, compaction, dissolution). Mercury injection capillary pressure (MICP) tests were performed on five representative core plugs (2.54 cm diameter) to determine pore-throat size distributions, capillary pressure curves, and reservoir connectivity. Fluid inclusion microthermometry was conducted on six sandstone samples containing gas-bearing inclusions. Homogenization temperatures and salinity measurements were used to reconstruct hydrocarbon charging timing and thermal conditions.
The study methodology follows three sequential components. First, identification of deep tight reservoir lithofacies types and characteristics through core analysis; second, evaluation of reservoir quality variations among lithofacies using petrophysical data; and finally, elucidation of lithofacies-specific deposi-tion-diagenesis-accumulation processes governing gas-bearing properties through hy-drocarbon accumulation history analysis. The findings provide crucial geological insights for deep Upper Paleozoic tight gas exploration in the southwestern Ordos Basin.
4 Results
4.1 Lithofacies types and characteristics
4.1.1 Lithofacies classification
Core observations from eight cored wells in the He 8 Member of the Shihezi For-mation, combined with sedimentary texture (grain size) and structural features. The lithofacies classification and nomenclature adhere to Miall’s sedimentological scheme (Miall, 1977), which emphasizes genetic interpretation through grain-size, sedimentary structure, and depositional process signatures. Sandstones are classified based on grain size: coarse-grained sandstone (500–2000 μm), medium-grained sandstone (250–500 μm), and fine-grained sandstone (62.5–250 μm), while siltystone and mudstone consists of particles <62.5 μm. The identification and classification of bedding structures in sedimentary rocks are based on the following criteria: the massive bedding has no visible internal layering, parallel lamination has fine-scale alignment, cross-bedding has inclined layers in the sanstone. Mud-clast-bearing sandstone is shown by mud clasts with grainsize larger than 2000 μm.
Seven dominant lithofacies types were identified (Table 1; Figure 2): Massive pebbly coarse sandstone, Massive coarse sandstone, Muddy pebble-bearing coarse sandstone, Cross-bedded medium coarse sandstone, Parallel-bedded medium-coarse sandstone, Cross-bedded fine sandstone, Massive to horizontally laminated mudstone.
TABLE 1
| Lithofacies Name | Code | Key characteristics | Genetic interpretation |
|---|---|---|---|
| Massive Pebbly Coarse Sandstone | Sg | Massive structure with quartzite pebbles, sporadic mud clasts, and chaotic/weak alignment. Grayish-white clay mineral cementation between grains. | Channel bar deposits in distributary channels, formed by rapid deposition under high-energy hydrodynamic conditions. |
| Massive Coarse Sandstone | Sm | Homogeneous coarse sandstone lacking bedding planes. Grayish-white clay mineral cementation between grains. | Channel bar deposits in distributary channels, deposited rapidly under strong hydrodynamic transport. |
| Mud-Clast-Bearing Coarse Sandstone | Smg | Homogeneous coarse sandstone with black mudstone rip-up clasts. No visible bedding. | Basal fill of distributary channels, associated with erosional processes during channel initiation. |
| Cross-Bedded Medium-Coarse Sandstone | Sc | Medium-coarse sandstone with well-developed inclined cross-bedding. | Formed by migrating dunes within distributary channels, reflecting periodic flow fluctuations. |
| Parallel-Bedded Medium-Coarse Sandstone | Sh | Medium-coarse sandstone with distinct horizontal stratification. | Deposited under high-energy, flat-bed conditions in distributary channels (upper flow regime). |
| Cross-Bedded Fine Sandstone | Sr | Fine sandstone with small-scale ripple cross-bedding. | Upper distributary channel or natural levee deposits, indicating low-energy ripple migration. |
| Massive to Horizontally Laminated Silty stone and Mudstone | M | Siltystone and Mudstone with plant debris fossils. Horizontal lamination or massive structure. | Overbank or abandoned channel deposits, formed under low-energy hydrodynamic conditions. |
Lithofacies classification table for the He 8 member in the Huanjiang area.
FIGURE 2

Core Photos of Typical Lithofacies in the He8 Member of the Huanjiang Area. (a) Well Qingshen-4: Massive pebbly coarse sandstone lithofacies, 4956.55 m. (b) Well Li-23: Massive pebbly coarse sandstone lithofacies, 4482.77 m. (c) Well Li-27: Massive muddy gravel bearing coarse sandstone lithofacies, 4284.23 m. (d) Well Li-23: Massive bedding coarse sandstone lithofacies, 4486.2 m. (e) Well Li-27: Cross-bedded medium-coarse sandstone lithofacies, 4282.27 m. (f) Well Li-23: Cross-bedded coarse sandstone lithofacies, 4481.19 m. (g) Well Qingshen-4: Parallel-bedded medium sandstone lithofacies, 4956.90 m. (h) Well Li-41: Cross-bedded fine sandstone lithofacies, 4581.8 m. (i) Well Li-27: Horizontal-bedded mudstone lithofacies, 4286.18 m.
4.1.2 Lithofacies characteristics
The Massive Pebbly Coarse Sandstone and Massive Coarse Sandstone (Figures 2a–d) are primarily composed of grayish-white, coarse-grained sandstone. The Sg lithofacies contains quartzite pebbles, while the Sm lithofacies occasionally exhibits mud clasts. Both lithofacies are texturally homogeneous, lack distinct bedding, and display massive struc-tures, typically occurring within channel bars in the central distributary channels. The Mud-Clast-Bearing Coarse Sandstone consists of grayish-white coarse-grained sandstone with black mudstone rip-up clasts, locally developed at the base of distributary channel fills. The Cross-Bedded Medium-Coarse Sandstone (Figures 2e,f) comprises medi-um-to-coarse-grained sandstone with well-developed cross-bedding. Mica or carbona-ceous laminations are observed along bedding planes, typically in the upper-middle sec-tions of distributary channels. The Parallel-Bedded Medium-Coarse Sandstone (Figure 2g) exhibits horizontal stratification parallel to bedding surfaces, with muscovite or carbona-ceous laminations, commonly found within channel bars.
The fine-grained lithofacies in the He 8 Member include the Cross-Bedded Fine Sand-stone and Massive to Horizontally Laminated Mudstone. The Sr lithofacies (Figure 2h), composed of dark gray fine-grained sandstone with ripple cross-bedding, occurs in the upper distributary channels or distal mouth bars. The M lithofacies (Figure 2i) consists of black mudstone with massive or horizontal laminations and plant debris, deposited in low-energy interdistributary bays with limited coarse clastic input.
4.2 Tight gas reservoir quality characteristics
4.2.1 Petrophysical property distribution
Statistical analysis of 440 porosity and permeability samples from seven cored wells in the Huanjiang area reveals that the He 8 Member tight reservoirs exhibit porosity ranging from 2% to 8% (average: 5.14%), with a maximum of 16.17% and minimum of 0.91%. Porosity values are predominantly concentrated between 4% and 6%, accounting for 35.14% of samples (Figure 3a). Permeability ranges from 0.002 to 17.57 mD (average: 0.42 mD), with 47.75% of samples falling within 0–0.1 mD (Figure 3b). Following reservoir classification standards, the He 8 Member is classified as ultra-low permeability to tight reservoirs.
FIGURE 3

Reservoir physical property distribution of He 8 member in Huanjiang area. (a) His-togram of porosity distribution frequency; (b) Histogram of permeability distribution frequency).
4.2.2 Pore system characteristics
Cast thin-section analysis of core samples from the He 8 Member reveals diverse pore types, including residual intergranular pores, intragranular dissolution pores, intercrys-talline pores, and microfractures (Figure 4). Residual intergranular pores represent pre-served primary intergranular porosity modified by long-term compaction and diagenesis, while intragranular dissolution pores are dominated by selective leaching of feldspar and lithic fragments, locally forming moldic pores that enhance storage capacity. Intercrystalline pores, developed between authigenic kaolinite crystals within dissolution voids, are genetically linked to feldspar dissolution processes (Zhu et al., 2020). Microfractures, primarily occur-ring within quartz grains, are associated with tectonic or diagenetic fracturing. Authigenic kaolinite, predominantly located within dissolution pores, forms through mesogenetic alteration correlated with feldspar dissolution.
FIGURE 4

Microscopic photos of He 8 member reservoir in the Huanjiang area. (a) Well Qingshen 3, 5262.35 m, lithic quartz sandstone; (b) Well Li 41, 4580.66 m, linear-concave-convex contact of particles; (c) Well Li 23, 4485.38 m, dissolution pores; (d) Well Qingshen 4, 4950.8 m, dissolution pores; (e) Well Li 23, 4469.95 m, quartz increase siliceous cementation; (f) Well Li 27, 4282.49 m, dissolution pore).
Mercury injection capillary pressure (MICP) experiments were integrated with cast thin-section observations to quantitatively characterize pore-throat systems in the He 8 Member reservoirs. Analysis of MICP data from the study area reveals displacement pressures ranging from 0.29 to 1.64 MPa(average: 0.73 MPa) and median pore-throat radii predominantly below 0.2 µm, indicating fine-scale pore-throat networks. Following the clastic reservoir throat classification standard (SY/T 6285—2011), the reservoirs are dominated by fine to micro throat types, reflecting tight pore-throat geometries. A strong positive correlation is observed between median pore-throat radius and permeability (Figure 5), underscoring throat size as a key control on fluid mobility in these low-permeability systems.
FIGURE 5
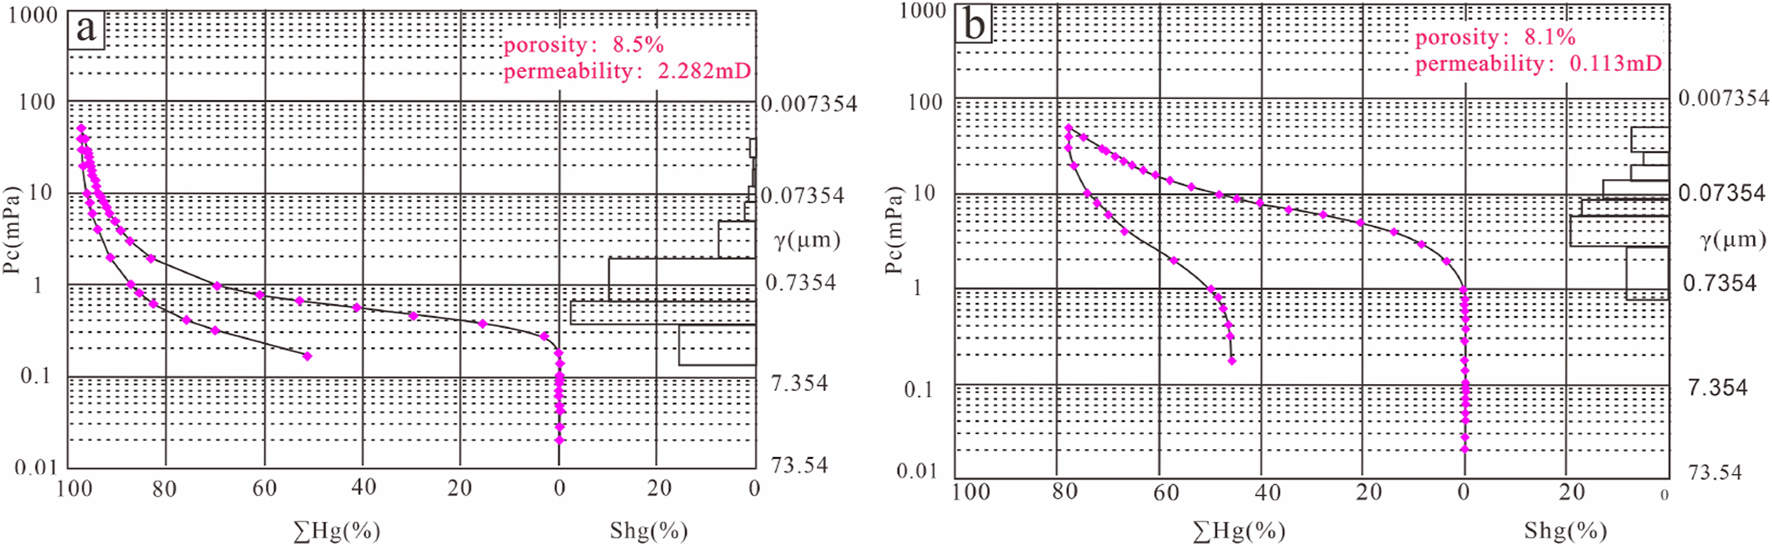
Mercury injection experiment analysis of He 8 member in the Huanjiang area. (a) Well Qingtan 6, 4430.37 m; (b) Well Qingtan 6, 4430.75 m).
4.2.3 Reservoir quality variations among lithofacies
Petrophysical analysis of the He 8 Member reveals significant reservoir quality differences across lithofacies. Core observations and cast thin-section petrography (Figure 6) demonstrate that pebbly coarse sandstone and massive coarse sandstone lithofacies within distributary channel bars exhibit well-developed dissolution porosity, representing the primary high-quality reservoir intervals. For instance, cast thin-section observations of Well QS-4 (Figure 7) reveal abundant dissolution pores in these lithofacies. In contrast, cross-bedded sandstone lithofacies, subjected to intense compaction, show reduced pri-mary intergranular porosity and limited dissolution pores, resulting in poorer reservoir quality.
FIGURE 6

Pebble-bearing coarse sandstone core photos and microscopic characteristics. (a) Well Qingshen 4, 4956.55 m, dissolution pores; (b) Well Qingshen 4, 4956.55 m, massive bedding grav-el-bearing coarse sandstone).
FIGURE 7

Physical property characteristics of different rock facies in Qingshen 4 well. (a) Rock facies reservoir physical property; (b,c) 4950.80 m; (d,e) 4952.24 m; (f,g). 4959.11 m).
Integrating qualitative lithofacies analysis with well-log interpretations and petro-physical data, statistical evaluation of Well QS-4 confirms that the pebbly coarse sand-stone lithofacies exhibits superior porosity-permeability properties, serving as the primary gas-bearing interval.
Furthermore, logging curve data are used to analyze the physical property differences of different lithofacies. Since the gamma ray logging value is closely related to the grain size of the reservoir and the sedimentary hydrodynamic force, and the acoustic transit time is closely related to the physical properties of the reservoir, these two curves are selected for crossplot analysis, which has a good effect on distinguishing different lithofacies. According to the logging identification results of lithofacies in five cored wells, it is found that the coarse-grained lithofacies have the characteristics of low gamma ray values and high acoustic transit times (Figure 8), indicating that this type of lithofacies has a low shale content and good reservoir physical properties. This statistical rule shows that lithofacies are closely related to the development of high-quality reservoirs. At the same time, it also shows that in the non-cored well sections, using logging curves to identify lithofacies can effectively help determine the development locations of high-quality reservoirs.
FIGURE 8

Development characteristics of different lithofacies through cross plot of well logging.
4.3 Lithofacies-controlled diagenesis and gas accumulation processes
4.3.1 Diagenetic heterogeneity across lithofacies
According to the statistical analysis of the identification data of cast thin sections in the study area, the reservoirs in the He 8th interval as a whole have undergone long-term diagenetic transformation and reached the mesodiagenetic stage (Li et al., 2022). The development of compaction and cementation in the reservoirs has led to severe destruction of the original intergranular pores. During the diagenetic process of the reservoirs, influenced by the coal measure source rocks and entering the mesodiagenetic stage, the acidic substances in the diagenetic fluids interact with the rocks (Liu et al., 2023). In the acidic diagenetic environment, feldspar lithic dissolution, quartz overgrowth, and authigenic kaolinite precipitation occur, generating secondary dissolution pores that provide storage spaces for natural gas. Further analysis reveals that there are significant differences in the diagenesis of different lithofacies. The genetic mechanism of the densification of tight sandstone gas reservoirs has always drawn much attention (Yu et al., 2015). Generally, it is believed that compaction is the main cause of reservoir densification (Xia et al., 2020), while cementation is a secondary cause. Among the many factors controlling reservoir quality, the rock structure and composition have the most significant control over compaction, thus having a greater impact on reservoir quality (Zhao et al., 2023; Chang et al., 2023). The controlling effect of the lithofacies in the He 8th interval on reservoir quality is mainly reflected in the differences in the rock particle structure and composition. These differences determine the original pores of the reservoir and the pore changes after subsequent diagenesis. During the sedimentation process, if the hydrodynamic force is strong, a coarse-grained lithofacies with a low shale content will be formed. Although there is compaction in the later stage, the amount of pore reduction due to compaction is relatively small, and some pores are preserved. Under the influence of dissolution, secondary pores are formed (Zhao et al., 2023). In the dissolution stage, the dissolution intensity of the coarse-grained lithofacies is relatively high. Mainly after entering the mesodiagenetic stage, some pores are preserved in the rocks, which can accommodate more acidic fluids to enter and contact the rock components, resulting in the development of reservoir dissolution mainly in the coarse-grained lithofacies (Figures 9a,c).
FIGURE 9

Comparison of Diagenetic Differences in Different Lithofacies of Typical Wells in the He8 Member of the Huanjiang Area. (a) Well Li-23: Diagenetic characteristics of massive coarse sandstone lithofacies, 4486.2 m. (b) Well Li-23: Diagenetic characteristics of cross-bedded medium sandstone lithofacies, 4470.66 m. (c) Well Li-23: Core photo of massive coarse sandstone lithofacies, 4486.2 m. (d) Well Li-23: Core photo of cross-bedded medium sandstone lithofacies, 4470.66 m.
Conversely, when the hydrodynamic force is weak during the sedimentation process and a cross-bedded sandstone lithofacies is formed, the shale content within the reservoir is relatively high, and the particles are distinctly arranged in a directional manner. This leads the reservoir to undergo a relatively strong process of pore reduction due to compaction, significantly decreasing the reservoir quality. During the mesodiagenetic stage, fine-grained lithofacies are more susceptible to the influence of compaction, and the original intergranular pores within them are severely damaged. As a result, it is difficult for acidic fluids to penetrate into the interior of the fine-grained lithofacies in the later stage. Therefore, the transformation by dissolution is relatively weak (Figures 9b,d), which is also the reason why it is difficult for some fine-grained lithofacies to form high-quality reservoirs.
Through the analysis of rock sorting coefficients and thin-section porosity, combined with quantitative calculation methods (Beard and Weyl, 1973; Ehrenberg, 1989; Scherer, 1981), the porosity evolution was evaluated, including primary porosity, post-compaction porosity, post-cementation porosity, and dissolution porosity. The porosity loss due to compaction and the porosity contribution from dissolution were systematically calculated. In coarse-grained lithofacies (Well Qs4), thin-section analysis and calculations of representative samples revealed an average primary porosity of 36.5%. Compaction reduced porosity by 27%, while cementation during eodiagenetic stage B and mesodiagenetic stage A further decreased porosity by 3.5%. Dissolution during the mesodiagenetic stage increased porosity by 6%, resulting in a current porosity of 12%. In cross-bedded fine sandstone lithofacies (Well L23), initial reservoir space accounted for 35% of the volume. Compaction led to a porosity reduction of 30.5%, followed by a 2% decrease due to cementation by silica, illite, and minor carbonate minerals during the mesodiagenetic stage. Dissolution in the mesodiagenetic stage contributed a 1.5% porosity increase, yielding a final reservoir space of 6.0%. The quantitative assessment highlights the dominant control of compaction on porosity reduction, while dissolution serves as a critical secondary process for porosity enhancement, with the net reservoir quality being ultimately determined by the balance between these competing diagenetic mechanisms. The coarse-grained lithofacies exhibits more pronounced dissolution effects and relatively weaker compaction-induced porosity reduction, which is conducive to better porosity preservation.
4.3.2 Tight sandstone gas charging history
Inadequate delineation of reservoir-heterogeneities, along with charge-timing confirmation, can considerably mislead exploration-development phases of petroleum (Abdelwahhab et al., 2022). Determining hydrocarbon charging history is critical for understanding gas accumulation processes and distribution patterns in tight sandstone reservoirs.
In the Ordos Basin, the studied tight gas reservoirs are primarily sourced from two coal-measure source rocks: the Taiyuan Formation and Shanxi Formation, with hydro-carbon generation intensities ranging from 12 to 24 × 108 m3/km2 (Jiang et al., 2023; Mi and Zhu, 2021). Multiphase tectonic events in the study area have developed fault systems that serve as vertical migration pathways for natural gas. To constrain the gas charging timing, fluid inclusion microthermometry was performed on gas-bearing reservoir samples from Wells QS-4, L-81, and L-23 in the He 8 Member, integrated with burial history reconstruction.
Analytical results reveal that quartz grains in the He 8 Member tight sandstones commonly exhibit 1–3 sets of fractures, including transgranular fractures and fractures terminating at grain boundaries. Quartz overgrowths are well-developed, with secondary inclusions (3–15 μm in size) observed within these overgrowths under plane-polarized light (Figures 10a–d). These inclusions are dominantly two-phase (gas-liquid) with va-por-to-liquid ratios of 5%–20%, primarily hosted within quartz overgrowths.
FIGURE 10

The microscopic characteristics of fluid inclusions in He8 Member of the Huanjiang area, (a,b) photos of fluid inclusions in Qingshen 4 well, (c,d) photos of fluid inclusions in Li 81 well 4656.56 m.
Microthermometric analysis of aqueous inclusions across sampled intervals in the He 8 Member reveals homogenization temperatures (Th) ranging from 105°C to 149°C, with dominant peaks at 120°C–135°C. In Well QS-4, Th values vary by depth: 105°C–145°C (peak 115°C–120°C) at 4,949.34 m, 120°C–145°C (peak 130°C–135°C) at 4,952.24 m, 110°C–145°C (peak 125°C–130°C) at 4,955.32 m, and 110°C–140°C (peak 125°C–130°C) at 4,957.34 m. Well L-81 (4,656.56 m) shows Th of 120°C–132°C (peak 125°C–130°C), while Well L-23 (4,483.4 m) exhibits Th of 115°C–149°C (peak 130°C–135°C). These data, statistically clustered in the 120°C–135°C range (Figure 11), correlate with mesodiagenetic conditions and constrain the timing of gas charging events in the Huanjiang area’s tight sandstone reservoirs.
FIGURE 11

Histogram of homogenization temperature of fluid inclusions at different depths, (a) Well Qingshen 4, 4949.34 m, (b) Well Qingshen 4, 4952.24 m, (c) Well Qingshen 4, 4955.32 m, (d) Well Qingshen 4, 4957.34 m, (e) Well Li 81, 4656.56 m, (f) Well Li 23, 4483.4 m.
Integrated analysis of single-well burial history and thermal history modeling (Cao et al., 2015), combined with aqueous inclusion homogenization temperature (Th) data, constrains the gas charging and accumulation timing to 160–150 Ma (Late Jurassic to Early Cretaceous; Figure 12). During this period, reservoir burial depths ranged between 3,000 and 4,000 m, with reservoirs undergoing simultaneous densification via prolonged compaction and compaction-induced porosity reduction. The primary intergranular pores experienced sequential diagenetic modifications: compaction, cementation, and dissolution-enhanced porosity, resulting in strong reservoir heterogeneity. These processes align with the “den-sification during accumulation” model, where reservoir tightening occurred concurrently with gas migration. Based on prior studies (Chen et al., 2022), the gas charging and accumulation pro-cesses in the He 8 Member were likely significantly influenced by reservoir quality hetero-geneity, with preferential gas migration into coarse-grained, dissolution-enhanced litho-facies.
FIGURE 12

Burial history of the Upper Paleozoic and hydrocarbon charging history of He 8 member in Huanjiang area.
5 Discussion
5.1 Lithofacies-controlled gas-bearing mechanisms in tight sandstone reservoirs
The formation mechanism of tight sandstone gas reservoirs is complex (Zou et al., 2018). Compared with conventional gas reservoirs, the distribution pattern of their gas layers is more complex and changeable. Clarifying the main controlling factors for the enrichment of tight sandstone gas reservoirs is of great significance for the exploration and development of gas reservoirs. During the reservoir formation process of tight sandstone gas, the physical properties of the reservoir determine the charging resistance of natural gas, and thus affect the enrichment degree of natural gas (Wang et al., 2024). Existing studies have shown that sedimentation and diagenesis have a comprehensive controlling effect on reservoir quality (Du et al., 2024; Guo et al., 2023; Qin et al., 2024), and a deeper understanding of the genesis of the development of high-quality tight sandstone reservoirs has been achieved (Li et al., 2024). On this basis, this study comprehensively considers the sedimentation process, the diagenetic densification process, and the natural gas reservoir formation process, and discusses the controlling effect of different lithofacies on gas-bearing properties, with the aim of providing a reliable geological basis for the prediction of favorable reservoirs.
Through the correlation analysis of the reservoir interpretation results and reservoir physical properties of the He 8 interval in the study area (Figure 13), it can be seen that there is a significant correlation between the gas-bearing property of the reservoir and the reservoir physical properties. The reservoir porosity of most gas layers and poor gas layers is greater than 4%, and the permeability is greater than 0.1mD. In comparison, the reservoir physical properties of dry layers are poor. This indicates that higher porosity and permeability have an obvious controlling effect on the gas-bearing differences (Figure 13). From the analysis of single wells, high-quality reservoirs with good gas-bearing properties are mainly developed within the dominant coarse-grained lithofacies (Figure 14).
FIGURE 13

Crossplot of porosity and permeability of reservoirs with different well log interpretation.
FIGURE 14

Comparison of reservoir lithofacies interpretation and gas-bearing layer interpretation for Well Su307.
Tight gas reservoirs exhibit strong heterogeneity due to the distribution of sedimentary facies belts, as well as destructive diagenetic processes like reservoir compaction and cementation. In continuous sandbodies, some sandbodies influenced by the sedimentation process, have the development of dominant lithofacies and possess relatively good reservoir physical properties. However, other sandbodies have poor physical properties. Also, affected by the sedimentation process, reservoirs with good physical properties are often unconnected and are distributed in an isolated manner. During the subsequent migration and charging of natural gas, the reservoir has already reached the mesodiagenetic stage and undergone a relatively long densification process, which leads to significant differences in reservoir quality among different lithofacies. According to porosity analysis, during the natural gas charging period, coarse-grained lithofacies exhibit larger grain size and better sorting compared to other lithofacies, resulting in larger pore radii and superior pore connectivity. Based on the capillary pressure formula (Pc = 2γcosθ/r), the displacement pressure (Pc) is inversely proportional to the pore radius (r), which naturally leads to lower displacement pressure in coarse-grained lithofacies. Due to significantly lower displacement pressure than fine-grained lithofacies, coarse-grained lithofacies become preferential pathways for natural gas charging and serve as high-quality reservoirs. Consequently, the differences in the lithofacies structure and composition of the tight reservoirs in the He 8th interval, the reservoir diagenesis, and the natural gas charging history collectively determine the differences in the gas-bearing properties of the reservoirs.
The influence of favorable rock on gas reservoir distribution is analyzed by gas reservoir anatomy. The gas reservoir profile shows that the tight gas reservoirs in the study area are mainly developed in sandstone lens traps (Figure 15). The distribution of gas reservoirs is not obviously related to the structure, but is closely related to the distribution of rock facies. Taking Li 23 well area as an example, the reservoir of He 8 member in this area has the condition of natural gas accumulation, but the gas reservoir is not contiguous distribution, but local development. Coarse-grained favorable rock facies such as pebbly coarse sandstone or massive coarse sand-stone are usually the main development sites of natural gas reservoirs, while other rock facies are mostly dry layers. The formation of this distribution pattern may be related to the migration process of natural gas accumulation period. In the process of migration, natural gas is preferentially filled to the parts with developed dominant rock facies and good reservoir physical properties to form natural gas reservoirs. In the sand body at the edge of the channel sand dam, due to the tight reservoir, the natural gas filling is blocked, and it is difficult to continue to migrate upward along the channel, which eventually leads to the development of dry layers in some sand bodies.
FIGURE 15

Characteristics of gas reservoir profile with Well Li41-Li20.
5.2 Geological model of favorable lithofacies controlling gas-bearing reservoir properties
This study proposes a dominant lithofacies-controlled sweet spot model (Figure 16) for gas-bearing heterogeneity in the He 8 tight sandstone reservoirs, where depositional processes under sedimentary facies constraints formed distinct coarse- and fine-grained lithofacies. Post-burial compaction drastically reduced porosity, driving reservoir densification and amplifying heterogeneity. Burial-porosity evolution and hydrocarbon accumulation analyses indicate that during the Late Jurassic-Early Cretaceous, the He 8 Member and underlying coal-measure source rocks established a lower-source-upper-reservoir system, initiating gas charging. Dominant lithofacies with favorable petrophysical properties served as preferential migration pathways and storage spaces, while non-dominant lithofacies restricted gas charging due to ultra-low permeability. Sedimentary microfacies controlled sandbody geometry, lithofacies distribution, and reservoir quality, directly governing gas-bearing potential during charging and forming lens-shaped sweet spots. This model demonstrates that deposition-diagenesis-accumulation processes in lithofacies collectively dictate reservoir quality and gas enrichment patterns. The industrial gas flow test results from Qs4, Well Li23, and Su307 demonstrate natural gas productivity, serving as key evidence for geological “sweet spots”. Well Qs 4 yielded a stable industrial flow of 11,000 m3/day. Well Li23 confirmed reservoir deliverability with a tested rate of 1.1 × 10⁴ m3/d. Well Su307 exhibited high-yield potential, producing10.24 × 104 m3/d. These results not only verify gas-bearing potential but also provide critical criteria for sweet spot targeting in future exploration. From the data from these gas production wells, gas-enriched coarse-grained lithofacies must meet key economic development criteria including permeability >0.5 mD and effective thickness >5 m. Next-phase research will integrate hydraulic fracturing simulations to optimize target zone selection. The research findings are primarily based on test data from the local wells located in favorable zones. The high-yield conclusions may not be directly applicable to peripheral areas with different geological conditions. For application in other blocks, comprehensive evaluation incorporating local seismic data and core analysis is recommended to mitigate exploration risks.
FIGURE 16

The distribution pattern of gas-bearing difference in sand body of He 8 member in the study area. (a) Distribution of differential lithofacies after sandstone Deposition, (b) Natural gas charging model after reservoir diagenesis and tightening, (c) Differential diagenetic evolution and gas-bearing property variations among different lithofacies.
6 Conclusion
This study utilizes drilling data and analytical test results from the deep tight reservoirs of the He 8 Member in the Huanjiang area, southwestern Ordos Basin, to systematically characterize reservoir lithofacies, clarify the distribution and dominant controls of reservoir quality, and evaluate the role of lithofacies-controlled heterogeneity in gas-bearing properties. The findings provide critical geological insights for deep tight gas exploration in the Ordos Basin, yielding three key conclusions:
(1) The reservoir rocks in the eighth interval of the He Formation are diverse in lithofacies, which can be divided into two categories: coarse-grained and fine-grained. The res-ervoir mainly develops seven main lithofacies, including massive gravel-bearing coarse sandstone, massive coarse sandstone, coarse sandstone with mud clasts, cross-bedded medium-coarse sandstone, parallel-bedded medium-coarse sandstone, cross-bedded fine sandstone, and massive-horizontal bedded mudstone. The coarse-grained lithofacies mainly develop within the distributary channel sandbars, and the hydrodynamic force was relatively strong during the sedimentation period.
(2) Controlled by the differences in lithofacies and diagenesis, the reservoir quality of the eighth interval of the He Formation shows obvious variations. The petrological characteristics of the reservoir are mainly dominated by lithic sandstone and lithic quartz sandstone, and it mainly develops low-porosity-ultra-low-porosity and ultra-low-permeability-ultra-ultra-low-permeability tight gas reservoirs. The fine-grained lithofacies have experienced significant compaction-induced pore reduction, resulting in poor pore development. In contrast, the coarse-grained lithofacies develop more pores through dissolution, leading to relatively better reservoir quality of the coarse-grained lithofacies.
(3) The sedimentation-diagenesis-reservoir formation processes of lithofacies jointly control the gas-bearing differences in deep tight reservoirs. During the natural gas charging period, pores are still preserved within the coarse-grained lithofacies, which is conducive to the enrichment of natural gas. Due to the heterogeneity of the reservoir, the gas-bearing property of the reservoir is closely related to the reservoir quality, and gas reservoirs are more likely to develop in reservoirs where favorable lithofacies are developed. In the continuous distributary channel sandbodies, reservoirs with favorable lithofacies development form the enrichment of lenticular gas reservoirs. By combining the formation and preservation mechanisms of the reservoir and the development characteristics of gas reservoirs, a gas reservoir development model mainly controlled by lithofacies has been established.
Statements
Data availability statement
The original contributions presented in the study are included in the article/supplementary material, further inquiries can be directed to the corresponding author.
Author contributions
XW: Data curation, Funding acquisition, Investigation, Writing – original draft. ZC: Investigation, Project administration, Visualization, Writing – review and editing. ZS: Data curation, Formal Analysis, Validation, Writing – review and editing. YB: Investigation, Methodology, Project administration, Writing – review and editing. ZL: Data curation, Formal Analysis, Visualization, Writing – review and editing. PL: Formal Analysis, Methodology, Resources, Writing – review and editing. LD: Formal Analysis, Methodology, Software, Writing – review and editing. ZW: Formal Analysis, Funding acquisition, Investigation, Writing – review and editing.
Funding
The author(s) declare that no financial support was received for the research and/or publication of this article.
Conflict of interest
Authors XW, ZC, ZS, YB, and ZL were employed by PetroChina Changqing Oilfield Company.
The remaining authors declare that the research was conducted in the absence of any commercial or financial relationships that could be construed as a potential conflict of interest.
Generative AI statement
The author(s) declare that no Generative AI was used in the creation of this manuscript.
Publisher’s note
All claims expressed in this article are solely those of the authors and do not necessarily represent those of their affiliated organizations, or those of the publisher, the editors and the reviewers. Any product that may be evaluated in this article, or claim that may be made by its manufacturer, is not guaranteed or endorsed by the publisher.
References
1
Abdelwahhab M. A. Radwan A. A. Mahmoud H. Mansour A. (2022). Geophysical 3D-static reservoir and basin modeling of a Jurassic estuarine system (JG-Oilfield, Abu Gharadig basin, Egypt). J. Asian Earth Sci.225, 105067. 10.1016/j.jseaes.2021.105067
2
Beard D. C. Weyl P. K. (1973). Influence of texture on porosity and permeability of unconsolidated sand. AAPG Bull.57 (2), 349–369. 10.1306/819a4272-16c5-11d7-8645000102c1865d
3
Cao Q. Gao J. M. Fan L. Y. Pang C. X. Yu J. Z. (2015). Characteristics and significance of fluid inclusions in upper paleozoic of southwest ordos basin. Nat. Gas. Geosci.26, 2245–2253. 10.11764/j.issn.1672-1926.2015.12.2245
4
Cao Y. C. Yuan G. H. Yang H. J. Wang Y. Z. Liu K. Y. Zan N. M. et al (2022). Current situation of oil and gas exploration and research progress of the origin of high-quality res-ervoirs in deep-ultra-deep clastic reservoirs of petroliferous basins. Acta Pet. Sin.43, 112–140. 10.7623/syxb202201010
5
Chang Y. Liu M. J. Zhang Z. Ye S. J. Yang Y. T. Wu L. et al (2023). Quantitative simulation of the densification process of sandstone reservoir in the Xu 3 member of Xujiahe Formation in western Sichuan Depression, Sichuan Basin. Bull. Geol. Sci. Technol.42, 311–323. 10.19509/j.cnki.dzkq.2022.0177
6
Chen J. Feng C. J. Yu T. J. Chen G. Tang M. M. Sun M. S. (2022). The lower limit of physical properties of tight reservoir in He 8 Member of Y113-Y133 gas well area, Yanchang Gas Field, Ordos Basin. Nat. Gas. Geosci.33, 955–966. 10.11764/j.issn.1672-1926.2022.02.003
7
Dai J. X. Ni Y. Y. Wu X. Q. (2012). Tight gas in China and its significance in exploration and exploitation. Pet. Explor. Dev.39, 277–284. 10.1016/s1876-3804(12)60043-3
8
Deng J. Liu M. Ji Y. Tang D. Zeng Q. Song L. et al (2022). Controlling factors of tight sandstone gas accumulation and enrichment in the slope zone of foreland basins: the Upper Triassic Xujiahe Formation in Western Sichuan Foreland Basin, China. J. Pet. Sci. Eng.214, 110474. 10.1016/j.petrol.2022.110474
9
Du G. C. Liu J. F. Guo R. L. Li Y. L. Yin H. R. Huang X. Y. et al (2024). The development characteristics and influencing factors of high-quality reservoirs in the 8th member of Shihezi Formation in the eastern Ordos Basin. Nat. Gas. Geosci., 1–15. 10.11764/j.issn.1672-1926.2024.08.007
10
Ehrenberg S. N. (1989). Assessing the relative importance of compaction processes and cementation to reduction of porosity in sandstones: discussion; compaction and porosity evolution of Pliocene sandstones, Ventura Basin, California: Discussion. AAPG Bull.73 (10), 1274–1276. 10.1306/44b4aa1e-170a-11d7-8645000102c1865d
11
Elatrash A. M. Abdelwahhab M. A. Wanas H. A. El Naggar S. I. Elshayeb H. M. (2021). Multi disciplinary approach to sedimentary facies analysis of Messinian Salinity Crisis tectono sequences (South Mansoura Area, Nile Delta): incised valley fill geological model reconstruction and petroleum geology–reservoir element delineation. J. Petroleum Explor. Prod. Technol.11 (4), 1643–1666. 10.1007/s13202-021-01124-2
12
Feng C. Melnyk S. Ross C. Shanley K. Zonneveld J. P. Gingras M. K. (2021). Lithofacies-dependent pore-throat radii and reservoir properties in the lower Triassic Montney for-mation, Puskwaskau Field, Alberta. Mar. Pet. Geol.131, 105157. 10.1016/j.marpetgeo.2021.105157
13
Fu J. H. Wei X. S. Luo S. S. Zuo Z. Zhou H. Liu B. et al (2019). Discovery and geological knowledge of the large deep coal-formed Qingyang Gas Field, Ordos Basin, NW China. Pet. Explor. Dev.46, 1111–1126. 10.1016/s1876-3804(19)60267-3
14
Gao Y. (2020). Study on Formation Water Distribution of Tight Sandstone Gas Reservoir in the Northern Tianhuan, Ordos Basin. Beijing: China Univ. Pet.
15
Guo Q. Q. Er C. Zhao J. Z. Teng Y. X. Tan S. J. Shen C. M. (2023). Reservoir characteristics and high-quality reservoir control factors of He8 member in Daning-Jixian area of Ordos Basin. Spec. Oil Gas. Reserv.30, 19–28. 10.3969/j.issn.1006-6535.2023.03.003
16
Guo Y. Q. Wang M. X. Guo B. C. Cai Z. C. Hui L. He Z. Q. et al (2020). Sedimentary system characteristics and paleogeographic evolution of the Upper Paleozoic of northern west margin of Ordos Basin. J. Northwest Univ.50, 93–104.
17
Jiang F. J. Jia C. Z. Pang X. Q. Jiang L. Zhang C. Ma X. et al (2023). Upper Paleozoic total petroleum system and geological model of natural gas enrichment in Ordos Ba-sin, NW China. Pet. Explor. Dev.50, 281–292. 10.1016/s1876-3804(23)60387-8
18
Li S. Liu L. Wu J. Wang L. L. Zhang Z. L. (2021). Diagenetic evolution of tight sandstone in the Shanxi Formation to the lower Shihezi Formation, southern Ordos Basin. Nat. Gas. Geosci.32, 47–56. 10.11764/j.issn.1672-1926.2020.09.008
19
Li S. Ma L. Y. Wang R. Y. Deng J. Li Y. D. Quan X. Y. et al (2024). Main controlling factors and development model of tight reservoirs in the Shihezi Formation-Shanxi Formation in the Ordos Basin: taking the Binchang area as an example. Bull. Geol. Sci. Technol.43, 28–40. 10.19509/j.cnki.dzkq.tb20220468
20
Li Y. Fan A. Yang R. Sun Y. Lenhardt N. (2022). Braided deltas and diagenetic control on tight sandstone reservoirs: a case study on the Permian Lower Shihezi Formation in the southern Ordos Basin (central China). Sediment. Geol.435, 106156. 10.1016/j.sedgeo.2022.106156
21
Liu J. L. Liu Z. Q. Xiao K. H. (2020). Characterization of favorable lithofacies and its petroleum geological significance of the 2nd member of the Triassic Xujiahe Formation in Xinchang area, Sichuan Basin. Pet. Explor. Dev.47, 1111–1121.
22
Liu X. P. Han X. G. Zhao H. T. (2023). Distribution characteristics and genetic analysis of gas and water in tight gas reservoirs of the 8th section of Shihezi Formation in Ordos Basin, China. Nat. Gas. Geosci.34, 1941–1949.
23
Ma Y. Li W. H. Zhang Q. (2021). Sedimentary characteristics of the middle Permian in Ordos Basin and its adjacent areas. J. Palaeoge-ogr.23, 81–92.
24
Meng X. L. Ai Q. L. Wang J. C. (2021). Reservoir-forming conditions of deep tight sandstone gas reservoirs, Qingyang Gas Field, Ordos Basin. Nat. Gas. Explor. Dev.44, 104–110.
25
Mi L. J. Zhu G. H. (2021). Geological characteristics and exploration breakthroughs of the Linxing-Shenfu tight gas field in the northeastern margin of Ordos Basin. China Pet. Explor26, 53–67.
26
Miall A. D. (1977). “Lithofacies types and vertical profile models in braided river deposits: A summary,” in Fluvial Sedimentology, AAPG Memoir 5 (Tulsa, OK, USA: AAPG), 597–604.
27
Qin S. Wang R. Shi W. Geng F. Luo F. Li G. et al (2024). Integrated controls of tectonics, diagenesis, and sedimentation on sandstone densification in the Cretaceous paleo-uplift settings, north Tarim Basin. Geoenergy Sci. Eng.233, 212561. 10.1016/j.geoen.2023.212561
28
Scherer M. (1981). Parameters influencing porosity in sandstones: a model for sandstone porosity prediction. AAPG Bull.71 (5), 485–491.
29
Wang H. C. Ren D. S. Hou Y. D. (2018). Analysis of main controlling factors of gas-water distribution in the Upper Paleozoic of the northern Tianhuan Depression. Spec. Oil Gas. Reserv.25, 32–36.
30
Wang M. Y. Zeng J. H. Wang X. J. (2024). Controlling factors of gas-water distribution in source-reservoir separated tight sandstone gas reservoirs: a case study of Shaximiao Formation tight sandstone gas in central Sichuan Basin. Acta Pet. Sin.45, 1187–1201.
31
Wang Z. L. Wei L. Wang X. Z. (2016). Accumulation process and mechanism of Lower Paleozoic gas reservoir in Yan'an area, Ordos Ba-sin. Acta Pet. Sin.37 (S1), 99–110.
32
Wei Q. L. Cui G. X. Liu M. R. (2021). Reservoir characteristics and controlling factors of Permian Lower He 8 member in southwestern Or-dos Basin. Lithol. Reserv.33, 17–25.
33
Wu H. Liu R. E. Zuo Z. F. (2020). Gas and water distribution characteristics and its main controlling factors of the Upper Paleozoic tight sandstone reservoirs in the northern Tianhuan Depression. J. China Univ. Min. Technol.49, 148–158.
34
Xia H. Wang L. Zhang D. Wang J. Fan Q. Feng M. et al (2022). Sequence architecture, sedimentary evolution and controlling factors of the Permian Shan-1 Member, Qingyang gas field, southwestern Ordos Basin. Oil & Gas Geol.43 (6), 1397–1412. 10.11743/ogg20220610
35
Xia L. Liu Z. Cao Y. Zhang W. Liu J. Yu C. et al (2020). Post-accumulation sandstone porosity evolution by mechanical compaction and the effect on gas saturation: case study of the Lower Shihezi Formation in the Bayan'aobao area, Ordos Basin, China. Mar. Pet. Geol.115, 104253. 10.1016/j.marpetgeo.2020.104253
36
Yang H. Liu X. S. Yan X. X. (2015). The relationship between tectonic-sedimentary evolution and tight sandstone gas reservoir since the late Paleozoic in Ordos Basin. Earth Sci. Front.22, 174–183. 10.13745/j.esf.2015.03.015
37
Yang R. C. Dong L. Zhang J. Wang Y. Fan A. P. (2022). Origin, distribution and controlling factors of stratigraphic water in the Western Sulige Gas Field. Acta Sedimentol. Sin.40, 267–280. 10.14027/j.issn.1000-0550.2020.079
38
Yang W. Hou J. Liu Y. Dou L. Wang X. (2022). The pore structures of different lithofacies in low-permeability sandy conglomerate reservoirs and their dia-genetic impacts: a case study from the Es4 member of the northern steep slope in Dongying Depression, Bohai Bay Basin, NE China. Mar. Pet. Geol.136, 105481. 10.1016/j.marpetgeo.2021.105481
39
Yin X. Shu J. Li Y. Wei G. Jungang L. Peng W. et al (2020). Impact of pore structure and clay content on the water-gas relative permeability curve within tight sandstones: a case study from the LS block, eastern Ordos Basin, China. J. Nat. Gas. Sci. Eng.81, 103418. 10.1016/j.jngse.2020.103418
40
Yu X. H. Li S. L. Yang Z. H. (2015). Discussion on sedimentary-diagenetic genesis mechanism and key issues of tight sandstone gas reservoirs. Lithol. Reserv.27, 1–13. 10.3969/j.issn.1673-8926.2015.01.001
41
Zhang W. Li L. Jia H. C. (2016). Reservoir-forming dynamics and gas-water distribution characteristics of lithologic traps in the 1st Member of Xiashihezi Formation in the Shilijiahan zone, Hangjinqi area, Ordos Basin. Pet. Geol. Oilfield. Dev.37, 189–196. 10.11743/ogg20160206
42
Zhao D. Hou J. Sarma H. Guo W. Liu Y. Xie P. et al (2023). Pore throat heterogeneity of different lithofacies and diagenetic effects in gravelly braided river deposits: implications for understanding the formation process of high-quality reservoirs. Geoenergy Sci. Eng.221, 111309. 10.1016/j.petrol.2022.111309
43
Zhao D. D. Hou J. G. Wang X. J. Liu Y. M. Chen R. X. Zhang Y. Y. (2023). Controlling mechanism of pore-throat structure of different lithofacies on gas-water relative permeability characteristics of tight sandstone gas reservoir: a case study of the Lower Shihezi Formation in the Well J72 block of the Dongsheng Gas Field, Ordos Basin. Bull. Geol. Sci. Technol.42, 163–174.
44
Zhu R. J. Li R. X. Liu X. S. (2021). Characteristics of the diagenetic evolution of tight sandstone gas reservoir and its property in the Upper Paleozoic erathem in southwestern Ordos Basin. J. Lanzhou Univ.57, 637–649+658.
45
Zhu S. Zhu X. Jia Y. (2023). Characteristics of tight gas reservoirs in the Xujiahe Formation in the western Sichuan Depression: a systematic review. Energies17, 587. 10.3390/en17030587
46
Zhu S. Zhu X. Jia Y. Cui H. Wang W. (2020). Diagenetic alteration, pore-throat network, and reservoir quality of tight gas sandstone reservoirs: a case study of the Upper Paleozoic sequence in the northern Tianhuan Depression in the Ordos Basin, China. AAPG Bull.104, 2297–2324. 10.1306/08151919058
47
Zhu S. F. Cui H. Chen J. H. (2021). Sedimentary system and sandstone reservoir petrology of a shallow water delta: case study of the Shan-1 and He-8 members in the western Ordos Basin. Acta Sedimentol. Sin.39, 126–139.
48
Zou C. N. Yang Z. He D. B. Wei Y. Li J. Jia A. et al (2018). Theory, technology and prospects of conventional and unconventional natural gas. Pet. Explor. Dev.45, 604–618. 10.1016/s1876-3804(18)30066-1
Summary
Keywords
deep tight gas, reservoir quality, gas content difference, He 8 member, Ordos Basin
Citation
Wu X, Chen Z, Shen Z, Bao Y, Lan Z, Liu P, Dou L and Wen Z (2025) Lithofacies controls on gas accumulation in tight sandstone reservoirs: insights from the Permian Shihezi formation, south-western Ordos Basin, China. Front. Earth Sci. 13:1610578. doi: 10.3389/feart.2025.1610578
Received
12 April 2025
Accepted
20 June 2025
Published
03 July 2025
Volume
13 - 2025
Edited by
Amer A. Shehata, Texas A&M University Corpus Christi, United States
Reviewed by
Amir Ismail, Texas A&M University Corpus Christi, United States
Mohammad A. Abdelwahhab, Al-Azhar University, Egypt
Updates
Copyright
© 2025 Wu, Chen, Shen, Bao, Lan, Liu, Dou and Wen.
This is an open-access article distributed under the terms of the Creative Commons Attribution License (CC BY). The use, distribution or reproduction in other forums is permitted, provided the original author(s) and the copyright owner(s) are credited and that the original publication in this journal is cited, in accordance with accepted academic practice. No use, distribution or reproduction is permitted which does not comply with these terms.
*Correspondence: Luxing Dou, luxingdou@yangtzeu.edu.cn
Disclaimer
All claims expressed in this article are solely those of the authors and do not necessarily represent those of their affiliated organizations, or those of the publisher, the editors and the reviewers. Any product that may be evaluated in this article or claim that may be made by its manufacturer is not guaranteed or endorsed by the publisher.