 Min Wang
 Kang Chen3
- 1Institute of Exploration and Development, Shengli Oilfield, SINOPEC, Dongying, China
- 2State Key Laboratory of Shale Oil and Gas Enrichment Mechanisms and Effective Development, SINOPEC, Beijing, China
- 3Linpan Oil Production Plant, Shengli Oilfield, SINOPEC, Dezhou, China
- 4Exploration and Development Research Institute, PetroChina Changqing Oilfield, Xi’an, China
Low-permeability sandstone reservoirs usually exhibit complex pore structure characteristics that significantly controls the type of fluid in the pore space and its occurrence and seepage mechanisms. In this work, the mercury injection capillary pressure (MICP) and low-field nuclear magnetic resonance (LNMR) analyses were conducted on low-permeability sandstone samples collected from the fourth member of the Eocene Shahejie Formation (Es4) of Dongying sag to characterize the pore structure, analyze the relationship between dual LNMR T2 cutoff values and the pore fluid type, and discuss the role of dual LNMR T2 cutoff values on the pore structure characterization. The results (1) indicated that the pore structure of low-permeability sandstones in the study area exhibits strong heterogeneity and can be divided into three types based on the MICP and LNMR results. Typically, sandstone samples with a type I pore structure usually exhibits characteristics such as low displacement pressure (Pd), large average pore throat radius, and a wide distribution of pore size. (2) shown that the dual LNMR T2 cutoff values can better characterize the occurrence of fluids in sandstone samples in the study area. When T2 >T2C2, fluid in the pore space is fully moveable; conversely, when T2<T2C2, fluid becomes completely immobile. The T2C1 and T2C2 range from 0.16 to 3.37 ms and from 17.34 to 346.78 ms, respectively. (3) found that fractal dimensions derived from LNMR curves under dual LNMR T2 cutoff values provide a more precise characterization of pore structure heterogeneity in low-permeability sandstone reservoirs compared to a single fractal dimension. When T2>T2C1, pores demonstrate fractal characteristics, enabling the representation of pore structure heterogeneity through fractal dimensions. Specifically, samples with Type I pore structures tend to show the smallest D2 and D3 values. In generally, by applying dual T2 cutoffs (T2C1 and T2C2) to LNMR-derived fractal dimensions, the pore structure of low-permeability sandstones can be better characterized, facilitating more accurate reservoir effectiveness assessments for oil and gas exploration.
1 Introduction
In recent years, China’s conventional oil and gas production has declined, while demand for unconventional resources has steadily risen (Zou et al., 2014; Lai et al., 2023). Low-permeability sandstone reservoir, as a favorable reservoir, has become a hotspot for unconventional oil and gas exploration and development (Ji and Fang, 2023; Yang et al., 2025).
The pore structure of reservoir rocks encompasses the three-dimensional architecture of pore spaces, including pore and throat geometry, size distribution, and spatial connectivity (Hu et al., 2017; Lai et al., 2018b; Zeng et al., 2024), governing storage capacity, permeability, and recovery dynamics for oil and gas reservoirs (Qiao et al., 2019; Feng et al., 2025), especially low-permeability sandstone reservoir. Therefore, the study of the pore structure of low-permeability sandstone reservoir has a very important theoretical and practical significance. Currently, the characterization methods for reservoir pore structure draw upon those used for porous materials to meet research requirements. From the perspective of characterization methods, pore structure analysis can be primarily categorized into three approaches: image analysis, such as field emission scanning electron microscopy (Yan et al., 2018; Ni et al., 2021; Ni et al., 2025), fluid injection methods, such as MICP, NMR (Guo et al., 2019; Zhang et al., 2019; Yang et al., 2022), and non-fluid injection methods, such as micro-nano computed tomography (Kong et al., 2019; Su et al., 2022). Both advantages and limitations exist for each method; thus, combining the advantages of each method is beneficial to the overall understanding of low-permeability sandstone pore structures (Lai et al., 2018b). Moreover, considering the subsequent analysis and evaluation of pore structures in continuous well logging profiles, it is crucial to enhance pore structure characterization and research based on NMR experiments because of the wide using of NMR logging.
According to existing research, pore structure evaluation based on NMR experiments primarily focuses on the following aspects: comparative analysis of NMR curve morphology characteristics, conventional NMR pore structure parameter analysis, NMR sensitive parameter analysis, and NMR fractal dimension calculation (Yan et al., 2020; Li et al., 2025). Sun et al. (2024) indicated that the complex pattern of left and right peak of NMR T2 spectra are closely related to their complex pore structure characteristics, and that the proportion of large-size pores decreases with the decrease of the long T2 components. Yan et al. (2020) analyzed the morphological differences of the NMR T2 distribution for different tight sandstone sample from Chang 7 formation, Ordos Basin, and proposed several sensitive NMR parameters to characterize the pore structure. Further, fractal analysis is widely used to characterize the pore structure of rocks based on nitrogen adsorption, MICP and NMR test results. Usually, the smaller the NMR fractal dimension is, the better the pore structure is (Yan et al., 2018; Lai et al., 2018a; b). From the above research progress, the NMR fractal dimension based on NMR T2 spectra as a single parameter can quantitatively characterize the differences in pore structure of different samples. Notably, some samples exhibit poor linearity (Liu et al., 2021), potentially compromising the reliability of calculated fractal dimensions. This likely stems from the complex multi-scale pore network characteristics inherent to unconventional reservoir rocks. The NMR T2 cutoff value, as one of the parameters characterizing the NMR pore structure, can divide the pore space into free fluid pore space and bound fluid pore space, which to a certain extent portrays the pore multi-scale distribution characteristics of rocks. However, previous studies have demonstrated that the conventional T2 cutoff method exhibits significant limitations, as irreducible fluids persist when T2>T2C, while portions of movable fluids are unexpectedly removed during centrifugation when T2 < T2C (Fan et al., 2018). Recently, the dual T2 cutoff value methodology was developed (Fan et al., 2018; Zheng et al., 2022), and can re-classified the pore fluid as absolute irreducible-fluid, absolute movable-fluid, and partial movable-fluid in coals, sandstones, and shales (Zhang et al., 2021).
Following the successful previous research of dual T2 cutoff value methodology and fractal analysis, it is necessary to combine the double T2 cutoff value method and the fractal dimension method to finely characterize the pore structure of low-permeability sandstone reservoirs. Thus, based on MICP and LNMR experiments, the main aims of this work are to: (1) evaluate the pore structure using MICP and LNMR experiments; (2) determine the dual LNMR T2 cutoff values and discuss the relationship between the LNMR pore structure parameters and pore component percentages; and (3) characterize the fractal features of low-permeability sandstones using the dual LNMR T2 cutoff values and discuss the relationship between them and the pore structure type. The results are expected to further the understanding of pore structure characterizations of low-permeability and the determination of favorable oil and gas sections in well logging profiles.
2 Location and geological setting
Bohai Bay Basin is an important hydrocarbon exploration basin and its tectonic evolution can be subdivided into a synrift stage between 65.0 and 24.6 Ma and a postrift stage from 24.6 Ma to the present (Guo et al., 2010). Geographically, the Dongying Sag, developed in the Cenozoic rift period, is located in the southern part of the Jiyang depression in the Bohai Bay Basin with an area of 5,700 km2 (Figures 1A,B). It is bounded by the Chenjiazhuang Uplift, the Qingtuozi and Guangrao uplifts, the Luxi Uplift, and the Qingchen-Linjia-Binxian uplifts (Ma et al., 2017; Zhang et al., 2024). From north to south, Dongying sag consists of five secondary tectonic provinces: the northern steep slope, the Minfeng subsag, the central anticline, the Niuzhang subsag, and the southern gentle slope (Figure 1C). The sedimentary sequences of Dongying sag, in an ascending order, consist of the Paleocene Kongdian (Ek), Shahejie (Es), and Dongying (Ed) formations, the Neogene Guantao (Ng) and Minghuazhen (Nm) formations, and the Quaternary Pingyuan (Qp) Formation (He et al., 2016; Figure 2). The Shahejie formation can be divided into Es1, Es2, Es3, and Es4 from top to bottom. Among them, Es4 is the main study layer in this work.
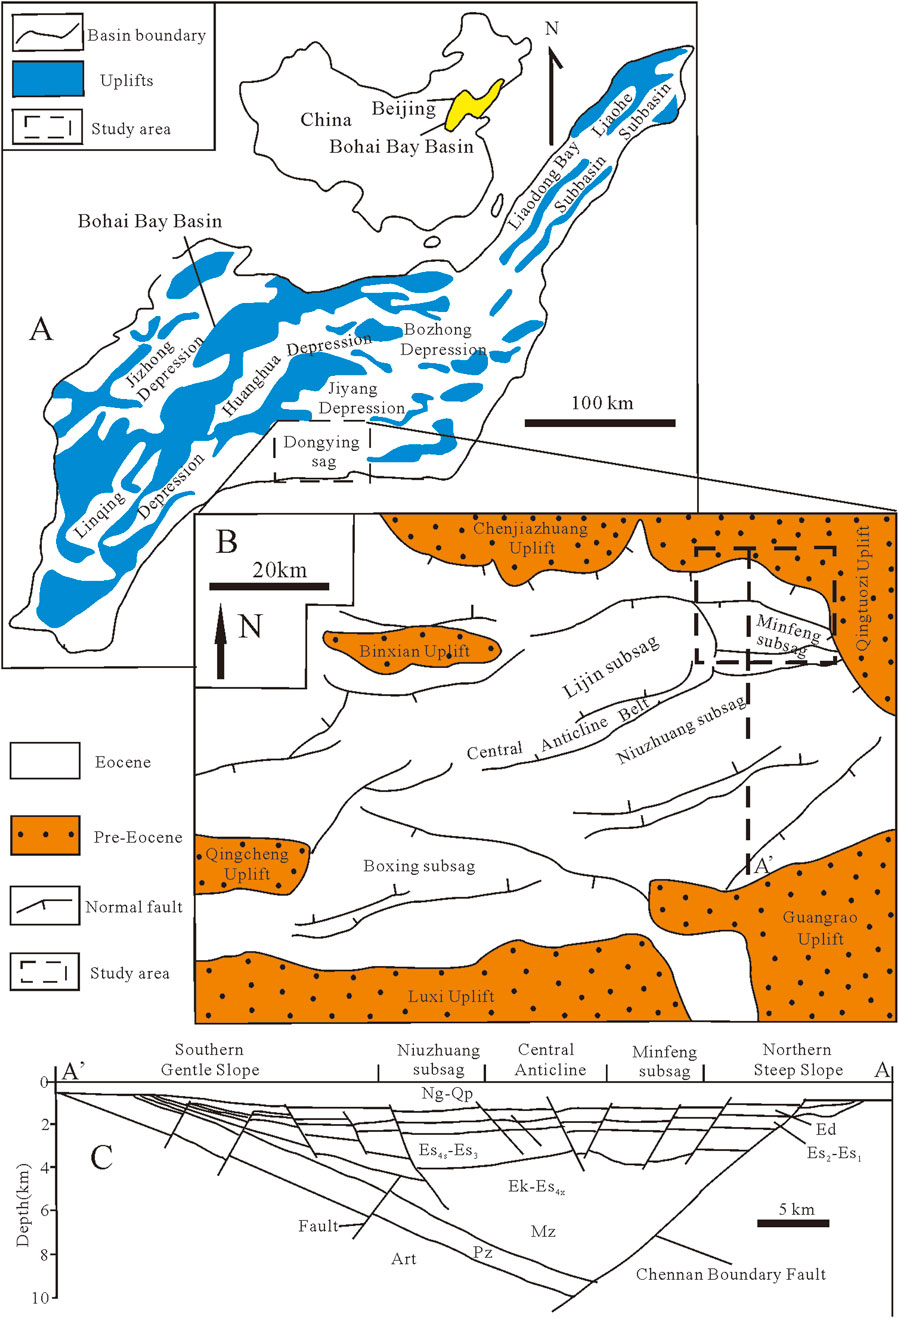
Figure 1. (A) Location of the Jiyang depression, Bohai Bay Basin, eastern China (modified from Guo et al., 2010); (B) tectonic unit division of Dongying sag (Ma et al., 2017); (C) Cross section AA’ showing major stratigraphic units and tectonic features within the Dongying sag (modified from Guo et al., 2010).
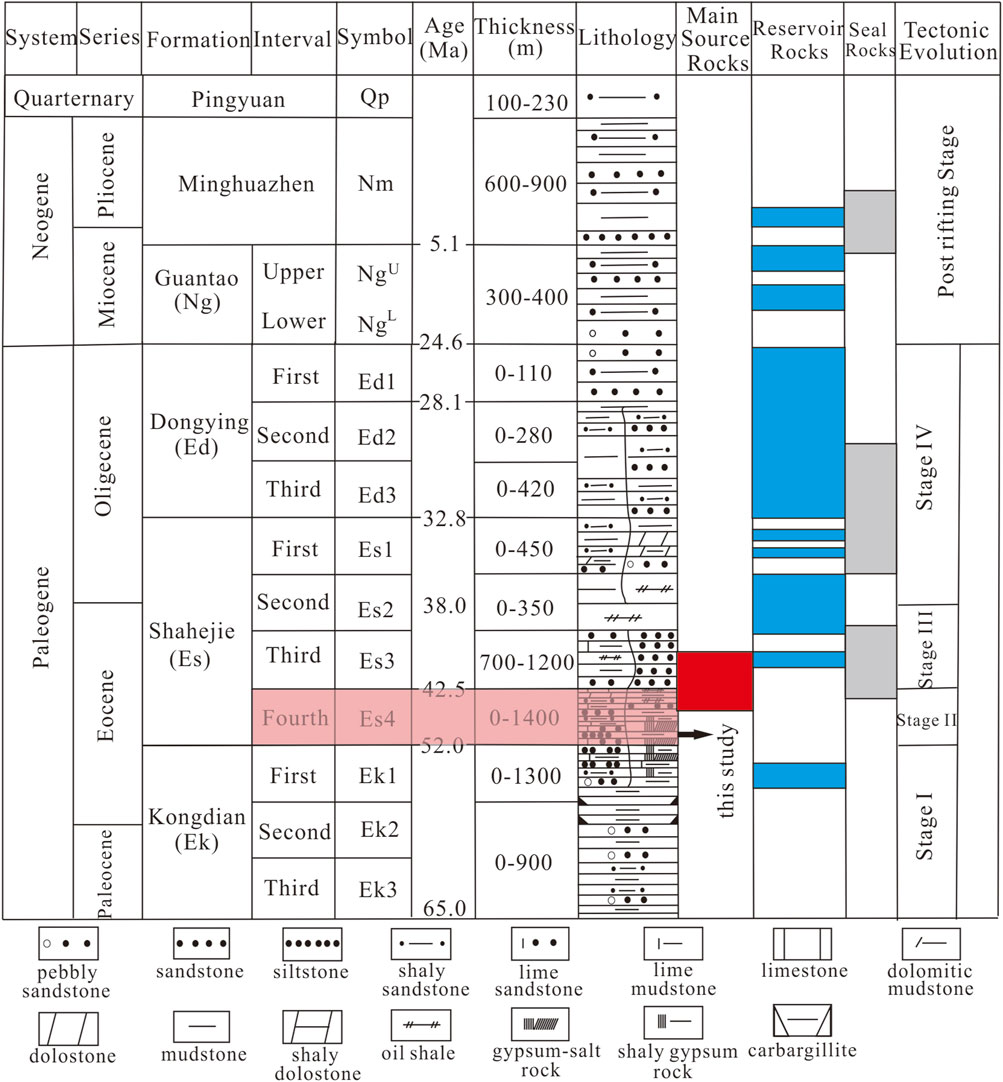
Figure 2. Stratigraphy and tectonic evolution of the Dongying sag (modified from He et al., 2016).
3 Database and experimental methods
3.1 Samples and experiments
A total of 37 low-permeability sandstone samples were collected form the Es4 of the Dongying sag in this work and were used to conducted MICP and LNMR analyses. Among the samples, 16 were subjected to LNMR test and 21 to MICP analysis.
MICP is the most frequently used method in rock reservoir evaluation. The pressure and pore radius required to inject mercury from non-wetting mercury into different pores is described by the Washburn equation (Washburn, 1921). According to the injection volume under different pressure, the pore volume and pore size distribution of the rock can also be obtained (Gong et al., 2015). In this work, the MICP measurements were performed on the Poremaster 60 type automatic mercury injection instrument made by Quantachrome Instruments after the samples were cleaned, dried and equilibrated.
The LNMR T2 spectrum measured by rock-saturated single-phase fluid can reflect the pore structure inside the rock, and the transverse relaxation time T2 and the aperture radius can be converted to each other (Mitchell and Fordham, 2014; Abouelresh, 2017). Depending on the characteristics of low-porosity and low-permeability of core samples, the NMR instrument adopts AniMR-150 full-diameter core magnetic resonance imaging system made by Shanghai Niumag Company in Experimental Teaching Center for Oil and Gas Geology and Exploration at Southwest Petroleum University. The samples were treated by a cleaning, drying, vacuuming, and saturating procedure to achieve a water-saturated state. The echo spacing, number of echoes, number of scans, and test temperature were 0.16 ms, 2048, 256, and 25°C, respectively. Saturated with water and followed with centrifugation, NMR tests were performed separately, and the saturated T2 spectrum and the centrifugal T2 spectrum were obtained by an inversion method of multi-exponential fitting method (Coates et al., 2000).
3.2 Theory
3.2.1 Low-field nuclear magnetic resonance
Based on the NMR relaxation mechanism, the transverse relaxation time of NMR consists of three parts: bulk relaxation time, surface relaxation time and diffusion relaxation time (Coates et al., 2000; Dunn et al., 2002). The relationships between them can be expressed as:
where T2 is the transverse relaxation time, determined by the nature of the pore fluid (ms); T2B is the bulk relaxation time of the fluid (ms); ρ2(S/V) is the surface relaxation time, which is greatly affected by the pore size (ms); D (γGTE)2/12 is the diffusion relaxation time (ms); D is the diffusion coefficient (μm2/ms); G is the magnetic field gradient (gauss/cm); TE is the echo interval (ms); S is the surface area of the pores (cm2); V is the volume of the pores (cm3); ρ2 is the transverse surface relaxation strength of rock (μm2/ms).
The laboratory often uses water-saturated cores for experiments, the value of T2B is usually above 3 s, which is much larger than the T2 value; that is, 1/T2B is much smaller than the 1/T2 value, so the volume relaxation time can be ignored. At the same time, when the magnetic field is uniform (i.e., the magnetic field gradient G is small) and the echo time interval is short (TE is small), the analysis of diffusion relaxation contribution is also small, and the diffusion relaxation time is also negligible (Talabi et al., 2009). Therefore, the relaxation contribution of the fluid mainly comes from the surface relaxation of the rock particles, so the Equation 1 can be approximated as:
According to Equation 2, the magnitude of the T2 value is mainly determined by the nature of the rock and the ratio of the pore surface area to the pore volume (S/V). If the pores are assumed to consist of ideal spheres, then S/V = 3/rc; if the throat is assumed to consist of an ideal cylinder, then S/V = 2/rc (Zhu et al., 2018). If the pore radius is proportional to the throat radius, Equation 2 can be rewritten as Equation 3:
where Fs is a pore shape factor that is related to pore morphology; for spherical pores, Fs = 3; for cylindrical pores, Fs = 2 (Xiao et al., 2016; Xiao et al., 2018; Zhang et al., 2019).
3.2.2 Mercury injection capillary pressure
At a given pressure, mercury at a normal temperature is pressed into the pores of the porous material to be tested, and when mercury from entering the capillary, the contact surface of the capillary with mercury is generated by capillary forces in the opposite direction of external pressure, hindering mercury enters the capillary. According to the balance principle of forces, when the external pressure is large enough to overcome the capillary force, mercury will invade the pores. Therefore, a pressure value supplied by the outside can be used to measure the size of the corresponding aperture (Njiekak et al., 2018).
Assuming that all pores of the porous medium are cylindrical, the principle of the pressure-measuring mercury method can be expressed as Equation 4:
where D is the pore diameter (m); σ is the surface tension of mercury (mN/m); θ is the contact angle of mercury and capillary surface; p is the external pressure (mN/m2).
3.2.3 Fractal dimension
In late 1970s, the French mathematician Mandelbrot (1977) founded fractal geometry (Mandelbrot, 1977). At present, fractal theory has been widely used in the study of microscopic pore structure of reservoirs, and has become a simple and effective way to quantitatively characterize the heterogeneity and complexity of reservoir pore structure (Yan et al., 2018; Xia et al., 2025). By analyzing the superposition relationship of several mechanisms of NMR transverse relaxation, Equations 5, 6, can be used to calculate the fractal dimension (Zhou et al., 2016; Yan et al., 2017):
where
4 Results and discussion
4.1 Pore structure characteristics
MICP and LNMR curves of low-permeability sandstone samples in the study area are given in Figure 3. Figure 3A illustrates a significant divergence in the capillary pressure curves of the low-permeability sandstone samples within the study area. The mercury injection segment is notably short and irregular, suggesting poor sorting of pore throat sizes and a predominance of small-sized pore throats. Additionally, the displacement pressure (Pd), maximum mercury saturation (SHgmax), and maximum pore throat radius range from 0.31 to 15.02 MPa, 12.26% to 76.82%, and 0.05 to 2.41 μm, respectively. The morphological and parametric characteristics of the MICP curves collectively demonstrate the complexity of pore structure in the low-permeability sandstones within the study area. Since reservoir pore structure governs fluid distribution, LNMR can obtain information related to the occurrence state of pore fluids, which forms the basis for evaluating reservoir pore structure using LNMR T2 spectra. From the perspective of LNMR T2 spectrum characteristics, the samples exhibit a broad distribution of T2 distributions and diverse spectral shapes, with T2 cutoff values and T2 geometric means ranging from 2.47 to 27.68 ms and 1.25 to 25.82 ms, respectively (Figure 3B). The combined LNMR and MICP data reveals that the low-permeability sandstones in the study area exhibit complex pore structures, diverse pore types, and strong heterogeneity.
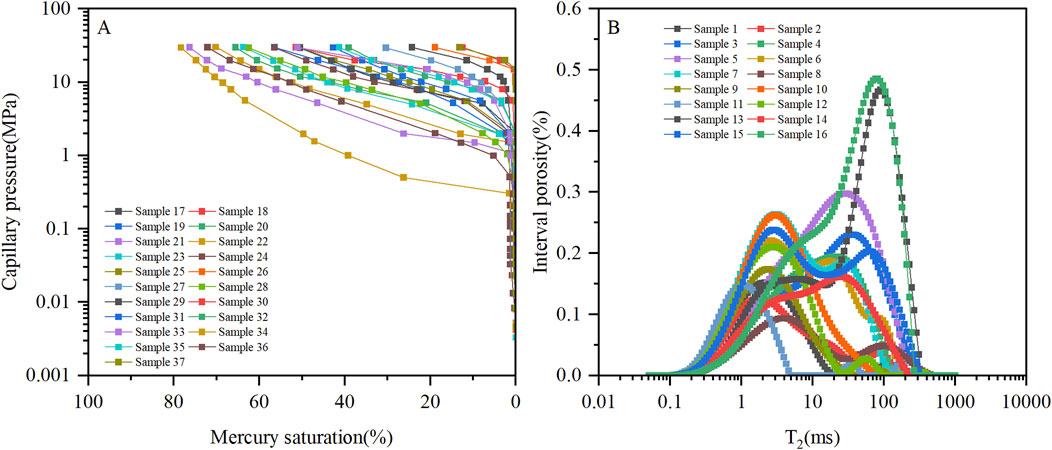
Figure 3. MICP (A) and LNMR (B) curves of the low-permeability sandstone samples from Es4 of Dongying sag.
To better evaluate the pore structure of low-permeability sandstones in the study area, three major pore structure types were categorized through LNMR and MICP integration (Table 1).
• Type I: Type I pore structures display MICP curves with pronounced plateaus (Pd < 1 MPa, SHgmax > 65–76%, maximum pore throat radius>0.5 μm). Corresponding LNMR spectra show high T2 components (T2 cutoff>8 ms) and low bound water (<25%). This pore structure type predominantly occurs in well-sorted fine sandstones with wide distribution of pore size, demonstrating optimal reservoir performance with both the highest storage capacity and flow capacity.
• Type II: Type II pore structures exhibit a moderate plateau segment in MICP curves, with Pd ranging from 1 to 2 MPa, SHgmax between 40% and 65%, and maximum pore throat radius typically between 0.05 and 0.5 μm. The LNMR T2 spectra show an increased proportion of low T2 components, indicating a higher abundance of smaller pores, with T2 cutoff values distributed between 5 and 8 ms and bound water saturation ranging from 25% to 65%. Sandstone samples with this pore structure demonstrate moderate storage and flow capacity.
• Type III: Type III pore structures exhibit MICP curves without distinct plateau segments, characterized by Pd exceeding 2 MPa, SHgmax below 40%, and maximum pore throat radius smaller than 0.05 μm. The LNMR T2 spectra are dominated by low T2 components, with T2 cutoff values below 5 ms and bound water saturation exceeding 65%. Sandstone samples possessing this pore structure type demonstrate the poorest storage and flow capacity.
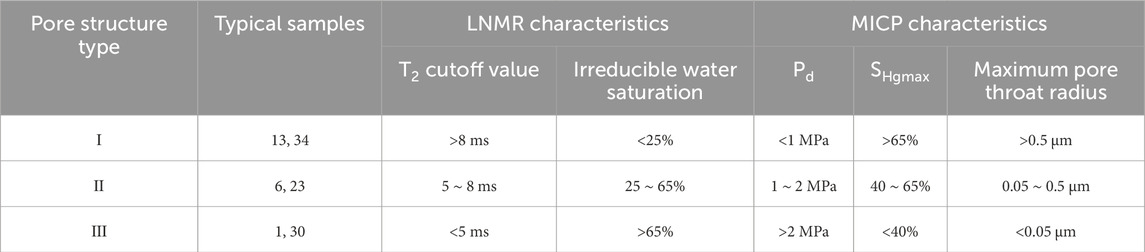
Table 1. Pore structure types of low-permeability sandstone samples in the study area.
4.2 Dual LNMR T2 cutoff value and its relationship between pore fluid type
In LNMR T2 spectra, single T2 cutoff value serves as a crucial parameter and is determined by comparing the cumulative curve of LNMR T2 spectra in fully water-saturated and centrifuged states (Chen et al., 2023). For detail, (1) drawing a horizontal line from the maximum of the cumulative curve of NMR T2 spectra in centrifuged state (parallel to the X-axis); (2) determining the intersection point of this line with the cumulative curve of NMR T2 spectra in fully water-saturated state; (3) the horizontal coordinate corresponding to this point is the single T2 cutoff value. After that, the pore of low-permeability sandstones in the study area is divided into two parts by the single T2 cutoff value. It is considered that the fluid occupying pores with T2 relaxation times exceeding the single T2 cutoff value exhibit free mobility, whereas that in pore spaces below the single T2 cutoff is deemed completely immovable.
Figures 4A–C compares the LNMR T2 distributions of low-permeability sandstone samples under fully water-saturated and bound water states. However, experimental results reveal that: (1) In pore spaces below the T2 cutoff value, centrifuged T2 spectra exhibit reduced amplitudes compared to 100% saturated states, demonstrating partial fluid mobility; (2) Conversely, pore spaces above the T2 cutoff retain immobile fluid after centrifugation (Figure 4A).
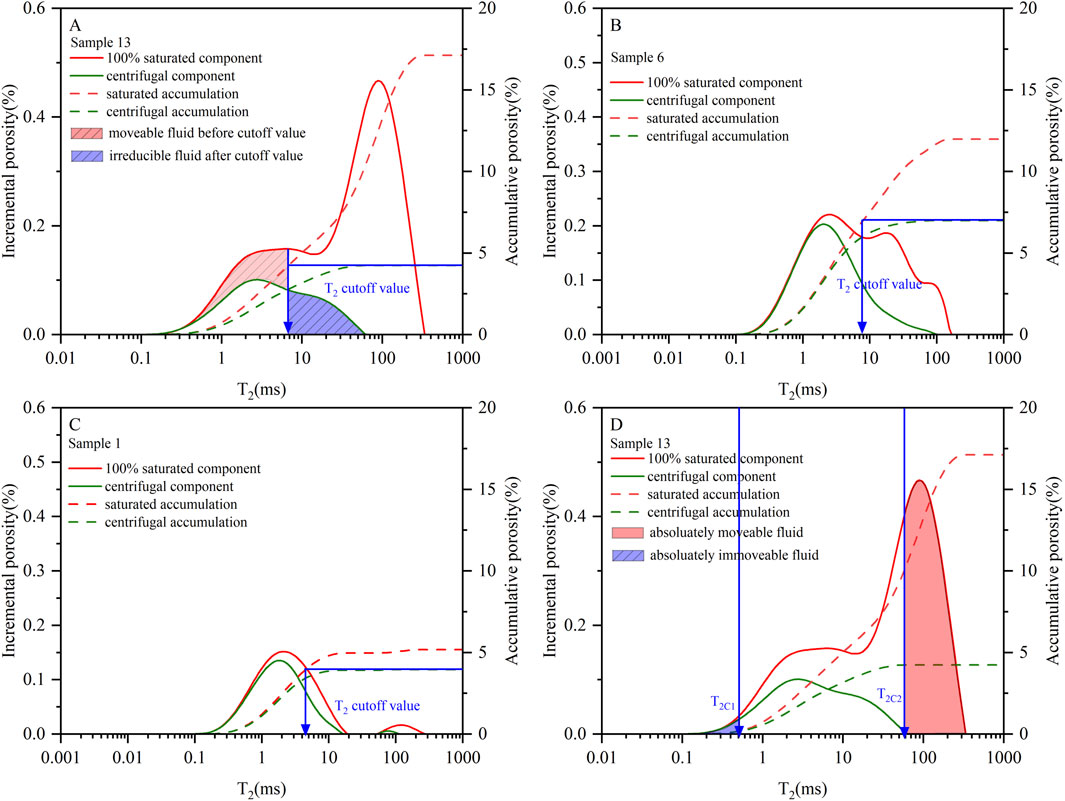
Figure 4. Low-permeability sandstones LNMR T2 spectrum with single cutoff value of Type I structure (A), Type II structure (B), Type III structure (C) and the schematic diagram of single LNMR T2 cutoff value (A) and dual LNMR T2 cutoff value (D).
Possible reasons for this phenomenon are: (1) The fluid in sub-cutoff pores experiences strong surface forces and is predominantly controlled by small pore constraints. However, centrifugal displacement effects are governed by the applied centrifugal force, enabling partial mobility of this fluid fraction under sufficient centrifugation conditions. (2) Fluids in pores exceeding the cutoff diameter experience minimal solid surface forces, yet their mobility remains constrained by interconnected fine pore throats. During centrifugation, these fluids cannot overcome the capillary barriers presented by the adjacent narrow pore throat. (3) Fluids in pores exceeding the cutoff diameter can overcome adjacent pore throat capillary barriers during centrifugation. However, partial or complete fluid retention occurs as surface-bound films due to the presence of hydrophilic mineral coatings on pore surfaces (Fan et al., 2018). Overall, it can be seen that using the conventional single cutoff value cannot accurately characterize the occurrence of fluid in the pore space of low-permeability sandstone.
To accurately characterize fluid occurrence states in low-permeability sandstones using LNMR T2 spectra, the dual T2 cutoff value methodology was applied (Fan et al., 2018; Zheng et al., 2022). For T2C1, it can be determined as follow:
where
Based on the dual T2 cutoff method, fluids in low-permeability sandstones can be classified into three types: (1) Completely immobile fluid (T2 < T2C1); (2) Fully mobile fluid (T2 > T2C2); (3) Mixed mobile/immobile fluid (T2C1 ≤ T2 ≤ T2C2) (Figure 4D). After that, the pore component percentage of these three fluid types were calculated by the equation reported in Zhang et al. (2019). The LNMR porosity, permeability, pore structure parameters and pore component percentage are given in Table 2. From the results, different low-permeability sandstone samples exhibit different pore component percentage of the pores filled with completely immobile fluid (T2 < T2C1), mixed mobile/immobile fluid (T2C1 ≤ T2 ≤ T2C2), and fully mobile fluid (T2 > T2C2), which may be attributed to variations in their pore structures.
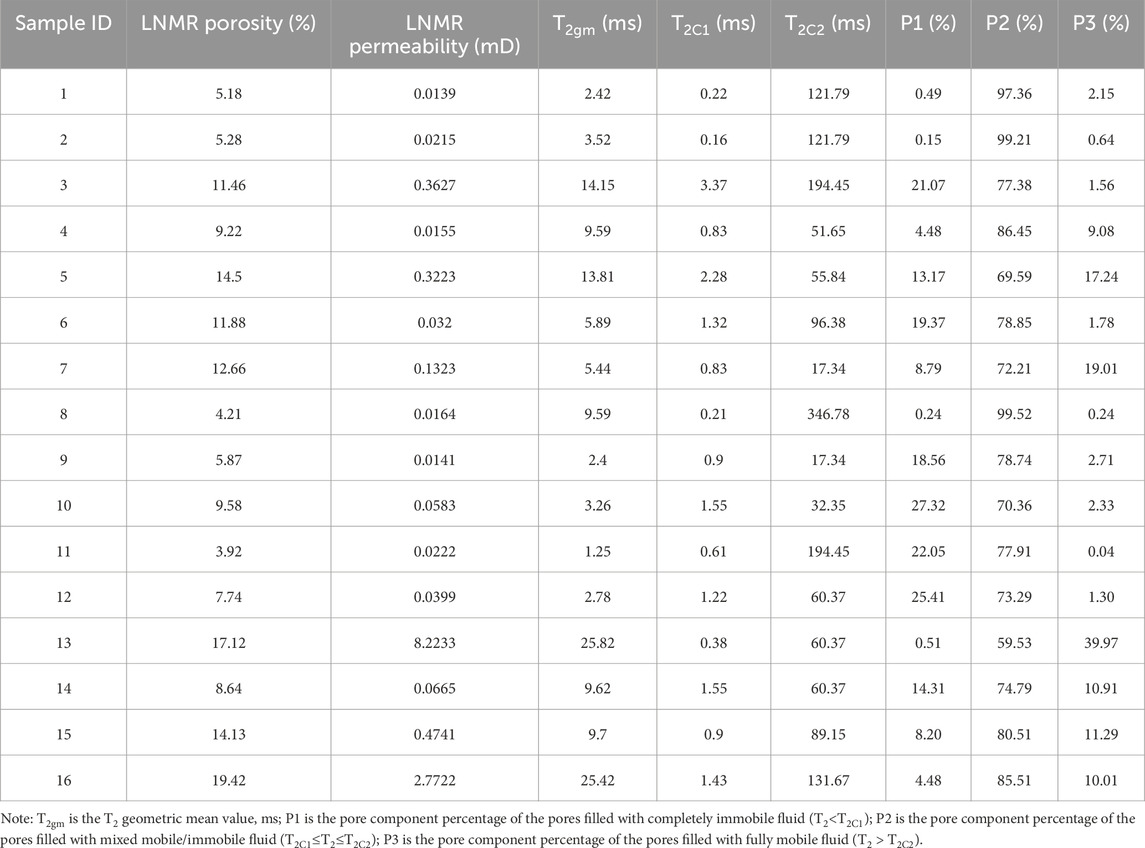
Table 2. Dual T2 cutoff values and the LNMR pore structure parameters of low-permeability sandstone samples in the study area.
4.3 Dual LNMR T2 cutoff value and its relationship between pore structure type
Relationship between the pore component percentage and LNMR pore structure parameters were also analyzed to clarify the role of dual T2 cutoff value of LNMR T2 spectra on the evaluation of pore structure of low-permeability sandstone. The relationship between P3 and LNMR pore structure parameters are shown in Figure 5. A clear positive correlation between P3 and LNMR porosity, LNMR permeability and T2 geometric mean value (Figures 5A–C), showing that the low-permeability sandstone samples in the study area containing more pores filled with fully mobile fluid often have better pore structure. The classification and determination of dual T2 cutoff values reveal that fully mobile fluids predominantly reside in the high-T2 region, corresponding to large pore spaces. Previous studies have demonstrated that under similar conditions, sandstone samples with a higher proportion of large pores typically exhibit superior storage capacity and permeability, particularly the latter (Yan et al., 2020). This also explains why sandstone samples with similar porosity can exhibit significant permeability variations. Consequently, P3 shows a strong positive correlation with the aforementioned LNMR pore structure parameters. Similarly, the cross-plot of porosity, permeability, and P3 demonstrates that sandstone samples with high porosity and high permeability consistently exhibit elevated P3 values, further validating the effectiveness of the dual T2 cutoff method for pore structure characterization in low-permeability sandstones in the study area.
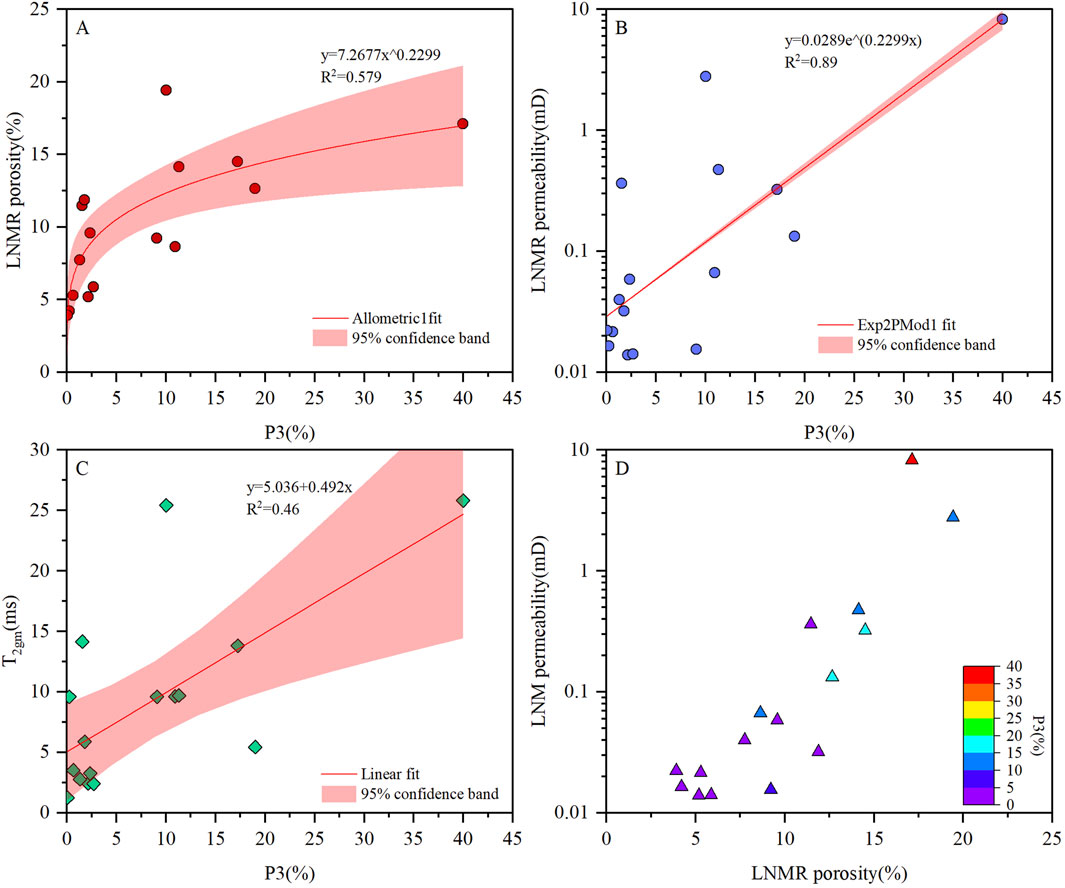
Figure 5. Relationships between P3 and (A) LNMR porosity, (B) LNMR permeability, (C) T2 geometric mean value, and distribution of physical properties of different P3 grades (D).
Additionally, fractal geometry governs natural systems universally (Mandelbrot, 1977), and the pore characteristics of rocks have been conclusively demonstrated to exhibit fractal behavior (Lai et al., 2018a; Lai et al., 2018b; Li et al., 2025; Xia et al., 2025). The pore structure of rocks represents the ultimate manifestation of their pore development characteristics. So, the fractal dimension, a quantitative parameter of fractal behavior, can be employed to analyze variations in pore structures and assess their heterogeneity across different rock types.
As previously discussed, the fractal dimension characterizing the pore structure of sandstone samples in the study area can be derived from the slope of the linear relationship between lg (Sᵥ) and lg (T2) in LNMR data analysis (Figures 6A,C,E). The results demonstrate that fractal dimension values exhibit a systematic increasing from Type I to Type III reservoirs. That is, as the reservoir heterogeneity gradually increases, the porosity and permeability decrease, the reservoir storage performance and seepage capacity deteriorate, and the fractal dimension gradually increases (Table 3). Furthermore, the fitting curves for Type I and II pore structures exhibit high correlation coefficients (R > 0.85), whereas Type III displays a significantly lower correlation coefficient, which means the fractal feature is not well expressed.
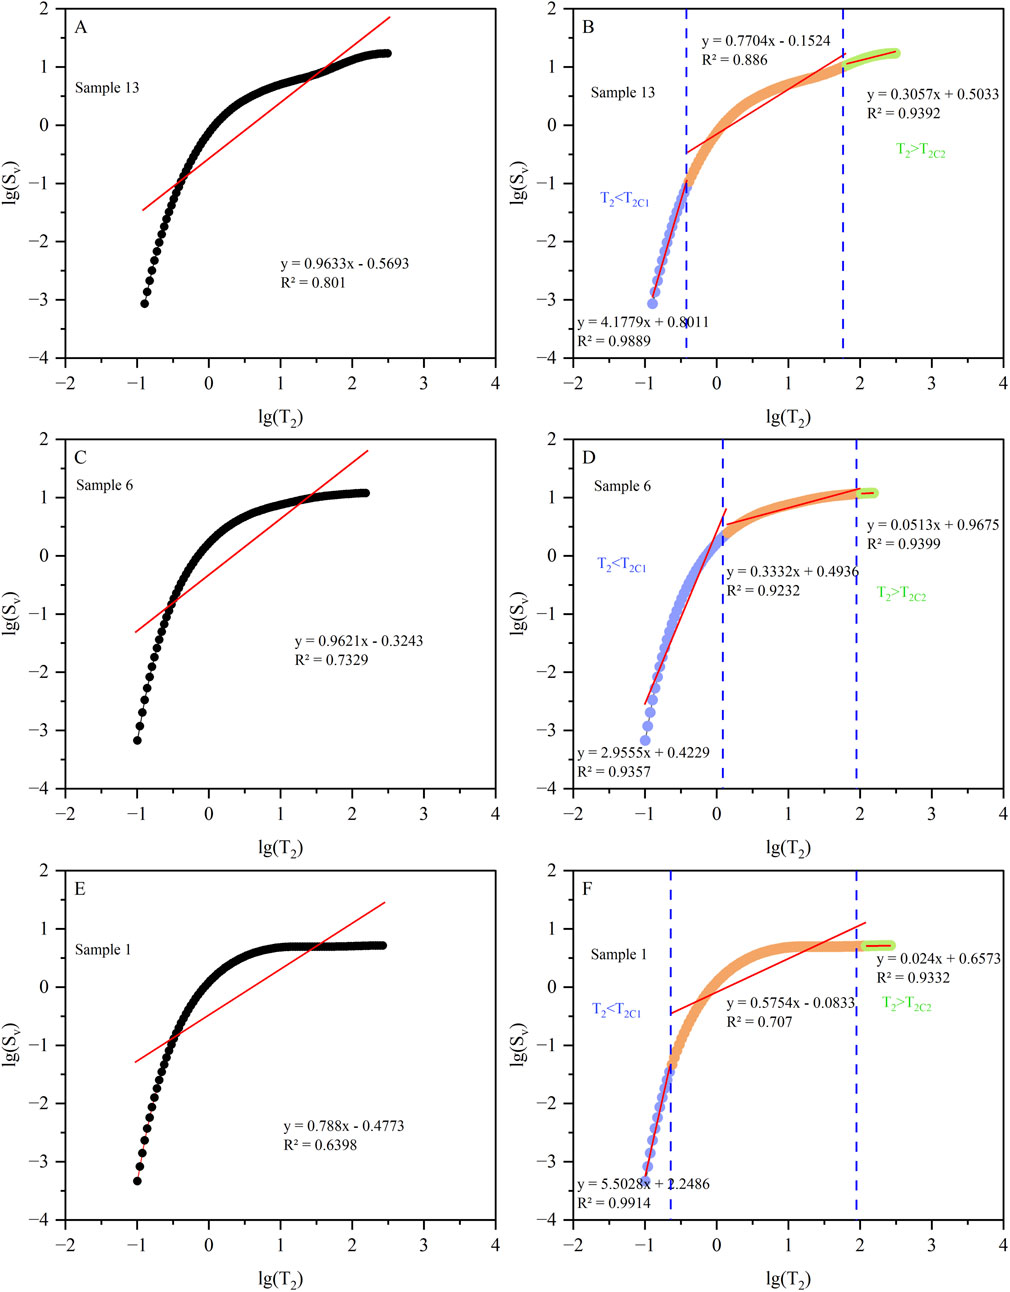
Figure 6. Fractal dimensions of rock samples with different pore structure types. (A) Fractal calculation result of samples 13; (B) Fractal calculation result of samples 13 under the constraints of dual T₂ cutoff values; (C) Fractal calculation result of samples 6; (D) Fractal calculation result of samples 6 under the constraints of dual T₂ cutoff values; (E) Fractal calculation result of samples 1; (F) Fractal calculation result of samples 1 under the constraints of dual T₂ cutoff values.
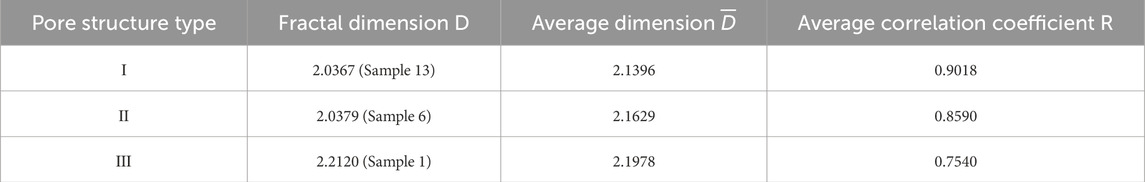
Table 3. Fractal dimension and regression analysis correlation coefficient of LNMR T2 spectra of rock samples with different pore structure types.
Then, fractal theory and the dual T2 cutoff LNMR methodology were integrated to rigorously characterize the fractal properties of pore in low-permeability sandstone samples, thereby providing a comprehensive evaluation of pore structure heterogeneity. Figures 6B,D,F presents the fractal dimensions of pore with different fluid types under the constraints of dual T2 cutoff values from LNMR analysis. Results shown that the dual T2 cutoff value constrained fractal analysis using LNMR T2 spectrum yields significantly higher correlation coefficients for the lg (Sᵥ)-lg (T2) relationship compared to conventional fractal analysis, which indicated that it accurately expresses the fractal characteristics of the pore system of the low-permeability sandstones in the study area and the heterogeneity of the pore structure. Notably, when T2 values fall below the T2C1, the slope of the linear relationship between lg (Sᵥ) and lg (T2) are exceed 3, suggesting that pore systems hosting completely immobile fluids may deviate from fractal principles. Two possible explanations are offered: (1) the relationship between T2 and pore size is not linear; (2) there is multimodal pore throat distributions in the pore filling with completely immobile fluid.
Beyond the considerations, the relationship between fractal dimensions and pore structures under LNMR dual T2 cutoff constraints remains consistent with prior analyses. Specifically, for pore spaces containing either fully mobile water or mixed mobile/immobile fluid, increasing pore structure heterogeneity correlates with progressively higher fractal dimensions (Table 4). In summary, the LNMR dual T2 cutoff value method enables precise characterization of pore structure heterogeneity in low-permeability sandstones in the study area, which further facilitates the identification of favorable sweet spot intervals.
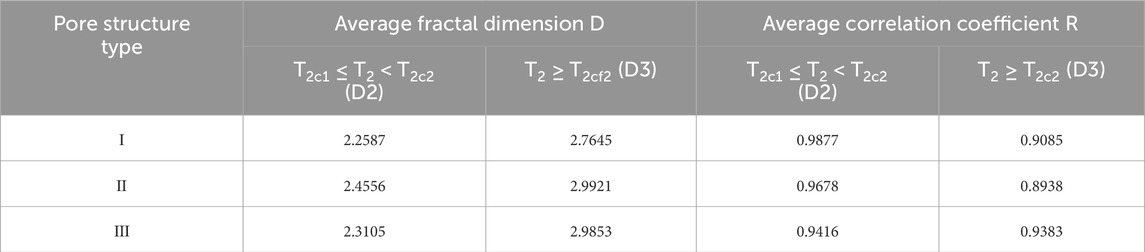
Table 4. Fractal dimension and regression analysis correlation coefficient values of LNMR T2 spectra of rock samples with different pore structure types constrained with dual T2 cutoff values.
5 Conclusion
Based on the present work, the following conclusions can be drawn:
(1) The analysis of MICP and NMR curves show that the pore structure of low-permeability sandstone samples are complex, strong heterogeneity, and can be divided into three types. Typically, Type I pore structures characterized by Pd < 1 MPa, SHgmax > 65–76%, T2 cutoff > 8 ms and low bound water (<25%).
(2) Based on the dual LNMR T2 cutoff values methods, the T2C1 and T2C2 of the low-permeability sandstone samples range from 0.16 to 3.37 ms and from 17.34 to 346.78 ms, respectively. Also, the pore space can be segregated into pores filled with completely immobile fluid, pores filled with mixed mobile/immobile fluid and pores filled with fully mobile fluid with T2C1 and T2C2.
(3) The integration of dual T2 cutoff methodology with fractal dimension analysis enables precise characterization of pore structure heterogeneity in low-permeability sandstone reservoir, and smaller D2 and D3 values directly indicate superior pore structure.
Data availability statement
The original contributions presented in the study are included in the article/supplementary material, further inquiries can be directed to the corresponding author.
Author contributions
MW: Data curation, Funding acquisition, Investigation, Methodology, Supervision, Writing – original draft, Writing – review and editing. KC: Data curation, Investigation, Methodology, Writing – original draft. BG: Data curation, Investigation, Methodology, Writing – original draft. QL: Data curation, Investigation, Methodology, Writing – original draft.
Funding
The author(s) declare that financial support was received for the research and/or publication of this article. This work was supported by Oil & Gas Major Project (Grant No. 2024ZD1400100).
Conflict of interest
Authors MW, KC, and BG were employed by SINOPEC. Author QL was employed by PetroChina Changqing Oilfield.
Generative AI statement
The author(s) declare that no Generative AI was used in the creation of this manuscript.
Publisher’s note
All claims expressed in this article are solely those of the authors and do not necessarily represent those of their affiliated organizations, or those of the publisher, the editors and the reviewers. Any product that may be evaluated in this article, or claim that may be made by its manufacturer, is not guaranteed or endorsed by the publisher.
References
Abouelresh, M. O. (2017). An integrated characterization of the porosity in qusaiba shale, Saudi Arabia. J. Petroleum Sci. Eng. 149, 75–87. doi:10.1016/j.petrol.2016.10.020
Chen, X., Zhang, R., Zhao, X., Yang, J., Lan, Z., Luo, C., et al. (2023). Multifractal estimation of NMR T2 cut-off value in low-permeability rocks considering spectrum kurtosis: SMOTE-Based oversampling integrated with machine learning. Petroleum Sci. 20, 3411–3427. doi:10.1016/j.petsci.2023.08.001
Coates, G. R., Xiao, L., and Primmer, M. G. (2000). NMR logging principles and applications. Houston, USA: Gulf Publishing Company, 1–256.
Dunn, K. J., Bergman, D. J., and Latorraca, G. A. (2002). “Nuclear magnetic resonance: petrophysical and logging applications,” in Handbook of geophysical exploration. New York, USA: Pergamon, 1–176.
Fan, Y., Liu, J., Ge, X., Deng, S., Liu, H., and Gu, D. (2018). Permeability evaluation of tight sandstone based on dual T2 cutoff values measured by NMR. Chin. J. Geophys. (in Chinese) 61 (4), 1628–1638. doi:10.6038/cjg2018L0037
Feng, M., Wang, L., Sun, L., Yang, B., Wang, W., Luo, J., et al. (2025). Characterization of pore structure and simulation of pore-scale flow in tight sandstone reservoirs. Fluid Dynamics and Materials Processing 21 (3), 573–587. doi:10.32604/fdmp.2024.056421
Gong, Y., Liu, S., Zhu, R., Liu, K., Tang, Z., and Jiang, L. (2015). Lower limit of tight oil flowing porosity: application of high-pressure Mercury intrusion in the fourth member of Cretaceous quantou formation in southern songliao basin, NE China. Petroleum Exploration and Development 42 (5), 745–752. doi:10.1016/s1876-3804(15)30071-9
Guo, X., He, S., Liu, K., Song, G., Wang, X., and Shi, Z. (2010). Oil generation as the dominant overpressure mechanism in the Cenozoic dongying depression, Bohai Bay basin, China. AAPG Bulletin 94 (12), 1859–1881. doi:10.1306/05191009179
Guo, X., Huang, Z., Zhao, L., Han, W., Ding, C., Sun, X., et al. (2019). Pore structure and multi-fractal analysis of tight sandstone using MIP, NMR and NMRC methods: a case study from the kuqa depression, China. Journal of Petroleum Science and Engineering 178, 544–558. doi:10.1016/j.petrol.2019.03.069
He, J., Ding, W., Jiang, Z., Li, A., Wang, R., and Sun, Y. (2016). Logging identification and characteristic analysis of the lacustrine organic-rich shale lithofacies: a case study from the Es 3 L shale in the jiyang depression, Bohai Bay basin, eastern China. J. Pet. Sci. Eng. 145, 238–255. doi:10.1016/j.petrol.2016.05.017
Hu, Q., Zhang, Y., Meng, X., Li, Z., Xie, Z., and Li, M. (2017). Characterization of micro-nano pore networks in shale oil reservoirs of Paleogene shahejie formation in dongying sag of Bohai Bay basin, east China. Petroleum Exploration and Development 44 (5), 720–730. doi:10.1016/s1876-3804(17)30083-6
Ji, B., and Fang, J. (2023). An overview of efficient development practices at low permeability sandstone reservoirs in China. Energy Geoscience 4 (3), 100179. doi:10.1016/j.engeos.2023.100179
Kong, L., Ostadhassan, M., Hou, X., Mann, M., and Li, C. (2019). Microstructure characteristics and fractal analysis of 3D-printed sandstone using micro-CT and SEM-EDS. Journal of Petroleum Science and Engineering 175, 1039–1048. doi:10.1016/j.petrol.2019.01.050
Lai, J., Li, H., Zhang, M., Bai, M., Zhao, Y., Fan, Q., et al. (2023). Advances in well logging geology in the era of unconventional hydrocarbon resources. Journal of Palaeogeography (Chinese Edition) 25 (5), 1118–1138. doi:10.7605/gdlxb.2023.05.057
Lai, J., Wang, G., Fan, Z., Zhou, Z., Chen, J., and Wang, S. (2018a). Fractal analysis of tight shaly sandstones using nuclear magnetic resonance measurements. AAPG Bulletin 102 (2), 175–193. doi:10.1306/0425171609817007
Lai, J., Wang, G., Wang, Z., Chen, J., Pang, X., Wang, S., et al. (2018b). A review on pore structure characterization in tight sandstones. Earth-Science Reviews 177, 436–457. doi:10.1016/j.earscirev.2017.12.003
Li, P., Shen, B.-J., Liu, Y.-L., Bi, H., Liu, Z.-B., Bian, R.-K., et al. (2025). The fractal characteristics of the pore throat structure of tight sandstone and its influence on oil content: a case study of the chang 7 member of the ordos basin, China. Petroleum Science. doi:10.1016/j.petsci.2025.03.016
Liu, X., Jin, Z., Lai, J., Fan, X., Guan, M., Shu, H., et al. (2021). Fractal behaviors of NMR saturated and centrifugal T2 spectra in oil shale reservoirs: the Paleogene funing formation in subei basin, China. Marine and Petroleum Geology 129, 105069. doi:10.1016/j.marpetgeo.2021.105069
Ma, Y., Fan, M., Lu, Y., Liu, H., Hao, Y., Xie, Z., et al. (2017). Middle Eocene paleohydrology of the dongying depression in eastern China from sedimentological and geochemical signatures of lacustrine mudstone. Palaeogeography, Palaeoclimatology, Palaeoecology 479, 16–33. doi:10.1016/j.palaeo.2017.04.011
Mandelbrot, B. B. (1977). “Fractals: form, chance, and dimension,” in Mathematics series. W. H. Freeman.
Mitchell, J., and Fordham, E. J. (2014). Contributed review: nuclear magnetic resonance core analysis at 0.3 T. Review of Scientific Instruments 85 (11), 111502. doi:10.1063/1.4902093
Ni, H., Liu, J., Huang, B., Pu, H., Meng, Q., Wang, Y., et al. (2021). Quantitative analysis of pore structure and permeability characteristics of sandstone using SEM and CT images. Journal of Natural Gas Science and Engineering 88, 103861. doi:10.1016/j.jngse.2021.103861
Ni, H., Pu, H., Liu, J., Xu, J., and Guo, J. (2025). A comparison study of pore structure and permeability of sandstone by BSE-SE images. Geoenergy Science and Engineering 244, 213435. doi:10.1016/j.geoen.2024.213435
Njiekak, G., Schmitt, D. R., and Kofman, R. S. (2018). Pore systems in carbonate formations, weyburn field, Saskatchewan, Canada: micro-Tomography, helium porosimetry and Mercury intrusion porosimetry characterization. Journal of Petroleum Science and Engineering 171, 1496–1513. doi:10.1016/j.petrol.2018.08.029
Qiao, J., Zeng, J., Jiang, S., Feng, S., Feng, X., Guo, Z., et al. (2019). Heterogeneity of reservoir quality and gas accumulation in tight sandstone reservoirs revealed by pore structure characterization and physical simulation. Fuel 253, 1300–1316. doi:10.1016/j.fuel.2019.05.112
Su, Y., Zha, M., Jiang, L., Ding, X., Qu, J., Jin, J., et al. (2022). Pore structure and fluid distribution of tight sandstone by the combined use of SEM, MICP and X-ray micro-CT. Journal of Petroleum Science and Engineering 208, 109241. doi:10.1016/j.petrol.2021.109241
Sun, Y., Lai, J., Dang, W., Bie, K., Zhao, Y., Zhao, X., et al. (2024). Pore structure characterization and reservoir quality prediction in deep and ultra-deep tight sandstones by integrating image and NMR logs. Journal of Asian Earth Sciences 272, 106232. doi:10.1016/j.jseaes.2024.106232
Talabi, O., AlSayari, S., Iglauer, S., and Blunt, M. J. (2009). Pore-scale simulation of NMR response. Journal of Petroleum Science and Engineering 67 (3), 168–178. doi:10.1016/j.petrol.2009.05.013
Wang, Z., Pan, M., Shi, Y., Liu, L., Xiong, F., and Qin, Z. (2018). Fractal analysis of donghetang sandstones using NMR measurements. Energy and Fuels 32 (3), 2973–2982. doi:10.1021/acs.energyfuels.7b03463
Washburn, E. W. (1921). The dynamics of capillary flow. Physical Review 17 (3), 273–283. doi:10.1103/physrev.17.273
Xia, W., Xi, K., Xin, H., Ma, W., Zhao, H., Feng, S., et al. (2025). The influence of pore throat heterogeneity and fractal characteristics on reservoir quality: a case study of chang 8 member tight sandstones, ordos basin. Unconventional Resources 5, 100123. doi:10.1016/j.uncres.2024.100123
Xiao, L., Li, J., Mao, Z., Lu, J., Yu, H., Guo, H., et al. (2018). A method to determine nuclear magnetic resonance (NMR) T2cutoff based on normal distribution simulation in tight sandstone reservoirs. Fuel 225, 472–482. doi:10.1016/j.fuel.2018.03.178
Xiao, L., Mao, Z.-Q., Zou, C.-C., Jin, Y., and Zhu, J.-C. (2016). A new methodology of constructing pseudo capillary pressure (pc) curves from nuclear magnetic resonance (NMR) logs. Journal of Petroleum Science and Engineering 147, 154–167. doi:10.1016/j.petrol.2016.05.015
Yan, J., He, X., Geng, B., Hu, Q., Feng, C., Kou, X., et al. (2017). Nuclear magnetic resonance T2 spectrum: multifractal characteristics and pore structure evaluation. Applied Geophysics 14, 205–215. doi:10.1007/s11770-017-0614-0
Yan, J., He, X., Zhang, S., Feng, C., Wang, J., Hu, Q., et al. (2020). Sensitive parameters of NMR T2 spectrum and their application to pore structure characterization and evaluation in logging profile: a case study from chang 7 in the yanchang formation, heshui area, ordos basin, NW China. Marine and Petroleum Geology 111, 230–239. doi:10.1016/j.marpetgeo.2019.08.025
Yan, J., Zhang, S., Wang, J., Hu, Q., Wang, M., and Chao, J. (2018). Applying fractal theory to characterize the pore structure of lacustrine shale from the zhanhua depression in Bohai Bay basin, eastern China. Energy Fuels 32 (7), 7539–7556. doi:10.1021/acs.energyfuels.8b01501
Yang, T., Tang, H., Dai, J., Wang, H., Wen, X., Wang, M., et al. (2025). Quantitative classification and prediction of pore structure in low porosity and low permeability sandstone: a machine learning approach. Geoenergy Science and Engineering 247, 213708. doi:10.1016/j.geoen.2025.213708
Yang, Y., Xiao, W., Bernabe, Y., Xie, Q., Wang, J., He, Y., et al. (2022). Effect of pore structure and injection pressure on waterflooding in tight oil sandstone cores using NMR technique and pore network simulation. Journal of Petroleum Science and Engineering 217, 110886. doi:10.1016/j.petrol.2022.110886
Zeng, S., Zhang, Y., Sun, B., Cai, Q., Zeng, B., Shen, Y., et al. (2024). Pore structure characterization and permeability prediction of uranium-bearing sandstone based on digital core. Nuclear Engineering and Technology 56 (11), 4512–4521. doi:10.1016/j.net.2024.06.014
Zhang, M., Zhong, Q., Li, G., Fu, X., Duan, C., Liu, H., et al. (2021). Fluid distribution and pore structure multifractal characteristics analysis of coal measure mudstone. Journal of Natural Gas Science and Engineering 88, 103810. doi:10.1016/j.jngse.2021.103810
Zhang, S., Wang, M., Zhu, X., Li, C., Cai, J., and Yan, J. (2024). Oil saturation quantitative evaluation in lacustrine shale: novel insights from NMR T1-T2 and displacement experiments. Fuel 371, 132062. doi:10.1016/j.fuel.2024.132062
Zhang, S., Yan, J., Hu, Q., Wang, J., Tian, T., Chao, J., et al. (2019). Integrated NMR and FE-SEM methods for pore structure characterization of shahejie shale from the dongying depression, Bohai Bay basin. Marine and Petroleum Geology 100, 85–94. doi:10.1016/j.marpetgeo.2018.11.003
Zheng, S., Sang, S., Yao, Y., Liu, D., Liu, S., Wang, M., et al. (2022). A multifractal-based method for determination NMR dual T2 cutoffs in coals. Journal of Petroleum Science and Engineering 214, 110488. doi:10.1016/j.petrol.2022.110488
Zhou, S., Liu, D., Cai, Y., and Yao, Y. (2016). Fractal characterization of pore–fracture in low-rank coals using a low-field NMR relaxation method. Fuel 181, 218–226. doi:10.1016/j.fuel.2016.04.119
Zhu, F., Hu, W., Cao, J., Sun, F., Liu, Y., and Sun, Z. (2018). Micro/Nanoscale pore structure and fractal characteristics of tight gas sandstone: a case study from the yuanba area, northeast sichuan basin, China. Marine and Petroleum Geology 98, 116–132. doi:10.1016/j.marpetgeo.2018.08.013
Keywords: dongying sag, low-permeability sandstone, pore structure, LNMR T2 spectrum, dual T2 cutoff values
Citation: Wang M, Chen K, Geng B and Liang Q (2025) Pore structure characterization of low-permeability sandstone by dual LNMR T2 cutoff values: a case study of the fourth member of shahejie formation, dongying sag, jiyang depression. Front. Earth Sci. 13:1610926. doi: 10.3389/feart.2025.1610926
Received: 13 April 2025; Accepted: 18 July 2025;
Published: 13 August 2025.
Edited by:
Xin Sun, Sinopec Matrix Co., Ltd, ChinaReviewed by:
Dahlia A. AL-Obaidi, University of Baghdad, IraqXu Dong, Northeast Petroleum University, China
Copyright © 2025 Wang, Chen, Geng and Liang. This is an open-access article distributed under the terms of the Creative Commons Attribution License (CC BY). The use, distribution or reproduction in other forums is permitted, provided the original author(s) and the copyright owner(s) are credited and that the original publication in this journal is cited, in accordance with accepted academic practice. No use, distribution or reproduction is permitted which does not comply with these terms.
*Correspondence: Min Wang, d2FuZ21pbjEzNi5zbHl0QHNpbm9wZWMuY29t