 Xi Xili1
 Chen Qian
- 1Sinopec Matrix Corporation, Qingdao, China
- 2China University of Petroleum (East China), Qingdao, China
Hydrogen gas is a promising clean-energy vector that can alleviate the current imbalance between energy supply and demand, diversify the energy portfolio, and underpin the sustainable development of oil and gas resources. This study pinpoints the factors that govern hydrogen quantification by pulsed-neutron logging. Monte Carlo simulations were performed to map the spatial distribution of capture γ-rays in formations saturated with either water or hydrogen and to systematically assess the effects of pore-fluid composition, hydrogen density, gas saturation, lithology, and borehole-fluid type. The results show that the counts of capture γ-rays are litter in hydrogen-bearing formations. For low-to moderate-porosity rocks, the dynamic response window for hydrogen-saturated pores is approximately 10% wider than that for methane-saturated pores. Increasing hydrogen density or decreasing gas saturation raises the capture-γ ratio while narrowing the dynamic range. Changes in borehole fluid substantially affect the capture-γ ratio yet have only a minor impact on the dynamic range. Lithology imposes an additional control: serpentinite, enriched in structural water, generates markedly higher capture-γ ratios that may complicate the quantitative evaluation of hydrogen.
1 Introduction
In the context of global efforts to combat climate change, the extensive use of traditional fossil fuels such as petroleum and natural gas has resulted in substantial carbon dioxide emissions, exacerbating greenhouse effects and global warming issues (Mehmood et al., 2020; Shanmugam, 2023; Liu et al., 2025). Hydrogen energy, characterized by its clean and efficient properties, is emerging as a promising alternative to conventional energy sources. In particular, naturally occurring hydrogen gas, which can be directly extracted as a green energy resource, demonstrates considerable potential for future development (Liu et al., 2024; Tian et al., 2022).
Geological surveys and research findings indicate that natural hydrogen (also known as “white hydrogen” or native hydrogen) is distributed across various geological settings worldwide (Gaucher, 2023). Zgonnik (2020) compiled data from 465 hydrogen-related geological locations, demonstrating that hydrogen seepage occurs on every continent (Zgonnik, 2020). To date, confirmed or ongoing exploration of natural hydrogen is concentrated in regions such as West Africa (e.g., the Taoudeni Basin in Mali), North America (e.g., the Kansas Basin in the United States), Australia (e.g., Western and South Australia), South America (e.g., Brazil), and Europe (e.g., France and Spain) (Han et al., 2025). These areas often feature specific geological contexts, including Precambrian cratons, serpentinized ultramafic belts, ancient rift zones, and fault-dominated regions, all of which are considered favorable for hydrogen generation and accumulation. For example, in African and Australian cratons, ongoing hydrogen production occurs as water reacts with Fe-rich basement rocks, with migration facilitated by deep fractures.
In the late 1980s, a well near the village of Bourakébougou emitted flammable gas, later identified as nearly pure hydrogen (∼98%). The reservoir lies within Precambrian basement rocks, and subsequent drilling revealed a shallow hydrogen-bearing system covering ∼50 km2. Remarkably, production tests showed that the hydrogen flow is self-replenishing, indicating an active subsurface generation process (Sequeira et al., 2025). Today, the field powers local electricity generation, making it the world’s first commercial use of native hydrogen.
At present, pulsed neutron logging technology has been widely utilized in petroleum and natural gas exploration. By measuring fast neutrons, thermal neutrons, and capture gamma rays generated through interactions between high-energy neutrons emitted by a D-T source and the formation, this technique enables effective evaluation of formation parameters such as porosity, density, and hydrocarbon saturation (Wang et al., 2021; Zhang et al., 2015; Fan et al., 2021; Zhou et al., 2018; Liu et al., 2018). Wu, Fan and Song et al. employed pulsed neutron logging techniques, combining capture gamma-ray spectra and neutron scattering cross-section measurements to monitor gas saturation in subsurface hydrogen storage reservoirs and during CO2 flooding of heavy oil, enabling quantitative characterization of gas-phase dynamics within the formation (Wu et al., 2024; Song et al., 2024). However, studies involving the application of this technology for the exploration of natural hydrogen resources remain limited, Wu studied the use of capture gamma rays for hydrogen saturation calculations but did not investigate gas identification between hydrogen and methane, nor the impact of formation matrix type and borehole fluid type on gas identification (Wu et al., 2024). Pirrone focused on monitoring gas reservoirs using inelastic gamma, porosity, and capture cross-sections, enabling the monitoring of water saturation and hydrogen content, and discussed the influence of pressure, but did not examine capture gamma response (Pirrone et al., 2024).
This study investigates the capture gamma ray ratio response of hydrogen in natural hydrogen-bearing formations, comparing the capture ratio differences between hydrogen and methane. It provides valuable insights for gas type analysis using capture gamma rays. Additionally, the study explores the effects of gas saturation, hydrogen density, formation matrix type, and borehole fluid on hydrogen evaluation via capture gamma rays, thereby establishing a foundation for the quantitative assessment of hydrogen using this technique.
2 Research background
2.1 Properties of hydrogen
Hydrogen is a colorless, odorless, and flammable gas characterized by the smallest molecular weight among elemental gases. It possesses low density, low viscosity, and unique biochemical reactivity. Under identical temperature and pressure conditions, the density of hydrogen gas is only one-eighth that of methane, and its viscosity is merely 0.0101 mPa s at a pressure of 101.325 kPa and temperature of 0°C.
Current research indicates four primary pathways for natural hydrogen generation: (1) Natural radiolytic decomposition of deep groundwater induced by radioactive elements within highly radioactive rocks; (2) Reaction between subsurface hydrothermal fluids and peridotite during serpentinization, releasing hydrogen gas; (3) Deep-origin hydrogen emanating from the Earth’s core or mantle; and (4) Fault movements during rock fracturing processes, along with the associated formation of radicals.
Figure 1 presents macroscopic inelastic scatter cross-sections for quartz, calcite, dolomite, clay minerals, chlorite, water, oil, and hydrogen. It is evident from the figure that the macroscopic inelastic scatter cross-sections of hydrogen gas are significantly smaller compared to mineral constituents such as quartz, and also notably different from fluid phases like water and oil. This distinct difference serves as the fundamental principle for hydrogen evaluation using pulsed neutron logging techniques.
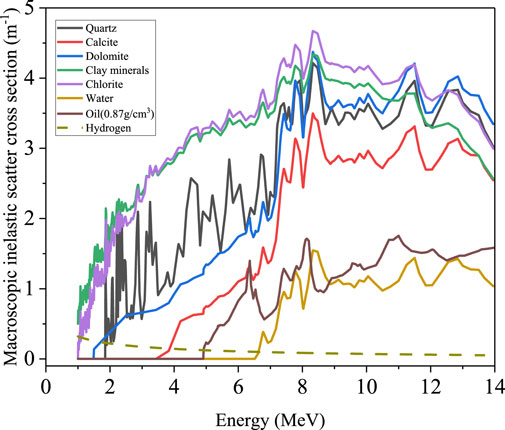
Figure 1. Macroscopic neutron inelastic scatter cross-sections for different media (Brown et al., 2018).
Figure 2 presents the distribution of capture gamma rays at the detector positions under conditions of either water- or hydrogen-filled formation pores. As observed from the figure, the spatial distribution of capture gamma rays in the hydrogen-bearing formation is significantly narrower compared to that in the water-bearing formation. When formation pores are filled with hydrogen gas instead of fresh water, the capture gamma counts recorded near the detector are substantially reduced—by nearly an order of magnitude of 20 times—highlighting the distinct neutron interaction characteristics of natural hydrogen. This phenomenon is primarily attributed to differences in neutron moderation capability between the borehole and the formation materials. A stronger neutron moderation effect results in an increased number of thermal neutrons generated after interactions between fast neutrons and the formation. Consequently, under identical conditions, a higher capture gamma-ray count rate is produced.
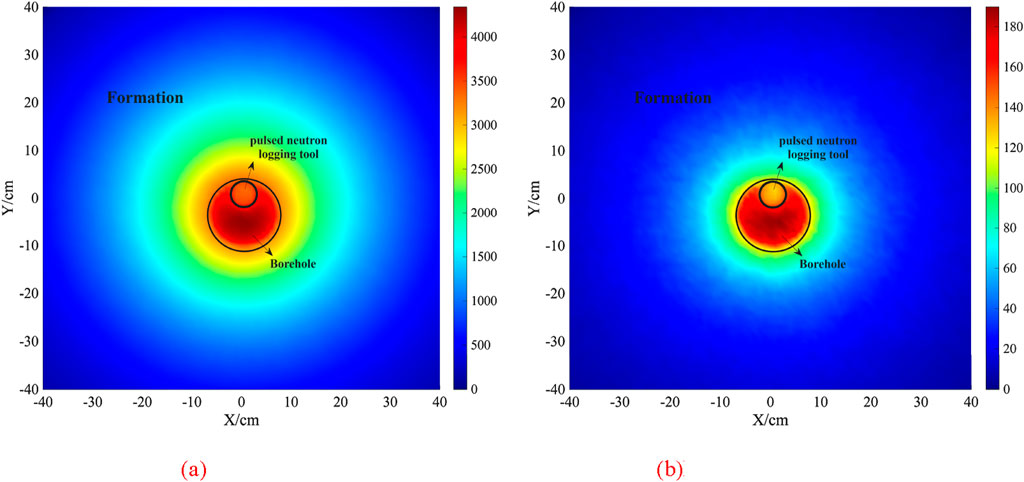
Figure 2. Capture gamma-ray field distributions for water- and hydrogen-filled pores [(a,b) illustrate the distribution of capture gamma rays in formations with pore spaces filled with water at a density of 1.0 g/cm3 and hydrogen at a density of 0.025 g/cm3, respectively]. (a) Water-filled (b) Hydrogen-filled.
2.2 Pulsed neutron capture gamma logging principle
According to the two-group neutron diffusion theory (Huang, 1985), the thermal neutron flux resulting from inelastic scattering, elastic scattering, and radiative capture interactions between fast neutrons emitted by a pulsed neutron source and the formation medium can be expressed as:
In Equation 1,
By taking the gamma rays generated from the capture of thermal neutrons
In Equation 2,
Thus, the ratio of capture gamma-ray counts at two different source-detector spacings
As indicated by Equation 4, when the source-detector spacings are fixed, the capture gamma-ray ratio is primarily influenced by the slowing-down length, diffusion length, and gamma-ray attenuation characteristics of the formation media. Considering that in compensated neutron logging the slowing-down length for fast neutrons is significantly greater than the diffusion length of thermal neutrons, the capture gamma-ray ratio predominantly reflects the neutron moderation capability of the formation.
3 Numerical modelling
Based on the structural parameters of the pulsed neutron logging tool, a numerical calculation model for pulsed neutron logging in hydrogen-bearing formations was developed. The overall geometry of the model is cylindrical, with a radius of 60 cm and a height of 120 cm. The formation matrix was composed of granite rock, and its porosity varied from 0 to 20 porosity units (p.u.). The wellbore had a diameter of 20 cm and included a cement sheath and casing. The casing was made of stainless steel with a density of 7.78 g/cm3, an outer diameter of 5.5 inches, and a wall thickness of 7.72 mm. The cement sheath was made of silicate material with a density of 2.15 g/cm3 and a thickness of 3.0 cm.
The pulsed neutron logging tool was positioned inside the casing, tightly against its inner surface. A D-T neutron tube emitting neutrons at an energy level of 14 MeV was used as the neutron source, with pulse emission cycles ranging from 0 to 40 μs, and a neutron source intensity of 1 × 10⁸ n/s. The logging tool employed three LaBr3 gamma-ray detectors positioned at source-detector spacings of 33 cm, 58 cm, and 78 cm, respectively. Each detector crystal had a diameter of 1.5 inches, while their lengths were 2 inches (near detector), 4 inches (middle detector), and 6 inches (far detector), respectively. The inelastic gamma-ray recording time window was set from 0 to 40 μs, while the capture gamma-ray recording time window was set from 50 to 200 μs Additionally, variance reduction techniques such as weight-window and DXTRAN methods were applied to reduce simulation errors and ensure adequate accuracy of the numerical results.
4 Results and discussion
4.1 Capture gamma response of different pore fluids
A numerical calculation model, as shown in Figure 3, was established with porosities ranging from 0 to 20 p. u. at intervals of 5 p. u. The formation pores were separately filled with freshwater, natural gas (methane), and hydrogen, having densities of 1.0 g/cm3, 0.2 g/cm3, and 0.025 g/cm3, respectively. Capture gamma-ray data from the near and far detectors were recorded, and the ratio of capture gamma-ray counts was calculated, as illustrated in Figure 4.
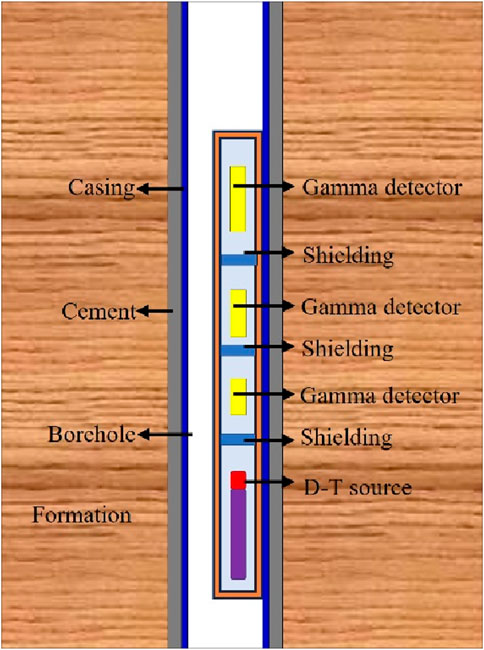
Figure 3. Schematic diagram of the numerical simulation model comprising a D-T neutron source (14 MeV), three gamma detectors, casing, cement sheath, and formation. The neutron emission time window is 0–40 µs, and the capture gamma recording window is 50–200 µs.
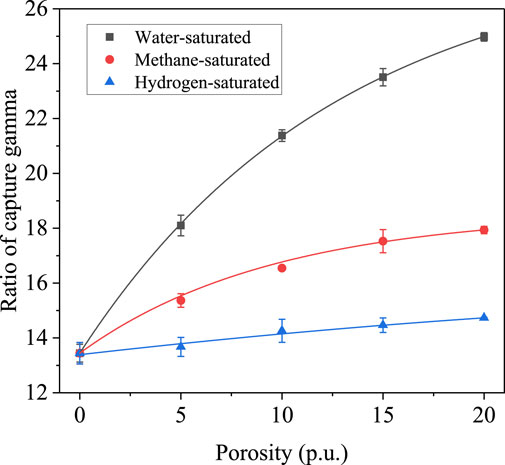
Figure 4. Dependence of capture gamma ray ratio on porosity under varying pore fluid conditions. The black curve corresponds to water-saturated pores, the red curve to methane-saturated pores, and the blue curve to hydrogen-saturated pores. Under identical formation parameters, the capture gamma ratio associated with hydrogen saturation is significantly lower than that of methane, thereby providing a reliable physical basis for distinguishing between methane- and hydrogen-bearing formations.
From Figure 4, it can be observed that, for limestone formations, the capture gamma-ray ratio exhibits a significant positive correlation with porosity. As the porosity increases, the capture gamma-ray ratio also rises; however, the magnitude of this increase varies depending on the fluid filling the pores. Among the three fluids, freshwater has the strongest neutron moderation capability, followed by methane, with hydrogen being the weakest. Thus, for a given porosity, a stronger neutron moderation capability of the pore fluid results in a higher capture gamma-ray ratio. Therefore, the capture gamma-ray ratio is predominantly influenced by the neutron moderation properties of the pore-filling medium.
To further analyze the variations in capture gamma rays when pores are filled with natural gas or hydrogen, a dynamic variation parameter is defined as the ratio of the difference between capture gamma-ray counts in water-filled and gas-filled pores to the counts in water-filled pores, expressed mathematically as follows:
where,
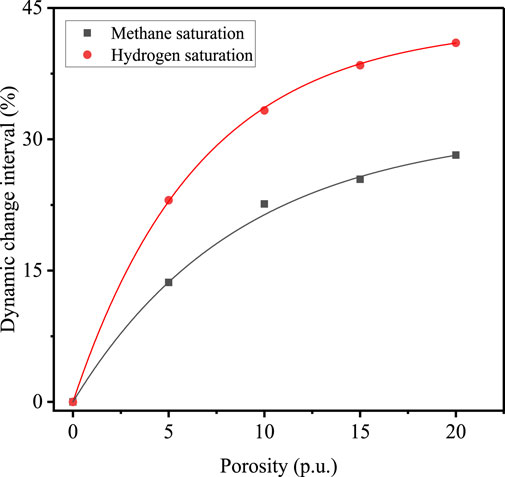
Figure 5. Comparison of the dynamic range of capture gamma responses for methane- and hydrogen-saturated pores relative to water saturation. The red curve denotes hydrogen saturation, and the black curve denotes methane saturation. This also indicates that hydrogen and methane exhibit distinct differences in their capture gamma ratio responses.
4.2 Capture gamma response for different gas saturations
A numerical model, as illustrated in Figure 3, was established with a limestone formation matrix and a porosity of 10 p. u. The pores were filled with mixtures of hydrogen gas and freshwater. The pore-space gas saturation was systematically varied (100, 80, 60, 40, and 20%), and the corresponding capture-gamma ratios are presented in Figure 6.
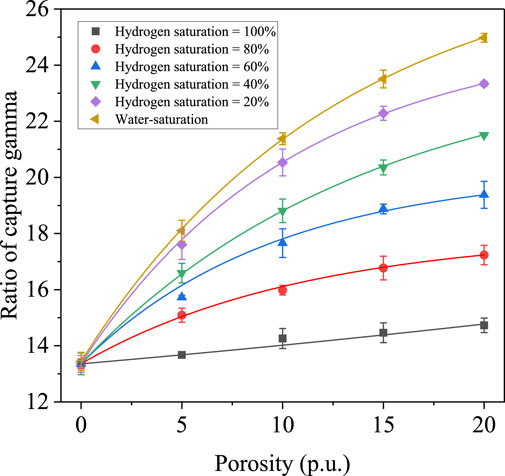
Figure 6. Capture gamma ratio responses as a function of hydrogen saturation. The yellow curve represents freshwater-saturated pores, while the purple, green, blue, red, and black curves correspond to hydrogen saturations of 20%, 40%, 60%, 80%, and 100%, respectively. An inverse correlation is observed between hydrogen saturation and capture gamma ratio, with higher hydrogen saturations yielding lower capture gamma responses.
As demonstrated in Figure 6, for a fixed hydrogen gas saturation, the capture gamma-ray ratio increases with increasing porosity. Conversely, for a constant porosity, the capture gamma-ray ratio decreases with increasing hydrogen gas saturation. In compensated neutron porosity logging, a negative hydrogen index often appears when pores contain low-density gases, because the neutron moderation capability of gas is lower than that of the rock matrix, resulting in underestimated porosity measurements. However, the capture gamma-ray ratio does not exhibit a similar “excavation effect” phenomenon. Instead, the capture gamma-ray counts consistently increase as the neutron moderation capability of the pore-filling fluid or gas increases.
4.3 Capture gamma response of different lithologic matrix
A numerical model (Figure 3) was developed for three representative lithologies—serpentinite, granite, and shale—whose mineralogical compositions are listed in Table 1. For each case, porosity was fixed at 10 p. u. and the pore space was completely saturated with hydrogen gas. The resulting capture γ-ray ratios are presented in Figure 7. Granite and shale are dominated by quartz (SiO2) and contain no structural water, although minor oxides such as FeO, Al2O3, K2O, and CaO are present. In contrast, serpentinite is composed mainly of quartz and MgO and, in addition to the aforementioned trace oxides, includes approximately 10 wt% structural water.
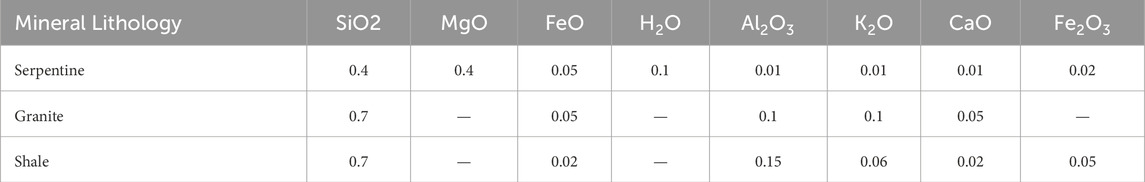
Table 1. Mineralogical composition of different lithological matrices (The table provides the specific mineral mass fractions for three types of formation rocks: Serpentine, Granite, and Shale).
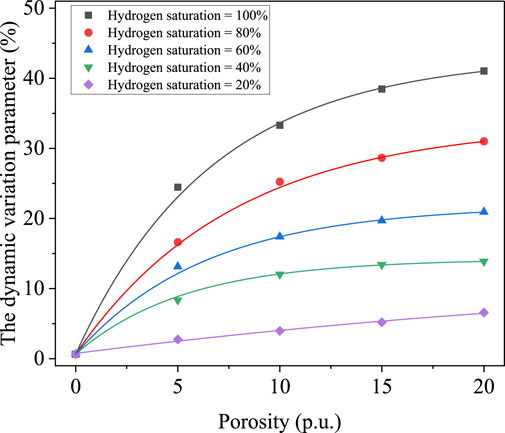
Figure 7. Dynamic variation ranges of capture gamma responses at various hydrogen saturations. The black, red, blue, green, and purple curves represent hydrogen saturations of 100%, 80%, 60%, 40%, and 20%, respectively. An increase in hydrogen saturation leads to a significant expansion of the dynamic variation range.
Figure 8 shows the response of the capture gamma-ray ratio with varying porosity for hydrogen-filled pores under three different lithological matrices. When the formation matrix is granite or shale, the capture gamma-ray ratio increases with increasing porosity. However, for serpentinite, the ratio decreases as porosity increases. This response is attributed primarily to serpentinite’s greater structural-water content; because water provides markedly stronger neutron moderation than hydrogen gas, increasing porosity diminishes the bulk moderating capacity of serpentinite and consequently lowers the capture-gamma ratio. Figure 9 illustrates the dynamic variation ranges for different lithological matrices. The dynamic variation ranges for granite and shale are nearly identical and consistently larger than those of serpentinite, with the maximum difference in dynamic range reaching approximately 25%.
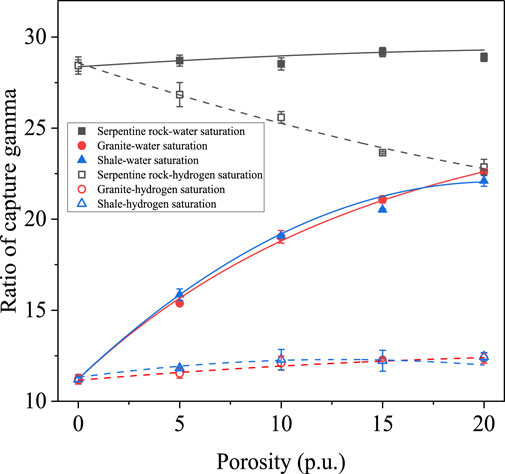
Figure 8. Capture gamma ratio responses under three different rock matrix conditions with pores saturated by either freshwater or hydrogen. The black, red, and blue curves correspond to Serpentine, Granite, and Shale matrices, respectively. Solid lines represent freshwater saturation, while dashed lines represent hydrogen saturation. The capture gamma ratios for Shale and Granite matrices are nearly identical, while a clear distinction is observed compared to the Serpentine matrix.
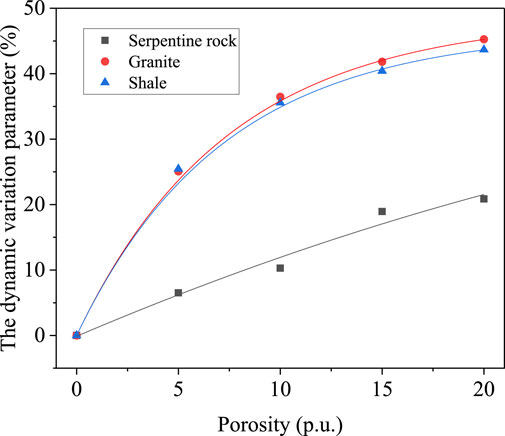
Figure 9. Dynamic variation ranges of capture gamma responses for different formation matrix compositions. The black curve corresponds to Serpentine, the red curve to Granite, and the blue curve to Shale. The dynamic variation ranges for Shale and Granite matrices are nearly identical.
4.4 Capture gamma response for different hydrogen densities
A numerical calculation model, as shown in Figure 3, was established with a granite formation matrix and a fixed porosity of 10 p. u. Hydrogen gas was used to fill the pores, with gas densities set at 0.0025 g/cm3, 0.05 g/cm3, and 0.1 g/cm3, respectively. Under subsurface high-temperature and high-pressure conditions, changes in temperature and pressure can alter the density of hydrogen gas. By examining the capture gamma-ray response at varying hydrogen densities, the variations in capture gamma-ray measurements under different pressure conditions were assessed.
Figure 10 presents the capture gamma-ray responses for the three hydrogen densities. When other conditions remain constant, higher pressures correspond to greater gas densities, leading to an increase in the capture gamma-ray ratio as hydrogen density increases within the pores. An increase in hydrogen gas density enhances the number of hydrogen atoms per unit volume, thereby strengthening neutron moderation capability and consequently increasing the capture gamma-ray ratio. Figure 11 illustrates the dynamic variation ranges under different hydrogen gas density conditions. As hydrogen density increases, the dynamic variation range decreases. This phenomenon arises because higher hydrogen densities result in an increased hydrogen index within the formation, enhancing neutron moderation capability. Consequently, the difference in neutron moderation between hydrogen-filled and water-filled pores diminishes, thereby reducing the dynamic variation range.
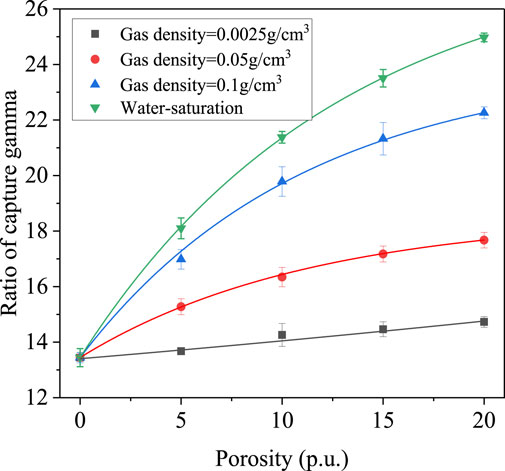
Figure 10. Capture gamma ratio responses under varying hydrogen densities within the pore space. The black, red, and blue curves correspond to hydrogen densities of 0.025 g/cm3, 0.05 g/cm3, and 0.1 g/cm3, respectively, while the green curve represents freshwater saturation. Lower hydrogen densities result in smaller capture gamma ratios.
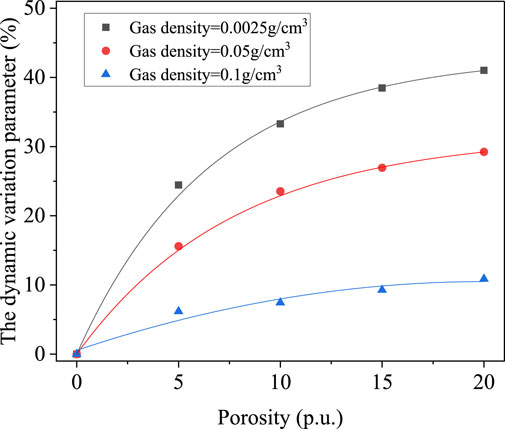
Figure 11. Dynamic variation ranges of capture gamma responses under different hydrogen density conditions. The black, red, and blue curves correspond to hydrogen densities of 0.025 g/cm3, 0.05 g/cm3, and 0.1 g/cm3, respectively. Lower hydrogen densities result in a larger dynamic variation range.
4.5 Capture gamma response for different borehole fluid
Based on the configuration shown in Figure 3, a numerical model was built for two borehole conditions—hydrogen-filled and freshwater-filled. Formation porosity was varied from 0 to 30 p. u. in 5 p. u. increments, with the pore space in each case filled by hydrogen or freshwater, respectively. The resulting capture-gamma count ratios as a function of porosity are presented in Figure 12. Based on the simulated data, Equation 5 was applied to calculate the dynamic response range for each borehole-fluid type across the porosity and the resulting trends are depicted in Figure 13.
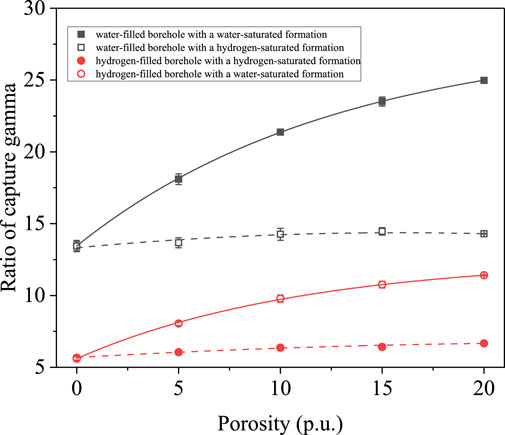
Figure 12. Capture gamma ratio responses under different borehole and formation fluid conditions. The black curve represents a borehole filled with freshwater, and the red curve represents a borehole filled with hydrogen. Solid lines correspond to formations saturated with freshwater, while dashed lines correspond to formations saturated with hydrogen. The borehole fluid type has a significant impact on the magnitude of the capture gamma ratio.
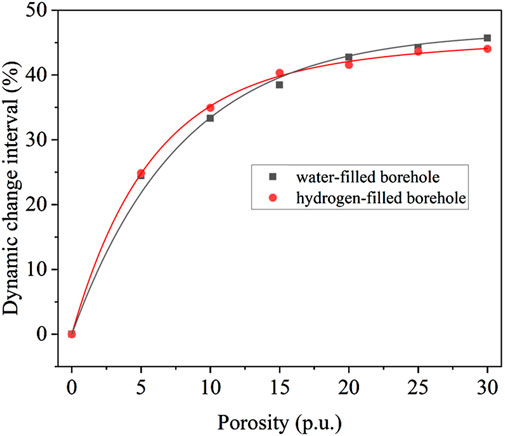
Figure 13. Dynamic variation ranges of capture gamma responses for boreholes filled with freshwater and hydrogen, respectively. Although the change in borehole fluid significantly affects the capture gamma ratio, the dynamic variation ranges under both conditions are nearly identical.
Figure 12 presents the capture-gamma response characteristics under a range of formation conditions for boreholes filled with hydrogen and, for comparison, with freshwater. At any given porosity, the capture-gamma ratio is systematically lower in a hydrogen-filled borehole, owing to hydrogen’s low density and correspondingly smaller hydrogen index per unit volume, which reduce the neutron-capture probability relative to water. As a result, the absolute difference between the hydrogen- and freshwater-saturated cases is modest when the borehole fluid itself is hydrogen. Figure 13 plots the dynamic response range for boreholes filled with hydrogen and freshwater, respectively. The two curves are virtually coincident, indicating that the influence of borehole-fluid composition on the capture-gamma ratio is largely cancelled during the dynamic-range calculation. Hence, the overall dynamic response is essentially insensitive to whether the borehole is filled with hydrogen or freshwater.
5 Conclusion
Hydrogen exhibits significantly different neutron cross-sections compared to other minerals or fluids. In this study, Monte Carlo numerical simulations were employed to investigate the distribution and characteristic behavior of capture gamma rays under various hydrogen-bearing formation conditions. The following conclusions were drawn:
Compared to water-filled pores, when low-density and low-viscosity hydrogen gas is present in the pores, the capture gamma-ray counts within and near the borehole decrease significantly. Relative to water- or methane-filled pores, hydrogen-filled pores result in a substantial reduction in the capture gamma-ray ratio, highlighting a clear distinction between hydrogen and water. When the pore space is filled with hydrogen and methane, the capture gamma ratio of hydrogen is significantly lower. This difference can aid in distinguishing between hydrogen and methane gases. Changes in the borehole fluid type significantly affect the captured gamma ratio but have little effect on the dynamic range. A decrease in hydrogen saturation or an increase in hydrogen density enhances the neutron moderation capacity of the formation, thereby increasing the capture gamma-ray ratio. When pores are filled with hydrogen, the lithological matrix has a pronounced impact on the capture gamma-ray ratio. In particular, matrices containing crystalline water exhibit more significant variations, which may cause notable interference in the quantitative identification and evaluation of hydrogen in the formation.
Data availability statement
The original contributions presented in the study are included in the article/supplementary material, further inquiries can be directed to the corresponding author.
Author contributions
XX: Writing – original draft. CQ: Data curation, Writing – review and editing. ZF: Investigation, Writing – review and editing.
Funding
The author(s) declare that no financial support was received for the research and/or publication of this article.
Conflict of interest
Authors XX and CQ were employed by Sinopec Matrix Corporation.
The remaining author declares that the research was conducted in the absence of any commercial or financial relationships that could be construed as a potential conflict of interest.
Generative AI statement
The author(s) declare that no Generative AI was used in the creation of this manuscript.
Publisher’s note
All claims expressed in this article are solely those of the authors and do not necessarily represent those of their affiliated organizations, or those of the publisher, the editors and the reviewers. Any product that may be evaluated in this article, or claim that may be made by its manufacturer, is not guaranteed or endorsed by the publisher.
References
Brown, D. A., Chadwick, M. B., Capote, R., Kahler, A., Trkov, A., Herman, M., et al. (2018). ENDF/B-VIII.0: the 8th major release of the nuclear reaction data library with CIELO-project cross sections, new standards and thermal scattering data. Nucl. Data Sheets 148, 1–142. doi:10.1016/j.nds.2018.02.001
Fan, J., Zhang, F., Tian, L., Liang, Q., Zhang, X., Fang, Q., et al. (2021). A method of monitoring gas saturation in carbon dioxide injection heavy oil reservoirs by pulsed neutron logging technology. Petroleum Explor. Dev. 48 (6), 1420–1429. doi:10.1016/S1876-3804(21)60298-7
Gaucher, E. C. (2023). The place of natural hydrogen in the energy transition: a position paper. Eur. Geol. 55, 5–9. doi:10.5281/zenodo.8108239
Han, S., Huang, J., Prinzhofer, A., and Wang, C. (2025). Advances in global natural hydrogen research and exploration. Adv. Geo-Energy Res. 15 (2), 91–94. doi:10.46690/ager.2025.02.01
Liu, J., Liu, S., Zhang, F., Su, B., Yang, H., Xu, Y., et al. (2018). A method for evaluating gas saturation with pulsed neutron logging in cased holes. J. Nat. Gas Sci. Eng. 59, 354–362. doi:10.1016/j.jngse.2018.09.018
Liu, L., Chen, L., Yin, Z., Jiang, F., Lei, F., Cheng, T., et al. (2025). Review and prospect of global greenhouse gas remote sensing monitoring and inventory research[J/OL]. Chin. Sci. Bull. 1–22.
Liu, Q., Wu, X., Meng, Q., Zhu, D., Huang, X., Zhu, D., et al. (2024). Natural hydrogen: a potential carbon-free energy source. Chin. Sci. Bull. 69 (17), 2344–2350. doi:10.1360/tb-2024-0029
Mehmood, I., Amna, B., Shakeel, I., Fatima, K., Sehrish, L., Hamza, A., et al. (2020). “Carbon cycle in response to global warming,” in Environment, climate, plant and vegetation growth, 1–15.
Pirrone, M., Machicote, S., and De Lisio, S. (2024). Pulsed neutron logging for underground hydrogen storage monitoring in depleted reservoirs. InSPE Eur. Featur. A. T. EAGE Conf. Exhibition?, D031S020R002. SPE.
Sequeira, M., Morales, E., Moretti, I., Veroslavsky, G., Plenc, F., d’Avila, R., et al. (2025). Natural hydrogen in Uruguay: catalog of H2-generating rocks, prospective exploration areas, and potential systems. Geosciences 15 (2), 54. doi:10.3390/geosciences15020054
Shanmugam, G. (2023). Fossil fuels, climate change, and the vital role of CO2 plays in thriving people and plants on planet Earth. Bull. Mineral Res. Explor. 175 (175), 167–175.
Song, X., Wu, W., Zhang, H., He, L., Dong, D., Fu, X., et al. (2024). Improving the accuracy of CO2 sequestration monitoring in depleted gas reservoirs using the pulsed neutron-gamma logging technique. Int. J. Greenh. Gas Control 132, 104080. doi:10.1016/j.ijggc.2024.104080
Tian, Q. N., Zhang, W., and Wang, H. H. (2022). Non-negligible new energy in the energy transition context: natural hydrogen. Geol. Surv. China 9 (1), 1–15. doi:10.19388/j.zgdzdc.2022.01.01
Wang, Z., Liang, G., Chen, Q., Qiu, F., and Zhang, F. (2021). Inversion method of gamma spectrum from neutron inelastic scattering based on time-frequency analysis. Prog. Geophys. 36 (4), 1717–1723. doi:10.6038/pg2021EE0310
Wu, P., Zhao, X., Ling, H., Feng, M., Dong, X., Gan, C., et al. (2024). Simulation of gas-water identification in sandstone hydrogen reservoirs based on pulsed neutron logging. Int. J. Hydrogen Energy 62 (62), 835–848. doi:10.1016/j.ijhydene.2024.03.039
Zgonnik, V. (2020). The occurrence and geoscience of natural hydrogen: a comprehensive review. Earth-Science Rev. 203, 103140. doi:10.1016/j.earscirev.2020.103140
Zhang, R., Pan, B., Yang, X., Liu, D., and Jiang, B. (2015). Advances in pulsed neutron source density logging. Prog. Geophys. 30 (6), 2596–2602.
Keywords: natural hydrogen, pulsed neutron logging, capture gamma, hydrogen identification, Monte Carlo method
Citation: Xili X, Qian C and Feng Z (2025) Modeling the pulsed neutron response for natural hydrogen detection. Front. Earth Sci. 13:1611038. doi: 10.3389/feart.2025.1611038
Received: 13 April 2025; Accepted: 17 June 2025;
Published: 01 July 2025.
Edited by:
Giovanni Martinelli, National Institute of Geophysics and Volcanology, ItalyReviewed by:
Zhenguan Wu, Southwest Petroleum University, ChinaKa-Ngo Leung, University of California, Berkeley, United States
Copyright © 2025 Xili, Qian and Feng. This is an open-access article distributed under the terms of the Creative Commons Attribution License (CC BY). The use, distribution or reproduction in other forums is permitted, provided the original author(s) and the copyright owner(s) are credited and that the original publication in this journal is cited, in accordance with accepted academic practice. No use, distribution or reproduction is permitted which does not comply with these terms.
*Correspondence: Chen Qian, dXBjY3FpYW5AMTYzLmNvbQ==