 Ganbold Ulambayar1,2*
 Tatsuya Watanabe1
 Avirmed Dashtseren2,3
 Dai Nakamura1
 Yamkhin Jambaljav4
 Ganbold Byambabayar5
 Khurelbaatar Temuujin2Gansukh Tsogt-Erdene2Dagvadorj Otgonjargal1
- 1Faculty of Engineering, Graduate School of Engineering, Kitami Institute of Technology, Kitami, Japan
- 2Institute of Geography and Geoecology, Mongolian Academy of Sciences, Ulaanbaatar, Mongolia
- 3UNESCO Chair of Environmental Sciences in Eastern Central Asia, Mongolian Academy of Sciences, Ulaanbaatar, Mongolia
- 4Geocryo LLC, Ulaanbaatar, Mongolia
- 5Department of Geography, School of Arts and Sciences, National University of Mongolia, Ulaanbaatar, Mongolia
Aufeis is a common phenomenon in the Northern Hemisphere and continues to pose a recurring challenge to settlement areas and urban infrastructure in Ulaanbaatar, Mongolia, during winter. Although it occurs annually, the processes and natural factors that contribute to its formation are not yet fully understood. This study analyzed the long-term spatial distribution of aufeis and the natural factors influencing its occurrence. Landsat satellite imagery from 2009 to 2024 was used to track multi-year changes in aufeis extent, and the results were compared with various natural factors. The findings revealed that the extent of aufeis over the past 14 years fluctuated between 0.01 km2 and 0.03 km2. It showed a weak correlation with air temperature but a relatively strong correlation with precipitation prior to aufeis formation. During the winter of 2023–2024, the aufeis expanded to 0.04 km2 and encroached into settlement areas. This shift was associated with a thick snow cover, which insulated the ground, prevented freezing, and allowed spring water to flow beneath the snowpack. The water subsequently accumulated in low-lying areas, leading to the formation of aufeis. These areas are densely populated, and as a result, many households were affected by the expansion of aufeis during the 2023–2024 winter. Additionally, surface emergence of soil water contributed to the enlargement of the aufeis. These results highlight the critical role of snow cover thickness, topography, and subsurface hydrology in controlling the extent and spatial dynamics of aufeis development.
1 Introduction
Aufeis refers to the sheet-like accumulation of layered ice that forms on the ground surface or river or lake ice via the freezing of successive water flows. This water may seep from the ground, originate from spring flows, or emerge from beneath river ice through fractures (Everdingen, 1998). Aufeis is a prevalent phenomenon in the Northern Hemisphere (Yoshikawa et al., 2007), including North America (Crites et al., 2020; Morse and Wolfe, 2015; Brasseur et al., 2016), Siberia (Makarieva et al., 2019; 2022; Alekseev et al., 2023), High Mountain Asia (Gagarin et al., 2022; Brombierstäudl et al., 2021; 2023; Schmitt et al., 2024), and Mongolia (Walther et al., 2021; Chernykh et al., 2024). The processes underlying aufeis formation are complex and influenced by a range of factors, including climate, meteorology, geological conditions, soil properties, permafrost distribution, hydrological systems, and ground topography (Morse and Wolfe, 2015; Ensom et al., 2020).
The formation of aufeis plays a multifaceted role in ecosystems. Although aufeis leads to the accumulation of large amounts of ice and reduces winter baseflow, it subsequently enhances spring discharge during the thawing period (Li et al., 1997; Prowse et al., 2011). This seasonal redistribution of water contributes to regional moisture balance. However, the relationship between aufeis and vegetation growth is complex. On the one hand, the gradual release of meltwater from aufeis can promote earlier plant growth by supplying additional moisture in spring. On the other hand, prolonged ice coverage can delay soil warming and hinder vegetation development (Brombierstäudl et al., 2023; Frost et al., 2023). In addition to its ecological effects, aufeis has geomorphological implications, such as reducing riverbank erosion and influencing the evolution of river networks (Åkerman, 1982; Alekseev, 2015). Furthermore, aufeis can serve as refuges for certain animal species (Clough et al., 1987; Toupin et al., 1996; Huryn et al., 2021; Stanford et al., 2024) and as a crucial drinking water source for local communities (Liu et al., 2021; Kuklina et al., 2025). However, aufeis also has negative consequences, such as blocking river channels and culverts, reducing flow capacity that may lead to overflow and flood events (Zufelt et al., 2006; Daly et al., 2011; Toniolo et al., 2017; Turcotte et al., 2023). Moreover, aufeis on roads, railways, and footpaths disrupts transportation systems and creates safety hazards (Carey, 1973; Yu et al., 2005). Additionally, aufeis on buildings and infrastructure constitutes a geohazard, causing damage and compromising structural stability (Carey, 1973; Turcotte et al., 2023).
Mongolia ranks as the 18th largest country in terms of land area and has the largest area per capita among countries (National Atlas of Mongolia, 2022). In 2023, the population of Mongolia was approximately 3.5 million, with 70.8 percent of the population residing in Ulaanbaatar and 29.2 percent living in rural areas (Statistical Information Service of Mongolia, 2023). Ulaanbaatar is the coldest capital city globally, with an average annual temperature of only 0.2°C. Despite the vastness of the country, the overconcentration of the population in Ulaanbaatar, coupled with its extreme weather conditions, means that aufeis affects roads, buildings, infrastructure, and many households annually (Walther et al., 2021). This issue is compounded by the migration of households from rural areas, who tend to settle in regions prone to aufeis because of limited land availability in the capital (Walther et al., 2021). Although aufeis has been documented in some regions in Mongolia, including mountainous areas and river valleys (Chernykh et al., 2024), its formation and development in densely populated urban areas remain poorly understood.
The scarcity of geoscientific data on aufeis distribution in urban areas hampers the identification of terrain hazards associated with its occurrence. Aufeis is influenced by local and regional factors, resulting in spatial recurrence, though not on a consistent annual basis or to the same extent (Morse and Wolfe, 2015). In response to this gap, a study was conducted in October 2023 to investigate the dynamics of aufeis and the factors influencing its formation, concentrating on a specific area in Ulaanbaatar where aufeis is known to occur. During the winter of 2023–2024, considerable changes in the spatial distribution of aufeis were observed, leading to its formation in settlement areas and directly affecting nearby households.
This study aims to identify the causes of these alterations in aufeis distribution, analyze dynamic changes over the past years, and assess the contribution of certain natural factors to observed aufeis dynamics. Additionally, this study elucidates aufeis’s origins, characteristics, distribution changes, and social impacts.
2 Study area
The study area is located in Ulaanbaatar, Mongolia, at coordinates 48°0′N and 106°47′E, within the Baruunsalaa River basin (Figure 1). According to data sourced from the Ulaanbaatar meteorological station, the region’s mean annual air temperature (MAAT) is 0.2°C, based on historical records encompassing 1991 to 2023 (Meteorological and Environmental Information Database, 2024). The local climate is classified as continental, characterized by cold winters with a mean January temperature of −21.3°C and relatively warm summers with a mean July temperature of 19.0°C. This area receives an average annual precipitation of approximately 273 mm (Meteorological and Environmental Information Database, 2024). The study area is approximately ∼7 km in length and is surrounded by mountains with elevations ranging from 1,250 to 1,750 m above sea level. The regional geology is dominated by Paleozoic metamorphic and igneous bedrock, including granite and gneiss, which is overlain by sedimentary formations such as sandstone and limestone. In lower-lying areas, particularly along the River floodplain, widespread Quaternary alluvial deposits composed primarily of sand, gravel, and clay are present (Geological Map of Mongolia, 1998). Due to the semi-arid climate, the vegetation is characterized by grassland and shrubs, while river wetland areas feature thick layers of organic soil. The presence of peat in the wetland is a clear indicator of underlying permafrost, and the study area is located within sporadic and isolated permafrost zones (Yamkhin et al., 2022).
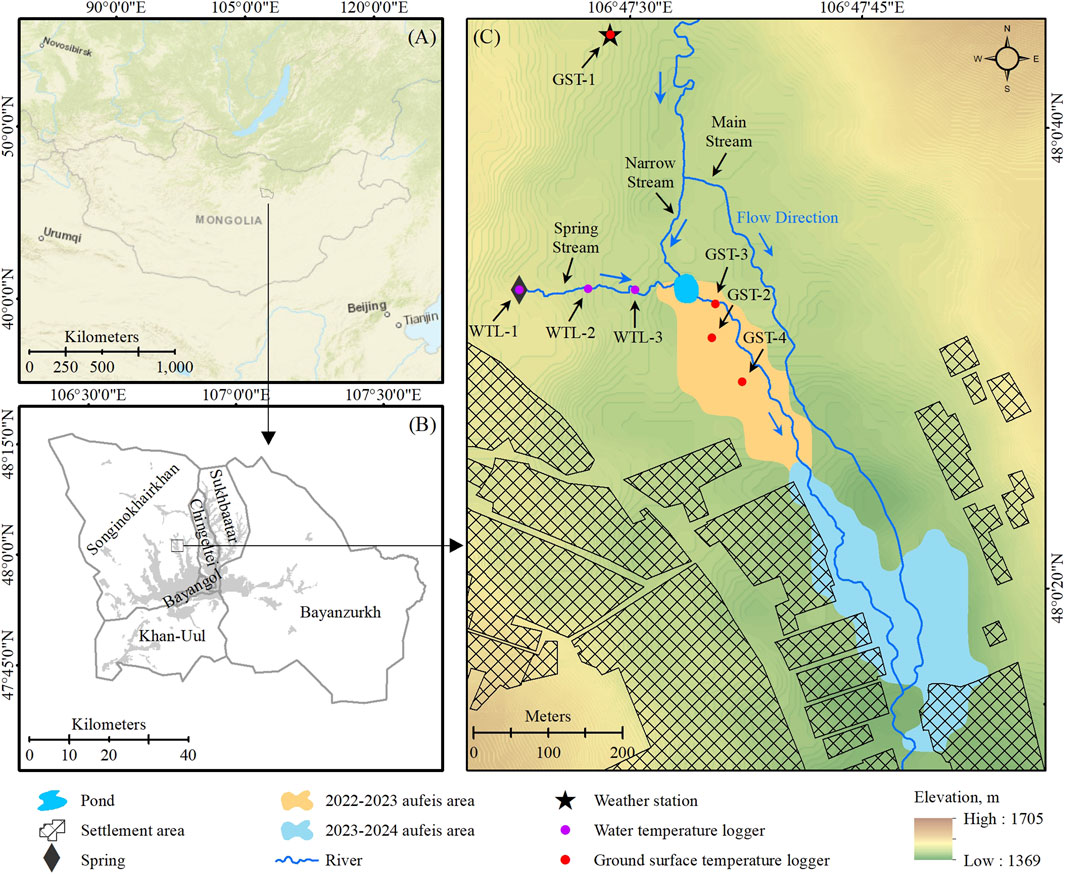
Figure 1. Map of the study area. (A) Geographical location of Ulaanbaatar. Sources: Esri, USGS, OpenStreetMap. (B) Location of the study area within the districts of Ulaanbaatar. (C) Detailed map of the study area. Sources: Background: ASF. (2020). ALOS PALSAR, Digital Elevation Model (12.5 m); Settlement area and River: Environmental Geo Database. (2023), https://eic.mn/geodata/.
This wetland contains a small pond where aufeis occurs annually. The perennial Bumbat Spring and a narrow stream fed by the Baruun Salaa River sustain the pond (Figure 1C). Bumbat Spring serves as residents’ primary source of drinking water and flows approximately 200 m before entering the pond. The pond outlet subsequently merges with the main flow of the Baruun Salaa River and drains into the Tolgoit River. The aufeis that occurs around the pond is referred to locally as “Bumbat aufeis,” named after the spring, and is referred to as such throughout this study.
3 Methods
3.1 Remote sensing-based mapping of aufeis
3.1.1 Satellite-based multi-year spatial distribution of aufeis
Due to a lack of recent data, mapping was conducted using a satellite-based approach. This study utilized images acquired by the Landsat 5 Thematic Mapper (TM) and the Landsat 8 Operational Land Imager (OLI), both of which have a spatial resolution of 30 m (Table 1). These images are Collection 2 Level 1 (L1T) images that have been radiometrically and geometrically corrected. The beginning of the multi-temporal analysis was set to 2010 because data availability in the study region was sparse in previous years due to a high degree of cloud and snow cover. All imagery was acquired from the U.S. Geological Survey Web Service (U.S. Geological Survey web-service, 2024).
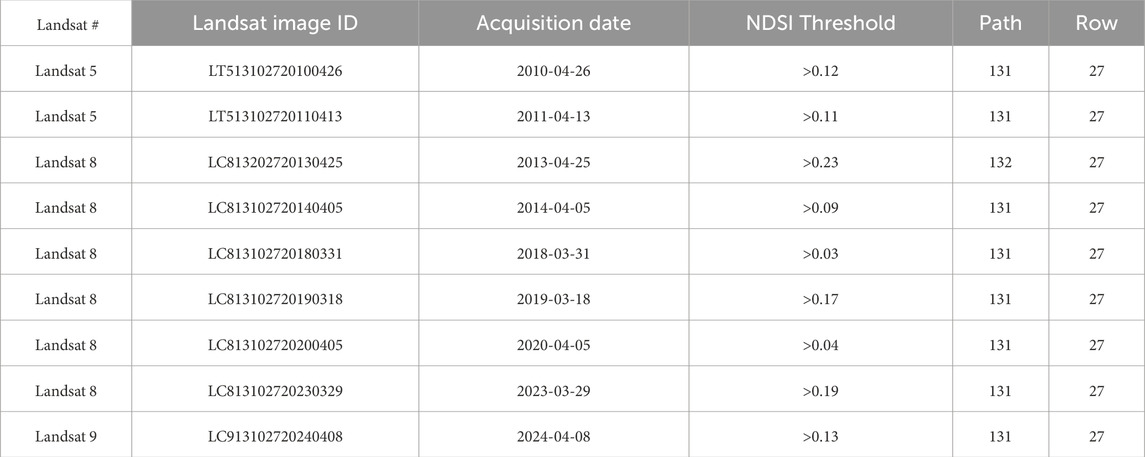
Table 1. Landsat satellite number, ID, acquisition date, NDSI Threshold, path, and row used in this study.
To map the spatial distribution of Bumbat aufeis, the Normalized Difference Snow Index (NDSI) was applied. NDSI discriminates between snow and ice versus soil, rocks, and even remnant cloud cover, and it has been widely used in previous studies (Silverio and Jaquet, 2005; Hendriks and Pellikka, 2007; Dozier et al., 2016; Dann et al., 2025).
Snow and ice exhibit high reflectance values in the visible and near-infrared spectral bands; however, their reflectance diminishes in the mid-infrared bands. Consequently, this study focused on the green and Shortwave Infrared 1 (SWIR1) bands (Table 2). Typically, areas covered by snow and ice display a threshold value exceeding zero. The NDSI is derived based on this principle and is calculated using the formula presented below (Hall et al., 1995):
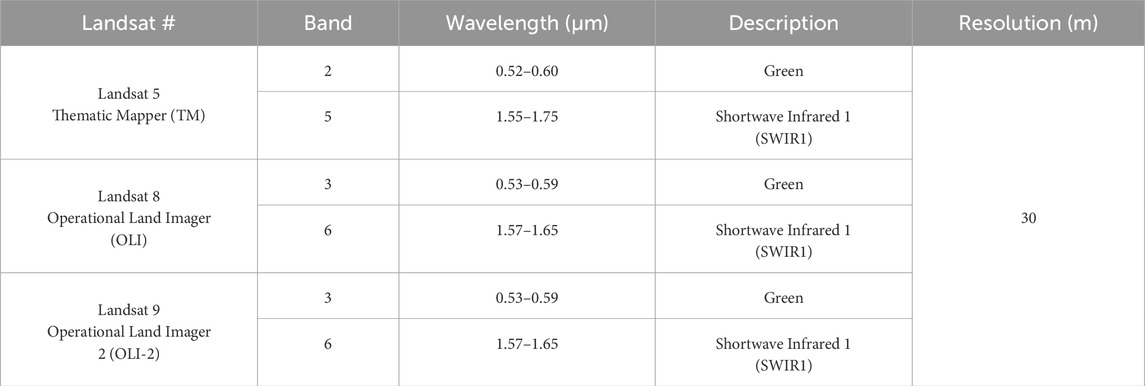
Table 2. Band information of Landsat satellites used in this study.
However, given the spatial and temporal variability of the imagery, appropriate NDSI thresholds for each dataset were determined individually (Härer et al., 2018; Dann et al., 2025). The thresholds used for each dataset are shown in Table 2.
However, since NDSI values are high for both snow and ice, satellite images captured during snow-free periods were selected to better distinguish aufeis boundaries. According to previous studies, the aufeis in the lower reaches of the Uliastai River valley typically reaches its maximum extent in mid-February (Walther et al., 2021). Nonetheless, satellite images from this period were snow-covered, rendering it challenging to separate ice from snow. Therefore, imagery acquired during the post-snowmelt period, specifically between March 18 and April 26, was selected (Table 1; Figure 2).
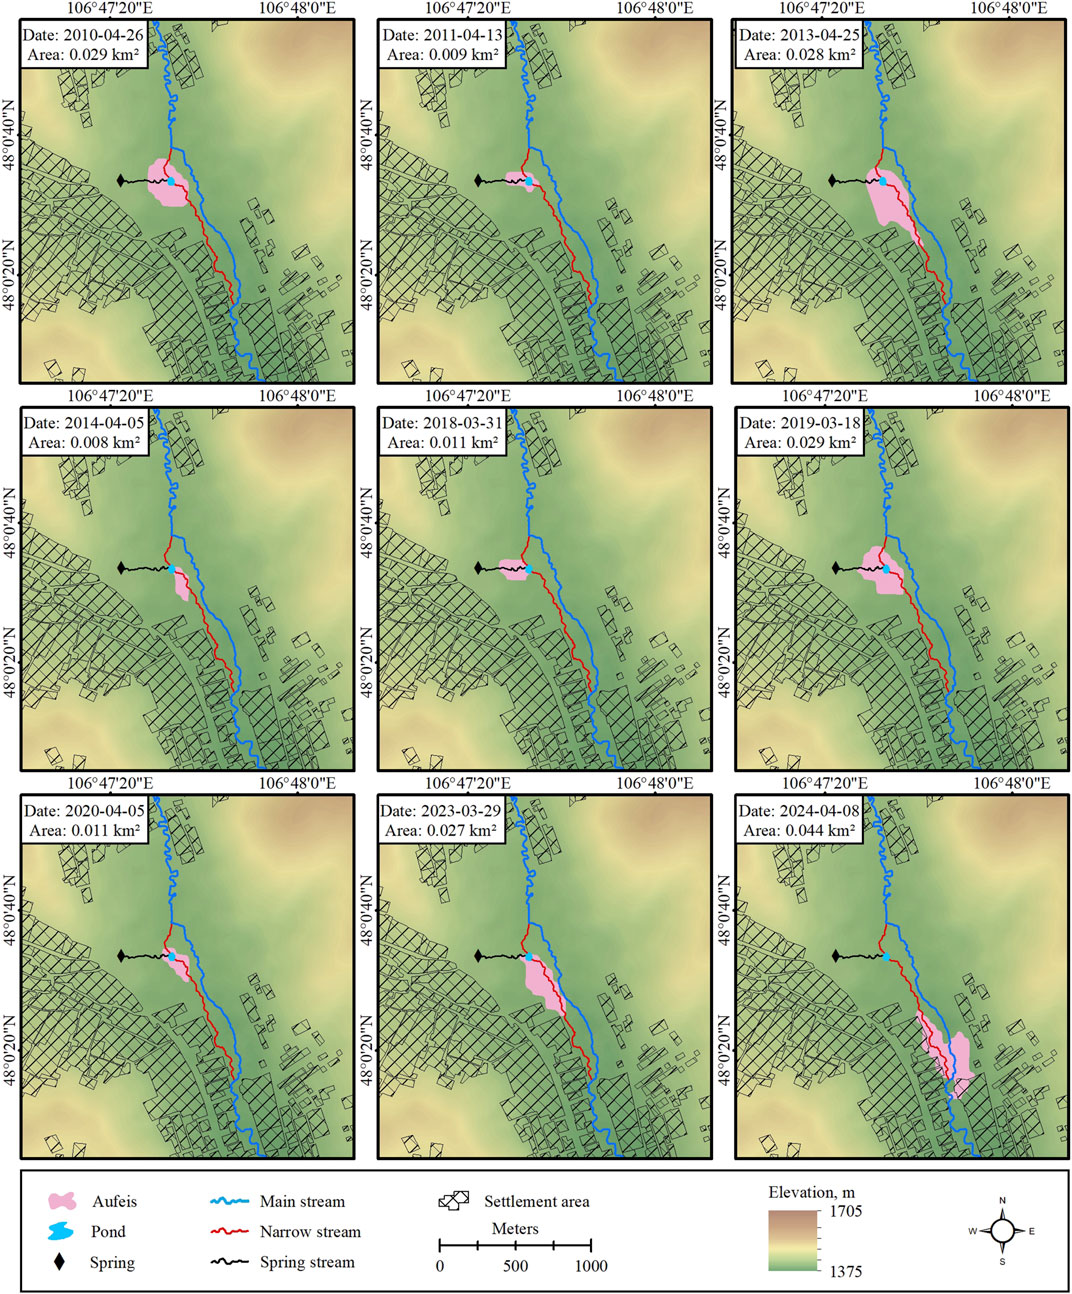
Figure 2. Spatial distribution maps of Bumbat aufeis after snowmelt from 2010 to 2024. Each image includes the date of the satellite imagery and the corresponding size of the aufeis area.
The multi-temporal analysis of aufeis in Bumbat was conducted using a semi-automated processing workflow implemented in ArcGIS 10.4. After calculating NDSI, a binary raster from each Landsat image, where 0 represented “no ice” and 1 indicated “ice” was generated. Subsequently, the Raster to Polygon tool was used to convert the binary rasters into polygon representations of aufeis areas. Finally, the surface area of each polygon was calculated using the Calculate Geometry function.
3.1.2 Unnamed aerial vehicle-based monthly spatial dynamics of aufeis
To capture the monthly dynamics in the aufeis area during the winter of 2023–2024, an aerial survey was conducted. Studies on aufeis mapping have generally relied on satellite imagery, aircraft-based surveys, and unmanned aerial vehicle (UAV) approaches (Chu and Lindenschmidt, 2016; Kääb et al., 2019; Gagarin et al., 2020; Terry et al., 2020; Bernard et al., 2017; 2021). In this study, high-resolution mapping under snow-covered conditions was required. While high-resolution satellite imagery can be used under such conditions and is applicable to aufeis mapping (Brombierstäudl et al., 2024), commercial satellites that provide very-high-resolution images are often costly and, due to cloud cover, may result in incomplete time series, rendering them less reliable. Similarly, aircraft-based mapping is also expensive.
To address these challenges, a DJI Phantom 4 RTK UAV was employed. In recent years, several studies have successfully utilized UAVs for aufeis mapping (Gagarin et al., 2020; Terry et al., 2020; Bernard et al., 2017; 2021). Compared with commercial high-resolution satellite imagery, UAV imagery provides considerably higher spatial resolution and significantly lower operational costs (Woodget et al., 2017). Moreover, UAVs can operate below cloud cover, providing a clear observational advantage for detecting aufeis extent even under overcast conditions.
Furthermore, a high-resolution Digital Elevation Model (DEM) was generated using the Structure-from-Motion (SfM) photogrammetry approach that reconstructs 3D surfaces based on image point matching in overlapping photographs (Westoby et al., 2012; Smith et al., 2015; Carrivick et al., 2016). While SfM does not inherently require prior knowledge of camera positions, the integration of a UAV’s GPS positioning system improved the georeferencing accuracy and reduced potential distortions in the resulting 3D models (Carrivick et al., 2019). Thus, these GPS data facilitated more reliable spatial alignment between successive DEMs used for change detection. The raw images acquired by the drone were processed into DEMs and orthophotos using Agisoft Metashape Professional software.
Aerial surveys were conducted on 2 November 2023, 17 November 2023, 21 December 2023, 8 February 2024, 6 March 2024, 5 April 2024, and 15 April 2024 (Figure 3). As the UAV was equipped with an RTK positioning system, the initial georeferencing accuracy was high. Accordingly, for each survey date, a DEM and an orthomosaic with a spatial resolution of 1 cm per pixel were generated. A reference DEM obtained on 2 November 2023, prior to aufeis formation, was used as the baseline surface. By subtracting the DEM representing the ice-free condition from the ice-covered DEM, both the thickness and spatial distribution of aufeis were determined (Terry et al., 2020; Brombierstäudl et al., 2024).
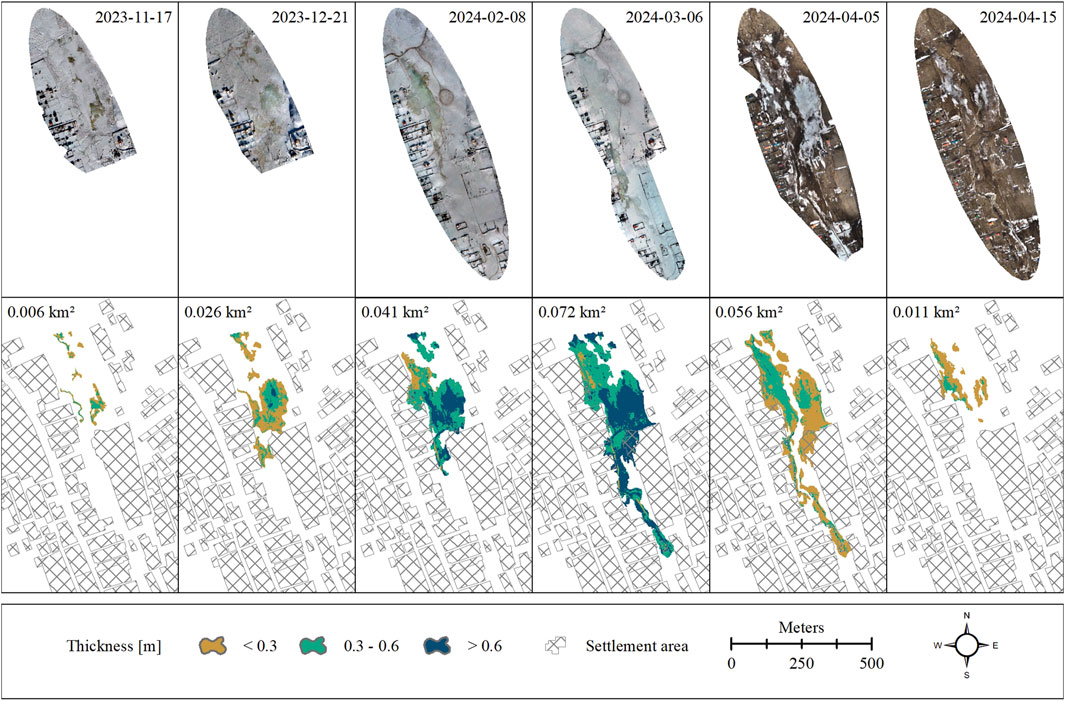
Figure 3. Monthly orthomosaics and spatial distribution maps of Bumbat aufeis for the winter of 2023–2024.
3.2 In situ data
3.2.1 Geophysical investigation
Electrical resistivity tomography (ERT) measurements were conducted in autumn 2023 (Profiles 2, 3, and 4) and autumn 2024 (Profiles 1, 5, and 6) to characterize the geological conditions beneath the aufeis area (Figure 4). ERT measures the electrical resistivity of subsurface soils and rocks by acquiring measurements at the ground surface. This technique characterizes the distribution of soil and rock based on the apparent resistivity value (Ohm;
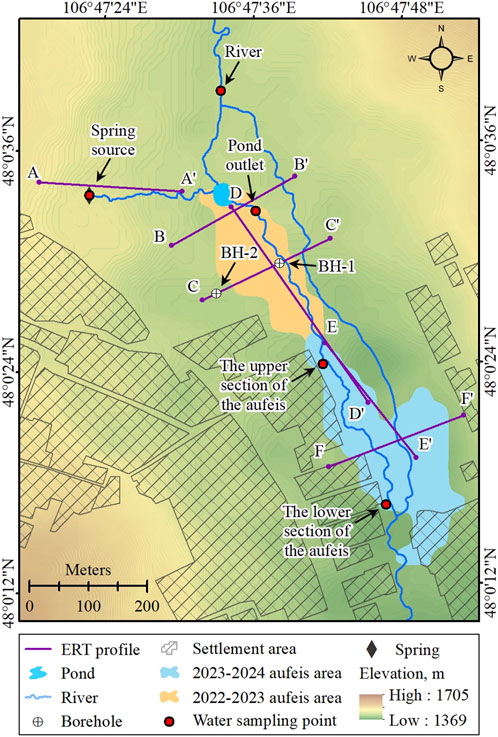
Figure 4. Locations of ERT profiles, boreholes and water sampling points.
In this study, ERT profiles were acquired using the SYSCAL R1 Plus and SWITCH PRO tools (IRIS Instruments Company, 2012). The Wenner–Schlumberger array is a hybrid of the Wenner and Schlumberger configurations. It was selected for its moderate sensitivity to both horizontal and vertical subsurface structures, providing enhanced horizontal coverage and signal strength compared with other arrays (Pazdirek and Bláha, 1996). The average depth of investigation is greater than that of the Wenner array, while the signal intensity is lower than that of the Wenner but higher than that of the dipole–dipole array (Martines-López et al., 2013; Yonatan et al., 2021). The profile lengths were 240 m (Profile 1, 2, 3, 5, and 6) and 400 m (Profile 4), with electrodes installed at 3 m (Profile 2 and 3) and 5 m (Profile 1, 4, 5, and 6) intervals, respectively (Figure 5). Data were processed using RES2DINV software to convert resistivity data into an accurate subsurface resistivity distribution (Loke and Barker, 1996).
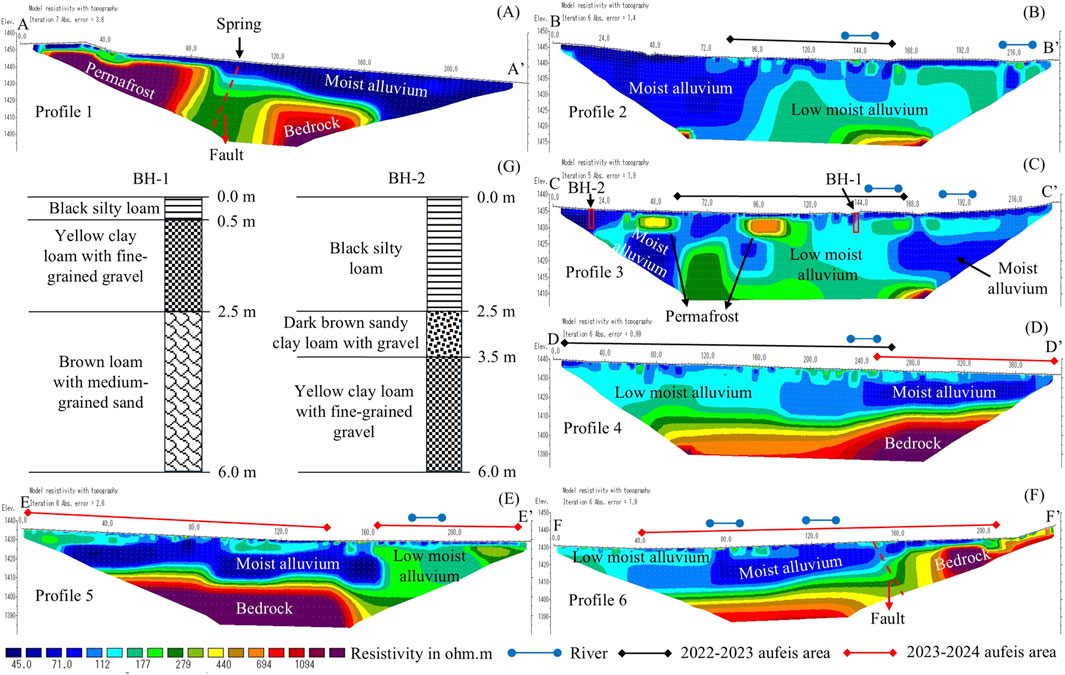
Figure 5. Results of electrical resistivity tomography profiles and borehole logs. (A) ERT profile 1. (B) ERT profile 2. (C) ERT profile 3. (D) ERT profile 4. (E) ERT profile 5. (F) ERT profile 6. (G) Borehole logs BH-1 and BH-2.
Subsequently, drilling was conducted at two locations along ERT Profile 3 (Figure 4) on 4 January 2024, each reaching a depth of 6 m, to validate the ERT measurement results. These locations were selected to represent areas where aufeis either does or does not occur, as well as to examine differences in electrical resistivity values. Drilling was performed using the rotary drilling method to validate the ERT results and determine the soil and rock characteristics in aufeis and non-aufeis areas.
3.2.2 Meteorological indicators
On 23 October 2023, an RX3000 remote weather monitoring station was set up 300 m north of the aufeis area (Figure 1C). This station records seven parameters in 5 min intervals, including air temperature, surface temperature, precipitation, wind speed and direction, air pressure, and relative humidity (Onset Computer Corporation, 2018).
Data from the Songinokhairkhan meteorological station, operated by the Information and Research Institute of Meteorology, Hydrology, and Environment in Mongolia, were analyzed to assess the influence of air temperature and precipitation on aufeis distribution. This is the closest station to the study area, from which data encompassing 2009 to 2024 were acquired. The freezing degree days (FDDA) and thawing degree days (TDDA) were calculated to evaluate the annual air temperature regime. Among the various methods available for computing freezing and thawing indices, summing all temperatures less than or greater than 0°C during their respective periods was suitable and reliable (Wu et al., 2011). For continuity in these calculations, the freeze period was defined as June 1 to June 30 of the following year, and the thaw period as January 1 to December 31 (Luo et al., 2014).
3.2.3 Ground surface and water temperature measurements
Six miniature data loggers were deployed to monitor the water and ground temperature regimes in the study area. One data logger was installed within the spring source, two were positioned along the spring stream, and three were installed at the ground surface (Figure 1C). Measurements were recorded at 4 h intervals with an accuracy of ±0.53% using a HOBO Pendant Temperature Datalogger (Onset Computer Corporation, 2018). The ground surface temperature (GST) loggers were positioned at a depth of 3 cm to minimize the influence of direct solar radiation (Yamkhin et al., 2022). The loggers were installed on 24 October 2023, and data collection was conducted until 1 October 2024.
The uneven distribution of surface temperatures may influence the spatial distribution of aufeis. The freezing n-factor was calculated to explore the relationship between air and surface temperatures during the aufeis period. The n-factor measures thermal interactions between the ground surface and the air by calculating the ratio of GST to air temperature. This index is commonly used in studies on cold-region soil science and permafrost (Klene et al., 2018; Lei et al., 2020) and is calculated using the formula presented below (Lunardini, 1978):
where FDDS represents the freezing degree days for the ground surface (°C), calculated based on data collected using the GST loggers, and FDDA represents the freezing degree days for air (°C), determined based on data collected using the RX3000 remote weather monitoring station.
In addition, data obtained from water temperature loggers were analyzed to investigate the relationship between air and spring water temperatures. River water temperatures exhibit daily, seasonal, annual, and multiannual variations driven by climate and environmental factors (Graf, 2018). In the Northern Hemisphere, more than 60% of rivers experience freezing, with the duration of freezing events being influenced by fluctuations in air and water temperatures (Beltaos and Prowse, 2009). The relationship between the mean daily water temperature, recorded by the water temperature data loggers, and the mean daily air temperature, recorded by the RX3000 station, was assessed using linear regression analysis.
3.2.4 Water chemical analysis
Aufeis chemistry has been studied to improve understanding of water sources and aufeis process dynamics (Hall, 1980; Ensom et al., 2020). Water samples were collected from the spring source, river, and pond outlet in April 2024 during the aufeis period to determine the origin of the aufeis phenomenon. In addition, ice samples were collected from the upper and lower sections of the aufeis formation (Figure 4). The water samples were collected in sealed 1 L glass containers, while the ice samples were collected in unsealed glass containers, melted, and subsequently submitted for analysis. A total of seven samples were collected and analyzed for 22 parameters at the Water Laboratory of the Institute of Geography and Geoecology, Mongolian Academy of Sciences. Of the analyzed parameters, three parameters—ammonium (NH4), hardness, and pH—were selected for the final analysis.
4 Results
4.1 Aufeis distribution and dynamics
Figure 2 illustrates the spatial distribution changes in the Bumbat aufeis area. Bumbat aufeis typically occurs around the pond, with affected areas ranging from 0.008 to 0.029 km2, showing variability in size. However, during the 2023–2024 period, aufeis was observed in the lower section of the pond, within the settlement area, encompassing an area of 0.044 km2, 1.5 to 5.5 times larger than in previous years. During fieldwork, residents reported that the settlement area had never previously experienced aufeis, and several households required relocation because of the impact of this phenomenon.
Figure 3 illustrates the monthly changes in the area of the aufeis formation during the 2023–2024 period. The dynamics of Bumbat aufeis exhibit significant variation, with aufeis commencing in November and increasing progressively in size until it reaches its maximum extent in March. After reaching this peak, the ice begins to melt and melts completely by early May.
4.2 Results of electrical resistivity tomography
The locations of the ERT measurements conducted in the study area are shown in Figure 4. Resistivity values were recorded across all ERT profiles, ranging from 45 to 1094 Ω·m. Sections with resistivity values between 45 and 112 Ω·m are classified as moist alluvium, while those between 112 and 440 Ω·m represent low-moisture alluvium. Surface layers with resistivity values of 694 Ω·m or higher indicate permafrost. Deeper layers exhibiting similarly high resistivity values represent bedrock (Figure 5).
Profile 1 (A-A′) was conducted west to east, crossing the spring source along the spring stream (Figure 4). The results revealed three primary layers: moist alluvium, permafrost, and bedrock. A fault was identified between the permafrost and bedrock, coinciding with the location of the spring source (Figure 5A).
Profiles 2 (B-B′) and 3 (C-C′) were acquired in areas prone to aufeis formation, following the cross-section outlined in Figure 4. The results revealed two main layers: low-moisture alluvium and moist alluvium. In addition, Profile 3 identified two small permafrost layers (Figures 5B,C).
Profile 4 (D-D′) revealed three main layers: moist alluvium, low-moisture alluvium, and bedrock. In 2022–2023, aufeis also occurred in areas with low soil moisture content; however, aufeis was observed in moist zones during the 2023–2024 period (Figure 5D).
Profiles 5 (E-E′) and 6 (F-F′) identified three primary layers: moist alluvium, low-moisture alluvium, and bedrock. In Profile 6, a fault was detected between the bedrock layers, and during the 2023–2024 period, aufeis predominantly developed in areas with higher soil moisture contents (Figures 5E,F).
Borehole BH-1 was drilled in an aufeis-prone area with the following stratigraphy: (see borehole log in Figure 5G).
0–0.5 m: Black silty loam.
0.5–2.5 m: Yellow clay loam with fine-grained gravel.
2.5–6.0 m: Brown loam with medium-grained sand.
Borehole BH-2 was drilled in the non-aufeis area with the following stratigraphy: (see borehole log in Figure 5G).
0–2.5 m: Black silty loam.
2.5–3.5 m: Dark brown sandy clay loam with gravel.
3.5–6.0 m: Yellow clay loam with fine-grained gravel.
In BH-1, a 2 m-thick yellow clay loam with fine-grained gravel was identified between depths of 0.5 and 2.5 m. In BH-2, a similar yellow clay loam layer with fine-grained gravel was encountered at a depth of approximately 3.5 m. The upper 0–3.5 m in BH-2 consisted primarily of silty loam and sandy clay loam.
4.3 Physico-chemical properties of water
4.3.1 Relationship between air and spring water temperatures
Figure 6 presents the mean daily water temperature and mean daily air temperature, their relationship, and the average, maximum, and minimum temperature values.
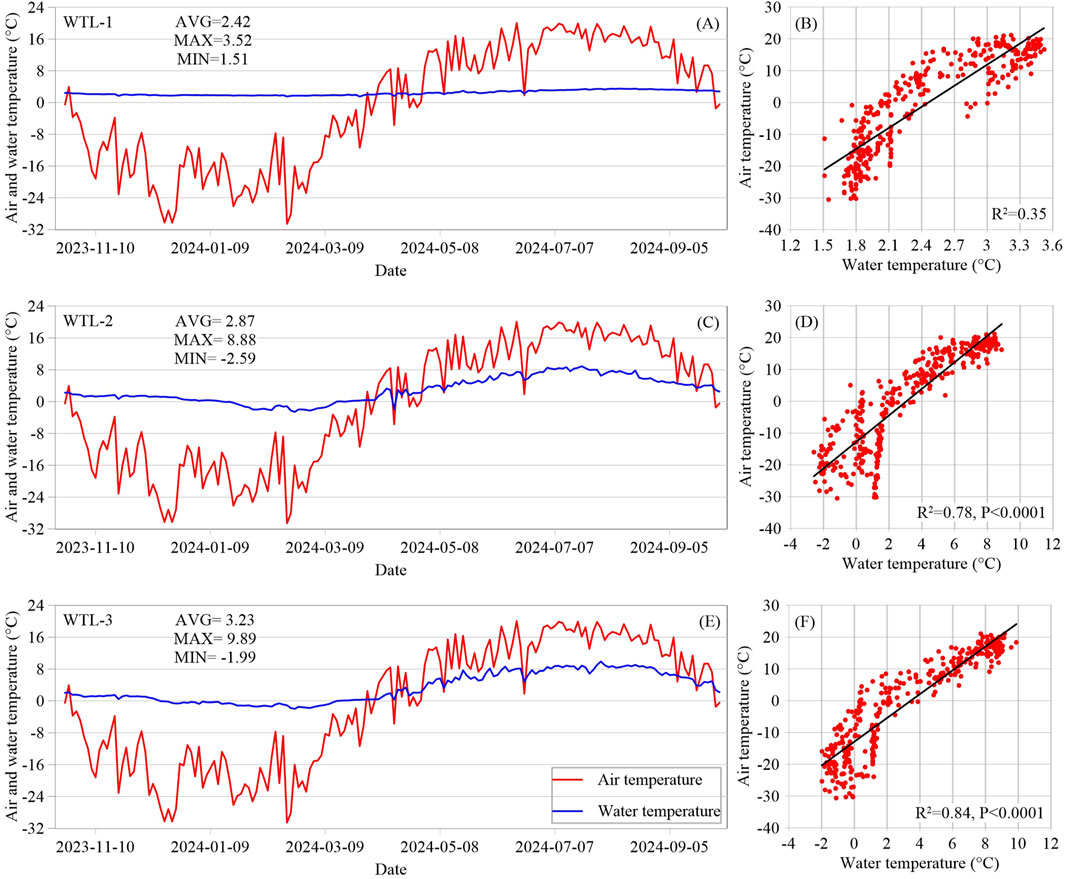
Figure 6. Relationship and correlation between mean daily air temperature (MDAT) and water temperatures from 24 October 2023 to 1 October 2024. (A) Relationship between WTL-1 and MDAT. (B) Correlation between WTL-1 vs MDAT. (C) Relationship between WTL-2 and MDAT. (D) Correlation between WTL-2 and MDAT. (E) Relationship between WTL-3 and MDAT. (F) Correlation between WTL-3 and MDAT.
WTL-1 represents data collected from a temperature data logger installed at the spring’s source (Figure 1C). The average recorded temperature was 2.42°C, with a maximum of 3.52°C and a minimum of 1.51°C (Figure 6A). These data indicate that the spring water flows consistently throughout all four seasons. Additionally, the correlation with air temperature was weak, with an R2 value of 0.35 (Figure 6B).
The WTL-2 temperature data logger is located 100 m from the spring source within the spring stream (Figure 1C). Recorded data revealed an average temperature of 2.87°C, a maximum of 8.88°C, and a minimum of −2.59°C (Figure 6C). Water temperatures were less than 0°C from January 16 to 14 March 2024, indicating that freezing occurred within the spring stream during this period. The strong correlation with air temperature, with an R2 value of 0.78, suggests a direct relationship between the stream temperature of the spring and fluctuations in air temperature (Figure 6D).
The WTL-3 temperature data logger is positioned 180 m from the spring source, also within the spring stream (Figure 1C). Recorded data showed an average temperature of 3.23°C, a maximum temperature of 9.89°C, and a minimum temperature of −1.99°C (Figure 6E). Water temperatures were less than 0°C between December 14 and 15 March 2024, indicating that this section of the spring stream experienced freezing. A strong correlation with air temperature was observed, with an R2 value of 0.84 (Figure 6F). Furthermore, the duration of the freeze period in this section was longer compared with WTL-2, indicating a higher dependency on air temperature.
4.3.2 Chemical properties
The results of the chemical analysis considered three primary parameters (Table 3). The spring water exhibited an absence of ammonium (NH4) content, with a hardness value of 3.56 mg-eq/dm3 and a pH of 7.14, indicating relatively high hardness. In contrast, the river and pond outlet sections demonstrated significantly lower hardness values, with pH values of 6.77 and 6.72, respectively. Notably, the NH4 content in these sections exceeded the thresholds established by the Mongolian water quality standard, MNS 4586:1998.
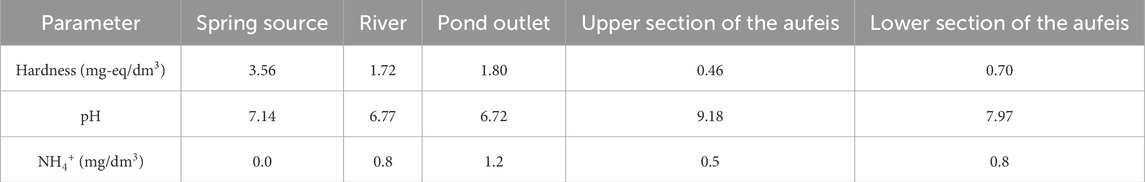
Table 3. Results of water chemical analysis.
Water samples from the aufeis formation were analyzed, revealing that their hardness values were considerably lower than those of other sampling locations. The pH values in the aufeis samples ranged between 9.18 and 7.97. In the upper section of the aufeis formation, the NH4 concentration was at 0.5 mg/dm3, which is within acceptable limits. However, the lower section exhibited a higher NH4 concentration of 0.8 mg/dm3, surpassing the maximum concentration allowed by the Mongolian water quality standard, MNS 4586:1998.
4.4 Freezing n-factors
Figure 7 illustrates the mean daily GSTs, air temperatures, and freezing n-factor values. Data for GST-1 correspond to the GST recorded at the RX3000 weather station (Figure 1C). In contrast, the other data points represent measurements obtained using temperature data loggers installed in areas associated with aufeis formation (Figure 1C).
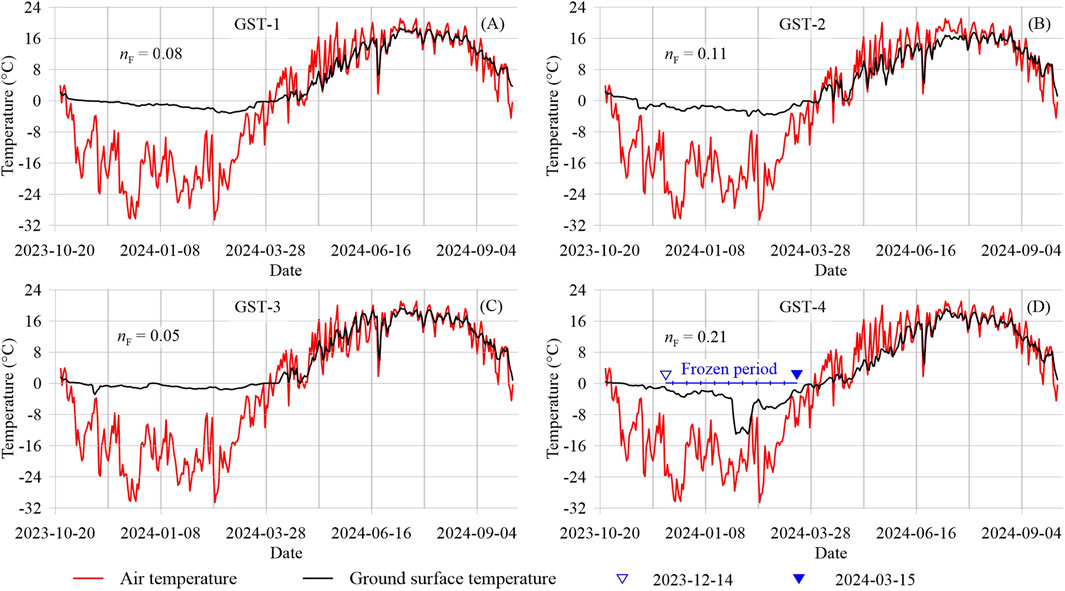
Figure 7. Mean daily ground surface temperature vs. air temperature and freezing n-factor for four points. (A) GST-1 point. (B) GST-2 point. (C) GST-3 point. (D) GST-4 point.
For GST-1, GST-2, and GST-3, the freezing n-factor values ranged from 0.05 to 0.11 (Figures 7A–C). This low n-factor rate can be attributed to the thermal insulation effect provided by snow cover. Snow cover depth, duration, and timing considerably influence the ground surface thermal regime in the winter months.
GST-4 exhibits a higher freezing n-factor value of 0.21, indicating a relatively stronger thermal interaction than the other points. Notably, between 14 December 2023, and 15 March 2024, a marked decrease in GSTs was observed, coinciding with the period during which the spring stream froze (Figure 7D).
4.5 Influence of climatic factors on the spatial distribution of aufeis
Figure 8 illustrates the relationship between the aufeis area and several climatic factors, including MAAT, total annual precipitation, FDDA, and TDDA for the corresponding years. Upon examining the correlation between changes in aufeis area and annual mean air temperature, FDDA, and TDDA, a weak correlation was observed, with R2 values ranging from 0.0006 to 0.17, indicating that the air temperature regime does not directly influence the aufeis area (Figures 8A,C,D). In contrast, a moderate relationship was found between total annual precipitation and changes in the aufeis area, with an R2 value of 0.53 (Figure 8B), indicating that the extent of the aufeis area is influenced by the total amount of annual precipitation.
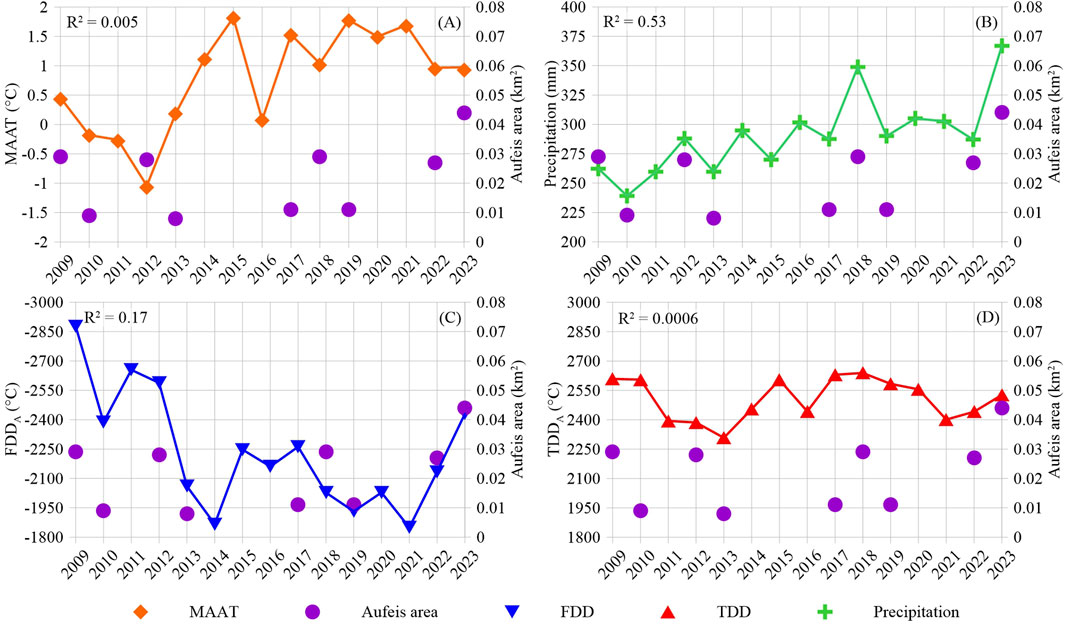
Figure 8. Correlation between aufeis area and climatic factors. (A) Aufeis area vs. Mean annual air temperature (MAAT). (B) Aufeis area vs. Precipitation. (C) Aufeis area vs. FDDA. (D) Aufeis area vs. TDDA.
Figure 9A presents the total monthly and seasonal snowfall amounts for the winter seasons from 2009 to 2024. These data indicate considerable fluctuations in monthly snowfall, with certain years experiencing earlier snowfall (e.g., 2016 and 2023) and other years later snowfall (e.g., 2015). The total snowfall during this period ranged from 37 mm (2018–2019) up to 498 mm (2023–2024). Notably, the winter of 2023–2024 experienced snowfall amounts 1.8 to 13.5 times greater than those in previous years, marking an exceptional anomaly. Snowfall distribution during this winter showed considerable accumulation in November, followed by sustained high levels of snowfall in the subsequent months. This notable shift in the timing and quantity of snowfall is expected to have implications for the region’s seasonal hydrological and GST regimes. However, when comparing total snowfall during winter to the dynamics of the aufeis area, a correlation coefficient of R2 = 0.31 was observed (Figure 9B), indicating that snowfall does not significantly impact fluctuations in the aufeis area.
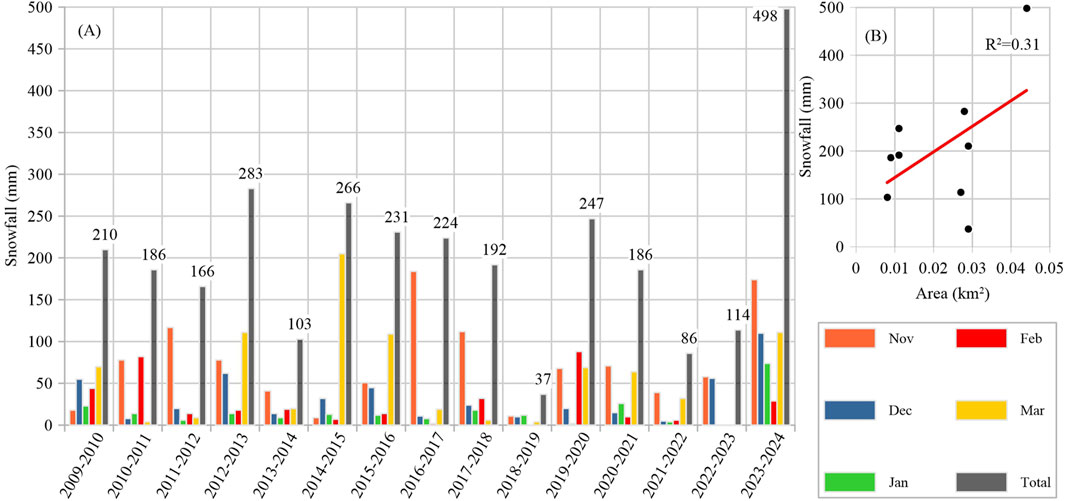
Figure 9. Snowfall distribution and aufeis areas from 2009 to 2024. (A) Histogram of snowfall distribution across winter months. (B) Correlation between snowfall amount and aufeis area.
5 Discussion
5.1 Origin of aufeis
Resistivity is strongly influenced by moisture content, with dry materials exhibiting significantly higher resistivity than moist or saturated ones (Telford et al., 1990). Based on ERT measurements (Figure 5), four distinct subsurface layers were identified. Sections with resistivity values between 45.0 Ω·m and 112 Ω·m are classified as moist alluvium. This is due to the presence of dissolved ions in pore water, which enhance electrical conductivity and thus reduce resistivity (Reynolds, 2011; Fitts, 2012). In contrast, sections with resistivity values between 112 Ω·m and 440 Ω·m correspond to low-moisture alluvium.
Surface layers with high resistivity values (>694 Ω·m) are interpreted as permafrost, since frozen ground lacks liquid water, thereby significantly reducing ionic conductivity (Hauck, 2002; Reynolds, 2011). According to the permafrost distribution map of Mongolia, the study area is located within a sporadic permafrost zone (Yamkhin et al., 2022). Previous studies have also documented permafrost at depths of 2–6 m in clay and clay loam soils within moist, swampy valleys of small rivers in Ulaanbaatar, including the Uliastai, Selbe, and Tolgoit Rivers (Dashtseren, 2008).
Subsurface layers at greater depths showing similarly high resistivity values are interpreted as bedrock. Dense igneous and metamorphic rocks—such as granite, basalt, and marble—typically exhibit high resistivity due to their low porosity and minimal water content (Palacky, 1987; Telford et al., 1990; Reynolds, 2011). Although permafrost and bedrock have similar resistivity values, their primary distinction lies in their depth of existence. According to our ERT results, bedrock is inferred to be present at depths ranging from 20 to 45 m below the surface (Figure 5), whereas permafrost typically occurs at much shallower depths of 2–6 m in this region (Dashtseren, 2008).
The results from ERT Profile 1 identified a fault between the permafrost and bedrock, coinciding with the location of the spring source (Figure 5A). In general, tectonic faults in hard rock terrain are common sources of groundwater. The chemical analysis showed relatively high-water hardness, confirming that the spring water originates from a groundwater source (Table 3; Todd and Mays, 2005; Fitts, 2012; Sengupta, 2013). The water temperature measurement findings indicate that the minimum temperature of spring water is 1.51°C, confirming the perennial spring (Figure 6A). During winter, the perennial spring water loses heat and freezes along the stream, contributing significantly to annual aufeis formation (Figures 6C,E; Harden et al., 1977; Turcotte et al., 2023).
Chemical analysis reveals that the hardness values of spring water, river water, and pond outlet water are 3.56 mg-eq/dm3, 1.72 mg-eq/dm3, and 1.80 mg-eq/dm3, respectively, indicating that the pond is fed by spring and river water (Table 3). The relatively high hardness of spring water shows that it has likely percolated through mineral-rich soils and rocks, dissolving calcium and magnesium ions and increasing water hardness (Todd and Mays, 2005; Fitts, 2012). The spatial distribution of aufeis (Figure 2) shows that, except for the winter of 2023–2024, aufeis predominantly occurs around the pond, indicating the contribution of river water to the aufeis process. However, during the winter of 2023–2024, aufeis was observed downstream of the pond, encompassing an area 1.5 to 5.5 times larger than in previous years (Figure 2).
The ERT surveys revealed that, in previous years, aufeis mainly occurred in areas with low soil moisture contents (Figures 5C,D), while in 2023–2024, it shifted to regions with relatively higher soil moisture contents (Figures 5D–F). We conducted electrical resistivity tomography (ERT) measurements along Profile 4 at the same location during the autumns of 2023 and 2024 (see Supplementary Material for ERT results). The total precipitation prior to the measurements differed between the two years, 338.5 mm in 2023 and 217.4 mm in 2024. However, the ERT results were similar for both years, suggesting that the soil moisture regime in the study area is more influenced by underlying geological conditions than by annual variations in precipitation.
According to the borehole data from BH-2, the subsurface consists of silty loam from 0 to 2.5 m depth, sandy clay loam from 2.5 to 3.5 m, and clay loam with fine-grained gravel from 3.5 to 6 m (Figure 5G). Since silty loam and sandy clay loam have higher permeability than clay loam, these upper layers (0–3.5 m) likely allow for greater water infiltration, resulting in the presence of moist alluvium. In contrast, the low-permeability clay loam layer found at depths of 3.5–6 m prevents downward water infiltration and retains water above it.
In BH-1, a low-permeability yellow clay loam layer was identified at depths of 0.5–2.5 m (Figure 5G). This layer likely impedes the downward movement of surface water, thereby reducing moisture content in the underlying strata and resulting in higher electrical resistivity values.
Aufeis in these areas may influence air and ground temperatures more significantly than snow-covered surfaces because of the higher thermal conductivity of ice than snow (Arenson et al., 2021). This enhanced heat transfer can lead to more rapid freezing of the soil. As the soil freezes, it undergoes expansion and creates upward pressure on unfrozen soil water. This water migrates through overlying, less dense soil layers and accumulates near the surface, contributing to the development of ground aufeis (Figure 10; Carey, 1973; Kane, 1981; Yu et al., 2005; Woo, 2012).
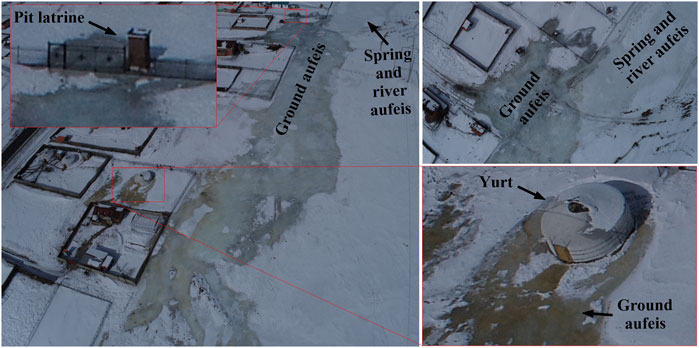
Figure 10. Drone images captured during fieldwork on 2024-03-06.
Drone imagery revealed that areas where soil water emerged were closely associated with pit latrines and the ground beneath yurts (Figure 10). The hollow spaces beneath pit latrines facilitated the upward movement of soil water toward the surface. Additionally, the ground temperature beneath yurts remained above freezing during the winter because of indoor heating, maintaining the ground temperatures above freezing, and allowing soil water to migrate toward the surface. Although this study did not directly observe overflow events, the differences in soil moisture have contributed to aufeis development by facilitating water migration toward the surface through pit latrines and thawed zones beneath yurts, thus expanding the area affected by aufeis formation (Figures 10, 11).
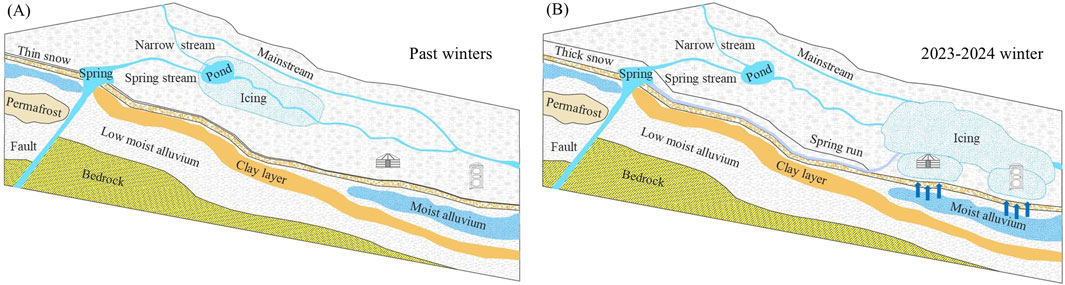
Figure 11. General processes of Bumbat aufeis formation. (A) Aufeis formed in past winters. (B) Aufeis formed during the 2023–2024 winter.
5.2 Natural factors influencing the spatial distribution of aufeis
The analysis of aufeis dynamics and its correlation with climatic factors over the past years indicates that air temperature regimes have minimal impact on the extent of aufeis. In contrast, the amount of precipitation clearly influenced the changes in aufeis dynamics (Figure 8B). While several studies suggest that precipitation and air temperature regimes affect aufeis dynamics (Morse and Wolfe, 2015; Lainis et al., 2024), this discrepancy may stem from variations in aufeis sources. Specifically, aufeis formed by springs is less influenced by seasonal weather changes (Turcotte et al., 2023) because the thermal regime of groundwater is primarily controlled by underground conditions, rendering it less susceptible to direct changes in air temperature.
The analysis reveals a strong correlation between spring stream temperatures and air temperatures, with the spring streams freezing during specific winter periods (Figures 6C–F). Generally, the water emerging from perennial springs freezes along the stream under cold conditions unless it discharges directly into major rivers or lakes or rapidly infiltrates into the ground (Turcotte et al., 2023). When the spring water stream freezes, it blocks the flow of spring water into ponds, causing the water to surface and freeze, thus leading to aufeis (Carey, 1973; Yoshikawa et al., 2007; Ensom et al., 2020).
During the winter of 2023–2024, snowfall amounts were exceptionally high compared with previous years (Figure 9). The freezing n-factor values recorded at GST-1, GST-2, and GST-3 during this period ranged from 0.05 to 0.11, highlighting the insulating effect of snow cover (Figures 7A–C). Snow cover is critical in influencing the thermal regime between the atmosphere and the ground surface during the cold season (Zhang, 2005). In Mongolia, a snow layer 10–20 cm thick can increase the surface temperature by 4°C–6°C during winter (Sharkhuu and Anarmaa, 2015).
Consequently, spring water that surfaced onto unfrozen ground flowed along the snow-covered surfaces and accumulated in low-lying areas. Evidence of this phenomenon was observed on 4 January 2024, when drilling in the study area revealed water flowing beneath the snow cover (Figure 12). Additionally, data from the GST-4 surface temperature (Figure 7D) demonstrated a reduction in surface temperature when the spring stream was frozen, indicating that a decrease in surface temperature resulted from spring water flowing over the surface, potentially forming a thin aufeis layer. Drone surveys conducted on 15 April 2024, after the snow cover had melted (Figure 3), indicated that this thin layer of aufeis likely melted along with the snow cover.
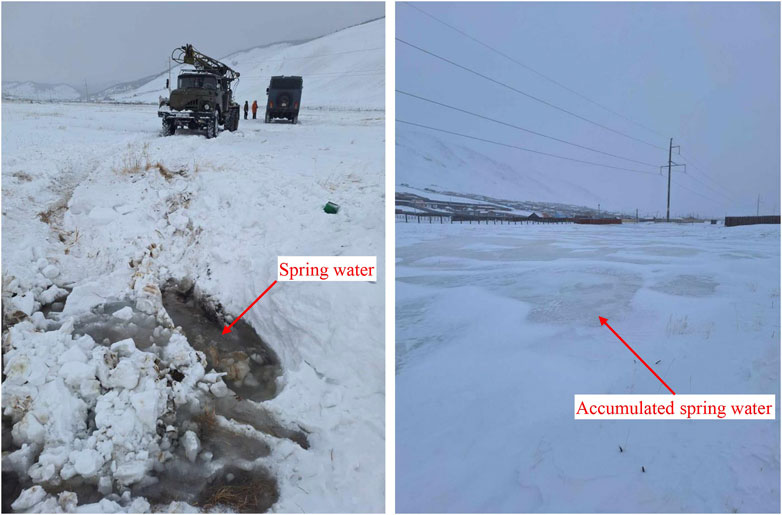
Figure 12. Photos captured during fieldwork on 2024-01-04.
These findings illustrate that thick snow cover can significantly alter the surface thermal regime, leading to changes in the spatial distribution of aufeis fed by perennial springs.
Finally, the thick snow cover during the winter of 2023–2024 altered the ground surface thermal regime. When the spring stream froze, spring water flowed beneath the snow and accumulated in low-lying areas of the settlement area, resulting in a shift in the spatial distribution of aufeis. Consequently, the ground thermal regime in the area changed, causing soil water to rise to the surface through the ground beneath yurts and pit latrines, thus expanding the aufeis area (Figures 10, 11).
5.3 Effects of changes in the spatial distribution of aufeis on society
Interviews with residents and satellite imagery analysis indicated that in previous years, aufeis near pond areas did not threaten nearby settlements (Figure 2). However, aufeis occurred within settlement areas during the winter of 2023–2024, significantly damaging many households and displacing numerous families, as their yurts, furniture, and belongings were rendered unusable by aufeis (Figures 10, 13).
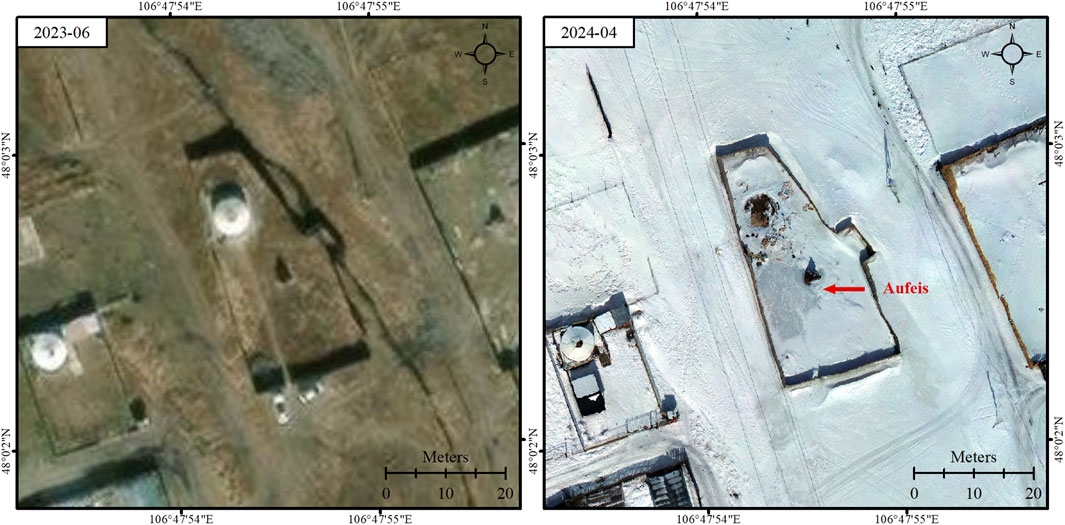
Figure 13. A household relocated due to aufeis.
Another serious concern linked to the Bumbat aufeis is NH4 pollution. Chemical analyses of the aufeis samples revealed elevated NH4 concentrations, particularly in the lower sections of the aufeis, where levels exceeded background concentrations (Table 3). Soil water migrating toward the surface through pit latrines contributed to an expansion in the aufeis area (Figure 10).
Aufeis does not typically exhibit elevated NH4 levels. In some regions of High Mountain Asia, aufeis is actively utilized in local irrigation systems and is not considered problematic (Schmidt and Nüsser, 2017; Brombierstäudl et al., 2024). Nevertheless, in this particular case, the aufeis is fed by sewage-contaminated water due to inadequate sanitation infrastructure. Wastewater from human activities accumulates in pit latrines, increasing NH4 concentrations in the soil water (Oyunbat et al., 2022), which contributes to aufeis formation and expansion.
As a result, aufeis polluted with NH4 poses a health risk to residents in the affected areas and the broader population. High NH4 concentrations are known to cause respiratory irritation and inflammation (Roney and Fernando, 2016) and can increase the risk of asthma in preschool children (Holst et al., 2018).
5.4 Limitations
This study utilized satellite imagery data to examine the natural factors influencing changes in the spatial distribution of Bumbat aufeis over the past 15 years. Due to the inherent limitations associated with satellite products, particularly cloud and snow cover, estimating the aufeis distribution for 2012, 2015, 2016, 2017, 2021, and 2022 could not be performed.
Additionally, drone surveys provided high-accuracy measurements of the aufeis area and thickness. However, when estimating the thickness of the aufeis using a DEM generated from drone imagery, distinguishing the snow cover from the underlying ice was impossible. This limitation reduced the accuracy of the aufeis thickness measurements. Nevertheless, since this study focused on changes in the aufeis area rather than its thickness, the impact of this issue on the overall research findings was minimal.
In this study, the Wenner-Schlumberger array was selected for ERT measurements due to its balanced sensitivity to both vertical and horizontal resistivity variations (Pazdirek and Bláha, 1996), making it suitable for characterizing subsurface structures related to aufeis. However, this array has moderate sensitivity to shallow features compared to other configurations, such as dipole-dipole (Dahlin and Zhou, 2004), which may limit the resolution of near-surface moisture variations important for aufeis formation.
Additionally, the resolution of deep subsurface structures may be limited by the increasing electrode spacing, particularly in areas with heterogeneous geology. This may affect the accuracy of delineating the boundary between permafrost and bedrock, especially when both materials exhibit similarly high resistivity values. Furthermore, inversion artifacts can occur depending on the subsurface conditions and data quality, potentially leading to misinterpretation of resistivity anomalies. In our case, the interpretation of high-resistivity layers at depths of 20–45 m as bedrock and those at 2–6 m as permafrost is based on a combination of resistivity values and prior studies.
Future studies may benefit from the integration of multiple arrays (e.g., combining Wenner-Schlumberger with dipole-dipole) or three-dimensional ERT surveys to improve spatial resolution and reduce interpretational ambiguity.
Despite these limitations, the authors believe this research study provides valuable insights into the dynamics of aufeis processes in this region.
6 Conclusion
This study investigated the origins, spatial distribution, natural factors influencing aufeis, and its social impacts in Ulaanbaatar, the capital city of Mongolia, where aufeis occurs annually. Aufeis primarily originates from perennial springs and rivers and varies in size annually. It typically begins to form in early November, gradually expands throughout the winter, and reaches its maximum extent by March. Melting generally occurs in early May.
Among the environmental drivers, precipitation was found to significantly influence aufeis dynamics, whereas air temperature had a minimal direct effect. The extent of aufeis is closely linked to the amount of precipitation preceding its formation, in combination with local geological and permafrost-hydrogeological conditions. Heavy snow cover can modify the surface thermal regime of spring-fed aufeis fields, altering their spatial distribution. Such changes not only affect landscape processes but also pose safety risks and property damage to residents in affected areas.
Furthermore, the absence of adequate infrastructure in certain settlements allows polluted surface and soil water to enter the aufeis formation process, intensifying environmental contamination. This introduces potential public health risks for both local communities and the broader urban population.
The methods and findings presented in this study are applicable to other cold, semi-arid urban, and peri-urban environments experiencing similar hydrogeological and climatic conditions. Future research could expand on this work by incorporating longer-term time series, including historical satellite imagery, and deploying sensor networks to monitor subsurface hydrological dynamics. Additionally, integrating remote sensing, geophysical surveys, and water quality analysis offers promising avenues to better understand the interaction between human activity and natural aufeis processes. These combined approaches can enhance early warning systems, guide urban planning, and support adaptation strategies in cold-region cities.
Data availability statement
The original contributions presented in the study are included in the article/Supplementary Material; further inquiries can be directed to the corresponding author.
Author contributions
GU: Conceptualization, Data curation, Formal Analysis, Investigation, Methodology, Resources, Software, Supervision, Validation, Visualization, Writing – original draft, Writing – review and editing. TW: Software, Supervision, Writing – review and editing. AD: Conceptualization, Funding acquisition, Project administration, Resources, Supervision, Writing – review and editing. DN: Conceptualization, Funding acquisition, Project administration, Resources, Supervision, Writing – review and editing. YJ: Data curation, Investigation, Resources, Supervision, Writing – review and editing. GB: Writing – original draft, Writing – review and editing. KT: Investigation, Writing – review and editing. GT-E: Investigation, Writing – review and editing. DO: Investigation, Writing – review and editing.
Funding
The author(s) declare that financial support was received for the research and/or publication of this article. This research was funded by the Japan International Cooperation Agency (JICA).
Acknowledgments
We would like to express our heartfelt gratitude to the Japan International Cooperation Agency (JICA) and the Institute of Geography and Geoecology of the Academy of Sciences for their unwavering support and collaboration throughout this research. We are also sincerely thankful to the team at the non-governmental organization “Amid-Baigal” for providing the necessary conditions required to conduct field research and for ensuring the integrity of the research tools and equipment. Finally, we extend our deep appreciation to everyone who contributed to the successful implementation of this research study.
Conflict of interest
Author YJ was employed by Geocryo LLC.
The remaining authors declare that the research was conducted in the absence of any commercial or financial relationships that could be construed as a potential conflict of interest.
Generative AI statement
The author(s) declare that Generative AI was used in the creation of this manuscript. Text editing assistance using ChatGPT.
Publisher’s note
All claims expressed in this article are solely those of the authors and do not necessarily represent those of their affiliated organizations, or those of the publisher, the editors and the reviewers. Any product that may be evaluated in this article, or claim that may be made by its manufacturer, is not guaranteed or endorsed by the publisher.
Supplementary material
The Supplementary Material for this article can be found online at: https://www.frontiersin.org/articles/10.3389/feart.2025.1611054/full#supplementary-material
References
Abu-Hassanein, Z. S., Benson, C. H., and Blotz, L. R. (1996). Electrical resistivity of compacted clays. J. Geotech. Eng. 122, 397–406. doi:10.1061/(asce)0733-9410(1996)122:5(397)
Åkerman, J. (1982). “Studies on naledi (icings) in West Spitsbergen, in hydrology in permafrost regions,” in Proceedings of the 4th Canadian permafrost conference, 189–202.
Alekseev, V. R. (2015). Cryogenesis and geodynamics of icing valleys. Geodyn. Tectonophys. 6, 171–224. doi:10.5800/gt-2015-6-2-0177
Alekseev, V. R., Makarieva, O. M., Shikhov, A. N., Nesterova, N. V., Zemlyanskova, A. A., and Ostashov, A. A. (2023). Giant taryn aufeis in the Northeast of Russia. Geogr. Nat. Resour. 44 (3), 253–259. doi:10.1134/S1875372823030010
Arenson, L., Colgan, W., and Marshall, H. P. (2021). “Physical, thermal, and mechanical properties of snow, ice, and permafrost,” in Snow and ice-related hazards, risks, and disasters, 35–71. doi:10.1016/B978-0-12-817129-5.00007-X
Arjwech, R., Everett, M. E., Chaisuriya, S., Youngme, W., Rattanawannee, J., Saengchomphu, S., et al. (2021). Electrical resistivity tomographic detection of the hidden Thakek fault, Northeast Thailand. Geophys 19, 489–501. doi:10.1002/nsg.12165
Beltaos, S., and Prowse, T. (2009). River-ice hydrology in a shrinking cryosphere. Hydrol. Process. 23, 122–144. doi:10.1002/hyp.7165
Bernard, É., Friedt, J. M., and Griselin, M. (2021). Snowcover survey over an arctic glacier forefield: contribution of photogrammetry to identify ‘icing’ variability and processes. Remote Sens. 13 (10), 1978. doi:10.3390/rs13101978
Bernard, É., Friedt, J. M., Tolle, F., Griselin, M., Marlin, Ch., and Prokop, A. (2017). Investigating snowpack volumes and icing dynamics in the moraine of an arctic catchment using UAV photogrammetry. Photogrammetric Rec. 32 (160), 497–512. doi:10.1111/phor.12217
Bharti, A. K., Prakash, A., Verma, A., Oraon, J., Chaudhary, D. K., Kumar, S., et al. (2022). Mapping of decades-old underground coal mine workings using electrical resistivity tomography. J. Earth Syst. Sci. 131, 258. doi:10.1007/s12040-022-02008-7
Brasseur, P., Kokelj, S. V., Fraser, R., and Lacelle, D. (2016). A first approximation of aufeis distribution in eastern Yukon and adjacent Northwest territories. Can. N. W. T. Open Rep. 2016-010, 16. doi:10.46887/2016-010
Brombierstäudl, D., Schmidt, S., and Nüsser, M. (2021). Distribution and relevance of aufeis (icing) in the upper indus basin. Sci. Total Environ. 780, 146604. doi:10.1016/j.scitotenv.2021.146604
Brombierstäudl, D., Schmidt, S., and Nüsser, M. (2023). Spatial and temporal dynamics of aufeis in the Tso Moriri basin, eastern Ladakh, India. Permafr. Periglac. Process. 34 (1), 81–93. doi:10.1002/ppp.2173
Brombierstäudl, D., Schmidt, S., Soheb, M., and Nüsser, M. (2024). Aufeis thickness and volume estimations from stereo satellite imagery and terrestrial photographs: evidence from Central Ladakh, India. Sci. Total Environ. 954, 176180. doi:10.1016/j.scitotenv.2024.176180
Carey, K. L. (1973). “Icings developed from surface water and ground water,” in Cold regions science and engineering monograph 111-D3 (Hanover, New Hampshire: US Army Corps of Engineers, Army Cold Regions Research and Engineering Lab).
Carrivick, J. L., Boston, C. M., King, O., James, W. H. M., Quincey, D. J., Smith, M. W., et al. (2019). Accelerated volume loss in glacier ablation zones of NE Greenland, little ice age to present. Geophys. Res. Lett. 46, 1476–1484. doi:10.1029/2018gl081383
Carrivick, J. L., Smith, M. W., and Quincey, D. J. (2016). Structure from motion in the geosciences. 1st ed. Wiley-Blackwell.
Chernykh, V., Shikhov, A., Ayurzhanaev, A., Sodnomov, B., Tsydypov, B., Zharnikova, M., et al. (2024). Icings in the Selenga River basin. J. Maps 20 (1), 1–10. doi:10.1080/17445647.2024.2340994
Chu, T., and Lindenschmidt, K.-E. (2016). Integration of space-borne and air-borne data in monitoring river ice processes in the Slave River, Canada. Remote Sens. Environ. 181, 65–81. doi:10.1016/j.rse.2016.03.041
Clough, N. K., Patton, P. C., and Christiansen, A. C. (1987). “Arctic National Wildlife Refuge, Alaska, coastal plain resource assessment: report and recommendation to the congress of the United States and final legislative environmental impact statement,” in U.S. Fish and wildlife service, U.S. Geological Survey, and Bureau of Land Management, Washington, D.C., USA.
Crites, H., Kokelj, S. V., and Lacelle, D. (2020). Icings and groundwater conditions in permafrost catchments of northwestern Canada. Sci. Rep. 10 (1), 3283. doi:10.1038/s41598-020-60322-w
Dahlin, T., and Zhou, B. (2004). A numerical comparison of 2D resistivity imaging with 10 electrode arrays. Geophys. Prospect. 52 (5), 379–398. doi:10.1111/j.1365-2478.2004.00423.x
Daly, S. F., Zufelt, J. E., Fitzgerald, P., Gelvin, A., and Newman, S. (2011). Aufeis formation in Jarvis Creek and flood mitigation. Hanover, New Hampshire: US Army Corps of Engineers, Cold Regions Research and Engineering Laboratory. ERDC/CRREL TR-11-14.
Dann, J., Zwieback, S., Leonard, P., and Bolton, W. R. (2025). Evaluating aufeis detection methods using Landsat imagery. Comparative assessment and recommendations. Sci. Remote Sens. 11, 100230. doi:10.1016/j.srs.2025.100230
Dashtseren, A. (2008). Permafrost distribution map of valleys and basins around ulaanbaatar. [master's thesis]. Ulaanbaatar: National University of Mongolia.
Dozier, J., Bair, E. H., and Davis, R. E. (2016). Estimating the spatial distribution of snow water equivalent in the world’s mountains. WIREs Water 3 (3), 461–474. doi:10.1002/wat2.1140
Ekwue, E. I., and Bartholomew, J. (2011). Electrical conductivity of some soils in Trinidad as affected by density, water and peat content. Biosyst. Eng. 108, 95–103. doi:10.1016/j.biosystemseng.2010.11.002
Ensom, T., Makarieva, O., Morse, P., Kane, D., Alekseev, V., and Marsh, P. (2020). The distribution and dynamics of aufeis in permafrost regions. Permafr. Periglac. Process. 31, 383–395. doi:10.1002/ppp.2051
V. R. Everdingen (1998). Multi-language glossary of permafrost and related ground ice terms 1998 (Boulder, CO: National Snow and Ice Data Center/World Data Center for Glaciology).
Frost, G. V., Roland, C. A., and Schmidt, J. H. (2023). Dynamic disequilibrium: recent widespread increases in vegetation cover on subarctic floodplains of Interior Alaska. Ecosphere 14 (1), e4344. doi:10.1002/ecs2.4344
Gagarin, L., Wu, Q., Cao, W., and Jiang, G. (2022). Icings of the kunlun mountains on the northern margin of the Qinghai-Tibet plateau, western China: origins, hydrology and distribution. Water 14 (15), 2396. doi:10.3390/w14152396
Gagarin, L., Wu, Q., Melnikov, A., Volgusheva, N., Tananaev, N., Jin, H., et al. (2020). Morphometric analysis of groundwater icings: intercomparison of estimation techniques. Remote Sens. 12 (4), 692. doi:10.3390/rs12040692
Geological map of Mongolia (1998). Available online at: https://www.gsj.jp/data/openfile/no0349/OFR349app_Mongolia_L-47-23.pdf (Accessed May 27, 2025).
Giao, P. H., Chung, S. G., Kim, D. Y., and Tanaka, H. (2003). Electric imaging and laboratory resistivity testing for geotechnical investigation of Pusan clay deposits. J. Appl. Geophys. 52, 157–175. doi:10.1016/S0926-9851(03)00002-8
Graf, R. (2018). Analysis of Granger causality between daily and monthly temperatures of water and air, as illustrated with the example of Noteć River. Acta Sci. Pol. Form. Circumiectus 18, 101–117. doi:10.15576/ASP.FC/2018.17.3.101
Hall, D. K. (1980). Mineral precipitation in North Slope river icings. Arctic 33. doi:10.14430/arctic2567
Hall, D. K., Riggs, G. A., and Salomonson, V. V. (1995). Development of methods for mapping global snow cover using moderate resolution imaging spectroradiometer data. Remote Sens. Environ. 54, 127–140. doi:10.1016/0034-4257(95)00137-p
Harden, D., Barnes, P., and Reimnitz, E. (1977). Distribution and character of naleds in Northeastern Alaska. Arctic 30, 28–40. doi:10.14430/arctic2681
Härer, S., Bernhardt, M., Siebers, M., and Schulz, K. (2018). On the need for a time- and location-dependent estimation of the NDSI threshold value for reducing existing uncertainties in snow cover maps at different scales. Cryosphere 12 (5), 1629–1642. doi:10.5194/tc-12-1629-2018
Hauck, C. (2002). Frozen ground monitoring using DC resistivity tomography. Geophys. Res. Lett. 29 (21). doi:10.1029/2002gl014995
Hendriks, J. P., and Pellikka, P. (2007). Semiautomatic glacier delineation from Landsat imagery over Hintereisferner glacier in the Austrian Alps. Gletscherkd. Glazialgeol. 41, 55–75.
Holst, G., Malene, T., Carsten, B. P., Robert, G. P., Jørgen, B., Jesper, H. C., et al. (2018). Ammonia, ammonium, and the risk of asthma. Environ. Epidemiol. 2, e019. doi:10.1097/ee9.0000000000000019
Huryn, A. D., Gooseff, M. N., Hendrickson, P. J., Briggs, M. A., Tape, K. D., and Terry, N. C. (2021). Aufeis fields as novel groundwater-dependent ecosystems in the arctic cryosphere. Limnol. Oceanogr. 66 (3), 607–624. doi:10.1002/lno.11626
Jabrane, O., Martínez-Pagán, P., Martínez-Segura, M. A., Alcalá, F. J., El Azzab, D., Vásconez-Maza, M. D., et al. (2023). Integration of electrical resistivity tomography and seismic refraction tomography to investigate subsiding Sinkholes in Karst Areas. Water 15, 2192. doi:10.3390/w15122192
Kääb, A., Altena, B., and Mascaro, J. (2019). River-ice and water velocities using the Planet optical cubesat constellation. Hydrol. Earth Syst. Sci. 23, 4233–4247. doi:10.5194/hess-23-4233-2019
Kane, D. L. (1981). Physical mechanics of aufeis growth. Can. J. Civ. Eng. 8, 186–195. doi:10.1139/l81-026
Kelly, W. E., and Kalinski, R. (1993). Comment on “Theoretical prediction of electrical conductivity in saturated and unsaturated soil” by Y. Mualem and S. P. Friedman. Water Resour. Res. 29, 3835–3836. doi:10.1029/93wr02323
Klene, A. E., Nelson, F. E., Shiklomanov, N. I., and Hinkel, K. M. (2018). The N-factor in Natural Landscapes: Variability of Air and Soil-Surface Temperatures, Kuparuk River Basin, Alaska, U.S.A. Arct. Antarct. Alp. Res. 33 (2), 140–148. doi:10.1080/15230430.2001.12003416
Kuklina, M., Kuklina, V., Shiklomanov, N., Shiklomanov, A., Nyland, K. E., Sandag, K., et al. (2025). Snow, ice and permafrost landscapes as “frozen commons”: Examples from northern Mongolia. Environ. Res. Lett. 20, 064024. doi:10.1088/1748-9326/adc7cb
Lainis, A., Neupauer, R. M., Koch, J. C., and Gooseff, M. N. (2024). Seasonal and decadal subsurface thaw dynamics of an Aufeis feature investigated through numerical simulations. Hydrol. Process. 38. doi:10.1002/hyp.15106
Lei, L., Dong-Liang, L., Lei, W., Ya-Dong, H., and Fang-Fang, C. (2020). Dynamics of freezing/thawing indices and frozen ground from 1900 to 2017 in the upper Brahmaputra River Basin, Tibetan Plateau. Adv. Clim. Change Res. doi:10.1016/j.accre.2020.10.003
Li, S., Benson, C., Shapiro, L., and Dean, K. (1997). Aufeis in the Ivishak River, Alaska, mapped from satellite radar interferometry. Remote Sens. Environ. 60, 131–139. doi:10.1016/s0034-4257(96)00167-8
Liu, W., Fortier, R., Molson, J., and Lemieux, J.-M. (2021). A conceptual model for talik dynamics and icing formation in a river floodplain in the continuous permafrost zone at Salluit, Nunavik (Quebec), Canada. Permafr. Periglac. Process. 32 (3), 468–483. doi:10.1002/ppp.2111
Loke, M. H., and Barker, R. D. (1996). Practical techniques for 3D resistivity surveys and data inversion1. Geophys. Prospect. 44, 499–523. doi:10.1111/j.1365-2478.1996.tb00162.x
Lunardini, V. J. (1978). “Theory of N-factors and correlation of data,”in Proceedings of the third international conference on permafrost, 1. Ottawa: National Council of Canada, 40–46.
Luo, D., Jin, H., Jin, R., Yang, X., and Lü, L. (2014). Spatiotemporal variations of climate warming in northern Northeast China as indicated by freezing and thawing indices. Q. Int. 349, 187–195. doi:10.1016/j.quaint.2014.06.064
Makarieva, O., Nesterova, N., Shikhov, A., Zemlianskova, A., Luo, D., Ostashov, A., et al. (2022). Giant Aufeis-Unknown glaciation in North-Eastern Eurasia according to Landsat images 2013–2019. Remote Sens. 14 (17), 4248. doi:10.3390/rs14174248
Makarieva, O., Shikhov, A., Nesterova, N., and Ostashov, A. (2019). Historical and recent aufeis in the Indigirka River Basin (Russia). Earth Syst. Sci. Data 11 (1), 409–420. doi:10.5194/essd-11-409-2019
Martines-López, J., Rey, J., Dueñas, J., Hidalgo, C., and Benavente, J. (2013). Electrical Tomography Applied to the Detection of Subsurface Cavities. J. Cave Karst Stud., 28–37. doi:10.4311/2011es0242
McCarter, W. J. (1984). The electrical resistivity characteristics of compacted clays. Géotechnique 34, 263–267. doi:10.1680/geot.1984.34.2.263
Meteorological and Environmental Information Database (2024). Air temperature. Available online at: https://archive.weather.gov.mn/ (Accessed November 27, 2024).
Morse, P. D., and Wolfe, S. A. (2015). Geological and meteorological controls on icing (aufeis) dynamics (1985 to 2014) in subarctic Canada. J. Geophys. Res. Earth Surf. 120 (9), 1670–1686. doi:10.1002/2015JF003534
Onset Computer Corporation (2018). HOBO Pendant Temperature data loggers and RX3000 Remote monitoring station.
Oyunbat, P., Munkh-Erdene, A., Enkhbayar, B., Batkhishig, O., and Myagmartseren, P. (2022). Environmental impact assessment of pit latrines using remote sensing and multi-criteria spatial analysis in Ulaanbaatar (ger area), Mongolia. Int. Arch. Photogr. Remote Sens. Spat. Inf. Sci. XLIII-B3-2022, 1279–1285. doi:10.5194/isprs-archives-xliii-b3-2022-1279-2022
Palacky, G. J. (1987). “Resistivity Characteristics of Geologic Targets,”. Electromagnetic methods in applied geophysics theory tulsa. Editor M. N. Nabighian (Okla: Society of Exploration Geophysicists), 1, 53–122.
Pazdirek, O., and Bláha, V. (1996). Examples of resistivity imaging using ME-100 resistivity field acquisition system. Proceedings. doi:10.3997/2214-4609.201408817
Prowse, T., Alfredsen, K., Beltaos, S., Bonsal, B., Duguay, C., Korhola, A., et al. (2011). Arctic freshwater ice and its climatic role. Ambio 40, 46–52. doi:10.1007/s13280-011-0214-9
Reynolds, J. M. (2011). An introduction to applied and environmental geophysics. 2nd ed. Chichester: Wiley-Blackwell.
Roney, N., and Fernando, L. (2016). Toxicological profile for ammonia. Cdc. Gov. Available online at: https://stacks.cdc.gov/view/cdc/7005.
Samouëlian, A., Cousin, I., Tabbagh, A., Bruand, A., and Richard, G. (2005). Electrical resistivity survey in soil science: a review. Soil till. Res. 83, 173–193. doi:10.1016/j.still.2004.10.004
Schmidt, S., and Nüsser, M. (2017). Changes of High Altitude Glaciers in the Trans-Himalaya of Ladakh over the Past Five Decades (1969–2016). Geosciences 7 (2), 27. doi:10.3390/geosciences7020027
Schmitt, T., Brombierstäudl, D., Schmidt, S., and Nüsser, M. (2024). Giant aufeis in the Pangong Tso Basin: Inventory of a neglected cryospheric component in eastern Ladakh and western Tibet. Atmosphere 15 (3), 263. doi:10.3390/atmos15030263
Sharkhuu, N., and Anarmaa, S. (2015). Thermal insulations of land cover in Mongolia. Geogr. Issues Mong. 11. ISBN978-99973-0-951-8.
Silverio, W., and Jaquet, J. M. (2005). Glacial cover mapping (1987–1996) of the Cordillera Blanca (Peru) using satellite imagery. Remote Sens. Environ. 95 (3), 342–350. doi:10.1016/j.rse.2004.12.012
Smith, M. W., Carrivick, J. L., and Quincey, D. J. (2015). Structure from motion photogrammetry in physical geography. Prog. Phys. Geogr. 40 (2), 247–275. doi:10.1177/0309133315615805
Stanford, J. A., DelVecchia, A. G., Giersch, J. J., and Malison, R. L. (2024). Amphibitic stoneflies (Plecoptera) are integrators of ecosystem processes in alluvial aquifers of gravel-bed river floodplains. WIREs Water 11, e1720. doi:10.1002/wat2.1720
Statistical Information Service of Mongolia (2023). Population. Available online at: https://www2.1212.mn/tables.aspx?TBL_ID=DT_NSO_0300_027V1 (Accessed March 13, 2024).
Telford, W. M., Geldart, L. P., and Sheriff, R. E. (1990). Applied geophysics. 2nd ed. Cambridge: Cambridge University Press.
Terry, N., Grunewald, E., Briggs, M., Gooseff, M., Huryn, A. D., Kass, M. A., et al. (2020). Seasonal Subsurface Thaw Dynamics of an Aufeis Feature Inferred From Geophysical Methods. J. Geophys. Res. Earth Surf. 125 (3). doi:10.1029/2019jf005345
Todd, D., and Mays, L. (2005). Groundwater Hydrology. 3rd Edition. Hoboken: John Wiley and Sons, Inc., 652. Available online at: https://www.scirp.org/reference/referencespapers?referenceid=1301756.
Toniolo, H., Stutzke, J., Lai, A. L., Youcha, E. K., Tschetter, T. J., Vas, D. A., et al. (2017). Antecedent conditions and damage caused by 2015 spring flooding on the Sagavanirktok River, Alaska. J. Cold Reg. Eng. 31. doi:10.1061/(asce)cr.1943-5495.0000127
Toupin, B., Huot, J., and Manseau, M. (1996). Effect of Insect Harassment on the Behaviour of the Rivière George Caribou. Arctic 49. doi:10.14430/arctic1213
Turcotte, B., Dubnick, A., McKillop, R. J., and Ensom, T. (2023). Icing and aufeis in cold regions I: the origin of overflow. Can. J. Civ. Eng. 51, 93–108. doi:10.1139/cjce-2023-0057
U.S. Geological Survey web-service (2024). Available online at: https://earthexplorer.usgs.gov (Accessed May 14, 2024).
Walther, M., Batsaikhan, V., Dashtseren, A., Jambaljav, Y., Temujin, K., Ulanbayar, G., et al. (2021). The formation of aufeis and its impact on infrastructure around Ulaanbaatar, north-central Mongolia. Erforsch. Biol. Ressourcen Mong. 265, 385–398.
Westoby, M. J., Brasington, J., Glasser, N. F., Hambrey, M. J., and Reynolds, J. M. (2012). “Structure-from-Motion” photogrammetry: A low-cost, effective tool for geoscience applications. Geomorphology 179, 300–314. doi:10.1016/j.geomorph.2012.08.021
Woodget, A. S., Austrums, R., Maddock, I. P., and Habit, E. (2017). Drones and digital photogrammetry: from classifications to continuums for monitoring river habitat and hydromorphology. Wiley Interdiscip. Rev. Water 4, e1222. doi:10.1002/wat2.1222
Wu, T., Wang, Q., Zhao, L., Batkhishig, O., and Watanabe, M. (2011). Observed trends in surface freezing/thawing index over the period 1987–2005 in Mongolia. Cold Reg. Sci. Technol. 69, 105–111. doi:10.1016/j.coldregions.2011.07.003
Yamkhin, J., Yadamsuren, G., Khurelbaatar, T., Gansukh, T., Tsogtbaatar, U., Adiya, S., et al. (2022). Spatial distribution mapping of permafrost in Mongolia using TTOP. Permafr. Periglac. Process. 33, 386–405. doi:10.1002/ppp.2165
Yonatan, G. D., Chang, P. Y., and Jordi, M. P. (2021). Uncertainty of the 2D Resistivity Survey on the Subsurface Cavities. Appl. Sci. 11 (7), 3143. doi:10.3390/app11073143
Yoshikawa, K., Hinzman, L. D., and Kane, D. L. (2007). Spring and aufeis (icing) hydrology in Brooks Range, Alaska. J. Geophys. Res. Biogeosci. 112. doi:10.1029/2006jg000294
Yu, W. B., Lai, Y. M., Bai, Y. L., Zhang, X. F., Zhuang, D. S., Li, Q. H., et al. (2005). Icing problems on road in Da Hinggangling Forest region and prevention measures. Cold Reg. Sci. Technol. 42, 79–88. doi:10.1016/j.coldregions.2005.02.004
Zhang, T. (2005). Influence of the seasonal snow cover on the ground thermal regime: an overview. Rev. Geophys. 43. doi:10.1029/2004rg000157
Keywords: aufeis, spatial distribution, n-factor, snow cover, remote sensing, ERT
Citation: Ulambayar G, Watanabe T, Dashtseren A, Nakamura D, Jambaljav Y, Byambabayar G, Temuujin K, Tsogt-Erdene G and Otgonjargal D (2025) The influence of natural factors on the spatial distribution of aufeis in Ulaanbaatar, Mongolia. Front. Earth Sci. 13:1611054. doi: 10.3389/feart.2025.1611054
Received: 13 April 2025; Accepted: 30 June 2025;
Published: 18 July 2025.
Edited by:
Rebecca Mott, WSL Institute for Snow and Avalanche Research SLF, SwitzerlandReviewed by:
Toshihiro Ozeki, Hokkaido University of Education, JapanDagmar Brombierstäudl, University of Freiburg, Germany
Copyright © 2025 Ulambayar, Watanabe, Dashtseren, Nakamura, Jambaljav, Byambabayar, Temuujin, Tsogt-Erdene and Otgonjargal. This is an open-access article distributed under the terms of the Creative Commons Attribution License (CC BY). The use, distribution or reproduction in other forums is permitted, provided the original author(s) and the copyright owner(s) are credited and that the original publication in this journal is cited, in accordance with accepted academic practice. No use, distribution or reproduction is permitted which does not comply with these terms.
*Correspondence: Ganbold Ulambayar, dWxhbWJheWFyZ0BtYXMuYWMubW4=