 Clara Sena1,2*
 Ioannis Papadimitrakis1
 Alvar Braathen1Andreas Aspaas3,4Gustav Pless4Anniina Kittilä1Carlos Miraldo Ordens5
- 1Department of Geosciences, University of Oslo, Geologibygningen, Oslo, Norway
- 2Norconsult, Sandvika, Norway
- 3The Njord Centre, Departments of Geosciences and Physics, University of Oslo, Oslo, Norway
- 4Section for Landslides and Avalanches, Norwegian Resources and Energy Directorate, Trondheim, Norway
- 5Centre for Water in the Minerals Industry, Sustainable Minerals Institute, The University of Queensland, Brisbane, QLD, Australia
The Åknes rockslide lies in a steep mountain slope, dipping on average 30 to 35° towards Sunnylv Fjord, Western Norway. As part of the early-warning system implemented for this rockslide, hydraulic heads have been continuously monitored since 2007. Four multi-level boreholes established in 2017–2018 provided an unprecedent dataset to better understand groundwater recharge in such geological setting. Hydraulic-head timeseries reveal high and opposing trends of up to 3.5 and −6.3 m/year, which could be related to the continuous alteration of the geometry and permeability of the water-carrying fracture network, due to rockmass creeping and widening of tension fractures. Deeper than 80 m below ground, hydraulic heads change from underpressured conditions in Spring to overpressured conditions in Autumn. The seasonal peak in hydraulic heads, coinciding with overpressured conditions, is a major concern in an eventual acceleration of the rockslide. Water infiltration is favoured in vertical fracture zones and local topographic depressions, such as the backscarp, while the connectivity of the sub-vertical fractures allows infiltrating water to reach the water table at 33–78 m depth, contributing to groundwater recharge. Water is available for infiltration in periods with near frost- and snow-free ground (May to November), with considerably higher amounts of water from May to June due to higher snowmelt rates. These results provide a better understanding of the hydrological regime and recharge processes in a steep mountain slope and their implications for the management of unstable slopes.
Introduction
Due to their importance for freshwater supply systems, the majority of the literature concerning groundwater recharge has focused primarily on porous, karstic (e.g., Healy, 2010; Ordens et al., 2012; Malík et al., 2020), and to a lesser extent on fractured aquifers (Kambuku et al., 2018; Ofterdinger et al., 2004, among others).
A better understanding of i) the water flow in the unsaturated zone, ii) the seasonality of hydraulic heads, and iii) their response to precipitation and snowmelt events, is crucial to assess the natural processes that control the temporary storage of groundwater in fractured aquifers located at steep mountain slopes. This is especially important when these mountain slopes display instability of the fractured rockmass, such as the Åknes rockslide bordering the Sunnylv Fjord, in western Norway. Triggering of rock- and landslides is controlled by an often very complex set of factors, with water being one of the most critical drivers. Understanding groundwater recharge is therefore an essential part of understanding and monitoring rock- and landslides. Furthermore, climate change is likely to disturb the prevailing hydrological system in Åknes, resulting in changes in temperature, rainfall and snowfall (Hanssen-Bauer et al., 2017). Thus, it is critical to understand the hydrological regime and recharge processes so that we can assess the effect of climate change on slope stability. This paper contributes to fill some of these knowledge gaps by providing a new hydrogeological dataset on the Åknes rockslide. Based on this dataset, we develop a conceptual model of groundwater recharge and perform an analysis of the corresponding recharge events.
The work presented here is a further development of the dataset and complementary study to the work presented in NVE (2024), Norwegian Resources and Energy Directorate). The latter is the online publication of an internal project report, published in 2021. This is a thorough project report where besides conceptual modelling of the sliding surfaces and rockmass properties, and numerical modelling of groundwater flow, the timeseries of groundwater levels were also analysed. In NVE (2024) the main focus regarding the timeseries of groundwater levels was on the open boreholes, and only one multi-level borehole (KH-02–17), which by 2020 was the only multi-level borehole with high enough quality data.
The present work adds to NVE (2024) (i) data which is now available for three multi-level boreholes (KH-02–17, KH-01–18 and KH-02–18) together with data from open boreholes, with timeseries until December 2022; (ii) the analysis of individual recharge events, based on the water-table fluctuation method, and (iii) the analysis of the underpressured and overpressured conditions that are registered at depths higher than 80 mgb (meters below ground).
Materials and methods
Study area
Åknes rockslide (62.18 North; 7.00 East) is located on a relatively steep mountain slope dipping on average 30 to 35° southeast, with minimum and maximum dips of less than 4° and 90°, respectively. The mountain side extends from the mountain ridge at 1,430 masl (meters above sea-level) down to the Sunnylv Fjord at 0 masl, while the Åknes rockslide extends from the backscarp, at 900 to 700 masl, to the toe zone at approximately 200 masl (Figure 1). To the west, the unstable slope is delimited by a steep NNW-SSE trending fracture zone along which runs an ephemeral stream, referred to as the Western Gully. This fracture zone detaches the rockslide from intact rock farther west. To the east, the unstable slope is bounded by a pre-existing fault dipping 35°–45° to the west, where the ephemeral Eastern Stream runs (Ganerød et al., 2008). Borehole and geophysical data indicate a basal shear zone between 33 to 70 mbg (meters below ground), and a shallower shear zone between 8 and 34 mbg (Aspaas et al., 2024).
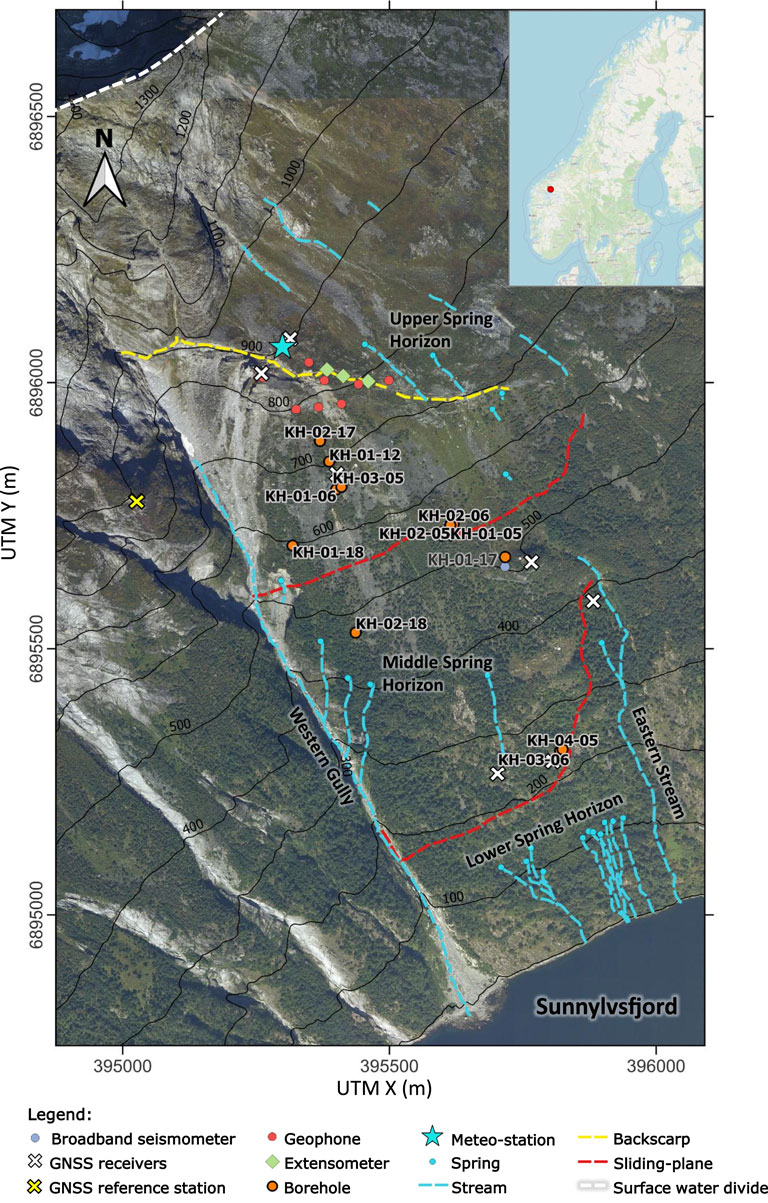
Figure 1. Location of Åknes rockslide and its instrumentation, managed by NVE. Interpreted backscarp and sliding planes by Ganerød et al. (2008). Location of springs and streams by Frei (2008) and Biørn-Hansen (2019). WGS84 UTM 32N coordinates in meters. GNSS: Global Navigation Satellite System. Insert map from Google Maps shows location of Åknes (red dot) in western Norway.
The backscarp area in Åknes is an important geomorphological element in the mountain slope, where groundwater recharge is favoured. It is more open to the west, and progressively closes to the east. The graben that forms the western part of the backscarp is 20–30 m deep, 20–30 m wide and 150 m long. In the middle part of the backscarp, ca. 350 m long open fractures partially filled with disintegrated rock, penetrate at least 60 m deep. To the east, a 10–20 m high rocky cliff runs along for 240 m. The treeline, which influences evapotranspiration rates and therefore groundwater recharge, crosses the rockslide around 200 m downslope from the backscarp.
The rockmass is dominated by granitic to biotite-rich schistose gneisses reworked during the Caledonian Orogeny. There are also laminae, and up to 20 cm thick layers of biotite schistose gneiss (Braathen et al., 2004). Sub-vertical joints form predominantly in the granitic gneiss while undulating foliation surfaces, which are sub-parallel to the mountain slope, prevail in the biotite schistose gneiss (Ganerød et al., 2008).
Every winter-spring (December to May), the mountain slope has a snow cover of up to 550 cm deep, from the mountain ridge down to at least 500 masl. In addition, the ground freezes along the mountain slope, reaching a depth of up to 30 cm. In Spring, runoff from snowmelt brings significant volumes of water into the rockslide area. Several ephemeral springs and streams have been mapped from 1,000 to 100 masl, and in the rockslide area the springs’ location indicates groundwater seepage along the sliding surfaces. The seasonal streams located at the Upper Spring Horizon (Figure 1) flow into the backscarp, eventually leading to groundwater recharge, while the abundant springs at the Lower Spring Horizon, represent an important discharge area for groundwater (Ganerød et al., 2008). By comparing displacement data from the backscarp with meteorological data from the Åknes station, Grøneng et al. (2011) identified the most important meteorological factors affecting the activity in the backscarp, namely, snow and ice melt water in Spring and large temperature fluctuations around the freezing point in Spring, Autumn, and early Winter.
Hydrometeorological timeseries
Hydrometeorological data, such as snow cover, snowmelt, frozen soil depth and wind-speed, are crucial for the present study. As the dataset at Åknes meteorological station for the period 2007–2022 is limited to daily air temperature and precipitation, we use grid-based hydrometeorological calculated data publicly available at Xgeo (2023) for the two grid-cells that cover the Åknes mountain slope (with centroids at 1,160 and 300 masl). The daily hydrometeorological data is estimated for grid cells of 1 km2 that cover the whole Norway. Observed data of daily air temperature (ca. 230 stations) and precipitation (ca. 400 stations) are spatially interpolated using a Bayesian method (Boje et al., 2018; Saloranta, 2012). A strong correlation is observed between data measured at the Åknes meteorological station and the calculated data for the grid-cell at 1,160 masl, with a Pearson correlation coefficient of 0.911 for precipitation (n = 3,111), and of 0.953 for air temperature (n = 3,418). This data is shown in Supplementary Section 1.
Timeseries of hydraulic heads
As part of the early warning system implemented by the Norwegian Directorate for Water and Energy (NVE) for Åknes rockslide, the timeseries of measured hydraulic heads include four open boreholes, KH-04–05 at 239.8 masl, KH-02–06 at 560.9 masl, KH-03–06 at 239.9 masl, and KH-01–12 at 701.1 masl (covering the period October 2007 to December 2022) and three multi-level boreholes, KH-02–17 at 733.8 masl, KH-01–18 at 593.0 masl, and KH-02–18 at 471.4 masl (covering the period November 2019 to December 2022). Further details are given in Supplementary Section 2.
Results and discussion
Seasonality and trends of the estimated hydrometeorological parameters
The Åknes mountain side is characterized by an average annual precipitation of 1,489 mm/yr (with a maximum of 2,577 mm in 2022) and an average annual air temperature of 0°C, for the 30-year normal period 1993–2022, at 1,160 masl. For the same normal period, the average annual temperature at 300 masl (6°C) is higher than at 1,160 masl (0°C), indicating the influence of elevation on the local air temperature, which affects the snow cover duration and melting rate, thus affecting the groundwater recharge rate. The warmest months are June through August, with an average of 6°C, and a maximum of 20°C. The coldest months are December through February, with an average of −6°C, and a minimum of −26°C, at 1,160 masl.
The months with higher precipitation rates (December through February) are also the coldest, with prevailing negative temperatures. If there is an early thick snow cover, it will insulate the ground, resulting in shallower depth of frozen ground. However, in years with a thin snow cover, the ground may freeze to a greater depth. Both a thick layer of frozen ground and a thick snow cover hinder the infiltration of liquid water and groundwater recharge, the latter attaining its maxima from January to April.
The months that are more favourable to infiltration of water in the soil and subsequent groundwater recharge in Åknes are those with little to no frozen soil, nor snow cover: June through November at 1,160 masl; and all months except February at 300 masl. In addition, in the months with higher snowmelt rates, February through May at 300 masl, and May through July at 1,160 masl, higher amounts of water will infiltrate where the snowpack and/or frozen soil thickness so allow.
The wind speed influences the amount of humidity above the ground and canopy, which in turn influences the rates of evapotranspiration during the warmer months, and snow and ice sublimation during the colder months. The wind speed data at Åknes, from Xgeo (2023), is limited to the period 2018/03/01 to 2022/12/31. This data shows a less prominent seasonality than the remaining hydrometeorological variables, where the windier months are January through March with average and maximum wind speeds of 8 and 20 m/s, respectively. Wind speed at 300 masl is approximately half of that observed at 1,160 masl.
At 300 masl, for the 15-year period 2007–2022 that coincides with the hydraulic head timeseries in Åknes, precipitation and snowmelt show a slightly increasing trend of 0.11 mm/d/year and 0.02 mm/d/year, respectively. Temperature increases by 0.11 °C/year, while snow depth shows the largest increasing trend of 0.33 mm/d/year (and a significantly higher trend at 1,160 masl – 32.46 mm/d/year). Frozen soil depth has a decreasing trend of −0.29 mm/d/year, at 300 masl, but an increasing trend of 0.91 mm/d/year, at 1,160 masl.
Seasonality and stratification of the measured hydraulic heads
The shallowest water-table, at 32.7 mbg, is observed in borehole KH-01–18, which is at 593.0 masl in the mountain slope, located closest to the deep crevasse that forms the Western Gully. The deepest water table, at 77.8 mbg, is observed in borehole KH-02–17, located highest in the mountain slope, at 733.8 masl. Hydraulic head data from the multi-level borehole KH-01–18 show an upward hydraulic gradient that can reach up to 30 m of head difference in November and December (between the deeper sensors at 153 and 189 mbg, and the sensor at 43 mbg, Figure 2), while borehole KH-02–18, also located close to the Western Gully, shows an upward hydraulic gradient throughout the whole year. This clearly indicates that the Western Gully is a local groundwater discharge area, with deeper fractures feeding the shallower fractures that directly discharge into the ephemeral springs located on the flank of the Western Gully (Middle Spring Horizon, in Figure 1).
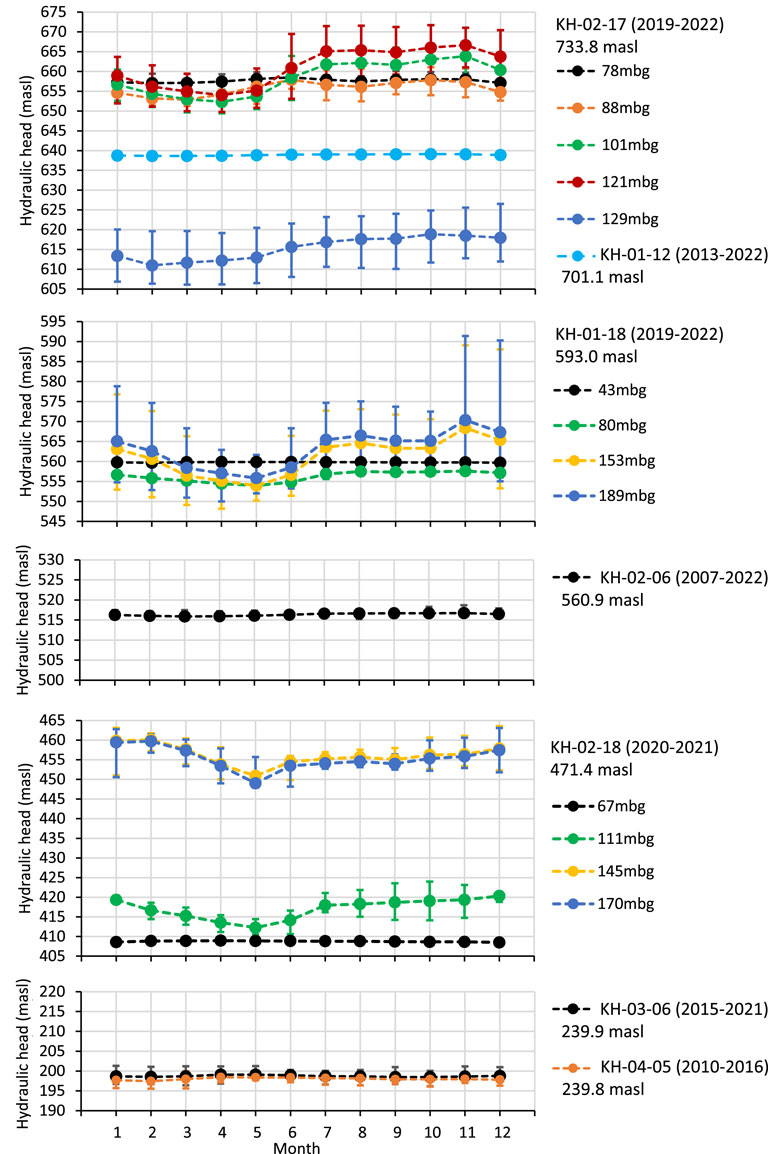
Figure 2. Average hydraulic heads measured in open boreholes (KH-04–05; 02–06; 03–06; 01–12) and multi-level boreholes (KH-02–17; 01–18; 02–18) in Åknes. Bars are minima and maxima. Values in masl, below the borehole reference, refer to the elevation of the borehole on the slope.
The monthly average, maxima and minima of measured hydraulic heads are shown in Figure 2. The datasets from the open boreholes (KH-04–05, KH-02–06, KH-03–06, KH-01–12) reveal a much lower amplitude of variation, between 1.8 and 5.1 m, than the dataset from the deeper sensors of the multi-level boreholes (KH-02–17, KH-01–18, KH-02–18), with an amplitude of 13.5–41.5 m (Supplementary Table 2). The much smaller amplitude of variation observed in open boreholes indicates that this dataset that does not reveal the vertical stratification of hydraulic heads which is clearly seen in the multi-level borehole dataset. The shallowest sensor in each multi-level borehole also has a low amplitude–between 1.1 and 4.1 m, suggesting that the fractures intersecting the shallowest borehole intervals may discharge groundwater close enough to the borehole, resulting in a limited rise in hydraulic head during recharge events.
Stratification of the hydraulic heads has previously been reported based on borehole flow-meter measurements undertaken by the Norwegian Geological Survey (Elvebakk, 2008; Elvebakk, 2013; Elvebakk and Pless, 2018), and on distributed heat tracing tests performed by Acuna et al. (2021). In addition, the evolution of groundwater physico-chemical properties (including pH, temperature, electrical conductivity, major and minor dissolved elements) at springs from the Upper Spring Horizon, close to the backscarp, to the Lower Spring Horizon, at the toe zone (location shown in Figure 1) (Biørn-Hansen, 2019) also indicates different residence times for the shallower and deeper groundwater flow paths in the mountain slope.
Hydraulic heads’ maxima occur from July through December, during which the hydraulic heads at the deeper sensors of KH-02–17 (except sensor at 129 mbg), KH-01–18, and KH-02–18 are higher than the hydraulic heads measured at shallower depths, i.e., upward hydraulic gradient. This stratification of the hydraulic heads, and the corresponding direction and amplitude of the vertical hydraulic gradient change seasonally (Supplementary Figure 2; Supplementary Section 2.2). Hydraulic heads measured deeper than 80 m in the four multi-level boreholes (KH-01–17, -02–17, 01–18 and -02–18) are over hydrostatic pressure in Autumn, and below hydrostatic pressure in Spring, suggesting that at these depths, groundwater recharge rate is higher than groundwater discharge rate in Autumn, and vice versa in Spring. This seasonal accumulation and drainage of groundwater in the fractured rockmass is likely to enhance the destabilization of the Åknes rockslide. The hydraulic heads’ maxima and overpressured conditions observed in boreholes KH-02–17, KH-01–18 and KH-02–18, coincide with peaks of velocity of displacement of the rockmass, and therefore are a major concern regarding an eventual acceleration of the Åknes rockslide (NVE, 2021).
The hydraulic head timeseries (Supplementary Figure 6; Supplementary Table 2) reveal approximately no pluri-annual trend (≤0.01 m/year) in three boreholes (open boreholes KH-04–05; KH-01–12; and, multi-level borehole KH-02–17, sensor at 78 mbg), and clear pluri-annual trends (>0.01 m/year) in two open boreholes (KH-02–06 and KH-03–06) and twelve sensors in three multi-level boreholes (KH-02–17, KH-01–18 and KH-02–18, shown in the Supplementary Table 2). The highest increasing trend of 3.47 m/year is observed in borehole KH-02–17 at 129 mbg, and the most decreasing trend of −6.31 m/year in borehole KH-01–18 at 189 mbg. The possibility that these trends are due to measurement errors is relatively low given the fact that all the boreholes have been installed under controlled conditions, with casing in the upper part and packers at different depths in the multilevel boreholes. They are also not easily accessible to other people that could interfere with the readings. In addition, since all boreholes are part of NVEs early warning system for Åknes rockslide, they are periodically quality-controlled and maintained by dedicated technicians.
The relatively high and opposing trends observed in the hydraulic head timeseries cannot be explained by the trends in precipitation and snowmelt (both at 0.11 mm/d/year). What may explain these trends in hydraulic heads is the continuous alteration of the geometry of the water-carrying fracture network, and the aperture and filling of the fractures themselves, as a consequence of:
• the creeping that occurs constantly at different depths and speeds (Aspaas et al., 2024);
• changes in the topography due to rock fall, which is especially active along the Western Gully, and;
• widening of tension fractures, with eventual collapse of part of the fractures’ walls and/or filling with transported rock debris.
Analysis of groundwater recharge events
Based on the length and continuity of the timeseries, the representativity of the groundwater pressure conditions, and the elevation range in the mountain slope, three boreholes were selected for the analysis of groundwater recharge events:
• Multilevel borehole KH-01–17, at 733.8 masl, using data from sensors at 78, 101 and 129 mbg, timeseries extending from October/2018 to December/2022
• Open borehole KH-02–06, at 560.9 masl, timeseries extending from October/2009 to December/2022
• Open borehole KH-04–05, at 239.8 masl, timeseries extending from November/2009 to January/2017
This analysis is based on the water-table fluctuation method (Healy, 2010), where we first selected individual peaks in the timeseries, and subsequently measured the time it took to reach the peak (duration), and the rise in hydraulic head (Figure 3) (selected peaks are shown in Supplementary Section 2.3). The water-table fluctuation method assumes that rises in groundwater levels in unconfined aquifers are due to recharge water arriving at the water-table. In this method groundwater recharge is estimated based on the assumption that the amount of available water in a column of aquifer unit surface area is equal to specific yield times the height of water in the column.
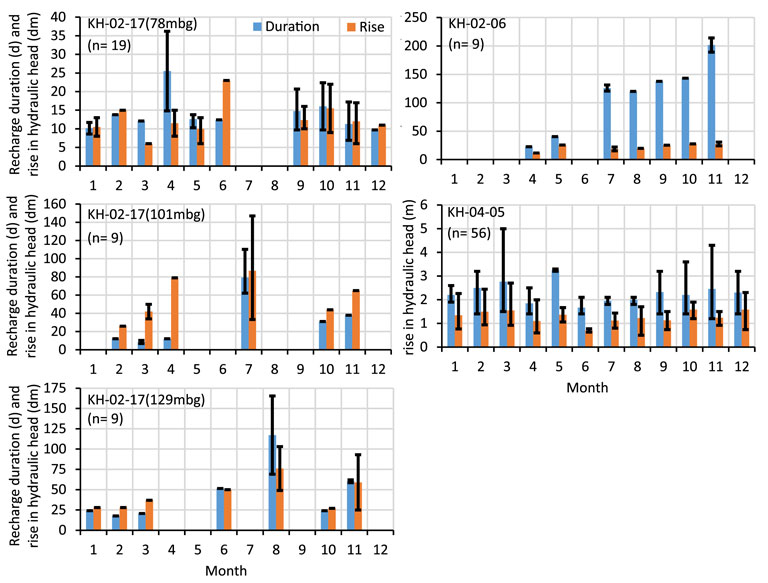
Figure 3. Average rise in hydraulic head (in decimeters, dm, and meters, m) and duration (in days, d) of the groundwater recharge events analyzed for selected boreholes. n is the number of recharge events; black bars show maxima and minima.
It should be noted that the water-table fluctuation method proposed by Healy (2010) is not fully applied in this study. Since there are high uncertainties related to the specific yield that needs to be attributed to the fractured rockmass at Åknes, to be able to fully apply the water-table fluctuation method, we decided to focus solely on the quantification of the rise in hydraulic head, and the time it takes to reach the peak.
The longest recharge events are observed at 101 and 129 mbg in borehole KH-02–17, and in borehole KH-02–06. These events lasted between 165 and 214 days and reached their peaks in the months of July, August and November. The shortest recharge events of less than 2 days are observed in borehole KH-04–05, with relatively short events also observed at the shallowest sensor in borehole KH-02–17. The largest rises in hydraulic head (up to 14.7 m) are registered in borehole KH-02–17 at 101 and 129 mbg. Both of the open boreholes, KH-04–05 and KH-02–06, display small rises in hydraulic head (up to 2.7 m).
At KH-04–05, located at lower elevation, peaks of recharge events are registered every month, while at higher elevation at borehole KH-02–06, no peaks are registered from December to March and in June. The absence of the recharge event peaks from December to March in borehole KH-02–06 suggests that snow cover and/or frozen ground hinder groundwater recharge, but do not completely cease it, according to the data registered in borehole KH-02–17, located at even higher elevation than KH-02–06. At 78, 101 and 129 mbg, borehole KH-02–17 registers smaller and shorter peaks of recharge events from December to March (compared to the other warmer months), indicating that water melts at the bottom of the snow cover and/or frozen ground and slowly recharges groundwater also in the winter months.
Conceptual model of groundwater recharge
Following the approach proposed by Healy (2010), the conceptual model of groundwater recharge at Åknes attempts to answer when, where, and why recharge occurs. The conceptual model of groundwater recharge presented here is based on the work presented in NVE (2024). In Åknes, groundwater recharge occurs because of the combined effects of:
• the available water for infiltration in periods with nearly frost- and snow-free ground (May to November), with considerably higher amounts of infiltrating water from May to June due to higher snowmelt rates;
• the occurrence of vertical fracture zones;
• local topographic depressions, such as the middle part of the backscarp containing a graben; and,
• the connectivity of the sub-vertical fractures below the ground that allow infiltrating water to reach the relatively deep water-table (between 32.7 and 77.8 m deep).
The quantitative estimation of the recharge rates at Åknes are out of the scope of this paper, and the interested reader is referred to NVE (2024) for further reading.
Based on the slope morphology, and field observations of the soil cover and fracturing of the exposed bedrock, the Åknes mountain slope is divided in two main areas–the area upstream and downstream the backscarp (Bruun, 2019; Ringstad, 2019). The area upstream the backscarp, extending from the surface water divide to the backscarp, is located above the treeline, dominated by bare rock areas with a lower degree of fracturing, and sporadically covered by thin soil and rock debris. On the other hand, the area from the backscarp down to the fjord, is mostly below the treeline, is more fractured, with several sub-vertical fracture zones, slide scars, and larger areas covered with thicker soil and rock debris (Figure 4). For these reasons, the area downstream the backscarp is considered more favourable for groundwater recharge than the area upstream the backscarp, and the surface runoff from above the backscarp is believed to infiltrate preferentially at the backscarp (red and blue recharge areas, in Figure 4).
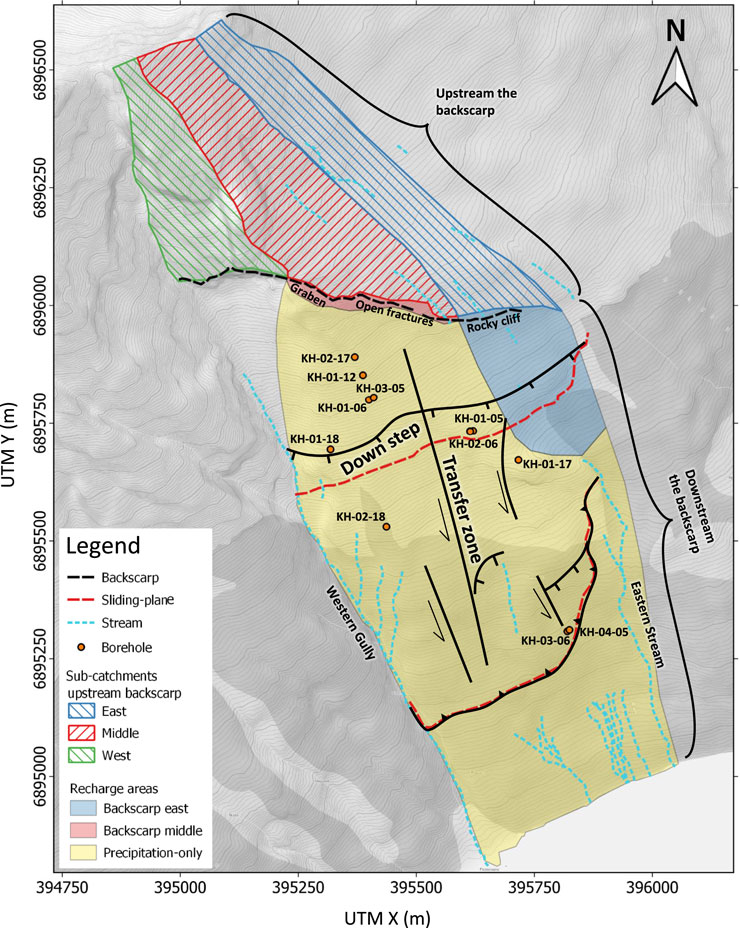
Figure 4. Recharge areas with distinct groundwater recharge processes, and the sub-catchments upstream the backscarp. The main sub-vertical fracture zones that can influence groundwater recharge, are also shown with black lines (modified from NVE, 2024). Topographic basemap from OpenStreetMap.
The area upstream the backscarp is divided into three sub-catchments (Figure 4), based on how they contribute to groundwater recharge downstream of the backscarp:
• West area (68,120 m2), where surface runoff does not lead to groundwater recharge downstream of the backscarp. This is because of the significant slope steepness in the upper part of the Western Gully, which is a deep crevasse that collects rock avalanches, loose boulders, surface runoff from snowmelt and precipitation, and groundwater discharge.
• Middle area (124,190 m2), where surface runoff infiltrates in the middle backscarp area dominated by the graben and open fractures, resulting in localized groundwater recharge.
• East area (101,170 m2), where surface runoff runs down the rocky cliffs as thin waterfalls and preferentially infiltrates in the area between the foot of the cliffs and the upper part of the Eastern Stream, where the ground is covered by bouldery rock debris.
The area downstream the backscarp (including the backscarp) is therefore divided in three distinctive groundwater recharge areas (Figure 4):
• Middle backscarp area (9,090 m2), where localized groundwater recharge occurs due to the infiltration of surface runoff from upstream the backscarp, favoured by the presence of the graben and open fractures in this part of the backscarp.
• East backscarp area (64,250 m2), where groundwater recharge is also fed by infiltration of surface runoff from upstream the backscarp, but it is less localized than in the middle backscarp area due to the more even downslope topography, and fewer open fractures.
• Precipitation-only area (583,900 m2), where surface runoff from upstream of the backscarp is considered not to contribute to groundwater recharge. In this area, what is left from precipitation and snowmelt after evapotranspiration and surface runoff is the only source of diffuse groundwater recharge.
The reliability of the conceptual model of groundwater recharge at Åknes has been tested in a three-dimensional groundwater flow simulation, which has a relatively good agreement between measured and simulated hydraulic heads in five out of seven boreholes that were used in the calibration (NVE, 2024). These results provided a robust framework that proved two major hypotheses: (1) the recharge rate in the backscarp is much higher than in the rest of the unstable slope, due to infiltration of surface runoff originated from the mountain ridge, and (2) tension fractures caused by the displacement of the unstable rockmass generate “groundwater barriers” that sustain a relatively high water table at high elevation in the rock slope.
Conclusions and future work
The timeseries of hydraulic heads in Åknes, covering the period October 2007 to December 2022, reveal high and opposing trends of up to 3.5 and −6.3 m/year that cannot be explained by the trends in precipitation and snowmelt (both at 0.11 mm/d/year). What could explain the trends in hydraulic heads is the continuous alteration of the geometry and permeability of the water-carrying fracture network, as a consequence of the creeping of the rockmass, the changes in topography due to rock fall, and the widening of the tension fractures in the rockslide.
Deeper than 80 m below ground, hydraulic heads change from underpressured conditions in Spring to overpressured conditions in Autumn. This seasonal accumulation and drainage of groundwater in the fractured rockmass is likely to enhance the destabilization of the Åknes rockslide, and the seasonal peak in hydraulic head, registered in November-December represents a major concern in an eventual acceleration of the rockslide.
The longest groundwater recharge events can last as long as 214 days, attaining their peaks in July, August and November. The largest rises in hydraulic head–up to 14.7 m, are registered in July and August in borehole KH-02–17, located closest to the backscarp. Smaller and shorter peaks of recharge occurring from December to March indicate water melting at the bottom of the snow covered and/or frozen ground and slowly recharging groundwater also in the winter months.
Groundwater is recharged in Åknes due to infiltration in vertical fracture zones and local topographic depressions, such as the middle part of the backscarp containing a graben. Water is available for infiltration in periods with near frost- and snow-free ground (May to November), with considerably higher amounts of available water from May to June due to higher snowmelt rates.
Three main groundwater recharge areas are defined in the Åknes rockslide:
• the middle backscarp area, where localized groundwater recharge, with an important contribution from surface runoff from upstream the backscarp, occurs due to the presence of a graben and open fractures;
• the east backscarp area, where groundwater recharge is also fed by infiltration of surface runoff from upstream the backscarp, but due to the more even downslope topography and fewer open fractures, infiltration is less localized than in the middle backscarp area; and,
• the precipitation-only fed area, where the portion of precipitation and snowmelt that is left after evapotranspiration and surface runoff contributes to diffuse groundwater recharge.
The results achieved in this investigation greatly contributed to the onset of the groundwater drainage plan as a measure to increase the stability of this rock slope. As a continuity to this work, we suggest performing a systematic analysis of the effect of (i) the water movement in the unsaturated zone, (ii) the vegetation cover, (iii) the steepness of the ground surface, and (iv) the soil thickness and properties on the groundwater recharge in Åknes, including the use of environmental tracers.
Data availability statement
The datasets presented in this study can be found in online repositories. The names of the repository/repositories and accession number(s) can be found in the article/Supplementary Material.
Author contributions
CS: Investigation, Funding acquisition, Writing – review and editing, Data curation, Writing – original draft, Methodology, Validation, Resources, Conceptualization, Visualization, Project administration, Formal Analysis. IP: Writing – review and editing, Methodology, Investigation, Data curation. AB: Funding acquisition, Investigation, Methodology, Supervision, Writing – review and editing. AA: Resources, Writing – review and editing, Validation, Data curation. GP: Resources, Data curation, Validation, Writing – review and editing. AK: Validation, Writing – review and editing. CO: Writing – review and editing, Investigation, Conceptualization.
Funding
The author(s) declare that financial support was received for the research and/or publication of this article. IP and CS thank the Akademia grant awarded to the University of Oslo. The NVE funding for performing fieldwork in Åknes is also greatly acknowledged.
Acknowledgments
The authors thank NVE’s staff at Stranda office for all the logistics support. We thank Philippe Renard for valuable discussions that helped shape this manuscript. We thank Claire Cote, Neil McIntyre and Maryam Kahe, from The University of Queensland, for constructive comments in the early stages of this manuscript.
Conflict of interest
Author CS was employed by Norconsult.
The remaining authors declare that the research was conducted in the absence of any commercial or financial relationships that could be construed as a potential conflict of interest.
Generative AI statement
The author(s) declare that no Generative AI was used in the creation of this manuscript.
Publisher’s note
All claims expressed in this article are solely those of the authors and do not necessarily represent those of their affiliated organizations, or those of the publisher, the editors and the reviewers. Any product that may be evaluated in this article, or claim that may be made by its manufacturer, is not guaranteed or endorsed by the publisher.
Supplementary material
The Supplementary Material for this article can be found online at: https://www.frontiersin.org/articles/10.3389/feart.2025.1612208/full#supplementary-material
References
Acuna, J., Ramstad, R. K., and Pless, G. (2021). Vertical groundwater movement identification through distributed heat tracing tests. Case of Åknes, Norway. 14th Congr. INTERPRAEVENT 2020.
Aspaas, A., Lacroix, P., Sena, C., Kristensen, L., Langet, N., and Renard, F. (2024). Creep bursts on the Åknes landslide, Norway: detection, characterization and possible mechanisms. J. Geophy. Res. Earth Surf. 129. doi:10.1029/2024JF007733
Biørn-Hansen, F. (2019). The hydrogeochemistry and water balance of Åknes rock slope. (Master thesis). University of Oslo. Available online at: http://urn.nb.no/URN:NBN:no-73743.
Boje, S., Beldring, S., and Engeset, R. (2018). How are weather and water data made for seNorge. Available online at: https://www.nve.no/media/7502/waterdata_v2_no.pdf.
Braathen, A., Blikra, L. H., Berg, S. S., and Karlsen, F. (2004). Rock-slope failures in Norway; type, geometry, deformation mechanisms and stability. Nor. J. Geol., 67–88.
Bruun, H. R. (2019). An analysis of bedrock fracture networks based on outcrop data to establish a baseline discrete fracture network model – Åknes rock slope in western Norway. (Master thesis). University of Oslo. Available online at: http://urn.nb.no/URN:NBN:no-73136
Elvebakk, H. (2008). Borehullslogging, Åknes, Stranda kommune. The geological Survey of Norwegian. NGU report 2008.030. Available online at: https://www.ngu.no/upload/Publikasjoner/Rapporter/2008/2008_030.pdf.
Elvebakk, H. (2013). Borehullslogging i KH-08, Åknes, Stranda kommune, Møre og Romsdal. Geol. Surv. Nor. Available online at: https://www.ngu.no/upload/Publikasjoner/Rapporter/2013/2013_032.pdf.
Elvebakk, H., and Pless, G. (2018). Borehullslogging Åknes, Stranda kommune, 2017 – 2018. Geol. Surv. Nor. Available online at: https://www.ngu.no/upload/Publikasjoner/Rapporter/2018/2018_026.pdf.
Frei, C. (2008). Groundwater flow at the Åknes rockslide site (Norway) results of a multi-tracer test. Switzerland: ETH Zurich. MSc thesis.
Ganerød, G. V., Grøneng, G., Rønning, J. S., Dalsegg, E., Elvebakk, H., Tønnesen, J. F., et al. (2008). Geological model of the Åknes rockslide, western Norway. Eng. Geol. 102 (1–2), 1–18. doi:10.1016/j.enggeo.2008.01.018
Grøneng, G., Christiansen, H. H., Nilsen, B., and Blikra, L. H. (2011). Meteorological effects on seasonal displacements of the Åknes rockslide, western Norway. Landslides 8, 1–15. doi:10.1007/s10346-010-0224-x
Hanssen-Bauer, I., Førland, E. J., Haddeland, I., Hisdal, H., Lawrence, D., Mayer, S., et al. (2017). Climate in Norway 2100 – a knowledge base for climate adaptation. Cambridge: Norwegian Centre for Climate Services.
Kambuku, D., Tsujimura, M., Kagawa, S., and Mdala, H. (2018). Corroborating stable isotopic data with pumping test data to investigate recharge and groundwater flow processes in a fractured rock aquifer, Rivirivi Catchment, Malawi. Environ. Earth Sci. 77, 226. doi:10.1007/s12665-018-7403-9
Malík, P., Coplák, M., Svasta, J., Cernák, R., and Bajtos, P. (2020). Recharge, delayed groundwater-level rise and specific yield in the Triassic karst aquifer of the Kopa Mountain, in the Western Carpathians, Slovakia. Hydrogeology J. 29, 499–518. doi:10.1007/s10040-020-02231-w
NVE (2021). Possibility for using drainage as mitigation to increase the stability of the Åknes rock-slope instability. Stranda West. Nor. Nor. Water Resour. Energy Dir. NVE Rep. nr. 22/2021. Available online at: https://publikasjoner.nve.no/rapport/2021/rapport2021_22.pdf.
NVE (2024). Åknes rock-slope failure hydrogeology: final report, 2021. Åknes rock mass characterization, January-July 2020. Nor. Water Resour. Energy Dir. NVE Extern. Rep. nr. 9/2024. Available online at: https://publikasjoner.nve.no/eksternrapport/2024/eksternrapport2024_09.pdf.
Ofterdinger, U. S., Balder, W., Loew, S., and Renard, P. (2004). Environmental isotopes as indicators for ground water recharge to fractured granite. Groundwater 42 (6), 868–879. doi:10.1111/j.1745-6584.2004.t01-5-.x
Ordens, C. M., Werner, A. D., Post, V. E. A., Hutson, J. L., Simmons, C. T., and Irvine, B. M. (2012). Groundwater recharge to a sedimentary aquifer in the topographically closed Uley South Basin, South Australia. Hydrogeology J. 20, 61–72. doi:10.1007/s10040-011-0794-2
Ringstad, S. R. (2019). The influence of structural discontinuities on the stability of the Åknes rockslide. (Master thesis). University of Oslo. Available online at: http://urn.nb.no/URN:NBN:no-73149
Saloranta, T. M. (2012). Simulating snow maps for Norway: description and statistical evaluation of the seNorge snow model. Cryosphere 6, 1323–1337. doi:10.5194/tc-6-1323-2012
Xgeo (2023). Xgeo. Available online at: https://www.xgeo.no.
Keywords: seasonality of hydraulic heads, stratification of hydraulic heads, snowmelt, vertical fracture zones, localized groundwater recharge
Citation: Sena C, Papadimitrakis I, Braathen A, Aspaas A, Pless G, Kittilä A and Ordens CM (2025) Groundwater recharge in a steep mountain slope and its implications for slope stability: Åknes rockslide (Norway). Front. Earth Sci. 13:1612208. doi: 10.3389/feart.2025.1612208
Received: 15 April 2025; Accepted: 30 May 2025;
Published: 18 June 2025.
Edited by:
Tianming Huang, Chinese Academy of Sciences (CAS), ChinaReviewed by:
Xiaoyan Guo, Chinese Academy of Sciences (CAS), ChinaRudra Mohan Pradhan, National Centre for Earth Science Studies, India
Copyright © 2025 Sena, Papadimitrakis, Braathen, Aspaas, Pless, Kittilä and Ordens. This is an open-access article distributed under the terms of the Creative Commons Attribution License (CC BY). The use, distribution or reproduction in other forums is permitted, provided the original author(s) and the copyright owner(s) are credited and that the original publication in this journal is cited, in accordance with accepted academic practice. No use, distribution or reproduction is permitted which does not comply with these terms.
*Correspondence: Clara Sena, Y2xhcmEuc2VuYUBub3Jjb25zdWx0LmNvbQ==