Abstract
Microseismic monitoring technology plays a critical role in predicting rockbursts in coal mines, yet the deeper potential embedded in microseismic data remains insufficiently explored. This study investigates the evolution characteristics of microseismic signals across four key dimensions—time, energy, space, and frequency—and quantitatively analyzes their interrelationships. The results show that both the multifractal parameter Δα and spatial correlation length exhibit a clear upward trend prior to roof weighting and gradually decline after pressure release. In contrast, the main frequency and b-value decrease as roof weighting approaches and recover afterward. These four indicators demonstrate a precursor period of approximately 2–4 days. Correlation analysis further reveals that all four parameters are not only significantly correlated with working face pressure but also exhibit long-range dependence, with the multifractal parameter Δα showing the strongest correlation. These findings contribute to improving the predictive effectiveness of microseismic monitoring in dynamic disaster early warning.
1 Introduction
The prediction and early warning of rock bursts are fundamental to the development of prevention and control strategies, serving as guiding principles for implementing various preventive measures (Adoko et al., 2013; Askaripour et al., 2022; Wu et al., 2019; Liang et al., 2020; Kong et al., 2024). Currently, the main methods for monitoring rock bursts include microseismic monitoring, electromagnetic radiation monitoring, acoustic emission monitoring, drilling cuttings monitoring, and stress monitoring (Ma et al., 2018; Frid, 1997; Hu et al., 2019; Li et al., 2015; Gong et al., 2022; Zhang et al., 2023; Li et al., 2024). These methods are crucial in monitoring the pressure associated with rock bursts and are widely utilized. Microseismic monitoring technology is the most extensively employed at present. It is primarily used for local monitoring in mining areas, where geophones are installed to detect vibration signals and other indicators of coal and rock rupture. This allows for continuous observation of the stress state within the coal and rock masses, providing insights into the extent of damage and the distribution of stress within them (He et al., 2017; Su et al., 2021; Ding et al., 2020; Zhang C. et al., 2021; Zhang H. et al., 2021; Zhang Z. et al., 2021).
The accurate prediction of rock burst relies on the identification of precursor signals and patterns of disaster occurrence through microseismic monitoring. By capturing and analyzing signals from each microseismic event, key indicators of precursor phenomena are examined, including the energy and frequency of events, spatiotemporal evolution, b-value, energy index, and fractal characteristics (Feng et al., 2016; Xu et al., 2010; Zhang C. et al., 2021; Zhang H. et al., 2021; Zhang Z. et al., 2021). Based on these parameter values, the severity and likelihood of microseismic activity are assessed, facilitating the monitoring and warning of rock burst pressures. Currently, microseismic monitoring technology is extensively applied in actual coal mine operations for predicting rock bursts (Zhao et al., 2021; Zhang C. et al., 2021; Zhang H. et al., 2021; Zhang Z. et al., 2021; Jin et al., 2022; Yu et al., 2022). Fujii et al. (1997) investigated the spatiotemporal evolution of microseismic events and their occurrence levels at the Scintiline coal mine’s working face. They discovered a generally positive correlation between the total daily energy of microseismic events and their frequency, with changes in microseismic energy consistent with the advancement rate. Utilizing a microseismic monitoring system, Srinivasan et al. (1999) analyzed the temporal and spatial distribution of microseismic events in the mining area, noting that the b -value and H-index of disaster precursors were often elevated in areas of significant risk. Song et al. (2024) developed a tiered early-warning index for rock bursts, establishing critical early warning thresholds and monitoring daily total energy and frequency of microseismic events to regulate mining speed. In instances of high-energy events, reducing mining speed is recommended to maintain the severity of rock bursts within controllable limits.
Zhao et al. (2018) analyzed microseismic monitoring data from the coal mine, identifying a decrease in main frequency values, an increase in amplitude, and reductions in the b-value and energy of microearthquakes as precursor characteristics of rock bursts. Li et al. (2020) introduced two types of microseismic shape multifractal feature quantities that exhibit specific patterns prior to rock bursts, with these multifractal features becoming more pronounced during the event than before or after. Cai et al. (2019) developed a spatiotemporal prediction method for multiple microearthquake indices, considering the dimensions of time, space, and intensity. Their findings suggest that higher frequencies of microseismic events, coupled with denser temporal and spatial occurrences, increase the likelihood of impact risks, with practical applications demonstrated in Yuejin coal mine. Wang et al. (2018) explored the precursor characteristics of rock bursts by analyzing mine earthquake energy and frequency, spatial distribution, and energy density clouds, concluding that the expansion and intensification of the energy density cloud can indicate the potential for strong mine earthquakes due to localized stress concentration and energy surges. This multi-dimensional approach allows for real-time monitoring and early warning of the microseismic system. Dou et al. (2018) established a three-dimensional early warning system for rock bursts, creating a multi-parameter index system that considers the time, space, and energy of microearthquakes. This system divides the indices into categories such as activity index, spatiotemporal diffusion, total stress equivalent, and total fault area, thereby enhancing the efficiency and accuracy of early warnings for various types of rock bursts.
The collective research of these scholars lays a foundational basis for utilizing microseismic technology to predict rock bursts. However, the potential characteristics embedded within microseismic data remain underexplored, and the interrelations among their evolutionary laws warrant further analysis. Consequently, this paper delves into the evolution characteristics of microseismic data across four dimensions, including time, energy, space, and frequency, and conducts a quantitative analysis of their intercorrelations. The findings of this research are instrumental in enhancing the predictive capabilities of microseismic monitoring technology.
2 Microseismic monitoring system of coal mine
The studying working face of coal mine is situated in Shanxi province. The surface elevation ranges from 920 m to 953 m, while the working face elevation varies from 294 m to 396 m. The strike length of the working face measures 1,480 m, and its dip length is 289.3 m. The coal seam has a thickness of 5.71 m and a bulk density of 1.38 t/m3.
A microseismic monitoring system is installed at the working face, comprising three monitoring substations and 18 sensors. This system is designed to monitor acoustic signals induced by coal rock fractures in real-time and enhance the signal-to-noise ratio using a high-performance filtering algorithm. Building upon this, a proprietary positioning algorithm is employed to accurately determine the fracture locations within the coal rock, as illustrated in Figure 1.
FIGURE 1

Microseismic monitoring system.
In the process of coal or rock breaking, multi-scale rock mass activities will be accompanied by superposition of human and machine-induced vibration signals, resulting in low signal-to-noise ratio of microseismic signals received by microseismic monitoring system. Accurate extraction of effective information in the received signal is the basis of ensuring the accuracy and reliability of microseismic monitoring and early warning. Therefore, wavelet decomposition method is used to extract effective signals.
The result of the energy representation is called the wavelet packet–energy spectrum, denoted by E(ω), and the signal energy in the frequency band df is E(ω) df, the total energy of the entire range can be defined by Equation 1,
First, the db8 wavelet base is selected for its excellent smoothness and long support length, offering superior time-frequency localization compared to other Daubechies and Coiflet wavelets, and thus is well-suited for capturing abrupt features in microseismic signals affected by high-frequency noise and low-frequency drift. Second, based on the 2 kHz sampling frequency and a 1 kHz Nyquist frequency, a 5-layer decomposition is performed to obtain 32 sub-bands, allowing detailed analysis of the signal’s frequency content. Finally, the signal is decomposed to the fifth layer, with each component S5, j corresponding to an energy value E5, j, forming the basis for evaluating the energy distribution across different frequency bands, which can be described by Equation 2.
Microseismic signals are often buried in noise, leading to a low signal-to-noise ratio in the data received by sensors. Figure 2A present the original signals collected by the on-site monitoring system, which contain significant high-frequency noise and low-frequency drift, obscuring the waveform and reducing accuracy. To extract meaningful information, wavelet decomposition is applied to denoise and reconstruct the signals, as shown in Figure 2B. After filtering, the signal-to-noise ratio is significantly enhanced, and the waveform becomes clearer, greatly aiding in accurate source localization.
FIGURE 2

Microseismic signal waveform. (A) Original waveform (B) The filtered waveform.
After filtering the acquired microseismic data, the double-difference positioning method is used to accurately locate microseismic events and obtain real-time information across multiple dimensions, including time, space, intensity, and frequency. Each dimension offers a unique perspective on the process of coal and rock damage and fracturing. A comprehensive analysis of the variation patterns across these dimensions is crucial for understanding the evolution of underground stress conditions and plays an important role in the early warning of coal and rock dynamic disasters.
3 Evolution characteristics of microseismic multidimensional information
3.1 Time dimension information
Due to characteristics such as heterogeneity and anisotropy, the fracture modes of coal rock materials are also characterized as multi-scale, nonlinear, and unstable. In this section, the box-counting method is used to calculate the probability distribution of physical quantities and apply statistical physics methods to analyze the multifractal parameters of microseismic signals (Lopes and Betrouni, 2009; Hirabayashi et al., 1993). Suppose microseismic signal sequence is [xi], and the sequence can be divided into many subsets of length ε (ε < 1), and define the probability distribution of each subset as Pi(ε). If microseismic signal sequence has multifractal characteristics, then the probability distribution function Pi(ε) satisfies Equation 3,Where α is called the singularity index, which controls the singularity of the probability distribution function Pi(ε) and reflects the unevenness of the subset probabilities. If the number of units with the same probability in the subset marked by α is defined as Nα(ε), the smaller the partition scale ε, the more units are obtained, as Equation 4,Where f(α) represents the growth rate of the number of units within the subset α as the partition scale ε decreases.
Currently, statistical physics methods are generally employed to compute multifractal characteristics. Initially, a partition function is defined,Where, τ(q) represents the mass exponent, with -∞ < q < +∞. Theoretically, the larger the value of |q|, the better the multifractal spectrum, and the multifractal spectrum tends to stabilize after |q| reaches a certain value. Therefore, the value of q is defined within a fixed range.
As Equation 5 holds on, τ(q) can be calculated according to the slope of the double logarithmic curve lnXq - lnε, as show in Equation 6.
By applying the Legendre transform to τ(q)-q, Equation 7 can be derived:
The curve composed of parameters α and f(α) is the multifractal spectrum, which can describe the complex state of the microseismic signals. A smaller Δα indicates a more uniform energy distribution of the microseismic signal. Conversely, a larger Δα suggests a more complex energy distribution.
This study focuses on the temporal characteristics of microseismic waveforms. Figure 3 illustrate the dynamic evolution of the multifractal parameter Δα, reflecting the temporal behavior of microseismic sources at the working face. When compared with support resistance data, Δα exhibits a clear upward trend prior to periodic roof weighting events. The larger the pressure range and intensity, the more pronounced the precursor trend. After pressure release, Δα gradually decreases. Notably, the precursor period indicated by Δα is approximately 2–3 days.
FIGURE 3

Microseismic multifractal parameter Δα and maximum support resistance in June 2024.
3.2 Frequency dimension information
Sine and cosine functions constitute a complete set of functions, allowing any periodic function to be represented as a linear combination of these sine and cosine functions. Therefore, for a function f(t) with a period T, it can be expressed in the form of a Fourier series (He et al., 2021; Wang et al., 2024), as Equation 8,Where, an and bn are the coefficients of the sine and cosine functions in f(t), ω is the angular frequency, n is a positive integer, a0/2 represents the average value of f(t).
Based on this, various harmonic components of the signal can be extracted according to Equation 9.Where, S(t) is a continuous-time signal function, e-it is the basis function of the Fourier transform.
Larger-scale coal or rock fractures typically generate microseismic waves with lower main frequencies. As a result, a decline in the main frequency is often interpreted as a sign of increased stress or extensive fracturing within the coal rock. Figure 4 shows the temporal variation in the daily average main frequency of microseismic events at the working face. A clear downward trend in the main frequency is observed before periodic convergence, with the frequency remaining low during sustained pressure and gradually rising after pressure release.
FIGURE 4

Microseismic main frequency and maximum support resistance in June 2024.
3.3 Energy dimension information
In 1941, to precisely delineate the statistical relationship between earthquake magnitude and frequency, Gutenberg and Richter introduced the G-R relationship formula (Scholz, 2015; Smith, 1981), as Equation 10,
Where M represents the magnitude of the seismic source, N denotes the number of earthquake events with a magnitude of MΔM within a specified period. The parameter a indicates the seismic activity level and the statistical time frame, while b is a function that reflects the relationship between the relative magnitude distribution, the strength of the medium, and the stress level. The application of normalization techniques facilitates a more accurate characterization of the variations in the b-value relative to stress levels.
Figure 5 shows the evolution of the microseismic b-value at the working face. Prior to periodic roof weighting, the b-value exhibits a clear downward trend, with the precursor signal becoming more pronounced as the pressure range and intensity increase. Following pressure release, the b-value gradually recovers. Overall, the b-value provides a precursor indication approximately 3–4 days in advance.
FIGURE 5
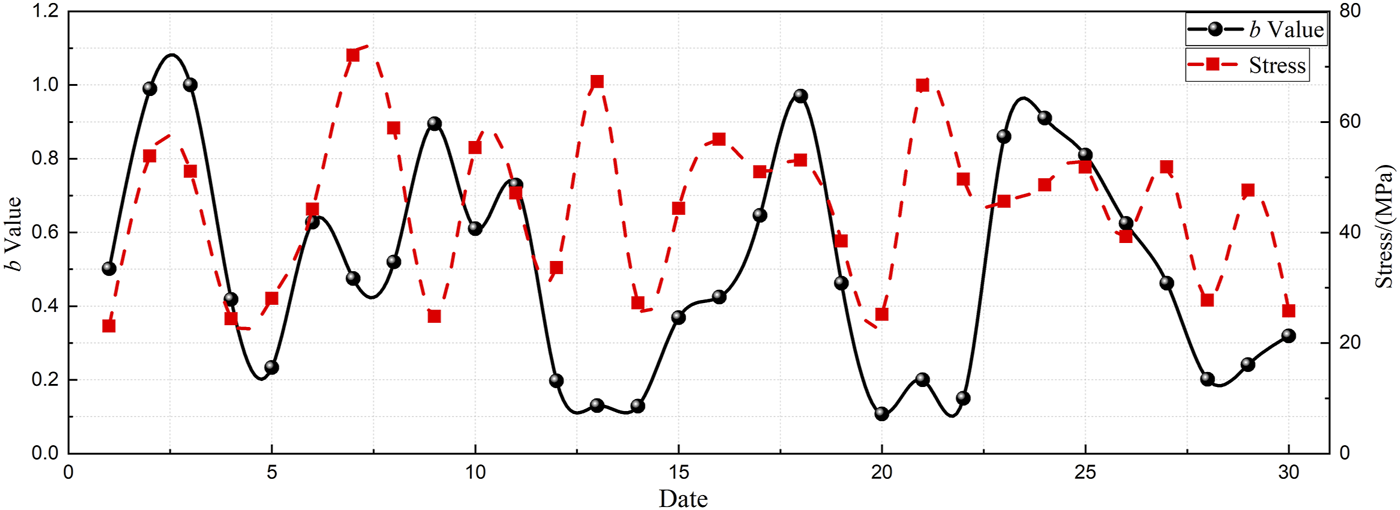
Microseismic b-value and maximum support resistance in June 2024.
3.4 Spatial dimension information
Cluster analysis is a widely utilized method in data analysis, designed primarily to segregate data samples into distinct groups or clusters according to their similarities. This technique finds application across various domains including data mining, market research, bioinformatics, and image processing. In cluster analysis, data samples are treated as points within an n-dimensional space, where n represents the number of features. The method categorizes these samples based on their similarity, which can be quantified using distance metrics such as Euclidean distance, Manhattan distance, or cosine similarity. Samples are then aggregated into clusters, each comprising data points that share similar characteristics.
Assume a microseismic sequence consists of N events. Define a matrix E of size N × N, where each element aij represents the spatiotemporal distance between the ith and jth events in the sequence (Zhang et al., 2017a; Zhang et al., 2017b). The relationship is expressed by Equation 11,Where (xi, yi, zi, ti) and (xj, yj, zj, tj) represent the spatial coordinates and corresponding occurrence times of the ith and jth events, respectively.
For the matrix E, the elements apk (k = 1,2, … ,N; k≠p) in the pth row represent the spatial distances between the pth event and the other events. By comparing each element apk in the pth row, the minimum value is determined. If the minimum value is apw, it indicates that event w is the nearest neighbor to event p, and they should be connected by a single linear link.
To further analyze the spatiotemporal distribution characteristics of source sequences, scholars employ the Weibull distribution to calculate, as shown in Equation 12,
In this section, following the methodology outlined in reference (Zhang et al., 2017a), the spatial correlation length is defined at the point where w(l) = 0.5.
To examine the variation pattern of the spatial correlation length, a sliding event window methodology was employed for the calculations. This method involves capturing all microseismic events occurring on a given day within each window, which then advances by 1 day. The findings are illustrated in Figure 6. It is observed that the spatial correlation length of microseismic events gradually increases 2–3 days prior to the roof weighting and subsequently decreases after roof weighting.
FIGURE 6

Microseismic spatial correlation length and maximum support resistance in June 2024.
4 Research on correlation of microseismic multidimensional information
4.1 Research on the correlation between microseismic multidimensional information and pressure
Correlation analysis is a statistical technique employed to investigate the relationships between random variables and is extensively used in the analysis of random signal patterns. In this section, cross-correlation analysis is particularly useful for examining the relationship between multi-dimensional microseismic information and stress.
Assume there are two random signal time series X(t) and Y(t), the cross-correlation function describes the relationship between series X(t) at any given time t1 and series Y(t) at time t2. Defining τ = t2-t1, the cross-correlation function between X(t) and Y(t) can be expressed as Equation 13,
The correlation coefficient can be defined as Equation 14,Where, E represents the expected value; mx and my are the mean value of X(t) and Y(t), respectively; σx2 and σy2 represent corresponding squared differences. The correlation coefficient, denoted as r, ranges from −1.0 to 1.0. A higher value of r indicates a greater similarity between the two sets of variables.
Building on the theoretical framework, this study systematically analyzes the quantitative correlation between the evolution of microseismic source multi-parameters—spanning time, space, and strength—and pressure development at the working face, as shown in Figure 7. The results reveal that waveform multifractal parameters, main frequency, b-value, and spatial correlation length are all related to the maximum support resistance. Among them, the main frequency shows a relatively weak correlation, while the multifractal parameters display a strong correlation. Both the b-value and the spatial correlation length are highly correlated with the maximum support resistance at the working face.
FIGURE 7

Correlation relationship between microseismic multidimensional information and pressure in June 2024. (The color blue indicates the correlation coefficient for multifractal parameters; black represents the correlation coefficient for the dominant frequency of microseismic waveforms; green denotes the correlation coefficient for the b-value; and red signifies the correlation coefficient for the spatial correlation length.).
4.2 Research on long range correlation between multi-dimensional microseismic information and pressure
Correlation analysis primarily evaluates the linear relationship between two variables on the same time scale, often using measures like the Pearson correlation coefficient to indicate the strength and direction of their association. This method reflects short-term, immediate interactions. In contrast, long-term correlation analysis examines the dependence and memory effects within or between time series over extended periods. Techniques such as the Hurst exponent are commonly used to determine whether a system exhibits persistence, trends, or long-range influence. While correlation analysis emphasizes whether variables change in sync at a given moment, long-term correlation analysis focuses on whether past states continue to influence future behavior. Combining both approaches provides a more comprehensive understanding of a system’s short-term dynamics and long-term evolutionary patterns.
In this section, the Rescaled Range Analysis method (R/S) is utilized to explore the long-term correlation between microseismic information and pressure. This method allows for a detailed assessment of the persistence or memory of the time series data related to microseismic events. The time recording sequence of multi-dimensional microseismic information, is defined as Equation 15:
“In this analysis, the time sequence is segmented into A continuous subintervals, each with a length of n, where n represents the chosen scale for analysis. The entire sequence is divided such that each segment conforms to this length, although the final subinterval may be shorter than n if the total sequence length is not a perfect multiple of n. Each subinterval is denoted by Φa, where a = 1, 2, … , A. Within each subinterval Φa, individual data points are represented as Rk, a, where k = 1, … , n and a = 1, … , A.
Use X (k, a) to represent the cumulative difference within a subinterval, as Equation 16,
Use SΦa to represent the standard deviation and use it to re-scale the range, as Equation 17,
Therefore, for the partition interval length n, the rescaled range of the average for subinterval A can be calculated as Equation 18,
The empirical relationship analyzed by Hurst is expressed as Equation 19,
By repeating the above calculation process for different partition lengths nnn, multiple mean rescaled ranges can be obtained. When the Hurst exponent H = 0.5, it suggests that past increments have no correlation with future increments—an attribute of standard Brownian motion, which is a purely random process with independent increments. Based on this theoretical foundation, the study systematically analyzes the quantitative correlation between the evolution of time-space-strength multi-parameters of microseismic sources and pressure development at the working face, as illustrated in Figure 8.
FIGURE 8

Long-range correlation between microseismic multidimensional information and pressure in June 2024. (The color blue indicates the Hurst index for multifractal parameters; black represents the Hurst index for the dominant frequency of microseismic waveforms; green denotes the Hurst index for the b-value; and red signifies the Hurst index for the spatial correlation length.).
5 Conclusion
The analysis reveals that several microseismic parameters exhibit clear precursor trends before roof weighting. The multifractal parameter Δα shows a distinct upward trend 2–3 days prior to pressure events, with stronger pressure and wider ranges enhancing this trend, and gradually decreases after pressure release. Similarly, the microseismic main frequency decreases before roof weighting, remains low during high-pressure periods, and increases post-release. The b-value also declines noticeably 3–4 days in advance, with greater pressure amplifying the trend, and recovers gradually afterward. The spatial correlation length increases before roof weighting, particularly under stronger pressure conditions, and decreases following release, with a precursor period of about 2–3 days. Overall, Δα, main frequency, b-value, and spatial correlation length are all correlated with working face pressure, among which the main frequency shows a weak correlation, while Δα and other parameters demonstrate strong and long-range correlations.
Statements
Data availability statement
The raw data supporting the conclusions of this article will be made available by the authors, without undue reservation.
Author contributions
CG: Conceptualization, Data curation, Project administration, Writing – review and editing, Investigation, Writing – original draft, Resources, Visualization. HL: Supervision, Formal Analysis, Writing – review and editing, Conceptualization, Methodology, Validation. JS: Methodology, Data curation, Software, Writing – original draft.
Funding
The author(s) declare that no financial support was received for the research and/or publication of this article.
Conflict of interest
Author CG was employed by Production Department of Shanxi Lu’an Environmental Energy Dev. Co., Ltd.
The remaining authors declare that the research was conducted in the absence of any commercial or financial relationships that could be construed as a potential conflict of interest.
Generative AI statement
The author(s) declare that no Generative AI was used in the creation of this manuscript.
Publisher’s note
All claims expressed in this article are solely those of the authors and do not necessarily represent those of their affiliated organizations, or those of the publisher, the editors and the reviewers. Any product that may be evaluated in this article, or claim that may be made by its manufacturer, is not guaranteed or endorsed by the publisher.
References
1
Adoko A. C. Gokceoglu C. Wu L. Zuo Q. J. (2013). Knowledge-based and data-driven fuzzy modeling for rockburst prediction. Int. J. Rock Mech. Min. Sci.61, 86–95. 10.1016/j.ijrmms.2013.02.010
2
Askaripour M. Saeidi A. Rouleau A. Mercier-Langevin P. (2022). Rockburst in underground excavations: a review of mechanism, classification, and prediction methods. Undergr. Space7, 577–607. 10.1016/j.undsp.2021.11.008
3
Cai W. Li D. Si G. Cao A. Gong S. Yuan S. (2019). A new seismic-based strain energy methodology for coal burst forecasting in underground coal mines. Int. J. Rock Mech. Min. Sci.123, 104086. 10.1016/j.ijrmms.2019.104086
4
Ding K. Wang L. Yu M. Wang W. Ren B. (2020). Study on microseismic monitoring, early warning, and comprehensive prevention of a rock burst under complex conditions. Shock Vib.2020, 1–12. 10.1155/2020/8863771
5
Dou L. Cai W. Cao A. Guo W. (2018). Comprehensive early warning of rock burst utilizing microseismic multi-parameter indices. Int. J. Min. Sci. Technol.28, 767–774. 10.1016/j.ijmst.2018.08.007
6
Feng X.-T. Yu Y. Feng G.-L. Xiao Y.-X. Chen B. Jiang Q. (2016). Fractal behaviour of the microseismic energy associated with immediate rockbursts in deep, hard rock tunnels. Tunn. Undergr. Space Technol.51, 98–107. 10.1016/j.tust.2015.10.002
7
Frid V. (1997). Rockburst hazard forecast by electromagnetic radiation excited by rock fracture. Rock Mech. Rock Eng.30, 229–236. 10.1007/bf01045719
8
Fujii Y. Ishijima Y. Deguchi G. (1997). Prediction of coal face rockbursts and microseismicity in deep longwall coal mining. Int. J. Rock Mech. Min. Sci.34, 85–96. 10.1016/s1365-1609(97)80035-4
9
Gong F. He Z. Si X. (2022). Experimental study on revealing the mechanism of rockburst prevention by drilling pressure relief: status-of-the-art and prospects. Geomat. Nat. Hazards Risk13, 2442–2470. 10.1080/19475705.2022.2121227
10
He J. Dou L. Gong S. Li J. Ma Z. (2017). Rock burst assessment and prediction by dynamic and static stress analysis based on micro-seismic monitoring. Int. J. Rock Mech. Min. Sci.93, 46–53. 10.1016/j.ijrmms.2017.01.005
11
He Y. Chen H. Liu D. Zhang L. (2021). A framework of structural damage detection for civil structures using fast fourier transform and deep convolutional neural networks. Appl. Sci.11, 9345. 10.3390/app11199345
12
Hirabayashi T. Ito K. Yoshii T. (1993). Multifractal analysis of earthquakes. Pure Appl. Geophys.138, 591–610. 10.1007/bf00876340
13
Hu X. Su G. Chen G.-Y. Mei S. Feng X.-T. Mei G. et al (2019). Experiment on rockburst process of borehole and its acoustic emission characteristics. Int. J. Min. Sci. Technol.52, 783–802. 10.1007/s00603-018-1613-z
14
Jin A. Basnet P. M. S. Mahtab S. (2022). Microseismicity-based short-term rockburst prediction using non-linear support vector machine. Acta Geophys.70, 1717–1736. 10.1007/s11600-022-00817-4
15
Kong X. Zhan M. Lin H. Cai Y. Ji P. He D. et al (2024). Time-varying characteristics of acoustic emission and fractals based on information dimension during structural failure of coal subjected to uniaxial compression. Measurement236, 115088. 10.1016/j.measurement.2024.115088
16
Li N. Chen D. Wang E. (2020). Study on the characteristics of microseismic wave field of complex medium model in coal mine. Arab. J. Geosci.13, 1111–1113. 10.1007/s12517-020-06063-6
17
Li S. He D. Kong X. Lin H. Ma Y. Li X. et al (2024). Relationship between micro-pores fractal characteristics about NMR T2 spectra and macro cracks fractal laws based on box dimension method of coal under impact load from energy dissipation theory. Chaos, Solit. and Fractals189, 115685. 10.1016/j.chaos.2024.115685
18
Li Z. Wang E. He M. (2015). Laboratory studies of electric current generated during fracture of coal and rock in rock burst coal mine. J. Min.2015, 1–9. 10.1155/2015/235636
19
Liang W. Sari A. Zhao G. McKinnon S. D. Wu H. (2020). Short-term rockburst risk prediction using ensemble learning methods. Nat. Hazards104, 1923–1946. 10.1007/s11069-020-04255-7
20
Lopes R. Betrouni N. (2009). Fractal and multifractal analysis: a review. Med. Image Anal.13, 634–649. 10.1016/j.media.2009.05.003
21
Ma T.-H. Tang C.-A. Tang S.-B. Kuang L. Yu Q. Kong D.-Q. et al (2018). Rockburst mechanism and prediction based on microseismic monitoring. Int. J. Rock Mech. Min. Sci.110, 177–188. 10.1016/j.ijrmms.2018.07.016
22
Scholz C. H. (2015). On the stress dependence of the earthquakebvalue. Geophys. Res. Lett.42, 1399–1402. 10.1002/2014gl062863
23
Smith W. D. (1981). The b-value as an earthquake precursor. Nature289, 136–139. 10.1038/289136a0
24
Song Y. Wang E. Yang H. Liu C. Li B. Chen D. (2024). Microseismic source location using deep learning: a coal mine case study in China. J. Rock Mech. Geotech. Eng.16, 3407–3418. 10.1016/j.jrmge.2024.02.014
25
Srinivasan C. Arora S. K. Benady S. (1999). Precursory monitoring of impending rockbursts in Kolar gold mines from microseismic emissions at deeper levels. Int. J. Rock Mech. Min. Sci.36, 941–948. 10.1016/s0148-9062(99)00048-0
26
Su G. Zhao G. Jiang J. Hu X. (2021). Experimental study on the characteristics of microseismic signals generated during granite rockburst events. Bull. Eng. Geol. Environ.80, 6023–6045. 10.1007/s10064-021-02295-2
27
Wang G. Gong S. Dou L. Wang H. Cai W. Cao A. (2018). Rockburst characteristics in syncline regions and microseismic precursors based on energy density clouds. Tunn. Undergr. Space Technol.81, 83–93. 10.1016/j.tust.2018.06.026
28
Wang S. Tian R. Zhang Q. Kang Z. Tang X. (2024). The application of trajectory analysis method and Fast Fourier Transform analysis method in the division of flow instability influence regions under ocean conditions. Prog. Nucl. Energy168, 105045. 10.1016/j.pnucene.2023.105045
29
Wu S. Wu Z. Zhang C.-X. (2019). Rock burst prediction probability model based on case analysis. Tunn. Undergr. Space Technol.93, 103069. 10.1016/j.tust.2019.103069
30
Xu X. Dou L. Lu C. Zhang Y. (2010). Frequency spectrum analysis on micro-seismic signal of rock bursts induced by dynamic disturbance. Int. J. Min. Sci. Technol. (China)20, 682–685. 10.1016/s1674-5264(09)60262-3
31
Yu Q. Zhao D. Xia Y. Jin S. Zheng J. Meng Q. et al (2022). Multivariate early warning method for rockburst monitoring based on microseismic activity characteristics. Front. Earth Sci.10, 837333. 10.3389/feart.2022.837333
32
Zhang C. Jin G. Liu C. Li S. Xue J. Cheng R. et al (2021a). Prediction of rockbursts in a typical island working face of a coal mine through microseismic monitoring technology. Tunn. Undergr. Space Technol.113, 103972. 10.1016/j.tust.2021.103972
33
Zhang H. Zeng J. Ma J. Fang Y. Ma C. Yao Z. et al (2021b). Time series prediction of microseismic multi-parameter related to rockburst based on deep learning. Rock Mech. Rock Eng.54, 6299–6321. 10.1007/s00603-021-02614-9
34
Zhang Z. Liu X. Zhang Y. Qin X. Khan M. (2021c). Comparative study on fracture characteristics of coal and rock samples based on acoustic emission technology. Theor. Appl. Fract. Mech.111, 102851. 10.1016/j.tafmec.2020.102851
35
Zhang Z. Wang E. Li N. (2017a). Fractal characteristics of acoustic emission events based on single-link cluster method during uniaxial loading of rock. Chaos Solit. Fractals104, 298–306. 10.1016/j.chaos.2017.08.028
36
Zhang Z. Wang E. Li N. (2017b). Temporal and spatial characteristics of coal-mine microseism based on single-link cluster. Geosci. J.21, 223–233. 10.1007/s12303-016-0038-5
37
Zhang Z. Wang E. Zhang H. Bai Z. Zhang Y. Chen X. (2023). Research on nonlinear variation of elastic wave velocity dispersion characteristic in limestone dynamic fracture process. Fractals31 (01), 2350008. 10.1142/s0218348x23500081
38
Zhao H. Chen B. Zhu C. (2021). Decision tree model for rockburst prediction based on microseismic monitoring. Adv. Civ. Eng.2021, 1–14. 10.1155/2021/8818052
39
Zhao Y. Wang H. Liu S. Mu Z. Lu Z. (2018). Dynamic failure risk of coal pillar formed by irregular shape longwall face: a case study. Int. J. Min. Sci. Technol.28, 775–781. 10.1016/j.ijmst.2018.08.006
Summary
Keywords
microseismic activity, multidimensional information, evolution characteristics, correlation relationship, coal mine
Citation
Guo C, Li H and Sun J (2025) Research on evolution characteristics and correlation relationship of microseismic multidimensional information in mining process. Front. Earth Sci. 13:1612720. doi: 10.3389/feart.2025.1612720
Received
16 April 2025
Accepted
14 May 2025
Published
11 June 2025
Volume
13 - 2025
Edited by
Xiangguo Kong, Xi’an University of Science and Technology, China
Reviewed by
Dong Chen, China University of Mining and Technology, China
Guansheng Qi, Shandong University of Science and Technology, China
Updates
Copyright
© 2025 Guo, Li and Sun.
This is an open-access article distributed under the terms of the Creative Commons Attribution License (CC BY). The use, distribution or reproduction in other forums is permitted, provided the original author(s) and the copyright owner(s) are credited and that the original publication in this journal is cited, in accordance with accepted academic practice. No use, distribution or reproduction is permitted which does not comply with these terms.
*Correspondence: Haotian Li, lht0404@126.com
Disclaimer
All claims expressed in this article are solely those of the authors and do not necessarily represent those of their affiliated organizations, or those of the publisher, the editors and the reviewers. Any product that may be evaluated in this article or claim that may be made by its manufacturer is not guaranteed or endorsed by the publisher.