 Mingming Duan1,2*
 Dan Luo3*
- 1College of Landscape Architecture and Art, Jiangxi Agricultural University, Nanchang, China
- 2College of Tourism and Sport Health, Hezhou University, Hezhou, China
- 3School of Accounting, Guangdong Technology College, Zhaoqing, China
Understanding the interaction between blue-green space stability (BGSS) and environmental pressures (EPs) is critical for urban ecological resilience. This study developed blue-green space stability index (BGSSI) and environmental pressure indexes (EPIs) to explore their coupling coordination and spatial heterogeneity across four spatial scales (1 km, 5 km, 10 km grids, and administrative districts) in Nanchang City, China. We integrated local bivariate Moran’s I, spatial regression, and a Coupling Coordination Degree Model (CCDM) to evaluate their spatial relationships. Results show that: 1) The distribution of EPIs and BGSSI exhibits spatial heterogeneity, with high pressure and low stability in the central part of the city, while in contrast, mountainous and forest areas in the suburbs had low pressure and high stability. 2) The spatial clustering results of EPIs and BGSSI indicated that the blue space represents low-low clusters as ecologically sensitive areas, the middle of the city represented high-low clusters as ecologically dangerous areas, and the green space represented low-high clusters as important ecological protection areas. The spatial regression indicated that EPIs were negatively correlated with BGSSI, and spatial autocorrelation and spatial spillover effects were observed between them, economic and population pressures have lower coefficients than other factors. 3) EPIs and BGSSI exhibited three stages and nine types of coordinated coupling relationships. As the grid expands, the proportion of Running-in stage (RS) increases, while the proportion of Coordination stage (CS) decreases. Our multiscale analysis reveals the bidirectional, scale-sensitive nature of EPs–BGSS interactions and provides a methodological framework to guide differentiated ecological planning and spatial governance.
1 Introduction
Blue-green space (BGS), comprising natural and semi-natural ecosystems such as rivers, lakes, wetlands, forests, and grasslands (Gómez-Baggethun and Barton, 2013; Veerkamp et al., 2021), plays a vital role in maintaining urban ecological stability (de Macedo et al., 2021). It supports a wide array of ecosystem services, including air purification (Fan et al., 2022), urban heat mitigation (Li, Stringer, and Dallimer, 2022; Pan et al., 2023), flood regulation (Baker et al., 2019), biodiversity conservation (Donati et al., 2022), and enhancement of human wellbeing (Wu, Luo, and Tang, 2019). However, accelerated urbanization and land-use intensification have led to severe fragmentation, degradation, and uneven spatial distribution of BGS, particularly in rapidly developing cities (Liu et al., 2020; Albert et al., 2020). These changes threaten the structural and functional integrity of BGS and compromise its long-term ecological performance.
Landscape stability (LS), defined as the ability of ecosystems to maintain structural and functional integrity under external disturbances, is a key metric for assessing ecosystem resilience (Prokopová et al., 2019; Fu et al., 2013). The concept of blue-green space stability (BGSS) extends this framework to urban landscapes, emphasizing their robustness in the face of ecological stressors such as pollution, population pressure, and climate change (Sun et al., 2023; Zhang et al., 2024). Although LS has been studied in forests (Huang et al., 2021), mountainous regions (Zhang and Wang, 2022), and wetlands (Świerkosz et al., 2014), studies specifically focusing on BGSS remain limited. Nowadays, landscape pattern indices are commonly used to evaluate landscape stability, but these indicators are often limited to structural description or single dimensional evaluation, failing to capture the comprehensive resilience of BGS ecosystems to various disturbances such as pollution, heat stress, and urban expansion. We propose the Blue-green space stability index (BGSSI) as a novel and integrative metric. It builds upon the conceptual foundation of landscape ecological risk, the index provides a quantitative representation of the capacity of BGS to maintain structural and functional integrity under stress.
Environmental pressures (EPs)—including land use change (Zhou et al., 2020), population and economic concentration (Wang et al., 2020c), air pollution, and increasing temperatures (Zhou et al., 2014) are widely recognized as key drivers of BGS degradation (Yu et al., 2018). Yet, the relationship between BGSS and EPs is often bidirectional and dynamic. While EPs degrade LS, BGS can in turn mitigate these pressures, forming a complex feedback system (Fletcher et al., 2021; Shen et al., 2021). A nuanced understanding of their spatial coupling and coordination is therefore essential for informing sustainable urban development.
The coupling coordination degree model (CCDM) is widely used to evaluate interactions between complex systems and identify constraints on regional development (Zhang et al., 2023). Previous applications include analyses of economic development and ecological environments (Cai et al., 2021), and urbanization coupled with ecosystem service value (Guo et al., 2022). This model can therefore be effectively applied to assess the coordination between BGSS and EPs. In the context of BGSS and EPs, this model provides a structured approach to measure the degree of synchronization and mutual reinforcement between ecological integrity and anthropogenic stressors.
Considering these challenges, multiscale analysis offers a powerful methodological framework to explore the spatial heterogeneity (Nicolè et al., 2011) and scale-sensitive interactions between BGSS and EPs. Research has shown that the distribution and ecological functioning of BGS are highly dependent on spatial resolution, with varying clustering patterns, regression behaviors, and coupling mechanisms at different scales (Bai et al., 2020; Felipe-Lucia, Comín, and Bennett, 2014; Lu et al., 2025). Fine-scale grids (e.g., 1 km) enable precise detection of localized ecological degradation, while coarser scales (e.g., 10 km or administrative districts) reveal broader spatial trends and policy-relevant dynamics. Moreover, a multiscale approach helps mitigate the Modifiable Areal Unit Problem (MAUP), a spatial statistical bias arbitrary unit selection in geographic analysis (Anselin, 1995).
Accordingly, this study selected four representative spatial scales—1 km, 5 km, 10 km grid, and administrative district level to comprehensively examine the spatial interaction and coordination between BGSSI and environmental pressure indexes (EPIs). These scales were chosen to reflect nested levels of spatial analysis: from micro-level ecological responses to macro-level governance frameworks. The multiscale design enables the assessment of both fine-grained ecological risks and large-scale spatial trends, enhancing the robustness and applicability of findings in ecological planning and urban management (Zhang et al., 2024; Turner et al., 1993).
Nanchang, a rapidly urbanizing city in southeast China, serves as an ideal case study. With an urbanization rate increasing from 50.55% in 2014 to 78.08% in 2020, and reaches 79.09% in 2024, the city faces severe challenges such as fragmented BGS, rising pollution levels, and extreme weather events. This study aims to: 1) evaluate the spatial distribution of BGSSI and EPIs across multiple scales; 2) analyze their spatial autocorrelation and interaction mechanisms; and 3) examine the coupling coordination patterns between them. By revealing the spatial dynamics of BGSS and EPs, we seek to provide insights for targeted ecological restoration and adaptive policy-making under a multiscale governance framework.
2 Materials and methods
2.1 Study area
Nanchang (115°27′-116°11′E, 28°09′-29°11′N), located in East China, is the capital city of Jiangxi Province (Figure 1), covering a land area of 7,194.98 km2, administratively, it contains nine districts. Nanchang is characterized by predominantly flat terrain in the southeast and rolling hills in the northwest. The city experiences a subtropical monsoon climate, with an average annual temperature of 19.7°C and an annual precipitation of 1962.8 mm.
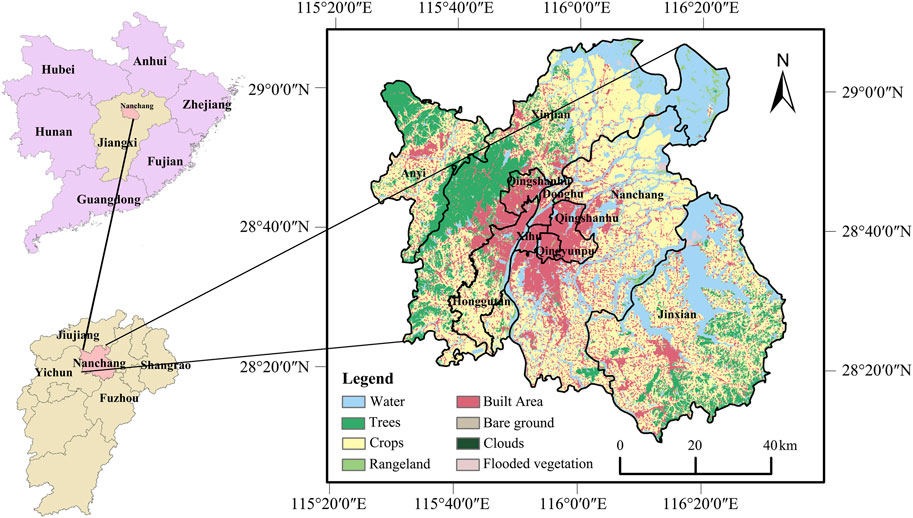
Figure 1. Location and Land Use/Land Cover of the study area.
Nanchang is abundant in BGS, with nearly 43% urban green coverage and almost 30% water area. In 2022, it was recognized as an international wetland city. However, the distribution of BGS is highly uneven, with significant concentrations in the city’s outskirts. Among them, major blue spaces include the Nanji Wetland National Nature Reserve, Poyang Lake National Nature Reserve in the northeast, and Jinxi Lake and Junshan Lake in the center and east. Forests are mainly concentrated in the northwest and southeast.
As land use changes and climate change intensify, external environmental pressures become more prominent, resulting in a decline in BGSS and a reduction in ecosystem services. Therefore, it is crucial for sustainable urban development to assess the current level of BGS stability in relation to the coordination of EPs.
2.2 Data sources
The data used for the study included land use, population, Gross Domestic Product (GDP), nighttime lighting (NL), annual average PM2.5 (PM2.5), monthly average temperature (MAT), Digital Elevation Model (DEM), slope, and detailed information on the data sources are provided in Table 1. All spatial data were resampled to a 50 × 50 m raster in ArcGIS 10.2 (ESRI, Redlands, CA, United States) and the coordinate system was standardized.
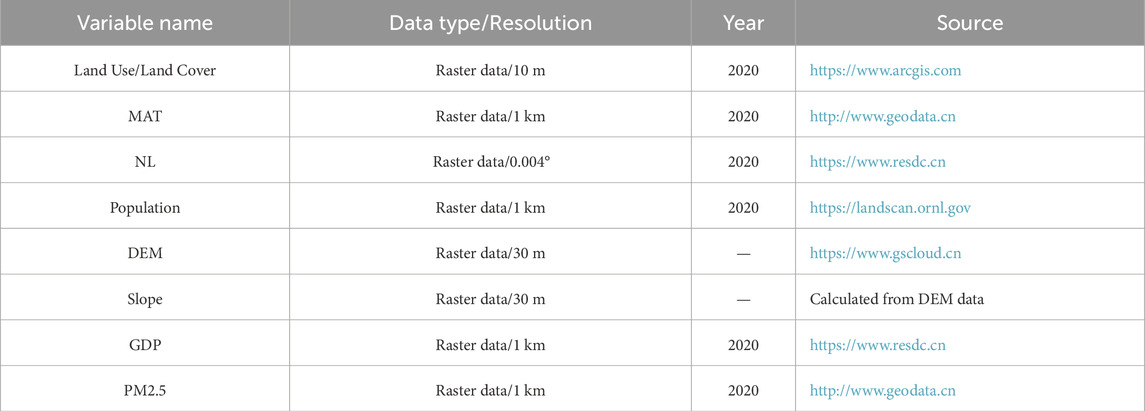
Table 1. The data sources in this study.
2.3 Data processing
2.3.1 Calculation of BGSSI
LS indicates the capacity and degree of a landscape to maintain its structural stability and functional integrity in the face of potential disturbances (Turner et al., 1993). BGSS was quantified by the reciprocal of landscape ecological risk, meaning that higher ecological risk corresponds to weaker BGSS, the calculation of landscape ecological risk index refers to existing research (Cao et al., 2023; Li et al., 2021), while lower ecological risk indicates stronger BGSS. The BGSSI was derived using the range method (Equations 1–3).
where
where
where
2.3.2 Calculation of EPIs
Population, GDP, NL, mean summer temperature (MST, Calculated from MAT), PM2.5, DEM, and slope data were selected as EPs, and standardize the data to obtain nighttime lighting index (NLI), gross domestic product index (GDPI), population index (POPI), annual average PM2.5 index (PMI), mean summer temperature index (MSTI), digital elevation model index (DEMI), slope index (SLI) (Equations 4–6), then use these EPIs to build comprehensive environmental pressure index (CEPI) by the CRITIC method (Equations 7, 8). Although DEM and slope are not direct human pressures, they are considered terrain improvers, reflecting the limitations of terrain on urban expansion and ecological restoration. For example, terrain features such as slope and elevation significantly influence urban planning suitability and expansion potential (He et al., 2023). Generally, the lower the DEM and the gentler the slope, the easier it is for humans to alter the natural environment and landscape. This facilitates anthropogenic land transformation and thus increases pressure on the natural landscape (Zhang et al., 2021). Therefore, in this article, DEM and SLE are also defined as EPs.
To reduce the impact of data level difference, the logarithm of the original data is first taken, and Min-max normalization was used to standardize each factor, Finally, the value range of EPI is between [0,1].
when
when
where
The CRITIC method is an objective weighting method that provides more objective weighting coefficients and is widely used in the field of environment (Krishnan, 2024). The calculation formula is as follows.
where
Finally, the comprehensive pressure index is calculated:
2.3.3 Bivariate spatial autocorrelation model
The spatial autocorrelation model determines the distribution and clustering patterns of variables in space (Anselin, 1995). The Global Spatial Autocorrelation model was used to analyze the spatial correlation between each EPI and BGSSI (Equation 9). The Moran’s I was between [-1,1]. When Moran’s I > 0, the spatial correlation between variables was positive, showing spatial clustering characteristics. When Moran’s I < 0, there is a negative correlation between variables, indicating that there is spatial separation. Once Moran’s I = 0, there seems to be no spatial correlation, indicating a random distribution.
where
The bivariate local Moran’s index was used to measure the spatial agglomeration degree of pressure factors and BGSSI (Equation 10).
where
2.3.4 Spatial regression
The impact of EPs on BGS is often influenced by the surrounding space, so its spational effects cannot be ignored. The spatial effect econometric regression models mainly include spatial lag model (SLM) and spatial error model (SEM) (Wang et al., 2018; Weixiang et al., 2022), the expression of SLM is Formula 11, and SEM is Formula 12. This article uses the classic OLS regression to compare the significance of Lagrange multiplier (LM), and determines the final model based on the significance and value of LM and Robust-LM.
where Y is the dependent variable, X is the independent variable, α is a constant term, β is the estimated parameter, λ is the spatial autocorrelation coefficient, W is an n × n weight matrix, μ is a spatial error term, ε is a random error term.
where Y is the dependent variable, X is the independent variable, ρ is a parameter of spatial autoregressive coefficient, which is affected by W matrix, W is an n × n weight matrix, y is the spatial lag term, β is the estimated parameter, ε is a random error term.
2.3.5 Coupling coordination degree model
The CCDM served as a valuable tool for assessing and quantifying the dynamic interaction and influence relationship between EPIs and BGSSI (Table 2), and the model is as follows (Equation 13):
where D denotes the level of coupling coordination between EPIs and BGSSI, while C represents their coupling degree, and T signifies their coordination level, K1 is the EPI, K2 is the BGSSI, a and b are undetermined coefficients, As BGS and EPs are equally weighted in CCDM, a = b = 0.5 (Baoping and Gong, 2022).
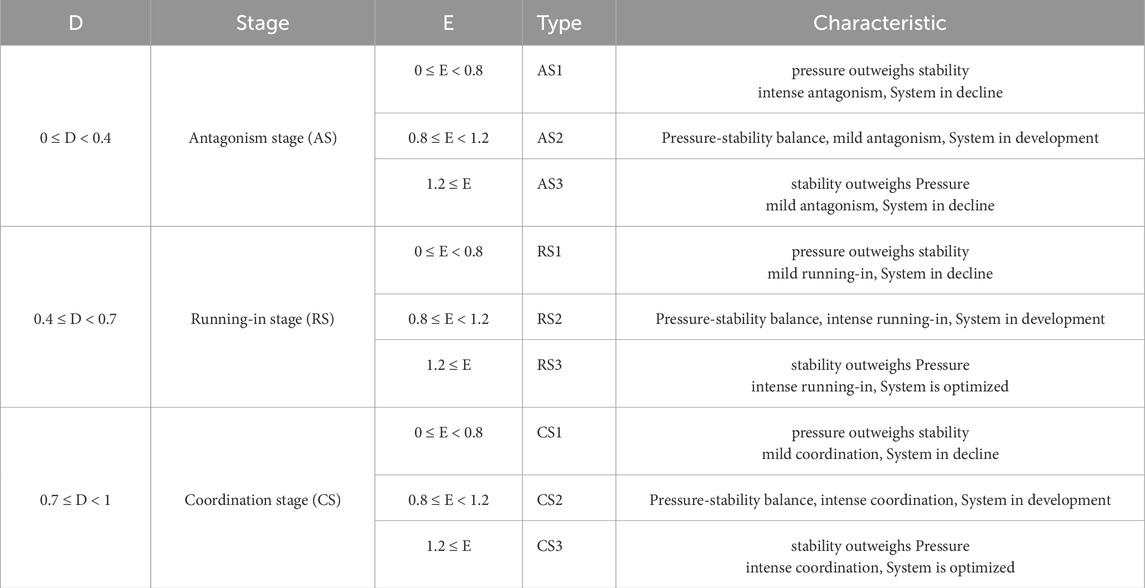
Table 2. Classification and characteristics of coupling coordination.
Introducing a relative developmental degree model (Equation 14) to judge the relative developmental relationship between pressure systems and landscape stability systems (Yuchun and Zhang, 2023).
where E represents the relative development degree,
3 Results
3.1 Basic characteristics of BGSSI and EPIs
Figure 2 displays the spatial distribution of eight EPIs and BGSSI at different scales, revealing distinct spatial variations. As the grid gets larger, smaller-scale differences decrease and tend to cluster and evenly distribute. The distribution of various pressure indices has both differences and similarities, at the grid scale, NLI, GDPI, POPI, PMI, and CEPI gradually decrease from the city center to the suburbs, but the degree of diffusion and details vary, medium-high levels of NLI and CEPI are concentrated in the center, while GDPI is in the east and south, and PMI is in the east and northeast. From south to north, MSTI shows a change from high to low, the DEMI and SLI in the central and eastern parts of the city are higher than those in other parts. On the administrative scale, Anyi County and Xinjian District in the northwest of the city, as well as Jinxian County in the southeast, have lower NLI, GDPI, population, PMI, and CEPI, while Xihu District in the central region had the highest. The MSTI shows that Jinxian County is at a high level and Anyi County is at a low level. DEMI and slope are at high levels in Anyi and Xinjian Districts, while Nanchang County is at a relatively low level.
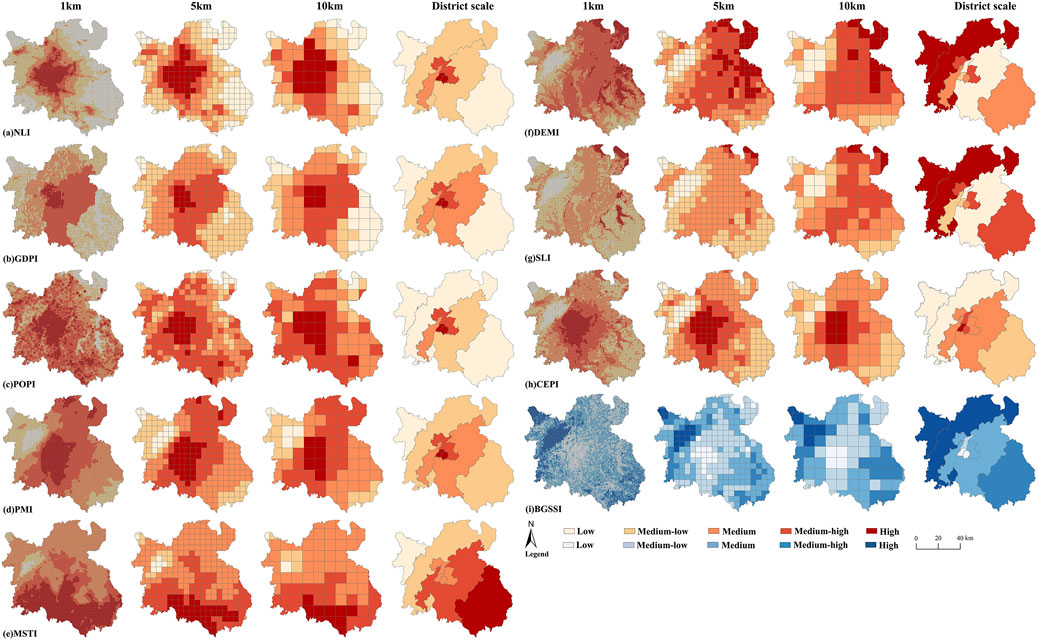
Figure 2. Spatial distribution of EPIs and BGSSI.
The central part of the city represents a typical area with low BGSS values due to its dense urban development and fragmented BGS distribution within built-up land. In contrast, the northeastern part of the city features extensive BGS, primarily composed of lakes and wetlands. This region includes the Jiangxi Poyang Lake Nanji Wetland National Nature Reserve and Jiangxi Poyang Lake National Nature Reserve, which are important ecological sources and ecologically sensitive areas. These areas were susceptible to external environmental interference, resulting in predominantly medium-low levels of BGSSI. At the administrative scale, Anyi County and Xinjian District in the northwest region exhibited the highest BGSSI, while Xihu District and Qingyunpu District displayed the weakest stability in the center.
At the grid scale, the majority and minority of index levels remain consistent, while their specific proportions fluctuate (Figure 3). POPI and PMI are mainly distributed at medium-high levels. The proportion of POPI across the 1 km, 5 km, and 10 km scales is 38.90%, 38.83%, and 39.39%, respectively, while PMI is distributed as 37.33%, 35.88%, and 36.36%. Medium is the main class of MSTI, CEPI, and BGSSI, and the scale changes from small to large, with the MSTI increasing from 45.75% to 51.52%, CEPI rising from 35.57% to 44.44%, and BGSSI decreasing from 42.11% to 32.32%. At 1 km scale NLI and GDPI are dominated by Low level, with proportions of 38.23% and 35.09%, respectively, while 5 km scale and 10 km scale are in medium-low level, the percentage of NLI was 31.64%,31.31% and GDPI was 40.96%,25.25%. In 1 km and 5 km grid DEMI were concentrated in medium-high with 44.50% and 37.29%, meanwhile, 10 km was clustered in low with 75.76%. At the 1 km scale, medium-low level is the majority of SLI, its proportion is 43.11%, 5 km, 10 km scale medium occupies the main position, the proportion separately is 53.95%, 42.42%. At the administrative scale, MSTI, DEMI, CEPI, and BGSSI are mostly distributed at medium levels, with MSTI accounting for 44.44% and the other indices at 33.33%. POPI is concentrated at low levels, representing 33.33%.
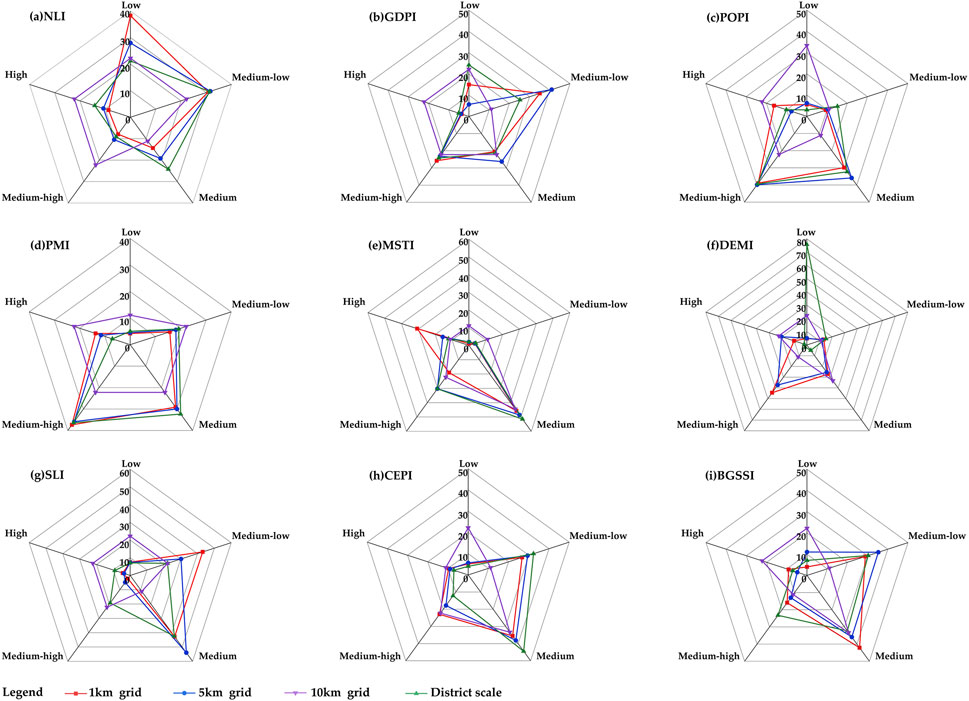
Figure 3. The Proportion of EPIs and BGSSI levels at four scales.
3.2 Spatial correlation between EPIs and BGSSI
Figure 4 displays the bivariate local Moran’s I relationship between EPIs and BGSSI at four scales. NLI, GDPI, POPI, PMI, MSTI, CEPI consistently exhibited negative spatial correlation with BGSSI across all scales, while DEMI and SLI are either negatively related to the BGSSI at the grid scale but positively correlated at the zonal scale. As the scale enlarged, Moran’s index between NLI, GDPI, POPI, PMI, CEPI and BGSSI become larger, while the spatial clustering effect between them decreases. Among the scales studied, PMI, MSTI, DEMI, SLI, CEPI are more strongly spatially correlated with BGSSI, and the spatial clustering effects of NLI, GDPI, POPI are weaker, BGSSI had the strongest correlation with PMI and the weakest association with POPI.
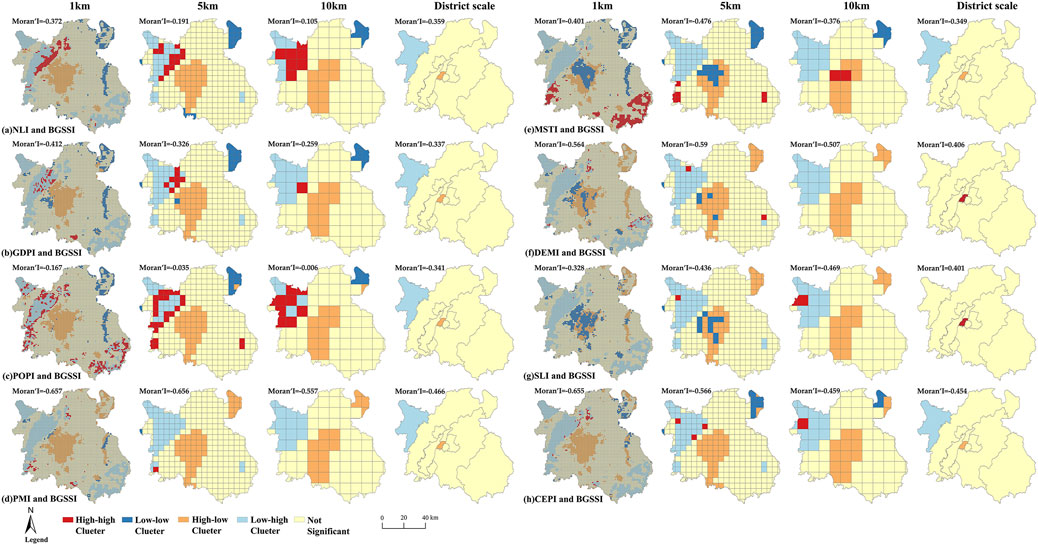
Figure 4. Spatial map of association between EPIs and BGSSI at four scales.
The spatial relationship between EPIs and BGSSI is depicted in Figure 4 across multiple scales, revealing consistent distribution patterns. The Low-high synergy areas for EPIs and BGSSI were mainly located in the northwestern mountain woodlands, and the high-low are clustered primarily in the central built-up areas, meanwhile, the Low-Low types of MSTI, DEMI, SLI, and BGSSI were also concentrated in the central part of the city. Poyang Lake in the northeast and Junshan Lake in the east were both major low-low clusters of NLI, GDPI, POPI, MSTI, and BGSSI, as well as high-low clusters of PMI, DEMI, SLI, and BGSSI. The northwestern and southeastern sections of the city were the centralized areas for the high-high synergy areas for EPIs and BGSSI.
At both the grid and regional scales, the spatial distribution of NLI, GDPI, POPI, PMI, and BGSSI exhibited distinct high-low and low-high clustering. The former was concentrated in the city center, while the latter was observed in the northwest. Conversely, the spatial relationship between DEMI, SLI, and BGSSI indices demonstrated predominant high-high and low-low clustering. The former was prominent in the northwestern region, while the latter was concentrated in the central part of the city. In the northeastern area, EPIs and BGSSI generally exhibited low clustering, whereas PMI showed high-low clustering.
The spatial clustering patterns also reflect the city’s planning intentions. The clustering of high-pressure and low-stability areas in the urban center corresponds to key development zones in Nanchang’s land-use planning. For example, the clustering patterns in Xihu and Donghu Districts are closely related to the city’s focus on commercial and administrative expansion, while peripheral low-pressure and high-stability clusters, such as in Anyi and Jinxian, are consistent with designated ecological conservation and agriculture-oriented zones.
3.3 Spatial regression between EPIs and BGSSI
A spatial regression test was conducted on EPIs and BGSSI (Table 3), and the fitting effect of the spatial model was judged based on the significance and size of Lagrange Multiplier (LM) and Robust LM. The results indicate that the grid scale SEM has the best matching effect, and only GDPI performed better in the SLM at the 5 km scale. On the management level, POPI and GDPI are appropriate for the SLM, while the other EPIs adopt OLS.
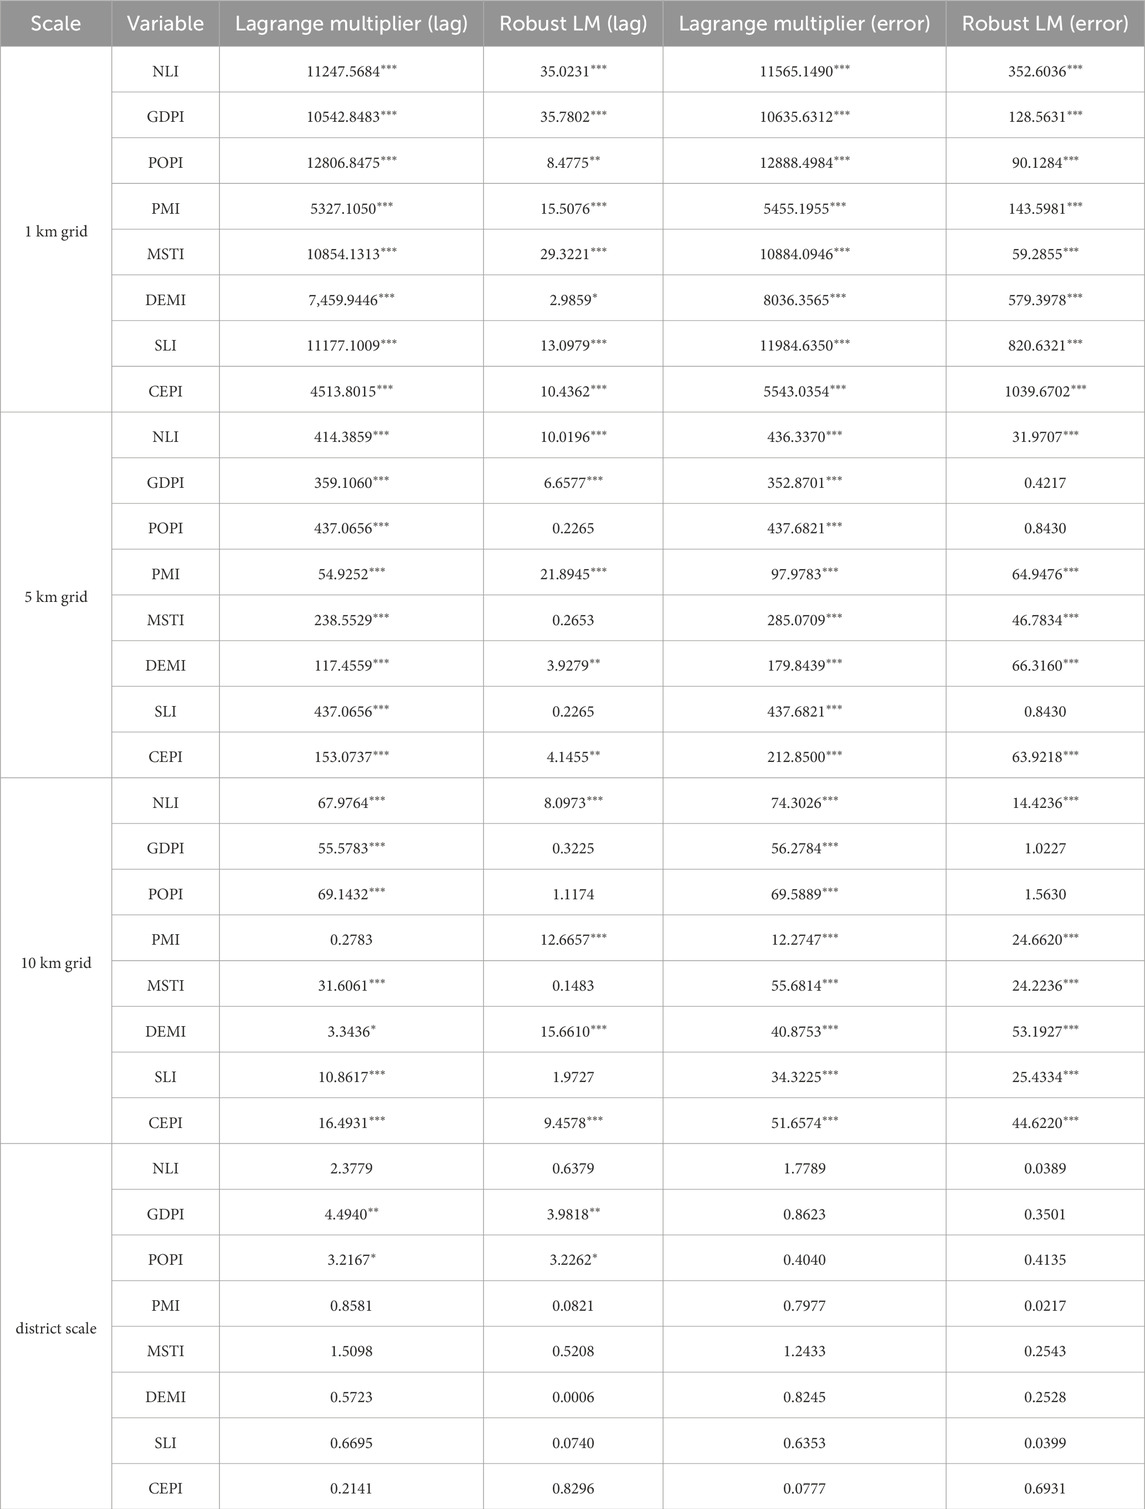
Table 3. Spatial econometric model tests. (Steinberg *. P < 0.1; **. P < 0.05; ***. P < 0.01).
The regression coefficients of the pressure indices were negative at all scales except for POPI, which had a positive regression coefficient at the 5 km grid scale. The negative correlation between CEPI, and BGSSI, was the strongest within each study scale, all correlation coefficients passed the 1% significance test, with values of −1.2844, −1.04567, −1.35842, and −1.12995 at 1 km, 5 km, 10 km, and district scales. At the grid scale, CEPI, PMI, DEMI, SLI, and MSTI, have stronger negative effects on BGSSI, than NLI, GDPI, POPI, the correlation between POPI, and BGSSI, was the smallest, with correlation coefficients of −0.0811,607, 0.0161,535, and −0.103,947 at the 1 km, 5 km, and 10 km scales, respectively, and did not pass the significance test at the 5 km and 10 km scales.
3.4 The coupling coordination relationship between EPIs and BGSSI
The coupling coordination relationship between EPIs and BGSSI at four scales is shown in Figure 5. There were three stages of coupling coordination: AS, RS, and CS, and nine types of coupled coordination: AS1, AS2, AS3, RS1, RS2, RS3, CS1, CS2, and CS3. Generally, coupling and coordination between EPIs and BGSSI are relatively consistent with scale changes. The coupling and coordination level is low in the central region and high in the Meiling area in the northwest. Compared to other stressors, PMI, MSTI, DEMI, and BGSSI have a higher degree of coupling and coordination, with CS relationships dominating at multiple scales.
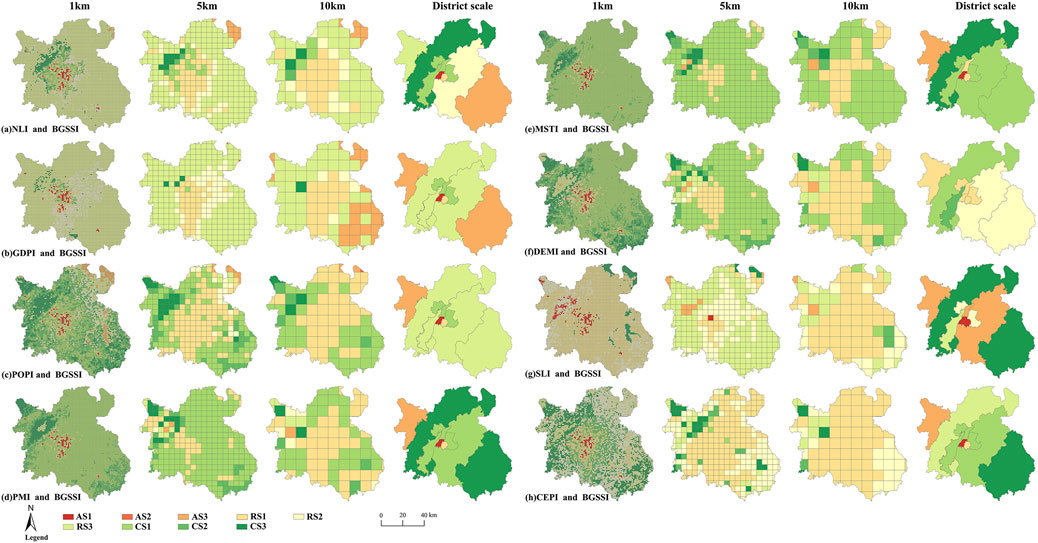
Figure 5. The coupling coordination relationship between EPIs and BGSSI at four scales.
The AS demonstrated a concentrated distribution at the 1 km grid and regional scales, with the 1 km grid scale centered in the central area of the city, and the regional scale observed in Anyi County and Xihu District. The RS primarily spanned the central and eastern parts of the city, while the CS was distributed across the western and southeastern areas.
Furthermore, the spatial patterns of coupling coordination between EPIs and BGSSI are consistent with Nanchang’s urban development plans. Specifically, the central districts such as Xihu and Qingyunpu, which display high environmental pressure and low BGS stability, overlap with the core area of the “one core, two axes, multiple clusters” urban development strategy. These zones are designated for intensive economic and infrastructure development, and the results indicate they are also ecological stress hotspots.
Meanwhile, peripheral areas with high BGSSI and low EPIs, such as Meiling in the northwest and the Poyang Lake wetland belt in the northeast align with key ecological protection and restoration zones identified in the city’s ecological planning and the Poyang Lake Eco-Economic Zone. This spatial correspondence highlights the relevance of our findings for guiding differentiated planning policies at multiple administrative levels.
Figure 6 illustrates the proportional relationship between the coupling coordination stages and types of EPIs and BGSSI at four distinct scales. At the ecological grid scale, RS serves as the primary coupling and coordination stage between BGSSI and NLI, GDPI, SLI, and CEPI. Meanwhile, the main coupling and coordination stage between MSTI and BGSSI is CS. At the 1 km and 5 km scales, CS is the primary level of coupling and coordination between BGSSI and POPI, PMI, and DEMI, while at the 10 km scale, RS is the predominant level of coupling and coordination.
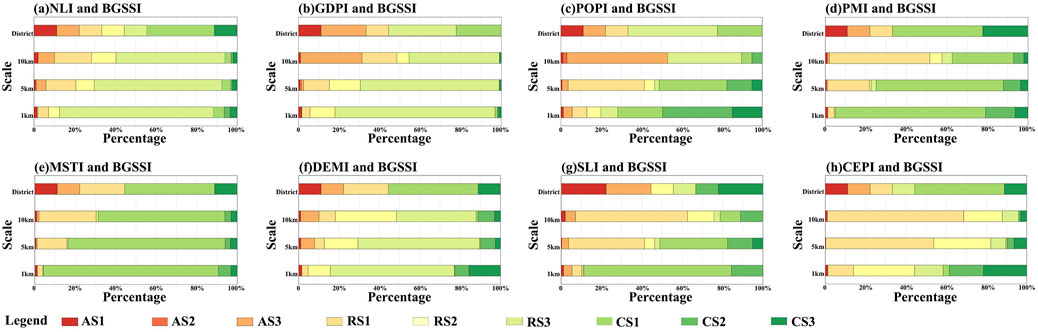
Figure 6. The proportion of coupling coordination between EPIs and BGSSI.
As the grid size increased, RS is the most distinctive stage of change. There was a notable increase in the proportion of RS1 between BGSSI and NLI、GDPI、PMI、MSTI、DEMI、CEPI, rising from 5.16%、4%、3.19%、2.7%、7.41%、12.68%–18.18%、17.17%、49.49%、28.28%、49.49%、67.68%, the proportion of RS2 between BGSSI and NLI、PMI、DEMI rising from 5.48%、0.04%、0.58%–12.12%、6.06%、3.03%. The proportion of RS3 between BGSSI and NLI、GDPI、CEPI decrease from 75.68%、78.81%、14.17%–53.54%、44.44%、8.08%, while the proportion of RS3 between BGSSI and PMI, DEMI rising from 0.53%, 3.90%–5.05%, 7.07%. Besides the proportion of AS3 between BGSSI and NLI, GDPI rised from 0.48%, 0.19%–8.08%, 30.3%.the proportion of 3 CS types between BGSSI and POPI, PMI, MSTI, DEMI, and CEPI follows a downward trend, changing from 71.73%, 95%, 86.44%, 86.76%, and 41.49%–10.1%, 37.37%, 68.69%, 38.38%, and 4.04%.
4 Discussion and suggestions
4.1 Spatial characterization and linkages between BGSSI and EPIs
The observed spatial heterogeneity, with high EPIs and low BGSSI in urban centers versus low EPIs and high BGSSI in suburban mountainous areas, aligns with global patterns of urbanization-driven ecological degradation (Albert et al., 2020). The central urban zone, characterized by dense infrastructure and fragmented BGS, mirrors findings from studies in rapidly urbanizing Asian cities where land-use intensification reduces landscape connectivity and resilience (Zhou et al., 2020). Conversely, suburban regions with contiguous forests and wetlands act as ecological buffers, corroborating the role of natural landscapes in mitigating environmental stressors (Fletcher et al., 2021). The spatial alignment of ecological pressure and stability patterns with Nanchang’s development plan suggests a spatial mismatch in some zones. Urban core areas under high-intensity growth show ecological fragility, calling for integrated governance that links ecological protection with zoning control.
These spatial patterns are also scale-sensitive. For instance, clustering analyses revealed low–low clusters in blue spaces and high–low clusters in urban cores. Smaller grids (1 km) captured fine-grained fragmentation effects, while larger scales (10 km) emphasized aggregated trends, consistent with the scale sensitivity of ecosystem services (Lu et al., 2025). This highlights the importance of multiscale analysis and supports a hierarchical planning framework: localized interventions for high-risk urban cores and broader strategies for suburban conservation.
The regression analysis further confirmed that EPIs are generally negatively correlated with BGSSI, supporting the hypothesis that anthropogenic pressures degrade landscape stability. Among these, PMI and MSTI showed the strongest negative effects, likely due to their direct connections to industrial emissions and urban heat islands, which exacerbate BGS fragmentation and hydrological stress (Pan et al., 2023; Li, Stringer, and Dallimer, 2022). In contrast, GDPI and POPI exhibited weaker influence, which may reflect Nanchang’s ongoing ecological restoration policies such as ecological parks and sustainable agriculture (Wang C. et al., 2020).
However, not all EPIs displayed consistent statistical significance across spatial scales. For instance, POPI became insignificant at the 5 km and 10 km grid levels, MSTI lost significance at the administrative level, and GDPI weakened from significant at 1 km to marginally significant or nonsignificant at coarser scales. These outcomes can be attributed to scale dependency and spatial averaging effects. Population pressures often lead to localized ecological impacts such as habitat fragmentation, heat island formation, and green space encroachment that are more effectively detected at finer resolutions. Likewise, thermal heterogeneity captured by MSTI may be diluted at the district level (Wang et al., 2020c). As for GDPI, its relationship with ecological outcomes may vary due to mixed land-use types and blurred functional zones at larger scales. These findings reinforce the importance of matching spatial scale with ecological process when interpreting regression outcomes (Cohen et al., 2016; Ferrer Velasco et al., 2020).
Beyond direct regression relationships, spatial autocorrelation and spillover effects suggest that pressures in one area can propagate to neighboring zones. For example, pollution from urban cores may diffuse into adjacent suburban blue-green spaces, while conservation in peri-urban forests and wetlands may provide cooling and purification services that benefit urban areas (Fan et al., 2022). This bidirectional dynamic reflects the concept of telecoupling in socio-ecological systems (Felipe-Lucia, Comín, and Bennett, 2014), emphasizing the need for integrated cross-boundary management.
These urban to rural spillover mechanisms are further evident in our spatial coordination analysis. High-intensity development and concentrated EPs in urban centers result in ecological degradation beyond core areas, reflected in the declining BGSSI of peri-urban zones. In contrast, suburban and rural BGS, particularly in forested and wetland regions, serve as ecological buffers that absorb environmental spillovers. Therefore, regional governance strategies should consider not only localized environmental control but also the absorptive and adaptive capacity of surrounding ecosystems. Incorporating spillover dynamics into spatial planning will allow policymakers to more effectively address the hidden ecological costs of urban expansion and promote balanced, sustainable urban and rural interactions.
The variance in regression strength and clustering patterns across scales (Tables 3, 4; Figure 4) underscores a fundamental insight: the mechanisms governing EPI-BGSSI interactions are hierarchical and scale-dependent.
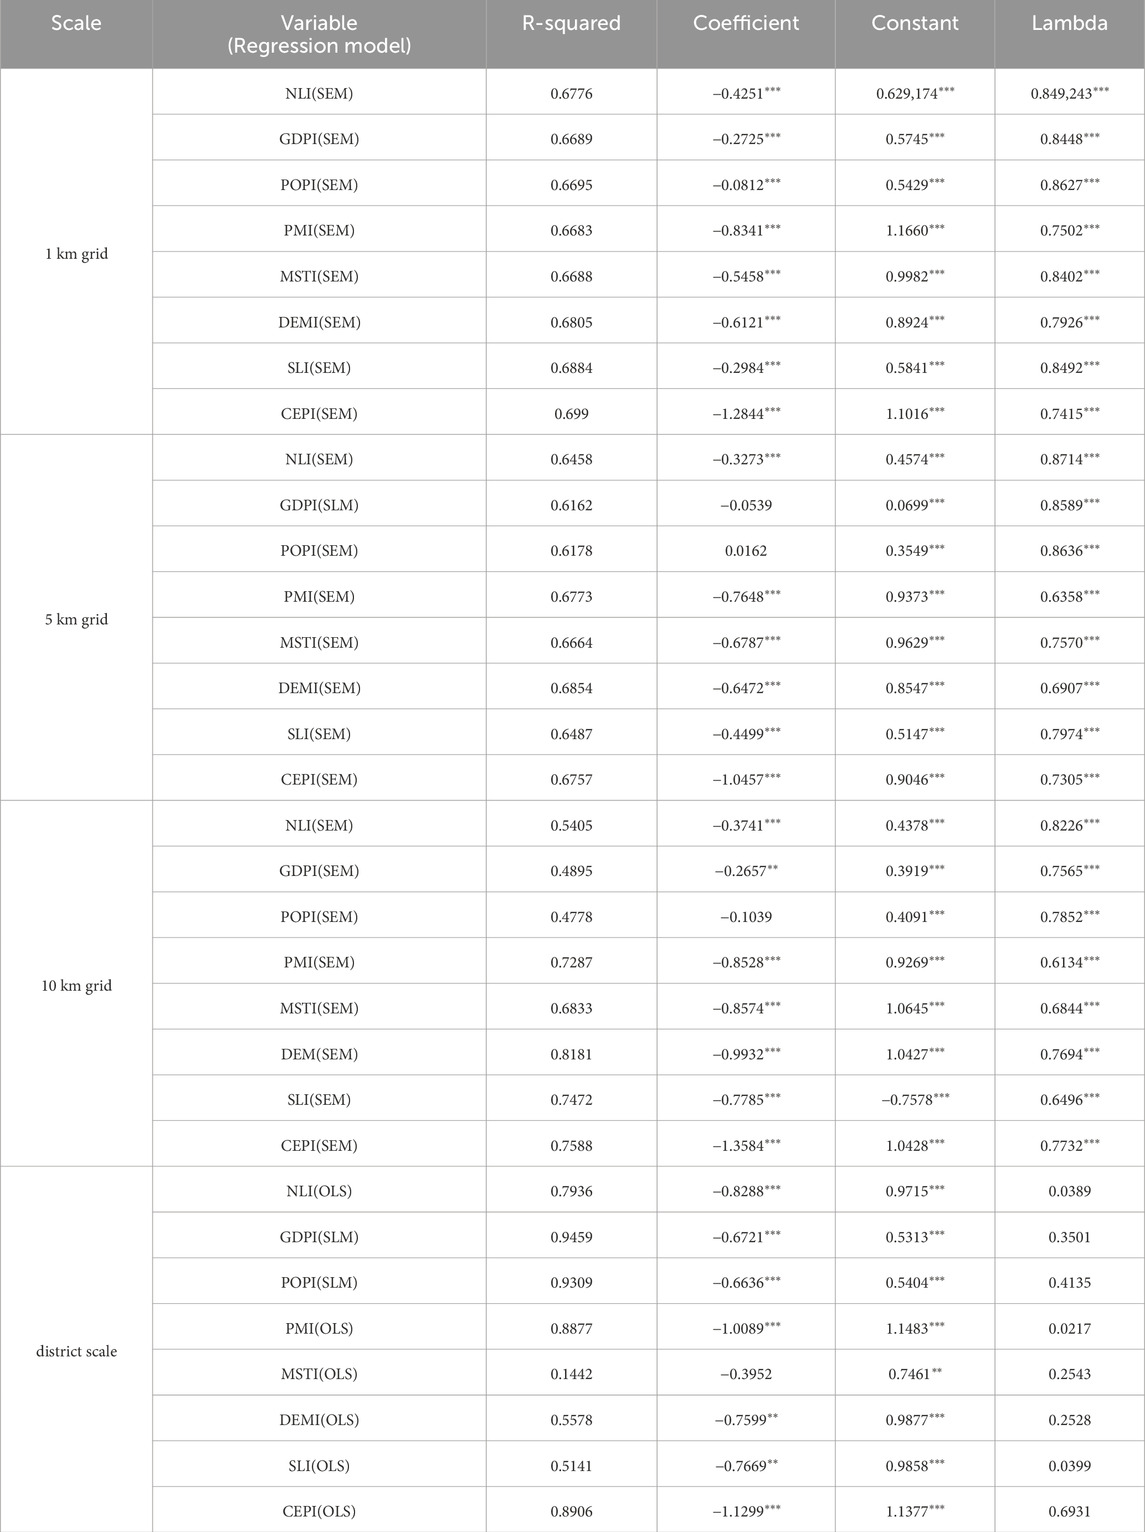
Table 4. Regression results of BGSSI and EPIs. (Steinberg *. P < 0.1; **. P < 0.05; ***. P < 0.01).
At the fine 1 km grid scale, our analysis captures direct, localized anthropogenic disturbances. The strong negative correlations with PMI and MSTI likely stem from immediate, micro-level stressors such as traffic emissions, industrial point sources, and the urban heat island effect. These pressures directly fragment and degrade small urban blue-green spaces (e.g., pocket parks, urban canals), reducing their stability. This scale is highly sensitive to the morphological changes in the landscape mosaic.
Conversely, the broader 10-km and administrative scales integrate local variations, thereby revealing the macro-regulatory role of regional policies and socio-economic trends. The stronger spatial autocorrelation at these scales highlights the aggregate impact of zoning and conservation strategies. For instance, the high-high clustering of DEMI/SLI and BGSSI in the northwestern suburbs aligns with land-use policies that restrict urban expansion into mountainous areas, preserving large, contiguous forest patches. The weakening significance of POPI and GDPI at larger scales suggests their influences are highly localized and may be mitigated by broader land-use planning decisions.
In summary, fine scales expose the anatomy of urban ecological stress, while coarse scales reveal the physiology of the landscape system in response to macroscopic governance. This scale dependency necessitates a multi-scale diagnostic approach for formulating effective ecological management strategies, ensuring policies are neither too generalized to address local crises nor too fragmented to achieve regional sustainability.
The coupling coordination stage distribution adds another layer of interpretation. The dominance of the Coordination Stage (CS) in suburban forests and wetlands, such as the Meiling area and Poyang Lake reserves, illustrates the effectiveness of ecological protection in maintaining stability under moderate pressures. Conversely, the prevalence of the Running-in Stage (RS) in central urban areas reflects a spatial mismatch between pressure and ecological capacity, pointing to the urgency of retrofitting green infrastructure in core zones (Świerkosz et al., 2014).
Finally, the scale-driven shift from CS to RS as grid size increases (Figure 6) suggests that finer resolutions are better suited to capturing localized coordination patterns, while coarser scales may obscure them. This underlines the importance of place-based strategies responsive to micro-scale ecological realities (Bai et al., 2020). The rise in RS1 (low EPI and low BGSSI) at broader scales is likely a result of data smoothing and spatial aggregation, which may obscure critical ecological hotspots if not carefully interpreted.
4.2 Suggestions on coupling coordination between BGSSI and EPIs
In the study area, the BGSSI and EPIs present three coupled coordination stages and nine coupled coordination types, each with different spatial distributions and proportions. This intricate nature presents difficulties in enhancing comprehensive management. Consequently, it is crucial to formulate practical and feasible measures that consider local specificities. These measures aim to strengthen the capacity and potential for regional development.
4.2.1 Suggestions for regions in AS
Specifically, regions within the AS such as Xihu District and Qingyunpu District, identified in the 1 km grid and administrative unit levels, should address the primary contradictions, improve the constraints of spatial development, and reverse the unfavorable situation of imbalances. AS1, situated in the urbanized area of the city, primarily stems from intense urban development, resulting in concentrated pressure. The BGS is scarce and fragmented, leading to its limited stability. We should pay attention to economic development and nurturing ecological construction. This entails directing our efforts towards bolstering investments and maintenance of ecological protection facilities, as well as facilitating the expansion of BGS; one effective approach could be the utilization of urban idle land to create pocket parks. AS3 refers to Anyi County, which is currently constrained by the slow pace of urban development. It is crucial to address these constraints by prioritizing the exploration of opportunities for urban development. This includes a focus on introducing and promoting green industries, leveraging the natural environmental advantages of BGS to drive industrial growth, and comprehensively enhancing the overall quality of development.
4.2.2 Suggestions for regions in RS
On the grid scales, RS2 and RS3 are widely distributed across BGS rich areas such as the eastern lake region, Meiling forest area, and Xinjian District, as revealed in the spatial clustering of the 1 km and 5 km grid levels. On the administrative scale, Xinjian County is a typical RS3 region. It is essential to preserve the natural characteristics of these various BGS land uses including rivers, lakes, farmland, and forest, and explore an integrated development approach that combines primary and tertiary industries. This will facilitate spatial optimization and promote coordinated development between ecological protection and regional growth.
4.2.3 Suggestions for regions in CS
The regions in the coordination stage such as Honggutan New District, Qingshan Lake District, Donghu District, and parts of Jinxian County possess significant potential for economic development and ecological quality improvement. It is important to actively promote regional spatial development within the limits of existing resources and environmental capacity. On the ecological scale, the BGS in the city center is mainly in CS1 and CS2, and on the administrative scale, Honggutan, Qingshan Lake, Donghu, and Nanchang County are in CS2. These regions have sufficient economic vitality. While pursuing urban development, attention should be paid to the improvement of BGS quality, such as the restoration and protection of river and lake water ecology and waterfront environments.
4.3 Implications for similar cities
This study provides a transferable framework for urban ecological planning in river-lake cities across the Yangtze River Basin (e.g., Wuhan, Nanjing, Hefei), which face comparable urbanization and ecological pressures (Xu, Jing, and Yan, 2025). A recurrent challenge is the “dual ecological dilemma” of central fragmentation and peripheral sensitivity: metropolitan cores in cities such as Wuhan and Nanjing exhibit severe blue-green space fragmentation and intensified urban heat islands, while peripheral water bodies and wetlands are increasingly threatened by urban sprawl, pollution, and hydrological changes (Hu, Wang, and Li, 2023; Yuan et al., 2024). Addressing this dilemma requires spatially differentiated governance strategies—urban cores (e.g., Xihu District) should emphasize “restoration and augmentation” via pocket parks and waterway rehabilitation, while ecologically sensitive peripheries (e.g., Poyang Lake wetlands) necessitate “protection and buffering” through strict ecological redlines and pollution buffers. We further propose a “Multi-scale Collaborative Governance Framework” to structure interventions: macro-scale (city/regional) analyses to define ecological security patterns, meso-scale (district) planning to coordinate resource allocation, and micro-scale (community) targeting of green infrastructure and precise restoration. This integrated approach offers a adaptable model for diagnosing environmental pressure-stability relationships and guiding targeted sustainable development strategies in analogous urban contexts.
5 Conclusion
This study highlights the spatial heterogeneity between EPs and BGSS across various ecological and administrative scales. Small-scale differences decrease as the grid size increases. Negative spatial correlation between EPIs and BGSSI is prevalent at the grid scale. The spatial clustering effect between NLI, GDPI, POPI, PMI, MSTI, and BGSSI diminishes with increasing scale, and the spatial clustering effect between DEMI, SLI, and BGSSI increases. We revealed three stages of coupling coordination between EPIs and BGSSI. As the grid size increases, the coupling coordination level between EPIs and BGSSI decreases, with notable variations in the role of specific pressure factors, such as PM2.5 and temperature, in influencing landscape stability.
Our findings provide valuable insights for urban planners and policymakers by demonstrating how multiscale analysis of EPs and BGSS can improve ecological governance. By understanding how pressures affect BGSS differently, targeted interventions can be designed to enhance ecological stability in vulnerable regions. While the study offers useful perspectives, its conclusions are subject to some limitations, such as data constraints and the use of regular grids at different spatial scales. Future research should aim to expand the range of EPs considered and explore the impact of irregular grid configurations to refine spatial analysis.
Data availability statement
The raw data supporting the conclusions of this article will be made available by the authors, without undue reservation.
Author contributions
MD: Conceptualization, Writing – review and editing, Methodology, Software, Writing – original draft, Formal Analysis, Visualization. DL: Writing – review and editing, Project administration, Supervision, Data curation, Resources.
Funding
The author(s) declare that financial support was received for the research and/or publication of this article. This research was funded by the Social Science Fund project of Guangxi Province, grant number (24SHF018) and Innovation in the Full-Chain Development of Wellness Tourism: Guangxi University Engineering Research Center.
Acknowledgments
We thank for the data support from “National Earth System Science Data Sharing Infrastructure (https://geodata.cn/), National Science and Technology Infrastructure of China (http://www.geodata.cn)”, LandScan Global Population Data (https://landscan.ornl.gov/), Resource and Environmental Science Data Platform (https://www.resdc.cn).
Conflict of interest
The authors declare that the research was conducted in the absence of any commercial or financial relationships that could be construed as a potential conflict of interest.
Generative AI statement
The author(s) declare that no Generative AI was used in the creation of this manuscript.
Any alternative text (alt text) provided alongside figures in this article has been generated by Frontiers with the support of artificial intelligence and reasonable efforts have been made to ensure accuracy, including review by the authors wherever possible. If you identify any issues, please contact us.
Publisher’s note
All claims expressed in this article are solely those of the authors and do not necessarily represent those of their affiliated organizations, or those of the publisher, the editors and the reviewers. Any product that may be evaluated in this article, or claim that may be made by its manufacturer, is not guaranteed or endorsed by the publisher.
References
Albert, C. H., Hervé, M., Fader, M., Bondeau, A., Leriche, A., Monnet, A.-C., et al. (2020). What ecologists should know before using land use/cover change projections for biodiversity and ecosystem service assessments. Reg. Environ. Change 20 (3), 106. doi:10.1007/s10113-020-01675-w
Anselin, L. (1995). Local indicators of spatial Association—Lisa. Geogr. Anal. 27 (2), 93–115. doi:10.1111/j.1538-4632.1995.tb00338.x
Bai, Y., Chen, Y., Alatalo, J. M., Yang, Z., and Jiang, B. (2020). Scale effects on the relationships between land characteristics and ecosystem services-a case study in taihu Lake Basin, China. Sci. Total Environ. 716, 137083. doi:10.1016/j.scitotenv.2020.137083
Baker, A., Brenneman, E., Chang, H., McPhillips, L., and Matsler, M. (2019). Spatial analysis of landscape and sociodemographic factors associated with green stormwater infrastructure distribution in Baltimore, Maryland and Portland, Oregon. Sci. Total Environ. 664, 461–473. doi:10.1016/j.scitotenv.2019.01.417
Baoping, R. E. N., and Gong, Y. (2022). Study on the coupling of Urbanization and high-quality development in the yellow River Basin. Econ. Probl. (03), 1–12. doi:10.16011/j.cnki.jjwt.2022.03.002
Cai, J., Li, X., Liu, L., Chen, Y., Wang, X., and Lu, S. (2021). Coupling and coordinated development of new urbanization and agro-ecological environment in China. Sci. Total Environ. 776, 145837. doi:10.1016/j.scitotenv.2021.145837
Cao, Y., Dong, B., Xu, H., Xu, Z., Wei, Z., Lu, Z., et al. (2023). Landscape ecological risk assessment of chongming dongtan wetland in shanghai from 1990 to 2020. Environ. Res. Commun. 5, 105016. doi:10.1088/2515-7620/ad03e0
Cohen, J. M., Civitello, D. J., Brace, A. J., Feichtinger, E. M., Nicole Ortega, C., Richardson, J. C., et al. (2016). Spatial scale modulates the strength of ecological processes driving disease distributions. Proc. Natl. Acad. Sci. 113 (24), E3359–E3364. doi:10.1073/pnas.1521657113
de Macedo, L. S. V., Picavet, M. E. B., de Oliveira, J. A. P., and Shih, W. Y. (2021). Urban green and blue infrastructure: a critical analysis of research on developing countries. J. Clean. Prod. 313, 127898. doi:10.1016/j.jclepro.2021.127898
Donati, G. F. A., Bolliger, J., Psomas, A., Maurer, M., and Bach, P. M. (2022). Reconciling cities with nature: identifying local Blue-Green Infrastructure interventions for regional biodiversity enhancement. J. Environ. Manag. 316, 115254. doi:10.1016/j.jenvman.2022.115254
Fan, Z., Zhan, Q., Liu, H., Wu, Y., and Xia, Yu (2022). Investigating the interactive and heterogeneous effects of green and blue space on urban PM2.5 concentration, a case study of Wuhan. J. Clean. Prod. 378, 134389. doi:10.1016/j.jclepro.2022.134389
Felipe-Lucia, M. R., Comín, F. A., and Bennett, E. M. (2014). Interactions among ecosystem services across land uses in a floodplain agroecosystem. Ecol. Soc. 19 (1), art20. doi:10.5751/es-06249-190120
Ferrer Velasco, R., Köthke, M., Lippe, M., and Günter, S. (2020). Scale and context dependency of deforestation drivers: insights from spatial econometrics in the tropics. PLoS One 15 (1), e0226830. doi:10.1371/journal.pone.0226830
Fletcher, D. H., Likongwe, P. J., Chiotha, S. S., Nduwayezu, G., Mallick, D., Md, N. U., et al. (2021). Using demand mapping to assess the benefits of urban green and blue space in cities from four continents. Sci. Total Environ. 785, 147238. doi:10.1016/j.scitotenv.2021.147238
Fu, B., Wang, S., Su, C., and Forsius, M. (2013). Linking ecosystem processes and ecosystem services. Curr. Opin. Environ. Sustain. 5 (1), 4–10. doi:10.1016/j.cosust.2012.12.002
Gao, L., Tao, F., Liu, R., Wang, Z., Leng, H., and Zhou, T. (2022). Multi-scenario simulation and ecological risk analysis of land use based on the PLUS model: a case study of nanjing. Sustain. Cities Soc. 85, 104055. doi:10.1016/j.scs.2022.104055
Gómez-Baggethun, E., and Barton, D. N. (2013). Classifying and valuing ecosystem services for urban planning. Ecol. Econ. 86, 235–245. doi:10.1016/j.ecolecon.2012.08.019
Guo, X. M., Fang, C. L., Mu, X. F., and Chen, D. (2022). Coupling and coordination analysis of urbanization and ecosystem service value in beijing-tianjin-hebei urban agglomeration. Ecol. Indic. 137, 15. doi:10.1016/j.ecolind.2022.108782
He, Y., Liang, Y., Liu, L., Yin, Z., and Huang, J. (2023). Loss of green landscapes due to urban expansion in China. Resour. Conservation Recycl. 199, 107228. doi:10.1016/j.resconrec.2023.107228
Hu, Y., Wang, C., and Li, J. (2023). Assessment of heat mitigation services provided by blue and green spaces: an application of the InVEST Urban cooling model with scenario analysis in Wuhan, China. Land 12 (5), 963. doi:10.3390/land12050963
Huang, X.-yuan, Ye, Y.-hui, Zhang, Z.-ya, Ye, J.-xia, Gao, J., Bogonovich, M., et al. (2021). A township-level assessment of forest fragmentation using morphological spatial pattern analysis in Qujing, Yunnan Province, China. J. Mt. Sci. 18 (12), 3125–3137. doi:10.1007/s11629-021-6752-0
Krishnan, A. R. (2024). Research trends in criteria importance through intercriteria correlation (CRITIC) method: a visual analysis of bibliographic data using the Tableau software. Information Discovery and Delivery 53 (2), 233–247. doi:10.1108/idd-02-2024-0030
Li, W., Wang, Y., Xie, S., Sun, R., and Cheng, X. (2020). Impacts of landscape multifunctionality change on landscape ecological risk in a megacity, China: a case study of Beijing. Ecol. Indic. 117, 106681. doi:10.1016/j.ecolind.2020.106681
Li, X., Li, S., Zhang, Y., O'Connor, P., Zhang, L., and Yan, J. (2021). Landscape ecological risk assessment under multiple indicators. Land 10, 739. doi:10.3390/LAND10070739
Li, X. Q., Stringer, L. C., and Dallimer, M. (2022). The role of blue green infrastructure in the urban thermal environment across seasons and local climate zones in East Africa. Sustain. Cities Soc. 80, 103798. doi:10.1016/j.scs.2022.103798
Liu, H., Ma, Y., Liu, Q., and Song, Y. (2020). Decision-Making of green space utilization and protection in urban fringe based on biodiversity trade-off. Sustainability 12 (4), 1373. doi:10.3390/su12041373
Lu, Q., Qi, W., Yang, D., and Zhang, M. (2025). The influence of internal spatial coupling characteristics of blue-green space on cooling benefit in metropolitan areas: evidence form Hangzhou, China. Environ. Sustain. Indic. 25, 100558. doi:10.1016/j.indic.2024.100558
Nicolè, F., Dahlgren, J. P., Vivat, A., Till-Bottraud, I., and Ehrlén, J. (2011). Interdependent effects of habitat quality and climate on population growth of an endangered plant. J. Ecol. 99 (5), 1211–1218. doi:10.1111/j.1365-2745.2011.01852.x
Pan, Z., Xie, Z., Wu, L., Pan, Yu, Ding, Na, Liang, Q., et al. (2023). Simulation of cooling Island effect in blue-green space based on multi-scale coupling model. Remote Sens. 15 (8), 2093. doi:10.3390/rs15082093
Prokopová, M., Salvati, L., Egidi, G., Cudlín, O., Včeláková, R., Plch, R., et al. (2019). Envisioning present and future land-use change under varying ecological regimes and their influence on landscape stability. Sustainability 11 (17), 4654. doi:10.3390/su11174654
Shen, J., Li, S., Liu, L., Liang, Ze, Wang, Y., Wang, H., et al. (2021). Uncovering the relationships between ecosystem services and social-ecological drivers at different spatial scales in the beijing-tianjin-hebei region. J. Clean. Prod. 290, 125193. doi:10.1016/j.jclepro.2020.125193
Sun, L., Yu, H., Sun, M., and Wang, Y. (2023). Coupled impacts of climate and land use changes on regional ecosystem services. J. Environ. Manage 326 (Pt A), 116753. doi:10.1016/j.jenvman.2022.116753
Świerkosz, S., Natalia, B., and Soszyński, D. (2014). Landscape structure versus the effectiveness of nature conservation: roztocze region case study (Poland). Ecol. Indic. 43, 143–153. doi:10.1016/j.ecolind.2014.02.018
Turner, M. G., Romme, W. H., Gardner, R. H., O'Neill, R. V., and Kratz, T. K. (1993). A revised concept of landscape equilibrium: disturbance and stability on scaled landscapes. Landsc. Ecol. 8 (3), 213–227. doi:10.1007/BF00125352
Veerkamp, C. J., Schipper, A. M., Hedlund, K., Lazarova, T., Nordin, A., and Hanson, H. I. (2021). A review of studies assessing ecosystem services provided by urban green and blue infrastructure, A Rev. Stud. Assess. Ecosyst. Serv. provided by urban green blue infrastructure. 52. 101367. doi:10.1016/j.ecoser.2021.101367
Wang, C., Yu, C., Chen, T., Feng, Z., Hu, Y., and Wu, K. (2020a). Can the establishment of ecological security patterns improve ecological protection? An example of Nanchang, China. Sci. Total Environ. 740, 140051. doi:10.1016/j.scitotenv.2020.140051
Wang, H. Y., Hu, Y. F., Tang, L., and Zhuo, Q. (2020b). Distribution of urban blue and green space in Beijing and its influence factors. Sustainability 12 (6), 2252. doi:10.3390/su12062252
Wang, S., Yongxian, S. U., and Zhao, Y. (2018). Regional inequality, spatial spillover effects and influencing factors of China's city-level energy-related carbon emissions. Acta Geogr. Sin. 73 (03), 414–428. doi:10.11821/dlxb201803003
Wang, Z., Fan, C., Zhao, Q., and Myint, S. W. (2020c). A geographically weighted regression approach to understanding urbanization impacts on urban warming and cooling: a case Study of Las Vegas. Remote Sens. 12 (2), 222. doi:10.3390/rs12020222
Weixiang, X. U., Zhou, J., and Liu, C. (2022). The impact of digital economy on urban carbon emissions: based on the analysis of spatial effects. Geogr. Res. 41 (01), 111–129. doi:10.11821/dlyj020210459
Wu, J., Luo, J., and Lin, T. (2019). Coupling relationship between urban expansion and Lake Change—A case Study of Wuhan. Water 11 (6), 1215. doi:10.3390/w11061215
Xu, J., Jing, Yi, and Yan, W. (2025). Divergent responses of ecological quality under various periods of urbanization in the Yangtze River Basin of China. Sustainability 17 (6), 2756. doi:10.3390/su17062756
Yu, W., Wang, Y., Wang, Y., Li, B., Liu, Y., and Liu, X. (2018). Application of a coupled model of photosynthesis and stomatal conductance for estimating plant physiological response to pollution by fine particulate matter (PM2.5). Environ. Sci. Pollut. Res. 25 (20), 19826–19835. doi:10.1007/s11356-018-2128-6
Yuan, Y., Tang, S., Guo, W., and Zhang, J. (2024). Spatiotemporal dynamics and driving factors of green-blue space in High-Density Cities: evidence from central Nanjing. Ecol. Indic. 160, 111860. doi:10.1016/j.ecolind.2024.111860
Yuchun, Y. A. O., and Zhang, J. (2023). Coupling and coordination of digital economy and urban-rural integrated development: measurement and evaluation. J. Lanzhou Univ. Soc. Sci. 51 (01), 54–67. doi:10.13885/j.issn.1000-2804.2023.01.005
Zhang, X., and Wang, Z. J. (2022). Evaluation and characteristic analysis of urban landscape stability in karst mountainous cities in the central Guizhou Province. Acta Ecol. Sin. 42, 5243–5254. doi:10.5846/stxb202105201324
Zhang, Y., Chang, X., Liu, Y., Lu, Y., Wang, Y., and Liu, Y. (2021). Urban expansion simulation under constraint of multiple ecosystem services (MESs) based on cellular automata (CA)-Markov model: scenario analysis and policy implications. Land Use Policy 108, 105667. doi:10.1016/j.landusepol.2021.105667
Zhang, S., Chen, C., Yang, Y., Huang, C., Wang, M., and Tan, W. (2023). Coordination of economic development and ecological conservation during spatiotemporal evolution of land use/cover in eco-fragile areas. Catena 226, 107097. doi:10.1016/j.catena.2023.107097
Zhang, G., Su, Yi, Wang, Z., Chen, Y., Wan, J., and Bai, H. (2024). Spatial–Temporal evolution and driving force analysis of blue–green space in the chengdu–chongqing economic circle, China. Land 13 (11), 1733. doi:10.3390/land13111733
Zhou, X., Ooka, R., Chen, H., Kawamoto, Y., and Kikumoto, H. (2014). Impacts of inland water area changes on the local climate of Wuhan, China. Indoor Built Environ. 25 (2), 296–313. doi:10.1177/1420326x14546774
Keywords: blue-green space, blue-green space stability, environmental pressures, coupling coordination model, spatial correlation, multiscale
Citation: Duan M and Luo D (2025) Multiscale coupling coordination analysis and spatial heterogeneity between blue-green space landscape stability and environmental pressures in Nanchang, Jiangxi Province, China. Front. Earth Sci. 13:1615573. doi: 10.3389/feart.2025.1615573
Received: 21 April 2025; Accepted: 28 August 2025;
Published: 17 September 2025.
Edited by:
Thanh Luu Pham, Ton Duc Thang University, VietnamCopyright © 2025 Duan and Luo. This is an open-access article distributed under the terms of the Creative Commons Attribution License (CC BY). The use, distribution or reproduction in other forums is permitted, provided the original author(s) and the copyright owner(s) are credited and that the original publication in this journal is cited, in accordance with accepted academic practice. No use, distribution or reproduction is permitted which does not comply with these terms.
*Correspondence: Mingming Duan, MjAxODA3MDM2QGh6eHkuZWR1LmNu; Dan Luo, bHVvZGFuNzI1QDEyNi5jb20=