 Lanjing Xing1
 Yaohui Liu
- 1Shandong Hi-speed Infrastructure Construction Co., Ltd., Jinan, China
- 2School of Mechanics and Civil Engineering, China University of Mining and Technology, Xuzhou, China
Grouting is a widely used method for addressing the issue of karst caves in geotechnical engineering. However, the extent and reinforcement effectiveness of grout after injection remain unclear in practical applications. To evaluate the grouting effect in karst caves, time-lapse seismic full waveform inversion (FWI) was employed in a series of field tests in Guizhou Province. The FWI results indicate that the horizontal range of the cave extends from 15 m to 25 m, with a depth range of 6 m–12 m. These findings are consistent with the drilling results, which show a burial depth of 6.2 m–12.4 m. The experimental results demonstrate that FWI can accurately determine the location and size of karst caves. The dispersion energy image of surface waves provides valuable input for the initial FWI model. The karst cave was also detected after grouting, and a wave velocity difference map was obtained. The results suggest that time-lapse FWI is more effective than direct inversion in eliminating the influence of the surrounding environment and highlighting changes in the slurry. The solidification range of the slurry after the second grouting closely matches the shape of the karst cave, suggesting that the cave has been completely filled with slurry. This conclusion is further supported by the drilling and subsequent construction results. Additionally, a comparison of the S-wave and P-wave inversion results shows that S-waves velocity models are more accurate than P-wave ones. These findings provide valuable insights for grouting detection in practical engineering applications.
1 Introduction
The random distribution of karst caves is a common geological hazard in karst regions. If the location and size of karst formations are not identified promptly during tunnel excavation, it can lead to geological disasters such as collapses and water inrushes (Wang et al., 2020). Grouting is a widely used method to address karst caves; however, it is a hidden process. The precise location and reinforcement status of the grout after application are often unknown (Li et al., 2024). Therefore, there is an urgent need for methods that can effectively detect the location of karst caves and assess the effectiveness of grouting.
Geophysical exploration is the primary method for advanced detection of karst caves in tunnel engineering (Wang et al., 2020; Lou et al., 2023; Liu D. et al., 2024; Liu Y. H. et al., 2024; Huang J. P. et al., 2023). Seismic exploration, due to its long detection range and ease of construction, has gradually become one of the most popular detection methods (Xue et al., 2021). Recent improvements in seismic exploration, such as the use of ellipsoid positioning velocity analysis, have been applied to the advance geological prediction of the Hei-song-yi Tunnel (Gao et al., 2023). The results demonstrate that this method can effectively identify the degree of surrounding rock fragmentation and detect unfavorable geological features such as karst caves ahead of the tunnel face. However, most seismic data processing methods primarily rely on wave velocity information, overlooking the vast potential provided by amplitude and phase data, which limits detection accuracy.
Full waveform inversion (FWI) is a prominent imaging technique in seismic exploration. It inverts the physical properties of subsurface media by analyzing the complete waveform data of seismic waves (Krampe et al., 2019; Kwon et al., 2015; Alkhalifah, 2016). Unlike traditional inversion methods, FWI utilizes both amplitude and phase information, significantly improving the accuracy and resolution of imaging (He et al., 2020; da Costa et al., 2019). Sirgue (Sirgue et al., 2008) successfully applied three-dimensional frequency-domain FWI to the oil and gas industry, demonstrating for the first time that FWI can recover high-frequency structures by using industrial seismic data. Subsequently, numerous researchers have introduced various improvements to the FWI method, enhancing its inversion speed and detection accuracy (Thiel et al., 2019; Liu et al., 2021; Vigh et al., 2023; Jiang et al., 2024; Huang and Schuster, 2017; Cai and Zhang, 2016; Wu and Alkhalifah, 2017). These advancements have made FWI become one of the research hotspots in the field of geophysical inversion algorithm.
Time-lapse seismic exploration is widely used in the oil and gas industry (Fu and Innanen, 2022; Keating and Innanen, 2024; Kotsi et al., 2019; da Silva et al., 2024; Raknes and Arntsen, 2014; Huang et al., 2020; Li et al., 2021). By analyzing data differences from various stages of oilfield development, time-lapse seismic methods monitor reservoir dynamics and guide subsequent oil extraction efforts (Egorov et al., 2017). Compared to traditional seismic methods, time-lapse seismic exploration offers greater resistance to environmental interference (Chen et al., 2008). Consequently, many scholars have integrated time-lapse seismic exploration with FWI, resulting in the development of time-lapse FWI methods. Practical applications have demonstrated that this method effectively removes the influence of surrounding strata, thereby highlighting changes of oil during the mining process. Although the application fields of grouting monitoring and oil exploitation monitoring differ, their underlying principles are similar (Xiong and Lumley, 2025). Therefore, time-lapse FWI can effectively eliminate the influence of the formation environment, highlighting the effects of slurry on the seismic waveform and thereby improving detection resolution.
Guizhou Province, known for its karst landscape and abundance of karst caves, presents significant challenges for tunnel and road construction. To assess the feasibility of time-lapse FWI for karst grouting detection, a field test was conducted in Guizhou Province. The results of this test will offer valuable insights for grouting treatment in karst environments.
2 Theory and methods
2.1 Surface wave methods
The surface wave method has become one of the most commonly used techniques in engineering geophysical exploration due to its high efficiency and convenience. Surface waves exhibit dispersion characteristics, with propagation depth depending on the frequency. The basic process of the surface wave method involves exciting surface waves within a specific frequency range using, for example, a hammering technique, followed by the separation of Rayleigh waves through amplitude spectrum analysis. This allows for the interpretation of subsurface formation distribution. While surface waves are typically characterized by fast attenuation and shallow propagation depths, which often result in their removal as noise in traditional geophysical data processing, they are particularly useful for geotechnical detection. Surface waves mainly propagate near the surface and have a higher signal-to-noise ratio, making them more advantageous in this context.
The two most commonly used data acquisition and processing methods for surface waves are the surface wave spectrum analysis method and the multichannel analysis of surface waves (MASW). In particular, the multi-channel surface wave analysis method, with its high acquisition efficiency and resolution, has become widely adopted in site stratification work.
However, a key assumption in traditional surface wave data processing is that of horizontal stratigraphy—specifically, the assumption that the strata in the test site are absolutely horizontal, without any undulations. In a layered model, surface-wave phase velocity Vph is determined by a function D in a nonlinear, implicit form as Equation 1 (Pan et al., 2019).
where f represents frequency and m represents the elastic model parameters as a function of depth (1D).
The surface wave phase velocity can be acquired by solving Equation 1. In MASW, we aim at minimizing the misfit between synthetic and observed dispersion curves, which can be written as Equation 2.
where,
This assumption enhances computational efficiency and works well for many engineering applications involving layered strata (Bohlen et al., 2004; Ikeda et al., 2013). Nevertheless, this assumption limits the method’s applicability to more complex, non-horizontal strata media, particularly when detecting non-layered underground anomalies such as isolated rocks, karst caves, or pile foundations (Socco et al., 2009; Di Fiore et al., 2016).
2.2 Full waveform inversion
Compared to traditional surface wave data processing methods, FWI leverages both amplitude and phase information from seismic wave data, significantly enhancing its resolution. Additionally, FWI does not rely on the assumption of horizontal strata and is directly solved using the wave equation, addressing a key limitation of traditional surface wave methods. While much of the research on FWI has focused on the inversion of body waves, there has been limited exploration of joint inversion involving both surface and body waves.
The wave equations for elastic waves in 2D media described by coordinates x and z are given by Equations 3–7.
where τxx, τxz and τzz are the components of stress, μ and λ are lame’s coefficients, b is the specific density, Vx and Vz are particle velocity. The objective function is given by Equation 8.
where T is the maximum recording time, xr is the geophone, s is the source, uobs is the observed waveform, usyn is the synthetic waveform.
Seismic wavelet estimation is a critical step in seismic data preprocessing. Initially, the Green’s function is derived by assuming a seismic wavelet and performing forward modeling in the frequency domain. Next, the seismic data is deconvolved using the Green’s function to estimate the seismic wavelet. Finally, the estimated wavelet is transformed from the frequency domain to the time domain via an inverse Fourier transform.
An inappropriate initial model can easily lead to inversion into a local minimum, reducing the accuracy of the result. To improve the alignment of the initial model with the actual wave velocity distribution, we construct it using the surface wave dispersion image.
The conjugate gradient method is employed as the iterative approach. The absorbing boundary width is set to 2 m. In practical inversion workflows, employing a good-chosen initial model can enhance stability and accelerate convergence. Therefore, a sequential inversion strategy, starting from low frequencies and progressing to higher frequencies, is often used in the FWI method.
2.3 Time-lapse FWI
Time-lapse seismic refers to the repeated seismic surveying of the same area at different times, enabling the analysis of parameter changes in the reservoir through the differences in seismic responses obtained (Huang C. et al., 2023; Park et al., 2025; De Lima et al., 2024).
The physical properties of grouts undergo significant changes during the solidification process. While this process differs considerably from the conditions in oil and gas exploitation, the fundamental principles are similar. Consequently, time-lapse seismic techniques should be useful for dynamically monitoring the grouting effect in karst caves.
The principle of time-lapse FWI involves separately inverting the karst cave detection data before and after grouting. By subtracting the results of these two inversions, the differences in parameters are obtained. The change in slurry properties is then highlighted by the variations in wave velocity parameters, as illustrated in Figure 1.
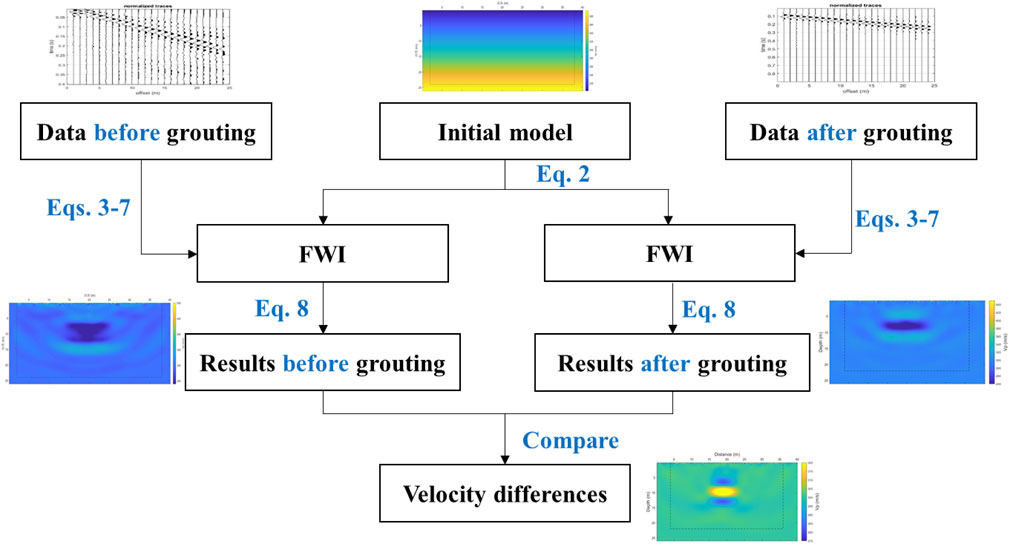
Figure 1. Flowchart of time-lapse FWI.
3 Site tests
A karst cave in Guizhou Province was selected for field tests to assess the effectiveness of time-lapse FWI. Drilling results indicate that the cave depth ranges from 6.2 m to 12.4 m. The surface wave method was employed to detect the karst cave, with survey lines arranged as depicted in Figure 2. Each survey line consists of 24 vertical geophones, spaced 1 m apart. A 7-kg hammer was used as the seismic source, and five seismic sources were evenly distributed along the survey line, with a 5-m spacing between them.
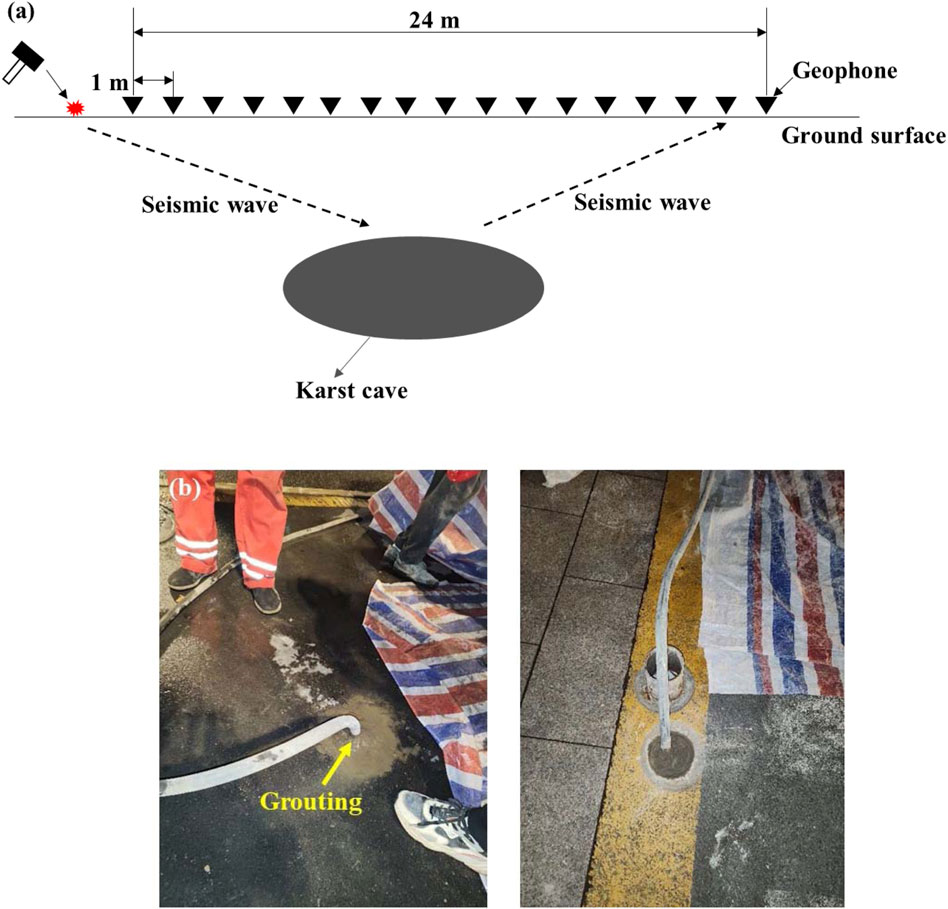
Figure 2. Site tests (a) a diagram depicting the survey (b) pictures of the karst cave grouting.
After using FWI to approximate the location and shape of the karst cave, a borehole was drilled directly above the cave. These boreholes served to validate the accuracy of the FWI results and provided access for slurry injection. Following the completion of grouting, repeated measurements were conducted using the same survey line configuration. The post-grouting detection data were then processed to generate a wave velocity image of the karst cave after grouting.
4 Results and discussion
4.1 Inversion results of karst cave before grouting
An appropriate initial model is essential to prevent the iteration process from converging to a local minimum. To accurately represent the shape and location of the karst cave, the initial model is constructed based on the dispersion image of the surface wave.
The dispersion spectrum of the surface wave is shown in Figure 3. The phase velocity of the high-frequency component of the seismic wave ranges from 100 to 300 m/s. Accordingly, a gradient model with velocities between 100 and 300 m/s is used as the initial model for shear wave FWI. Typically, the velocity of the P-wave is slightly higher than that of the S-wave; thus, the gradient range for the P-wave initial velocity model is set between 200 and 400 m/s.
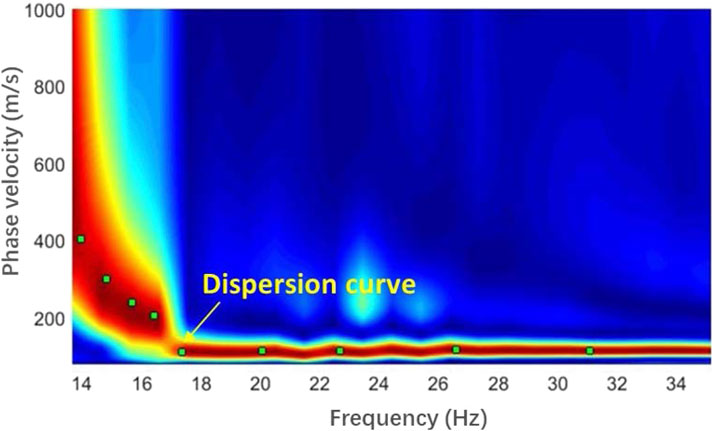
Figure 3. Dispersion image of surface wave method.
Environmental noise and surface distortion often negatively impact the accuracy of FWI. Inversion of low-frequency data imposes fewer demands on the initial model, making it easier for the results to converge to the optimal solution. Therefore, a sequential inversion strategy, progressing from low to high frequency, is employed to mitigate the effects of high-frequency noise and enhance accuracy.
The inversion process is divided into three stages based on different frequencies (20 Hz, 30 Hz, and 40 Hz). Once the inversion for the first stage (20 Hz) reaches its limit, the process automatically progresses to the next stage (30 Hz). The inversion results from each preceding stage are then used as the initial model for the subsequent stage. Likewise, the inversion results at 30 Hz serve as the initial model for the 40 Hz inversion.
The inversion results for different stages are presented in Figure 4 (P-wave velocity) and Figure 5 (S-wave velocity). The model dimensions for the inversion are 40 × 26 m, and the finite difference mesh size is 0.2 × 0.2 m. The variation in relative error with respect to iteration count during the inversion process is shown in Figure 6. As the iteration count and angular frequency increase, the average relative error decreases from 2.7% to 0.2%. This demonstrates that the low-to-high frequency inversion strategy effectively reduces inversion errors.
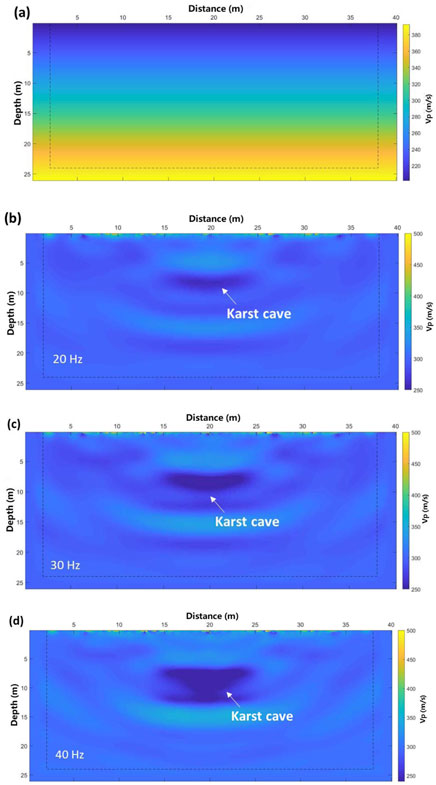
Figure 4. Inversion results of P-wave (a) initial model (b–d) results with frequency of 20 Hz, 30 Hz and 40 Hz.
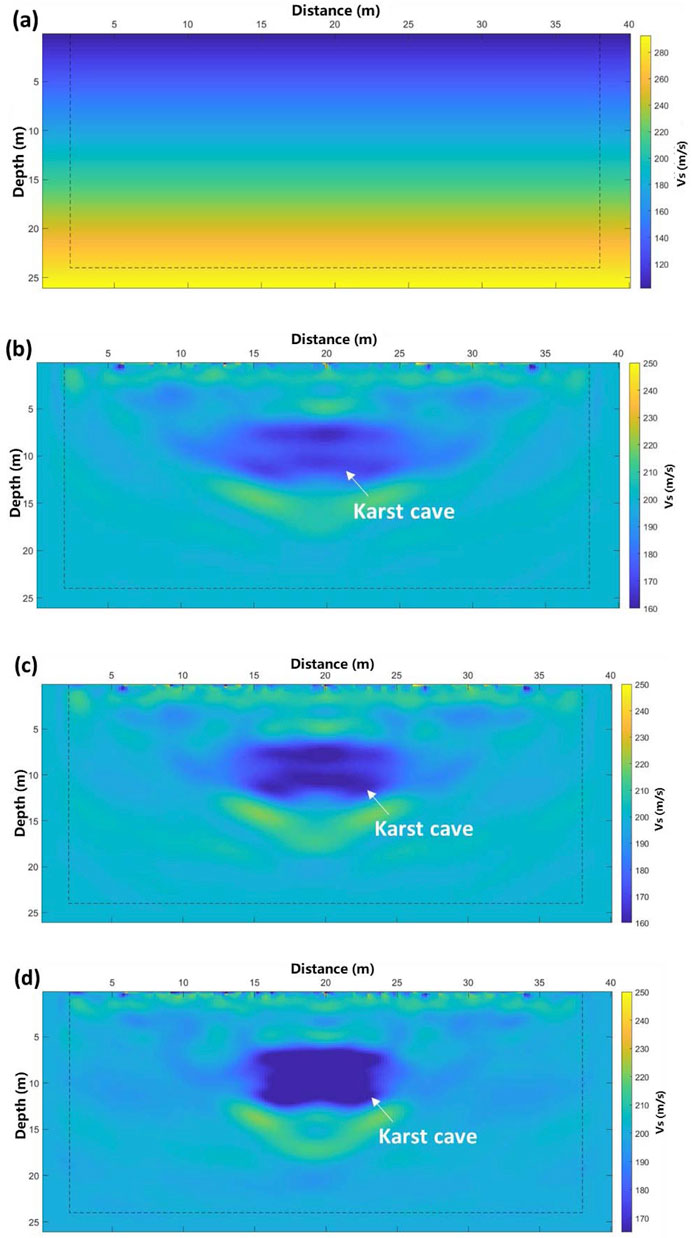
Figure 5. Inversion results of S-wave (a) initial model (b–d) results with frequency of 20 Hz, 30 Hz and 40 Hz.
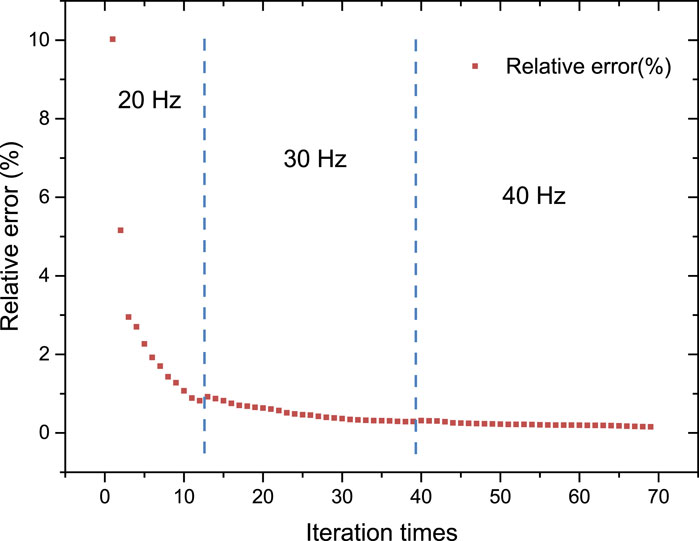
Figure 6. Relative error during the process of FWI.
As shown in Figures 4, 5, the P-wave velocity decreases significantly within the horizontal range of 15 m–25 m and the vertical range of 6 m–12 m. This indicates the presence of underground karst caves within this area. Due to the smoothing effect, the boundary of the karst cave in the inversion results appears slightly blurred. However, the results demonstrate that the FWI method effectively delineates both the location and size of the karst cave. The clarity of the cave boundary improves as the frequency range increases. The diagram shows that the wave velocity of the background in the inversion result is higher than that in the dispersion spectrum and the initial model. In one-dimensional surface wave detection, the velocity of the surface wave corresponds to the average velocity over a specific depth range. Therefore, karst cave has significant influence on the surface wave velocity, causing the obtained wave velocity to be lower than that of the actual formation. Drilling results confirm that the depth of the karst cave ranges from 6.2 m to 12.4 m, which aligns with the inversion findings. This further validates the effectiveness of FWI technology in detecting underground karst caves.
4.2 Inversion results after grouting
The inversion results following the first grouting are shown in Figure 7. Compared to the pre-grouting results, the extent of the abnormal body is significantly smaller and located at a shallower depth. This indicates that the slurry has filled the lower portion of the cave. However, it also suggests that the slurry did not fully fill the entire cave as intended, with a substantial amount of slurry flowing from the fissures into the surrounding layers.
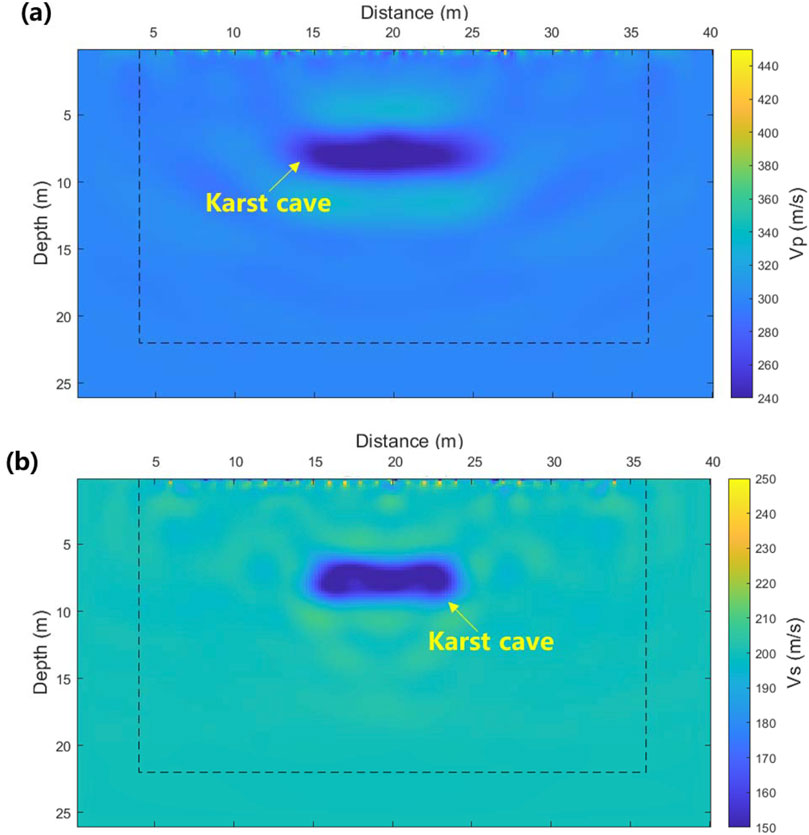
Figure 7. Inversion results after first grouting (a) P-wave velocity (b) S-wave velocity.
Supplementary grouting was performed following the initial grouting. After 1 week of static solidification, the test was conducted to verify the strength of the slurry. The detection results are shown in Figure 8. The results indicate that the velocity of the solidified slurry is significantly higher than that of the surrounding soil. The slurry’s location approximately corresponds to the original cave area, suggesting that the slurry has effectively filled the cave.
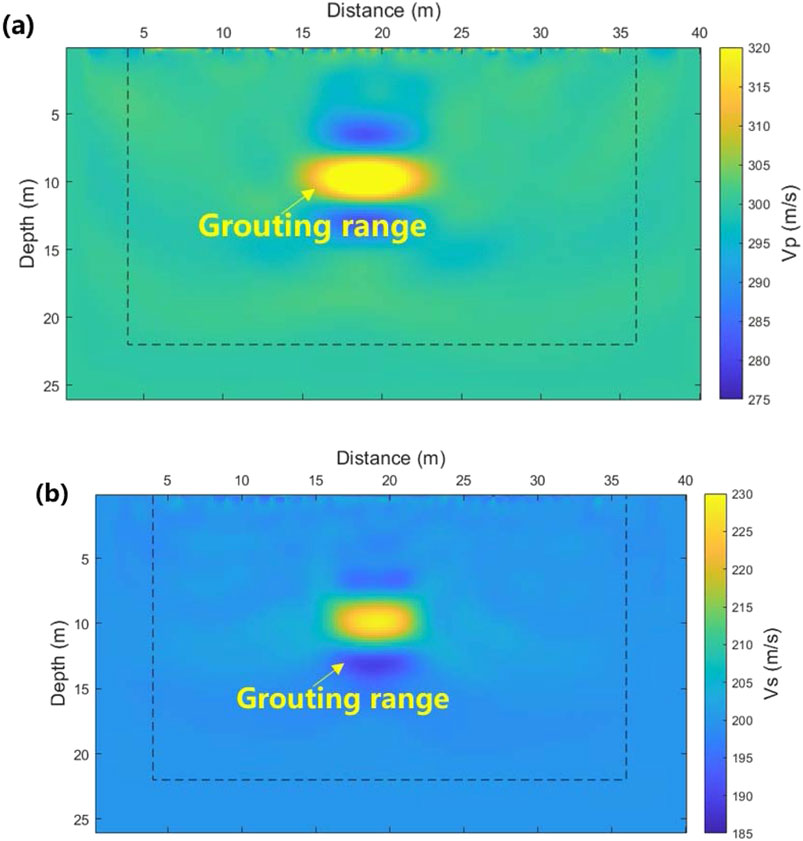
Figure 8. Results after second grouting (a) P-wave (b) S-wave.
4.3 The velocity difference after grouting
The velocity difference diagram is obtained by subtracting the waveforms recorded before and after grouting. The velocity difference diagram following the first grouting is shown in Figure 9. The results indicate that the velocity difference effectively highlights the diffusion range and solidification of the slurry. A greater velocity difference signifies a more effective solidification of the slurry.
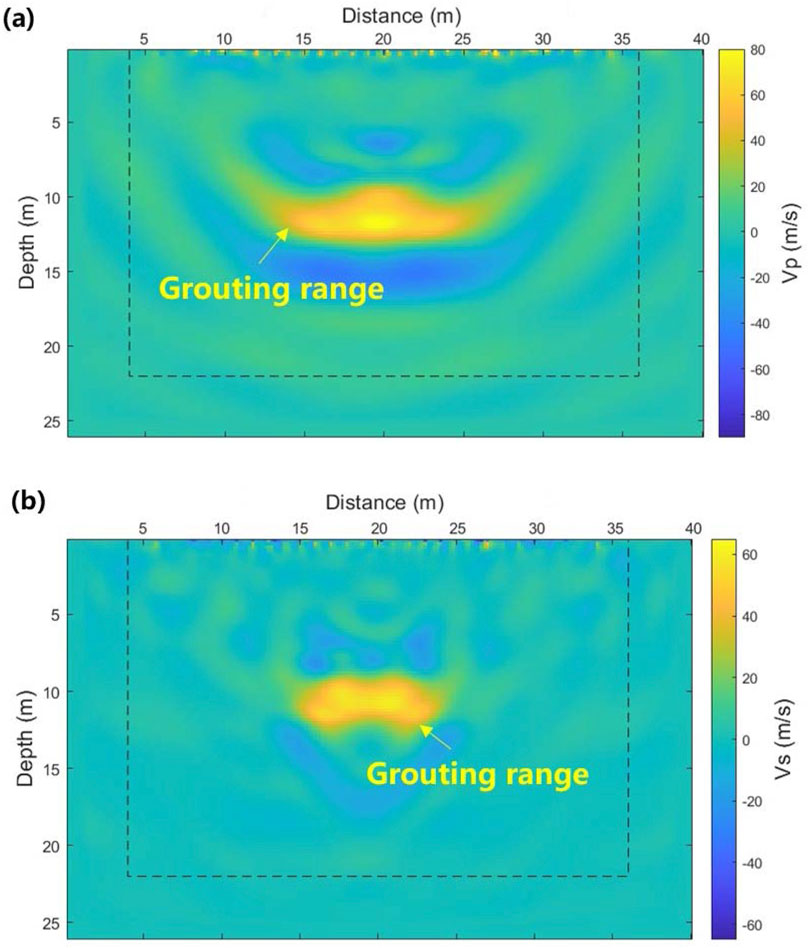
Figure 9. The velocity difference after first grouting (a) P-wave (b) S-wave.
The velocity difference following the second grouting is shown in Figure 10. Compared to the results after the first grouting, the anomaly area and velocity difference are both larger after the second grouting. This suggests that the diffusion range of the slurry has been effectively increased, and the solidification effect has been significantly enhanced.
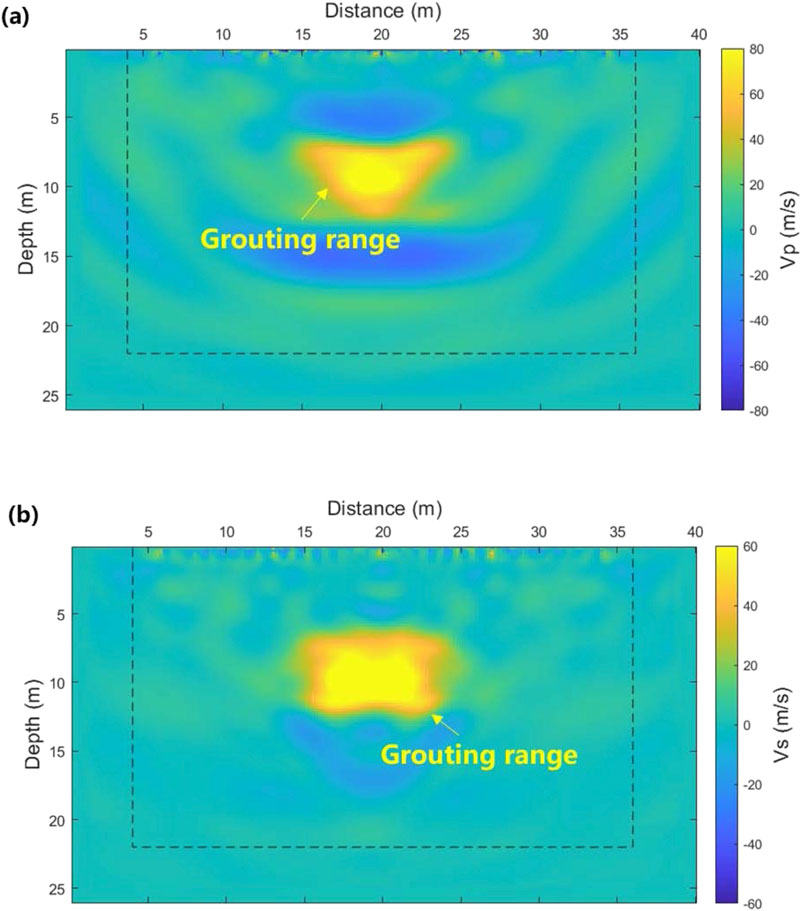
Figure 10. The velocity difference after second grouting (a) P-wave (b) S-.wave.
5 Limitations and discussion
By comparing the wave velocity difference diagrams (Figures 9, 10) with the direct inversion result diagrams (Figures 7, 8), it is clear that the wave velocity difference diagrams more clearly illustrate the spatial distribution of the slurry region. This difference is particularly noticeable after the second grouting. The slurry diffusion range depicted in the diagram closely matches with the shape of the target karst cave, providing evidence of the grouting process’s effectiveness. Previous research methods, such as high-density electrical tomography methods or other geophysical techniques, typically focus on the inversion imaging of karst cave morphology after grouting. If a reduction in the physical properties of the karst cave or a decrease in the abnormal range is observed, it is assumed that the grouting has been successful. However, in practice, this judgment is often inaccurate for two main reasons. First, karst cave filling typically requires multiple grouting stages (Zhu et al., 2022). A decrease in the abnormal values of the karst cave only indicates that the first grouting allowed the slurry to enter the cave, but it does not imply complete saturation of the fill. Even when the grouting volume is calculated in the initial stage, some slurry may be lost to underground concealed channels during the process, leading to insufficient actual filling. Second, the selection of grouting locations and dosage for secondary grouting is crucial. Relying solely on the initial grouting hole can lead to issues such as slurry inrushing. Therefore, accurately detecting the slurry concentration area and its filling degree is crucial for developing an effective secondary grouting plan. Based on these detection results, the optimal construction location and depth for secondary grouting can be determined more precisely. Compared to traditional methods, the time-lapse method offers distinct advantages: it effectively eliminates the interference from surrounding media, focusing on wave velocity changes caused by the slurry itself. This significantly enhances the detection accuracy of the grouting effect. Consequently, this method provides a crucial reference for the precise guidance of secondary grouting, which is difficult to achieve by traditional technical means.
A comparison of the inversion results for S-wave and P-wave reveals that the resolution of the S-wave is generally superior to that of the P-wave. This difference can be attributed to three main factors. Firstly, S-waves have a shorter wavelength than P-waves. According to diffraction theory, the resolution of inversion is positively correlated with wavelength, meaning that S-waves can detect smaller-scale geological anomalies more effectively. Secondly, S-wave propagation depends on the shear stiffness of the medium, meaning it can only travel through solid materials and cannot propagate through fluids or air. After grouting, the karst cave is filled with consolidation material, leading to a significant increase in the shear modulus of the medium and an associated rise in S-wave velocity. In contrast, P-waves depend on the bulk modulus and can propagate through both fluids and solids. Before and after grouting, the fluid in the cave is replaced by solid material. However, the P-wave velocity is less affected by the presence of fluid, making it less sensitive to changes in the grouting material compared to S-waves. Thirdly, surface waves are more sensitive to the S-wave velocity than the P-wave velocity (Zhang and Alkhalifah, 2019).
The current research has several limitations. Only the difference in wave velocity is used to qualitatively assess the solidification of the slurry, which does not allow for a quantitative evaluation. Future studies will include relevant laboratory tests to quantitatively investigate the relationship between the compressive strength of the slurry and wave velocity. Based on the inversion results, the reinforcement effect and compressive strength of the slurry will be accurately evaluated.
6 Conclusion
The detection of grouting effects in karst areas is a longstanding challenge in the geotechnical field. We proposed the use of time-lapse FWI technology by integrating surface wave detection, FWI, and time-lapse geophysical techniques. Time-lapse FWI was then applied to detect grouting effects in karst caves in Guizhou, China. The main conclusions are as follows:
1. Experimental results show that FWI effectively reflects the range and depth of karst caves. Using the dispersion spectrum to establish the initial model can effectively improve the inversion speed.
2. A serial inversion strategy, starting from low frequencies and progressing to higher frequencies, significantly enhances detection accuracy. As the iteration count and frequency increase, the average relative error decreases from 2.7% to 0.2%.
3. The accuracy of direct inversion after grouting is limited. The velocity differences profile after grouting can effectively highlight the diffusion range and reinforcement effects of the slurry.
4. Inversion results for the S-wave velocity demonstrate that it is more sensitive to changes in the slurry compared to P-waves, due to the shorter wavelength of S-waves and their higher sensitivity to liquid.
In summary, experimental results show that the application of time-lapse seismic FWI in the detection of karst cave grouting is feasible and effective. The research findings provide valuable technical insights for the assessment of grouting effectiveness in practical engineering applications.
Data availability statement
The original contributions presented in the study are included in the article/supplementary material, further inquiries can be directed to the corresponding author.
Author contributions
LX: Formal Analysis, Investigation, Writing – original draft. XH: Data curation, Writing – original draft, Visualization. JB: Investigation, Validation, Writing – review and editing. YL: Writing – review and editing. LL: Writing – review and editing, Visualization. CQ: Writing – review and editing, Supervision. QL: Supervision, Resources, Writing – review and editing.
Funding
The author(s) declare that financial support was received for the research and/or publication of this article. This investigation was supported by the National Key R&D Program of China (No. 2024YFF0507903), National Natural Science Foundation of China (projects No. 42307198 and No. 52379114), National science Foundation of Jiangsu Province (BK20221148), Science and Technology Project of Jiangsu Provincial Department of Science and Technology, China (BK20220025), China Postdoctoral Science Foundation (2023M733747) and Fundamental Research Funds for the Central Universities (XJ2021008101).
Conflict of interest
Authors LX, XH, LL and QL were employed by Shandong Hi-speed Infrastructure Construction Co., Ltd.
The remaining authors declare that the research was conducted in the absence of any commercial or financial relationships that could be construed as a potential conflict of interest.
Correction note
01 October 2025 This article has been corrected with minor changes. These changes do not impact the scientific content of the article.
06 October 2025 This article has been corrected with minor changes. These changes do not impact the scientific content of the article.
Generative AI statement
The author(s) declare that no Generative AI was used in the creation of this manuscript.
Any alternative text (alt text) provided alongside figures in this article has been generated by Frontiers with the support of artificial intelligence and reasonable efforts have been made to ensure accuracy, including review by the authors wherever possible. If you identify any issues, please contact us.
Publisher’s note
All claims expressed in this article are solely those of the authors and do not necessarily represent those of their affiliated organizations, or those of the publisher, the editors and the reviewers. Any product that may be evaluated in this article, or claim that may be made by its manufacturer, is not guaranteed or endorsed by the publisher.
References
Alkhalifah, T. (2016). Full waveform inversion in an anisotropic world: where are the parameters hiding? Netherlands: EAGE.
Bohlen, T., Kugler, S., Klein, G., and Theilen, F. (2004). 1.5D inversion of lateral variation of scholte wave dispersion. Geophysics 69 (2), 330–344. doi:10.1190/1.1707052
Cai, J., and Zhang, J. (2016). Full-waveform modeling and inversion of physical model data. J. Appl. Geophys. 131, 145–153. doi:10.1016/j.jappgeo.2016.04.012
Chen, X. H., Li, J. Y., and Zhao, W. (2008). Study on attribute characterization for reservoir dynamic monitoring by seismic. Sci. China Ser. D-Earth Sci. 51, 218–225. doi:10.1007/s11430-008-6010-0
da Costa, C. A. N., Costa, J. C., Medeiros, W. E., Verschuur, D. J., and Soni, A. K. (2019). Target-level waveform inversion: a prospective application of the convolution-type representation for the Acoustic wavefield. Geophys. Prospect. 67 (1), 69–84. doi:10.1111/1365-2478.12703
Egorov, A., Pevzner, R., Bona, A., Glubokovskikh, S., Puzyrev, V., Tertyshnikov, K., et al. (2017). Time-lapse full waveform inversion of vertical seismic profile data: workflow and application to the CO2CRC Otway project. Geophys. Res. Lett. 44 (14), 7211–7218. doi:10.1002/2017gl074122
Di Fiore, V., Cavuoto, G., Tarallo, D., Punzo, M., and Evangelista, L. (2016). Multichannel analysis of surface waves and down-hole tests in the archeological palatine hill area (rome, Italy): evaluation and influence of 2D effects on the shear wave velocity. Surv. Geophys. 37 (3), 625–642. doi:10.1007/s10712-015-9350-2
Fu, X., and Innanen, K. A. (2022). A time-domain multisource bayesian/markov chain monte carlo formulation of time-lapse seismic waveform inversion. Geophysics 87 (4), R349–R361. doi:10.1190/geo2021-0443.1
Gao, Z., Wang, W., Wang, X. C., and Li, K. F. (2023). Application of ellipsoidal positioning velocity analysis method in advance forecast in heisongyi area. Prog. Geophys. (in Chinese) 38 (2), 790–802.
He, B., and Liu, Y. K. (2020). Efficient reflection waveform inversion using a locally normalized zero-lag correlative objective function. Geophysical Prospecting 68 (9), 2678–2696. doi:10.1111/1365-2478.13017
Huang, Y. S., and Schuster, G. T. (2017). Full-waveform inversion with multisource frequency selection of marine streamer data. Geophysical Prospecting 66 (7), 1243–1257. doi:10.1111/1365-2478.12588
Huang, X. G., Jakobsen, M., Eikrem, K. S., and Naevdal, G. (2020). Target-oriented inversion of time-lapse seismic waveform data. Communications in Computational Physics 28 (1), 249–275. doi:10.4208/cicp.oa-2018-0143
Huang, J. P., Huang, Y. B., Ma, Y. Y., and Liu, B. W. (2023). Automatic karst cave detection from seismic images via a convolutional neural network and transfer learning. Frontiers in Earth Science 10, 1043218. doi:10.3389/feart.2022.1043218
Huang, C., Zhu, Y. T., and Xing, G. C. (2023). Data-assimilated time-lapse visco-acoustic full-waveform inversion: theory and application for injected CO2 plume monitoring. Geophysics 88 (1), R105–R120. doi:10.1190/geo2021-0804.1
Ikeda, T., Tsuji, T., and Matsuoka, T. (2013). Window-controlled CMP crosscorrelation analysis for surface waves in laterally heterogeneous media. Geophysics 78 (6), EN95–EN105. doi:10.1190/geo2013-0010.1
Jiang, P., Wang, Q. Y., Ren, Y. X., Yang, S. L., and Li, N. B. (2024). Full waveform inversion based on inversion network reparameterized velocity. Geophysical Prospecting 72 (1), 52–67. doi:10.1111/1365-2478.13292
Keating, S. D., and Innanen, K. A. (2024). Targeted nullspace shuttling in time-lapse full-waveform inversion. Geophysics 89 (6), R541–R549. doi:10.1190/geo2023-0511.1
Kotsi, M., Edgar, J., Malcolm, A., and de Ridder, S. (2019). Combining reflection and transmission information in time-lapse velocity inversion: a new hybrid approach. Geophysics 84 (4), R601–R611. doi:10.1190/geo2018-0086.1
Krampe, V., Pan, Y. D., and Bohlen, T. (2019). Two-dimensional elastic full-waveform inversion of love waves in shallow vertically transversely isotropic media: synthetic reconstruction tests. Near Surface Geophysics 17 (5), 449–461. doi:10.1002/nsg.12061
Kwon, T., Seol, S. J., and Byun, J. (2015). Efficient full-waveform inversion with normalized plane-wave data. Geophysical Journal International 201 (1), 53–60. doi:10.1093/gji/ggu498
Li, Y., Alkhalifah, T., and Guo, Q. (2021). Target-oriented time-lapse waveform inversion using deep learning assisted regularization. Geophysics 86, R485–R495. doi:10.1190/geo2020-0383.1
Li, M. D., Meng, K., Zhou, J., Zhang, J., Zhong, G., and Song, S. (2024). Seismic response and damage analysis of shield tunnel with bottom karst caves under oblique SV waves. Natural Hazards 120 (3), 2731–2747. doi:10.1007/s11069-023-06302-5
de Lima, P. D. S., Ferreira, M. S., Corso, G., and de Araujo, J. M. (2024). Bayesian time-lapse full waveform inversion using hamiltonian monte carlo. Geophysical Prospecting 72 (9), 3381–3398. doi:10.1111/1365-2478.13604
Liu, Y. H., Zhang, Y. H., Nilot, E., Yannick, C. N., Yang, P., and Ku, T. (2021). Detection of a shallow-buried rock obstruction using 2D full waveform inversion. Soil Dynamics and Earthquake Engineering 143, 106644. doi:10.1016/j.soildyn.2021.106644
Liu, D., Liu, M. H., Sun, H. F., Liu, R., and Lu, X. S. (2024). Detection and comprehensive treatment for giant karst caves under the tunnel floor: a case study in Guangxi, China. Environmental Earth Sciences 83 (23), 650. doi:10.1007/s12665-024-11959-7
Liu, Y. H., Li, S. C., Li, L. N., and Li, Z. (2024). Detection of beaded karst caves in subway works by mixed-source surface Wave survey. A Case Study. Lithosphere 2024 (3), 135.
Lou, G. C., Song, Y., Man, L. C., and Sun, Z. T. (2023). A new method for detecting karst and groundwater by 3D seismic wave: case study of the karst tunnel in zhangjihuai railway, China. Bulletin of Engineering Geology and the Environment 82 (12), 451. doi:10.1007/s10064-023-03468-x
Pan, Y. D., Gao, L. L., and Bohlen, T. (2019). High-resolution characterization of near-surface structures by surface-wave inversions: from dispersion curve to full waveform. Surveys in Geophysics 40 (2), 167–195. doi:10.1007/s10712-019-09508-0
Park, S. E., Stovas, A., and Oh, J. W. (2025). Acoustic anisotropic time-lapse full-waveform inversion based on elliptical anisotropic assumption at the sleipner site. IEEE Transactions on Geosceince and Remote Sensing 63, 1–9. doi:10.1109/tgrs.2025.3538061
Raknes, E. B., and Arntsen, B. (2014). Time-lapse full-waveform inversion of limited-offset seismic data using a local migration regularization. Geophysics 79 (3), WA117–WA128. doi:10.1190/geo2013-0369.1
da Silva, S., Karsou, A., Moreira, R. M., and Catale, M. (2024). Bayesian weighted time-lapse full-waveform inversion using a receiver-extension strategy. IEEE Trasactions on Geoscience and Remote Sensing 62, 1–22. doi:10.1109/tgrs.2024.3434443
Sirgue, L., Etgen, J. T., and Albertin, U. (2008). “3D frequency domain waveform inversion using time domain finite difference methods,” in 70th EAGE conference, 1–4.
Socco, L., Boiero, D., Foti, S., and Wisn, R. (2009). Laterally constrained inversion of ground roll from seismic reflection records. Geophysics 74 (6), G35–G45. doi:10.1190/1.3223636
Thiel, N., Herweck, T., and Bohlen, T. (2019). Comparison of Acoustic and elastic full-waveform inversion of 2D towed-streamer data in the presence of salt. Geophysical Prospecting 67 (2), 349–361. doi:10.1111/1365-2478.12728
Vigh, D., Xu, J., Cheng, X., and Glaccum, K. (2023). Sparse-node acquisition for data fitting velocity model building. Geophysical Prospecting 71 (8), 1540–1550. doi:10.1111/1365-2478.13393
Wang, J. C., Wang, C. Y., Han, Z. Q., Zou, X. J., Wang, Y. T., Wang, C., et al. (2020). Characteristic parameters extraction method of hidden karst cave from borehole radar signal. International Journal of Geomechanics 20 (8), 04020113. doi:10.1061/(asce)gm.1943-5622.0001733
Wu, Z., and Alkhalifah, T. (2017). Efficient scattering-angle enrichment for a nonlinear inversion of the background and perturbations components of a velocity model. GJI 210, 1981–1992. doi:10.1093/gji/ggx283
Xiong, K., and Lumley, D. (2025). Time-lapse full-waveform inversion with a new gradient-weighting strategy applied to marine seismic data. Geophysics 90 (2), R27–R42. doi:10.1190/geo2024-0104.1
Xue, F., Cai, M. J., Wang, T. Z., and Zhao, T. Y. (2021). Characteristics of karst cave development in urban karst area and its effect on the stability of subway tunnel construction. Advances in Civil Engineering 2021, 8894713. doi:10.1155/2021/8894713
Zhang, Z. D., and Alkhalifah, T. (2019). Wave-equation rayleigh-wave dispersion inversion using fundamental and higher modes. Geophysics 84, EN57–EN65. doi:10.1190/geo2018-0506.1
Keywords: geotechnical engineering, karst cave, surface wave method, time-lapsegeophysics, full waveform inversion
Citation: Xing L, Han X, Bai J, Liu Y, Liu L, Qu C and Li Q (2025) Application of time-lapse seismic full waveform inversion method in the detection of karst cave grouting. Front. Earth Sci. 13:1616895. doi: 10.3389/feart.2025.1616895
Received: 23 April 2025; Accepted: 25 August 2025;
Published: 19 September 2025; Corrected: 06 October 2025.
Edited by:
Tariq Alkhalifah, King Abdullah University of Science and Technology, Saudi ArabiaReviewed by:
Yazdan Shams Maleki, Kermanshah University of Technology, IranIbrar Iqbal, Guilin University of Technology, China
Copyright © 2025 Xing, Han, Bai, Liu, Liu, Qu and Li. This is an open-access article distributed under the terms of the Creative Commons Attribution License (CC BY). The use, distribution or reproduction in other forums is permitted, provided the original author(s) and the copyright owner(s) are credited and that the original publication in this journal is cited, in accordance with accepted academic practice. No use, distribution or reproduction is permitted which does not comply with these terms.
*Correspondence: Yaohui Liu, bGl1eWFvaHVpQGN1bXQuZWR1LmNu