 Jiabo Geng
 Cunyang Liu
 Xiang Lan2
- 1Sinosteel Maanshan General Institute of Mining Research Co. Ltd., Maanshan, China
- 2School of Emergency Management and Safety Engineering, Jiangxi University of Science and Technology, Ganzhou, China
- 3State Key Laboratory of Safety and Health for Metal Mine, Maanshan, China
In order to study the characteristics of settlement and deformation evolution of large open pit to underground mine quarries in China, and to analyse the changing law of volumetric water content of overburden rock layers at different mining stages. Based on 267 images from Sentinel-1A over a period of 10 years from 2015 to 2024, the SBAS-InSAR technology was used to analyze the subsidence situation of a mine in Jiangxi Province, and this was validated through discrete element numerical simulation. The results show that: (1) the deformation of the quarry is dominated by subsidence, and it is now in the stage of accelerated deformation, with the maximum subsidence reaching −168 mm, which is located at the eastern part of the quarry, in the area of high and steep slopes. (2) The settlement deformation of the mining field shows a clear positive correlation with underground mining. In 2015–2018, the settlement deformation is relatively slow, but in 2019–2024, as underground mining continues to advance, the surface settlement is obvious. From 2015 to 2024, more than 50% of the area in the mining zone experienced cumulative settlement deformation exceeding 75 mm. (3) Surface subsidence is the external result of the deformation of deep rock strata and sudden changes in water content. The mining of mineral chambers and pillars leads to the development of pores and fractures in the rock layers, further affecting changes in the volumetric water content. During the first rock layer collapse, the volumetric water content of the rock layers in the mining area is 40.3%, while during large-scale rock layer collapses, it is 44.8%. (4) The increase in volumetric water content of rock layers is one of the reasons for the instability of the rock layers. As the water content increases, the matrix suction gradually decreases to a limiting value of 1 kPa, while the permeability coefficient progressively increases to 3.71 × 10⁻⁶ m/s, resulting in the occurrence of rock layer collapse. This study indicates that the changes in the volumetric water content of rock layers during the transition from open-pit to underground mining are significantly associated with surface subsidence. The research findings can provide a theoretical basis for geological disaster warning and optimization of mining plans in similar mines.
1 Introduction
Mining, especially the transition from open-pit to underground mining, often leads to significant surface subsidence, posing risks to the safety of buildings and infrastructure (Bouwer, 1964; Chen et al., 2023; Yang et al., 2023). Subsidence also causes a redistribution of stress in the rock layers and alters water flow paths, resulting in changes to the mechanical properties of the rock (Yang et al., 2007; Yi et al., 2022). Heavy rainfall exacerbates this process—rainwater infiltration not only weakens the rock mass but also promotes the migration of moisture into the mined-out areas, significantly altering the volumetric water content of the rock layers, further undermining stability and increasing the risk of subsidence (Fernández et al., 2020; Guzy and Witkowski, 2021; Geng et al., 2023; Lan et al., 2025).
Currently, the monitoring technology for open-pit mine slopes has evolved from traditional point-based measurements (such as GPS) to surface-based monitoring primarily dominated by remote sensing technology. Among these, SBAS-InSAR technology has become one of the powerful tools for large-scale monitoring of ground subsidence in mining areas due to its high accuracy, strong resistance to decoherence, and wide coverage (Li S. et al., 2022; Chen et al., 2023; Li et al., 2025b; 2025a). The reliability of its monitoring results has been validated by comparing them with the analysis results of crowdsourced surface monitoring data from the mine, GPS monitoring results, and FLAC3D simulation results (An et al., 2024; Catalão et al., 2011; Li Y. et al., 2022; 2023). However, despite the maturity of SBAS-InSAR technology and its excellent performance in macro monitoring, its deep integration with discrete element modeling (DEM) technology is still in the exploratory stage. Discrete element simulation has unique advantages in revealing the micromechanical mechanisms of soil and rock particle-scale behavior and fracture evolution (Ma et al., 2011; Liu et al., 2021; Ma et al., 2023), providing deeper micro-level explanations for the changes in rock layers caused by mining. Although some scholars have attempted to combine InSAR with numerical simulations to study mining disasters (Necula et al., 2021; Sun et al., 2023), the systematic application of SBAS-InSAR technology to accurately constrain discrete element models, and further explore the instability patterns of rock layers and the dynamic evolution characteristics of volumetric water content during the entire process of transitioning from open-pit to underground mining under heavy rainfall conditions, remains at the forefront of research.
Therefore, combining the macro high-precision SBAS-InSAR time-series deformation monitoring results with the powerful discrete element model for micro-dynamic analysis has significant innovative meaning and urgent demand. This combination can break through the limitations of a single method, deeply elucidating the coupling impact mechanism of heavy rainfall on the seepage field (changes in volumetric water content) and stress field of rock layers, and accurately characterizing the instability patterns of rock masses in response to rainfall at different mining stages. This is crucial for revealing the causes and processes of surface subsidence under complex hydrological-mechanical coupling, predicting disaster risks, and guiding safe mining practices.
This paper identifies and monitors surface subsidence in the study area based on SBAS-InSAR technology. It delineates the subsidence range of the mining area, obtains the cumulative surface subsidence amount, and reveals the subsidence patterns and spatial distribution characteristics of the deformation area. A numerical simulation model is established based on the shape dimensions of the maximum subsidence area, rock layer properties, and working conditions. The study investigates the instability patterns of rock layers during the transition from open-pit to underground mining under heavy rainfall conditions, as well as the evolution characteristics of water content. Finally, based on the Fredlund model (Fredlund et al., 1994), the relationship between volumetric water content, matrix suction, and permeability coefficient is obtained. Such combined applications will provide a scientific basis for improving the safety of underground mining, optimizing mining plans, and reducing geological disaster risks.
2 Theoretical basis of research content
2.1 Basic principles of SBAS-InSAR
SBAS-InSAR technology is developed based on InSAR technology, first proposed by Berardino in 2002 (Berardino et al., 2002). This method enhances the accuracy of deformation monitoring, and subsequently, many researchers have supplemented and further studied this technology, applying it to surface deformation monitoring and other areas (Singhroy et al., 2015; Zhao et al., 2016; Zhang et al., 2018; Yang et al., 2020; Wang et al., 2022). Due to its reliability and accuracy, this method has been widely adopted. Figure 1 illustrates the geometric representation of InSAR imaging.
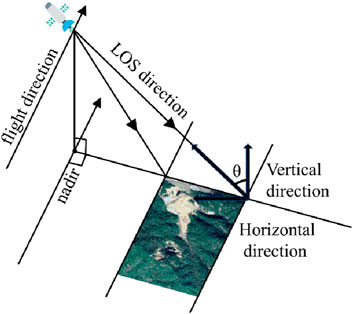
Figure 1. Imaging geometry of SBAS-InSAR.
After acquiring N+1 scenes of SAR imagery using this technology, M interferograms are generated based on the spatiotemporal baseline threshold, with specific constraints on their quantity satisfying Equation 1 (Li S. et al., 2022; Wang et al., 2022).
This design maximizes the utilization of temporal information while controlling the risk of spatial decorrelation. For the interferogram j formed between time points tA and tB (where tA < tB), its differential interferometric phase δϕj can be expressed as a superposition of multiple phases, as shown in Equation 2:
Where λ is the radar wavelength; B⊥j is the vertical baseline; Δz represents the error of the Digital Elevation Model (DEM), indicating the difference between the elevation data and the actual terrain; R is the distance from the radar to the target point; and θ is the incidence angle.
Equation 3 is a system of equations constructed from the phases processed from all interference patterns:
When the coefficient matrix B is of full rank, the deformation rate v can be solved using the least squares method. In cases where B is rank-deficient, the Singular Value Decomposition (SVD) method is employed to obtain the deformation rate. Once the deformation rate is determined, the deformation displacement can be calculated based on the time series of the SAR images.
2.2 Control equation for rainfall infiltration control
The numerical model simulated using MatDEM version 3.24 is generally composed of numerous particles. Each particle can be set with a certain moisture content. By configuring the contact model and range between particles, moisture can be assigned to each particle, ensuring that the overall moisture distribution of the model aligns with the moisture distribution patterns of the rock layers (Yu H. et al., 2023). After computing one time step, the moisture content ω of each particle is defined as follows:
In the Equation 4, ω0 represents the water content at the end of the previous time step for the unit; β is the rate of water reduction.
Based on the contact relationships of each particle, the moisture content of each particle is defined sequentially. Finally, by considering the impact of the moisture field on the mechanical properties of the soil, a particle model with moisture content can be obtained. Figure 2 illustrates the transport of moisture between particles.
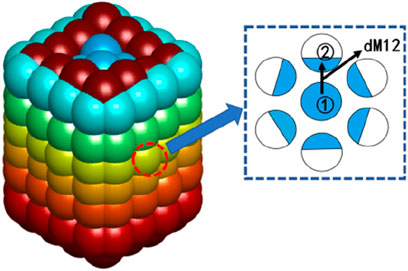
Figure 2. Schematic diagram of water transport.
In Figure 2, “Particle ① → Particle ②” indicates that, driven by the hydraulic gradient, water flows from the water-rich soil particle to the water-deficient soil particle. Using the finite difference method, let the unit time be dt, and the amount of moisture transfer from Particle ① to particle ②, dM12, can be expressed by Equation 5.
In the equation, k represents the permeability coefficient, and A is the equivalent area of the permeation path, taken as the average area of two particles.
The process of rainwater adhering to the surface of the rock and soil is characterized by the infiltration of rainwater, which compresses and replaces the water-gas two-phase flow within the slope’s rock and soil. Equation 6 is the infiltration formula for the soil surface in the Green-Ampt model (Ma et al., 2011; Van den Putte et al., 2013) that takes into account the ponding condition, used to calculate the rainfall attachment flow rate iω for slope soil particles:
In the equation, iω represents the rainfall attachment flow rate for soil particles onthe slope; θS is the saturated water content; θi is the initial water content; KS denotes the saturated permeability coefficient; Uα is the water suction at the wetting front; and Iq represents the rainfall intensity.
When the water content of soil particles increases, the internal friction angle decreases. To adjust the internal friction angle of the particles, the Hoek-Brown hydraulic parameters can be introduced to weaken the rock layers (Michalowski and Park, 2020), as shown in Table 1.

Table 1. Hydraulic parameters of Van Genuchten model.
The above calculation method is programmed in MatDEM, and then the water transport of rock mass under heavy rainfall conditions and the deformation rule of rock strata are studied.
2.3 Soil-water characteristic curve
The permeability of unsaturated soil is a function of volumetric water content, and the relationship between soil water saturation and matric suction is described by the Soil-Water Characteristic Curve (SWCC). According to the curve function proposed by Brooks and Corey, the relative permeability function based on effective saturation can be expressed using the soil matric suction (Brooks and Corey, 1963). Fredlund and Xing recommended the following function to fit the Soil-Water Characteristic Curve for soils with matric suction below 1 × 10⁶ kPa (Fredlund et al., 1994). The curve equation is shown in Equation 7:
To reduce parameter complexity and adapt to the requirements of discrete element simulation, Yu (Yu D. et al., 2023) simplified Equation 7, resulting in Equation 8:
In this context, θ represents the volumetric water content, while θs denotes the saturated volumetric water content. Parameter a is related to the inflow value (kPa), and b is the soil water content parameter when the water uptake exceeds the inflow value. Parameter c refers to the residual water content, and e is the natural constant, approximately equal to 2.71828, the term ψ represents the matric suction (kPa).
Based on Childs’ research findings (Childs and Collis-George, 1950), Fredlund obtained a function that reflects the relationship between the relative permeability kr and the volumetric water content θ of the soil, as shown in Equation 9.
In this context, y is the integral variable of matric suction, representing the logarithm of matric suction.
2.4 Overview of the study area
As shown in Figures 3a,b, the mine is located in Yincheng Town, Dexing, Jiangxi Province, and belongs to the western part of the Circum-Pacific metal mineralization belt. It is a super-large open-pit mine. The mining area consists of low mountains and hilly steep slopes, with the ore body located in a non-karst area. The surrounding rock is mainly schist, which has a relatively dense structure. The near-surface rocks are severely weathered, with a weathering zone depth of 10–30 m, and a maximum depth of 50 m. The rock fractures are well-developed and loose. Additionally, the rocks in the structural zone and its influence zone are more fragmented, have poor stability, and are prone to roof falls and collapses.
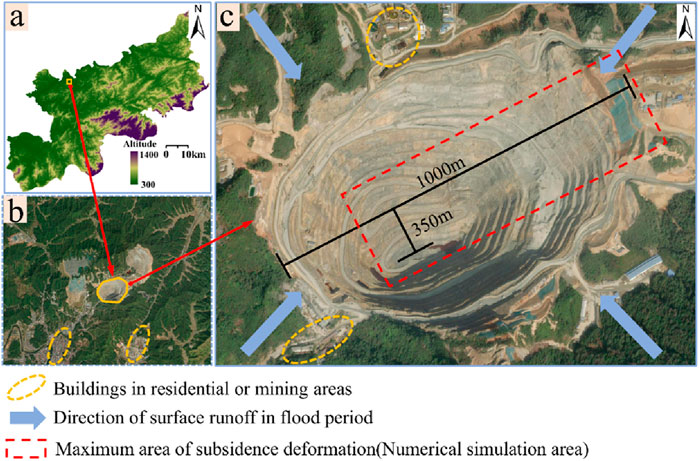
Figure 3. Current situation of the study area: (a) topographic information of Dexing City; (b) location and outline of the study area; and (c) basic stope information.
Satellite imagery in Figure 3a shows that the terrain in this area is higher in the northeast and lower in the southwest. The northern part is steep, while the southwestern part has only a narrow valley outlet, making the terrain conducive to water accumulation. The climate in the mining area is warm and humid, with an annual precipitation of up to 2,185 mm. Rainfall is concentrated in the summer months of June to August, and rainwater tends to accumulate in the study area, forming depressions. The aquifers in the mining area are mainly Quaternary porous aquifers, weathered rock, and structural fracture water-bearing zones. The fractured characteristics of the rock significantly enhance its permeability, leading to damp underground tunnels and common dripping phenomena.
Figure 3c shows the area of the mining site studied using SBAS-InSAR technology. The mining site is nearly circular, with a diameter of about 1,000 m and a maximum depth of approximately 350 m. Most of the stepped slope angles are between 37° and 53°. Additionally, the area outlined by the red dashed line in Figure 3c is the research area for subsequent numerical simulations.
3 Surface deformation analysis based on SBAS-InSAR technology
3.1 Acquisition of satellite data in the study area
Based on the regional topographical features, a total of 267 Sentinel-1A images from June 12, 2015, to September 16, 2024, were selected for analysis. The images were acquired in the IW (Interferometric Wide Swath) mode, using VV polarization and operating in the C-band, with an incidence angle of approximately 39.09°. To enhance data processing accuracy, precise orbital data were collected, and a 30 m × 30 m SRTM1 DEM dataset was utilized to eliminate interference from flat phase and topographic effects. Figure 4 shows the common area covered by the 267 images.
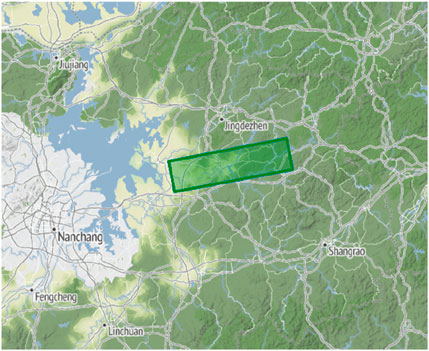
Figure 4. 267 Landscape image data public area.
Figure 5 illustrates the time baseline and spatial baseline distribution. From the time baseline perspective, the images show a relatively uniform distribution of time intervals, indicating good temporal coverage, which effectively supports the analysis of long time series. Regarding the spatial baseline distribution, the Average Spatial Coherence of the image pairs ranges from 0.3 to 0.8, reflecting a high degree of closeness and stability in the matching relationships among the image set.
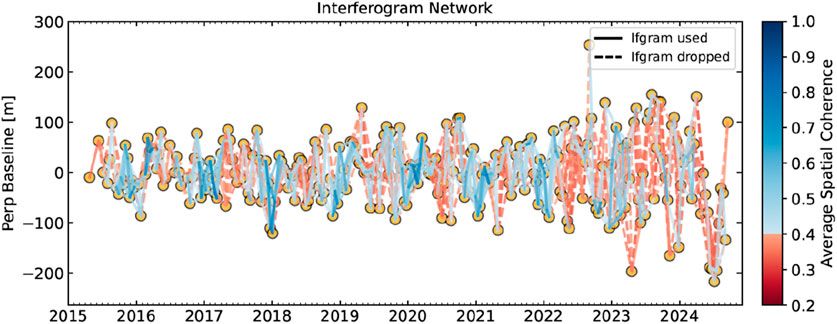
Figure 5. Time-space baseline diagram.
3.2 Coherence analysis of open pit
As shown in Figure 6, the coherence coefficient (γ) is calculated based on the interferometric phase information from multi-temporal SAR images, with coherence values ranging from 0.45 to 0.96, exhibiting a clear spatial gradient characteristic. High coherence areas (γ > 0.75) are mostly distributed on relatively stable surfaces in the mining area, where the quality of the interferometric data is excellent and can serve as reference points for ground subsidence monitoring. Moderate coherence areas (0.6≤γ ≤ 0.75) are located in the central and lower parts of the mining site. Due to the influence of the monitoring angle of the terrain, there is a moderate decrease in coherence, but it still possesses certain potential for interferometric processing. Low coherence areas (0.45≤γ ≤ 0.6) are found at the bottom of the mining site, specifically in the pit bottom area. Affected by complex terrain conditions, the data noise is relatively high, and it needs to be eliminated in subsequent processing to improve the accuracy of deformation monitoring.
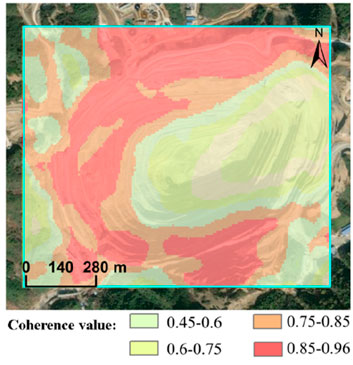
Figure 6. Stope coherence distribution map.
3.3 Time series analysis of stope deformation from 2015 to 2024
As shown in Figures 7–9, the surface settlement in the study area was monitored from 2015 to 2024 using SBAS-InSAR technology, and the maps of cumulative settlement change characteristics along the line-of-sight (LOS) direction were obtained. The monitoring results show that the quarry area exhibits significant spatial and temporal differential deformation characteristics during this period. Negative values indicate subsidence deformation away from the satellite and positive values indicate uplift deformation towards the satellite.
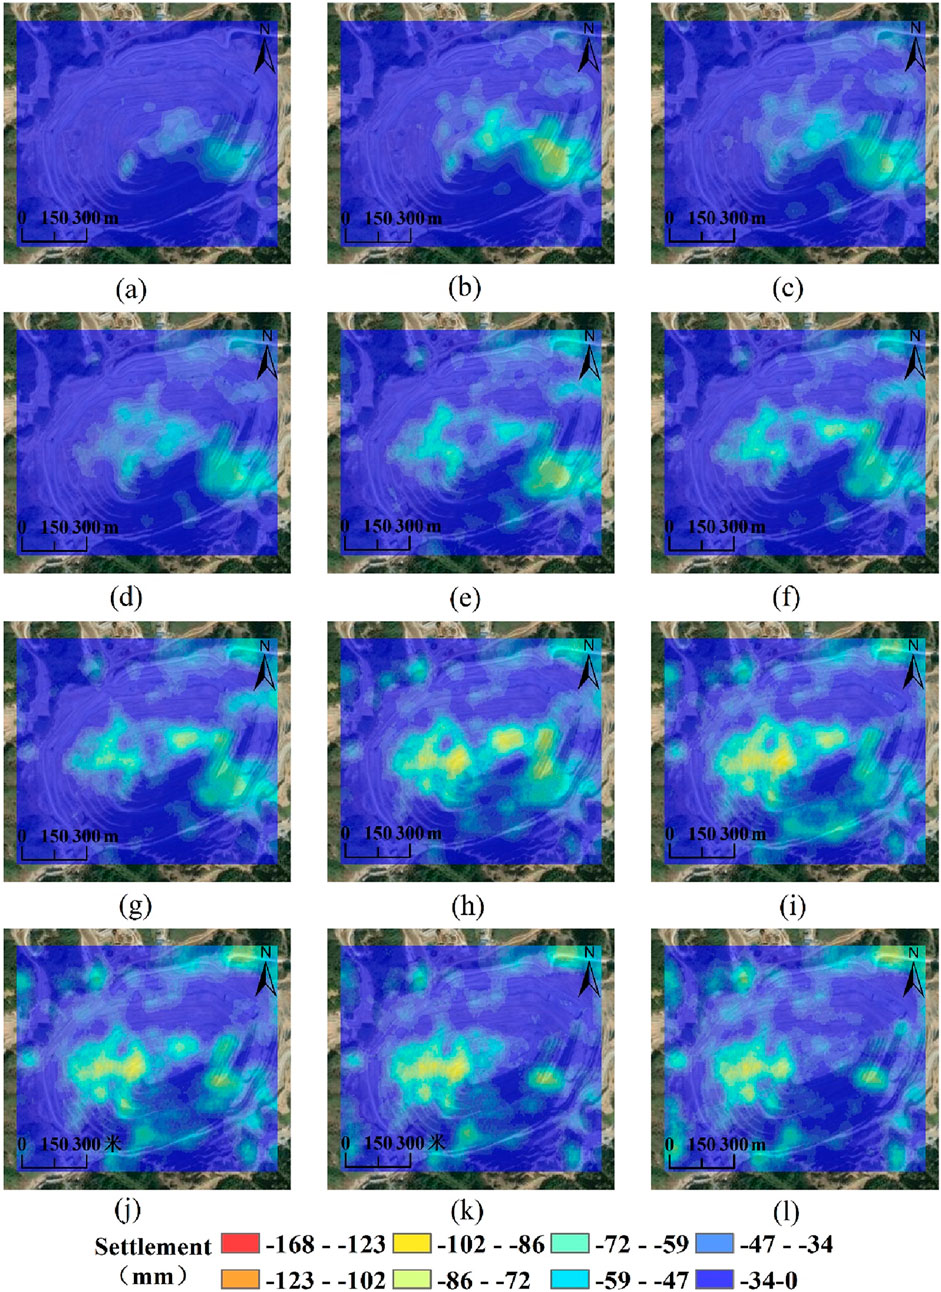
Figure 7. Map of changes in surface settlement at the quarry from June 2015 to December 2018.(a) 2015-06-12. (b) 2015-08-11. (c) 2015-12-21. (d) 2016-04-07. (e) 2016-08-29. (f) 2016-12-27. (g) 2017-04-02. (h) 2017-08-12. (i) 2017-12-22. (j) 2018-04-09. (k) 2018-08-07. (l) 2018-12-29.
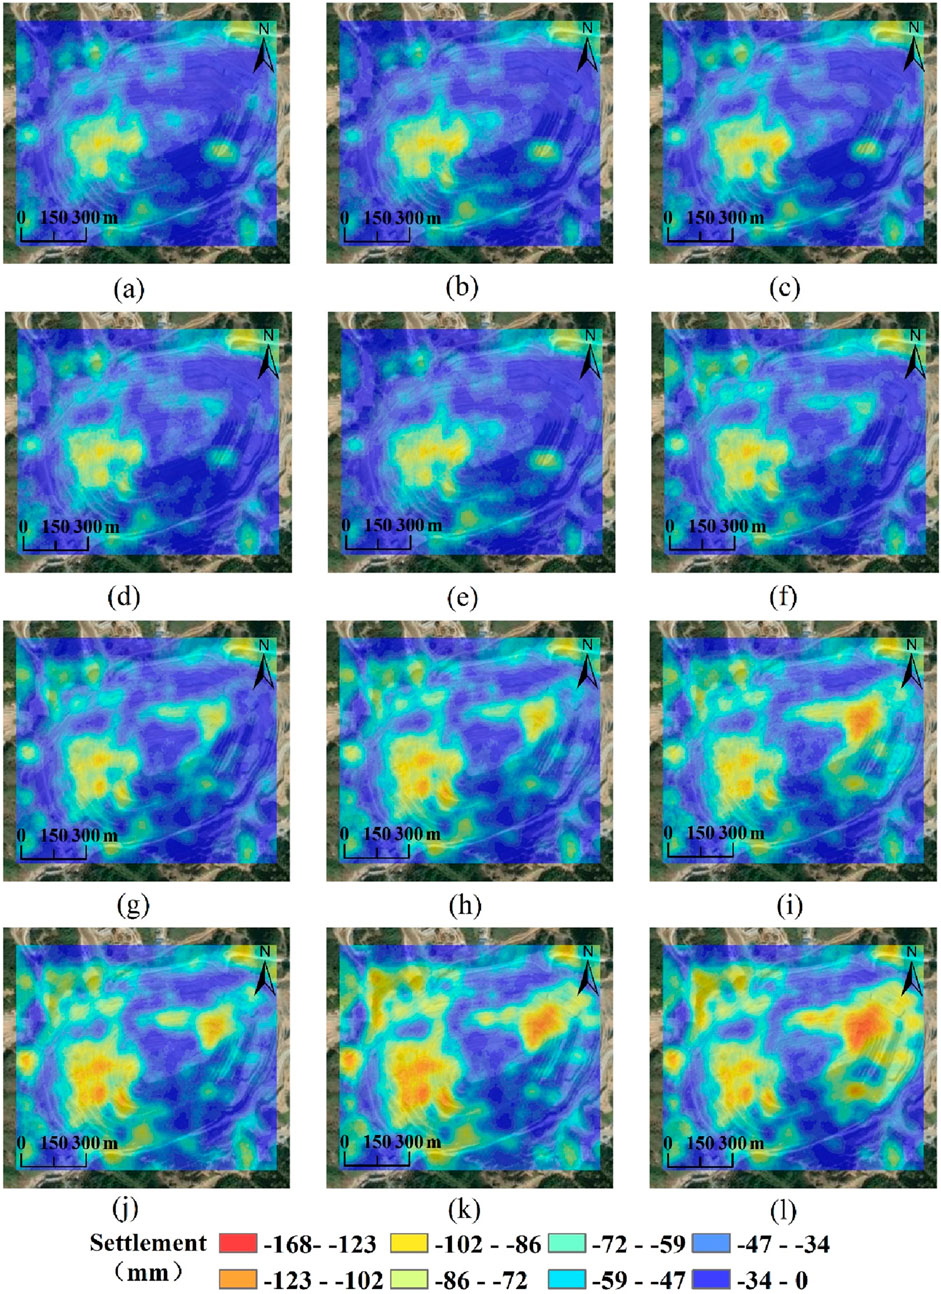
Figure 8. Map of changes in quarry surface settlement from April 2019 to December 2022. (a) 2019-04-04. (b) 2019-08-02. (c) 2019-12-12. (d) 2020-04-10. (e) 2020-08-20. (f) 2020-12-30. (g) 2021-04-05. (h) 2021-08-03. (i) 2021-12-13. (j) 2022-04-12. (k) 2022-08-22. (l) 2022-12-20.
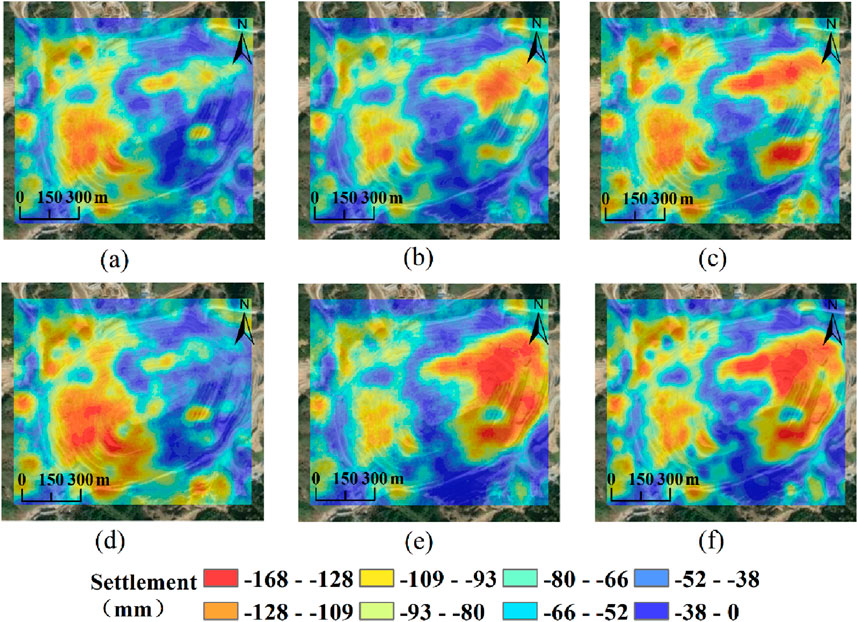
Figure 9. Changes in surface settlement at the quarry from April 2023 to September 2024.(a) 2023-04-07. (b) 2023-08-05. (c) 2023-12-27. (d) 2024-04-01. (e) 2024-06-12. (f) 2024-09-16.
The deformation of the mining area is primarily characterized by subsidence, with the amount of subsidence accumulating and intensifying year by year. The most significant subsidence is observed in the steep high slopes in the eastern part of the mining area, with a maximum subsidence of −168 mm, indicating a strong impact of mining activities on surface deformation. Figures 7a–i show that from 2015 to early 2017, the range of deformation in the mining area was relatively small, mainly concentrated in the bottom of the mining pit, with a maximum subsidence of about −72 mm. Starting in 2018, the range of deformation gradually expanded, and the overall subsidence significantly increased, with the maximum subsidence reaching −110 mm in 2018, and the subsidence area spreading from the bottom of the mining pit to the surrounding areas, as shown in Figures 7j–l. Figures 8d–l indicate that from 2020 to 2022, significant subsidence deformation occurred in various stepped areas of the mining site, with maximum subsidence exceeding −130 mm, and the area of subsidence further expanded. In 2023 and 2024, the deformation in the mining area reached its peak during the monitoring period, at −168 mm, primarily distributed in the steep high slope areas of the mining site, as shown in Figures 9a–f.
The analysis results based on the SBAS-InSAR method reveal the patterns of subsidence deformation and spatial distribution of the deformation areas. This provides valuable data on subsidence regions and deformation characteristics, which can support the study of rock layer instability patterns and moisture content evolution during the transition from open-pit to underground mining under heavy rainfall conditions.
4 Discrete element numerical simulation analysis
In conjunction with the engineering report, subsidence and deformation data obtained from the previous SBAS-InSAR method were integrated with parameters such as slope morphology, rock layer characteristics, and underground mining methods. Using MatDEM software, a three-dimensional numerical model of the terrain in the study area was established based on three-dimensional coordinates. The rainfall was set at 40 mm/h, with an initial moisture content ranging from 14% to 16% and a maximum saturated volumetric moisture content of 60%. The fundamental equation for moisture transfer, governed by the formulas from Chapter 2.2, was implemented to facilitate fluid transmission between solids. The mining method applied is the room-and-pillar mining technique, with room dimensions of φ150 × 250 mm and pillar dimensions of φ100 × 180 mm, and a horizontal dip angle of 7°. This setup aims to explore the instability patterns of rock layers and moisture content evolution in areas experiencing significant subsidence during different mining phases under heavy rainfall conditions.
4.1 Rock mechanics parameters
The heterogeneity, anisotropy, and discontinuity of rock masses result in their strength being a complex combination of block strength and the strength of structural surfaces (Seshagiri Rao, 2020). The presence of fractures, joints, and faults in the rock layers requires a weakening treatment of the rock mechanics parameters obtained from laboratory tests (Table 2). Based on the Geological Strength Index (GSI) and the generalized Hoek-Brown equation, the reduced rock mechanics parameters are presented in Table 3.
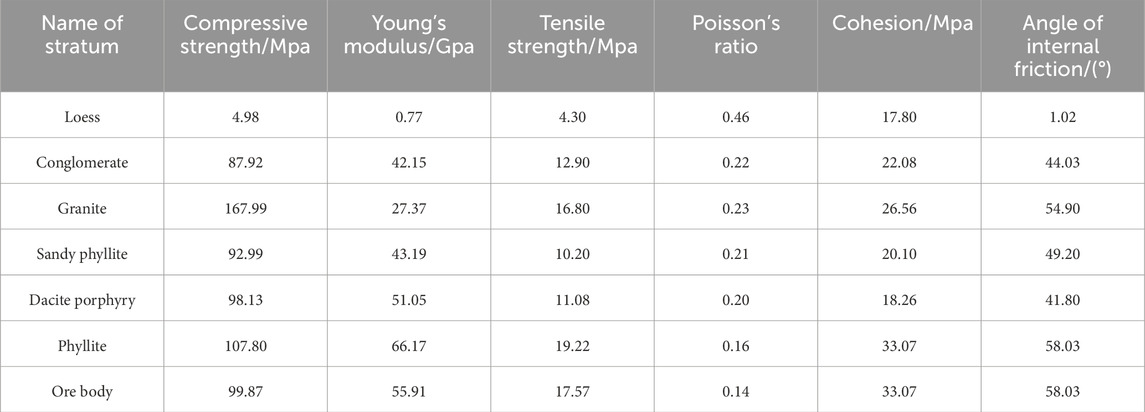
Table 2. Rock mechanics parameters.
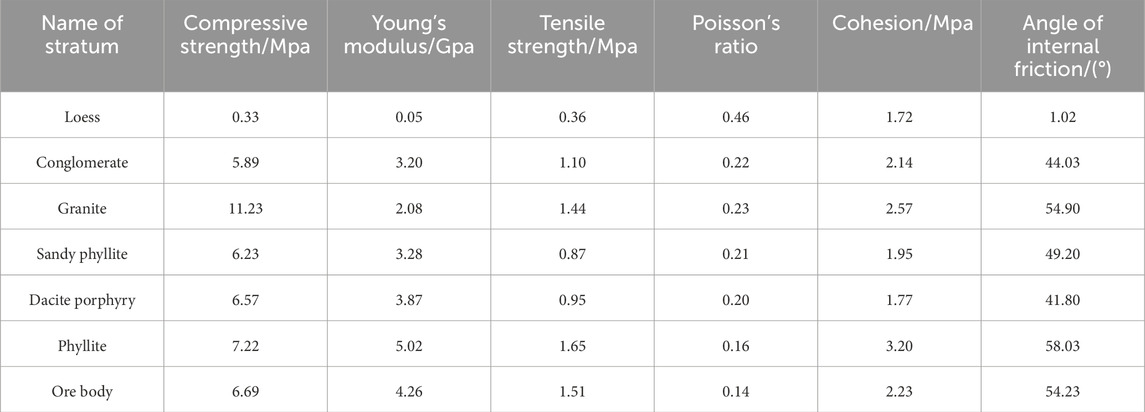
Table 3. Reduced rock mechanics parameters.
MatDEM can transform the macroscopic mechanical properties of rock into the microscopic mechanical parameters of stacked particles, which can make the discrete element stacked materials have specific elastic modulus and strength properties (Yu H. et al., 2023). Using MatDEM built-in macro and micro mechanical properties conversion formula (Liu et al., 2013), the microscopic rock mechanical parameters are obtained as shown in Table 4.
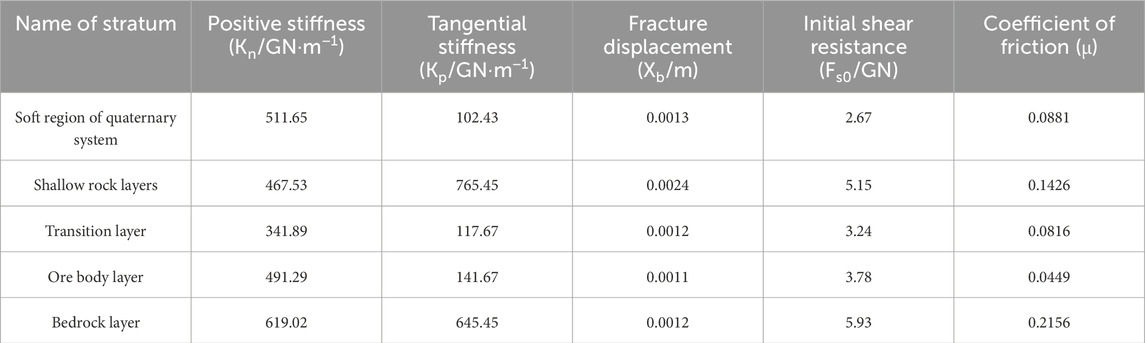
Table 4. Microscopic rock mechanics parameters.
4.2 Build a numerical simulation model
As shown in Figure 10, the discrete element model is composed of a large number of particles, and the diameter and quantity of the particles affect the experimental results. Generally speaking, the smaller the particle diameter and the larger the quantity in the model, the higher the credibility of the test results, but this also places greater demands on computer performance. This numerical model consists of 800,000 particles, with a dispersion coefficient of 0.2 and a particle size distribution of 0.017–0.024 m. The boundary conditions of the model are set to impermeable, and the computer took a total of 96 h to run this model. Monitoring points for volumetric moisture content are established on the longitudinal, cross-sectional, and layer planes, with naming conventions as follows: longitudinal (L1-L5), cross-sectional (S1-S5), and layer (B1-B5). Table 5 presents the key parameters for conducting numerical simulation experiments.
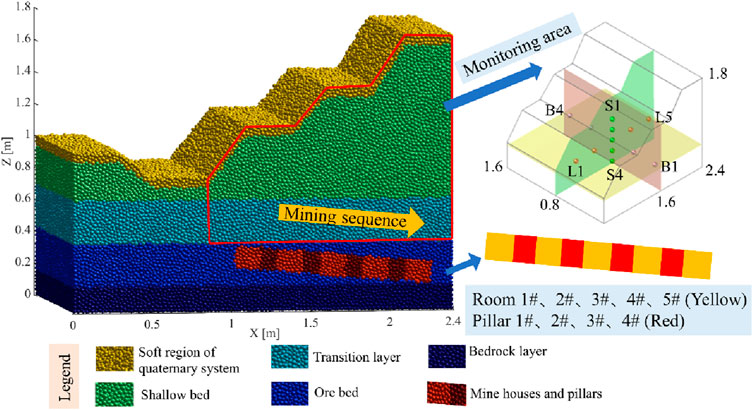
Figure 10. Numerical model of open-pit to underground mining and schematic diagram of monitoring points.

Table 5. Key parameters of numerical simulation.
4.3 Cloud map analysis of rock displacement at different mining stages
In this experiment, the majority of the rock mass displacement is in the form of settlement deformation. To observe this intuitively, it is defined that the settlement amount is a positive value when the rock mass settles downward. The primary causes of rock deformation include: (1) Mining factors of chamber and pillar. Continuous mining causes damage to mining face and overlying rock structure. (2) Volume moisture content change factors. During the processes of seepage and erosion, the mechanical properties of the rock are weakened, leading to the formation of numerous new cracks and the development of fissures, which create new seepage pathways, thereby enhancing the weakening effect of water on the geomechanical properties (Liu et al., 2024; Wang et al., 2024).
Rock shape variable refers to the displacement difference before and after the end of mining, which represents the displacement caused by mining, and the direction is vertical downward. In Figures 11a, b, after the completion of mining in Chamber 1#, the deformation in the mining area is minimal, with a maximum deformation of 0.025 m. The slopes remain stable, with no occurrence of particle sliding or falling. In Figure 11c, after the mining of Chamber 2#, the deformation in the Chamber 1# area increases, with a maximum deformation of 0.032 m. This indicates that rock layer damage has a transmissive nature. The formation of mining Chamber 2# creates a mining area, and the surrounding rock layers need to bear more overburden weight, resulting in the continued increase of deformation in the mined-out area of Chamber 1# due to the impact of subsequent mining. As mining progresses to Chamber 3# as shown in Figure 11d, a “triangular” rock movement zone develops upward, with Chambers 1#, 2#, and 3# forming the base. In this area, deformation increases from top to bottom, reaching a maximum deformation of 0.045 m. During this stage, deformation occurs in the slopes of the mining area. Analysis using the controlled variable method indicates that the mining of Chambers 1#, 2#, and 3# contributes to surface deformation due to the transmissive nature of rock destruction. As shown in Figures 11e,f, after the mining of Chambers 4# and 5#, significant changes occur in the overburden and surface. The “triangular” rock movement zone expands further, connecting upward to the surface and downward to the mined areas and pillars. The stepwise deformation of the slopes increases gradually, with particle sliding occurring at the top of the steps.
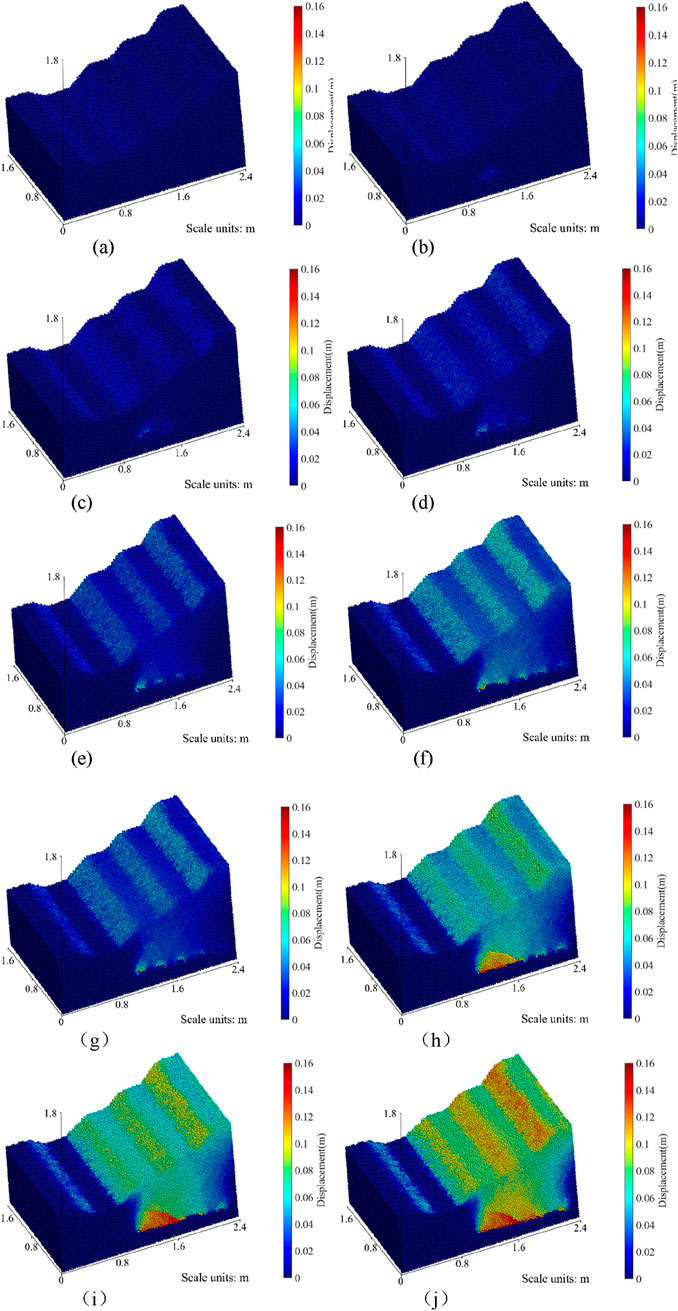
Figure 11. (a–j) Maps of rock displacement in different mining stages. (a) Unmined state. (b) Chamber 1# mining. (c) Chamber 2# mining. (d) Chamber 3# mining. (e) Chamber 4# mining. (f) Chamber 5# mining. (g) Pillars 1# mining. (h) Pillars 2# mining. (i) Pillars 3# mining. (j) Pillars 4# mining.
During the pillar mining phase, significant changes occur in the overburden and surface, with increasing levels of damage becoming evident. In Figure 11g, after the completion of mining in Pillar 1#, the external shape of the rock layers exhibits minimal deformation changes, although new fractures and voids may have developed internally. Currently, these fractures and voids are insufficient to cause significant deformation of the rock layers. In Figure 11h, after the mining of Pillar 2#, the “triangular” rock movement zone experiences subsidence. The area of rock collapse covers Chambers 1#, 2#, and Pillar 1#, with a maximum deformation of 0.135 m. There is a notable subsidence of the slope steps, with the maximum deformation occurring at the top step. In Figures 11i,j, as the ongoing recovery of the pillars continues, the degree of damage to the overburden and surface increases. After the recovery of Pillar 4#, the “triangular” rock movement zone has spread horizontally to include Chambers 3#, 4#, and Pillar 3#, while vertical expansion has reached the center step, with a maximum deformation of 0.16 m. In fact, the “triangular” rock movement area is essentially a shear slip zone caused by the failure of the stress arch above the mined-out area (Zhang et al., 2021): after the extraction of the coal pillar, the stress redistribution of the overburden forms an arch structure. However, continuous mining causes the stress at the foot of the arch to exceed the limit, leading to the penetration of vertical cracks and horizontal layering, ultimately resulting in triangular shear slip and causing damage to the overburden and the ground surface.
The process of overburden collapse can be divided into three phases: (1) Chamber Mining Phase: In this stage, minor rock falls occur in the overburden mining area, and slight subsidence is observed at various slope levels on the surface. Overall, the degree of deformation in the overburden and surface is minimal, categorizing this period as the “latent deformation phase.” (2) Early Pillar Mining Phase: After the completion of mining in Pillar 1# and Pillar 2#, a “triangular” rock movement zone forms, and significant surface subsidence becomes evident. This is identified as the “explicit deformation phase.” It represents a transitional period where the lack of pillar support leads to considerable damage to internal fractures and voids within the rock layers, causing overburden collapse. (3) Late Pillar Mining Phase: After the completion of mining in Pillar 3# and Pillar 4#, the “triangular” rock movement zone continues to expand, with increasing deformation. Noticeable collapses of the overburden occur, and surface subsidence intensifies, leading to the classification of this stage as the “severe deformation phase.”
4.4 Displacement change rules of monitoring points at different mining stages
Figure 12 illustrates the displacement variation curves for the X-axis monitoring points (L1, L2, L3, L4, L5). The displacement in the mined area is relatively large, with displacements during the chamber mining phase being smaller than those during the pillar recovery phase. Displacements at L1 and L5 are minimal, primarily due to their greater distance from the mining chambers and pillars, resulting in reduced exposure to mining-related effects. In contrast, monitoring points L2, L3, and L4, located directly above the mining area, exhibit significant fluctuations in displacement, clearly affected by mining activities. After the mining of all chambers, the displacements at L2, L3, and L4 are 0.044 m, 0.028 m, and 0.025 m, respectively, with average displacement rates of 0.0088 m/stage, 0.0056 m/stage, and 0.005 m/stage for each chamber. Following the pillar mining, the displacements at L2, L3, and L4 increase to 0.095 m, 0.093 m, and 0.083 m, with average displacement rates of 0.0127 m/stage, 0.0162 m/stage, and 0.0145 m/stage for each pillar. The red dashed circle indicates that point L1 experiences a subsidence phenomenon during the mining of Pillars 3 and 4. This is likely influenced by mining activities, where regional stresses lead to localized uplift.
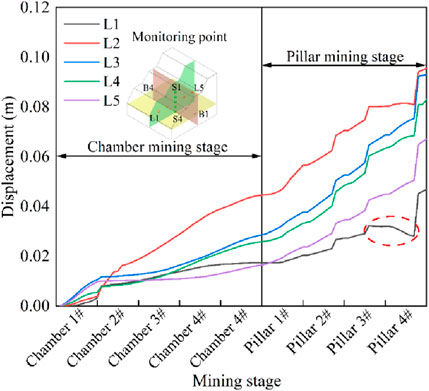
Figure 12. Displacement changes of X-axis monitoring points.
As shown in Figure 13, the displacement magnitudes and changes at each monitoring point are relatively consistent, demonstrating synchronous variations. This is primarily due to the alignment of the monitoring points parallel to Chamber 3#, which experiences similar impacts from the different mining phases. The displacement changes indicate that the displacements during the chamber mining phase are smaller than those during the pillar recovery phase.
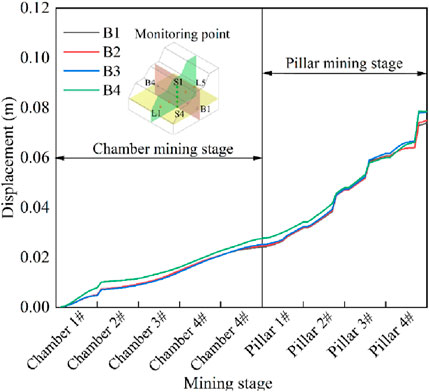
Figure 13. Displacement change of Y-axis monitoring points.
Figure 14 illustrates that monitoring points S1, S2, S3, and S4 are arranged from the surface downward into the overburden. The observed pattern reveals that the displacements at monitoring points deeper in the rock layers are greater than those at the surface monitoring points.
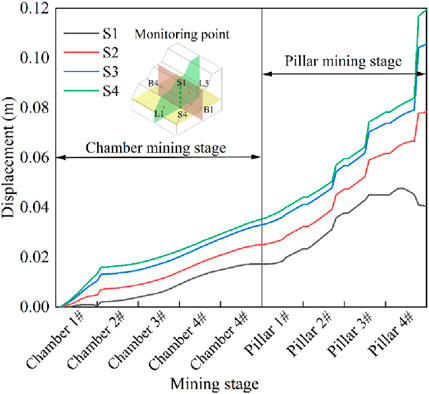
Figure 14. Displacement change of Z-axis monitoring point.
4.5 Variation of rock water content at different mining stages
Figure 15 presents the cloud diagrams of volumetric water content variations in the longitudinal, horizontal, and cross-sectional views. The stability of the rock layers is closely linked to changes in volumetric water content. Sudden changes in water content indicate that the internal fractures and voids within the rock layers have accumulated to a significant extent, compromising the internal structure’s ability to support the overburden, leading to a tendency for collapse. As previously analyzed, after the completion of mining in Chamber 3#, a “triangular” rock movement zone forms, with the volumetric water content in the mining area at 21.5%. Following the completion of mining in Chamber 5#, the “triangular” rock movement zone expands to the external slopes, resulting in a volumetric water content of 24.6% in the affected area. After the mining of Pillar 2#, the “triangular” rock movement zone experiences collapse, leading to significant structural damage and an increase in volumetric water content to 40.3%. Finally, after the completion of mining in Pillar 4#, a widespread collapse occurs in the “triangular” rock movement zone, with pronounced subsidence in the slopes, resulting in a volumetric water content of 44.8% within the mining area.
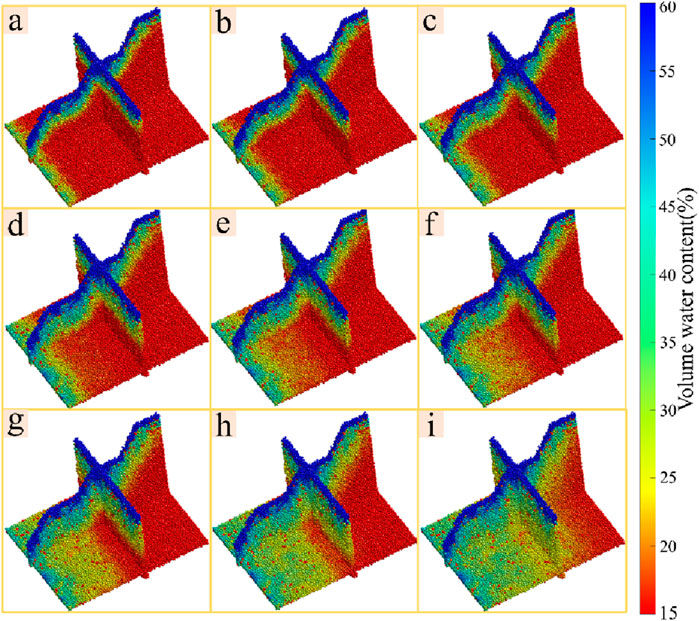
Figure 15. Cloud map of volume water content change in vertical, plane and cross section. (a) Chamber 1# mining. (b) Chamber 2# mining. (c) Chamber 3# mining. (d) Chamber 4# mining. (e) Chamber 5# mining. (f) Pillars 1# mining. (g) Pillars 2# mining. (h) Pillars 3# mining. (i) Pillars 4# mining.
This is a revelation: the sudden change in volumetric water content is mainly due to the formation of fissures and subsidence cracks caused by underground mining, which accelerates water seepage and transport, firstly leading to local rock layer instability, and the unstable area can promote water seepage and transport. This is of guiding significance in preventing the formation of subsidence disasters. With the advancement of mining, the rock layer as a whole remains stable, but the deformation of the rock layer in the local area, which is often difficult to observe from the surface, can be monitored through the change of volumetric water content to monitor the deformation and the generation of unstable areas.
4.6 Volumetric water content, matrix suction and permeability coefficient vary with each other
Figures 16a, b are scatter plots of volumetric water content θ against matric potential ψ and permeability coefficient kr, respectively, calculated using Equations 8, 9. The red curves represent the corresponding fitted curves. Equations 10, 11 are fitting functions. Based on these functions, the matrix suction and permeability coefficient can be obtained from the volumetric water content measured on-site, providing a scientific basis for safe production.
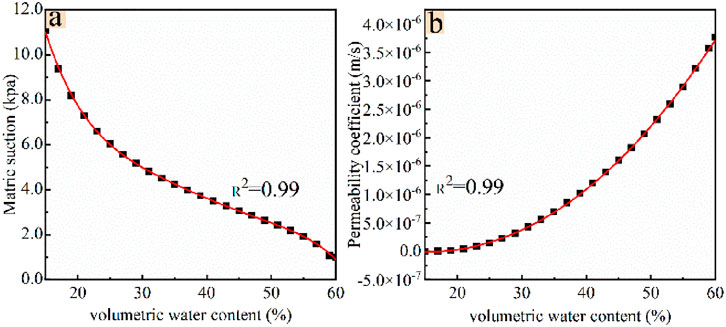
Figure 16. Scatter plot and fitted curve of volumetric water content θ—matric suction ψ, relative permeability coefficient Kr. (a) θ—ψ. (b) θ—Kr.
Fitting formula:
As shown in Figure 16a, when the volumetric water content is at 20%, the rock mass is in a dry state, and its matric suction remains at a high level, approximately 11.2 kPa, indicating good structural stability of the rock mass. As mining activities progress, the volumetric water content of the rock layer shows a significant increasing trend; for example, the water content of mining Chamber 3# at the end of mining is 21.5%, while that of mining Pillar 4# at the end of recovery is 44.8%. This corresponds to a significant decrease in matric suction from 8.2 kPa to 3 kPa. The essence of matric suction is the capillary tension of the pore liquid within the rock mass (Schmitt et al., 1994). When its value drops below the critical threshold of 3 kPa, it indicates that the capillary framework support within the rock mass is essentially lost, leading to a significant weakening of the rock mass’s shear strength. The interaction between volumetric water content and permeability coefficient exhibits completely different characteristics, as shown in Figure 16b. When the volumetric water content increases from 20% to 60%, the permeability coefficient surges from an initial value of 6.15 × 10⁻¹⁰ m/s to 3.71 × 10⁻⁶ m/s, indicating the expansion effect of increased water content on the flow pathways (Simon and Collison, 2001; Wu et al., 2021).
In summary, as the water content continues to increase, the suction of the rock mass matrix shows a significant downward trend, which directly leads to a decrease in the shear strength of the rock mass, resulting in displacement or even collapse of the overlying rock. It is noteworthy that the decay of matrix suction not only weakens the mechanical properties of the rock mass but also promotes the expansion and development of the fracture network, a process that further increases the permeability coefficient of the rock mass. The increase in the permeability coefficient accelerates the movement of moisture within the rock mass, and the intensified movement of moisture in turn leads to a continuous increase in the volumetric water content of the rock mass, thereby forming a mutually reinforcing vicious cycle.
5 Conclusion
This study focuses on the subsidence phenomenon observed in a certain mine in Jiangxi Province, utilizing SBAS-InSAR technology to identify and monitor surface subsidence in the research area. It reveals the patterns and spatial distribution characteristics of subsidence, investigating the instability patterns of rock layers and the evolution of water content during the transition from open-pit to underground mining under heavy rainfall conditions. The relationships among volumetric water content, matrix suction, and permeability coefficient are established. The main conclusions are as follows.
1. Accurate Identification: SBAS-InSAR technology can effectively identify and delineate the subsidence areas in mining fields. The deformation in the mining area is primarily characterized by subsidence, which is currently in an accelerated deformation phase, with the maximum subsidence reaching −168 mm, located in the steep eastern slope area of the mining field.
2. Impact of Mining Activities: Mining activities have a significant impact on surface deformation, exhibiting a clear positive correlation. From 2015 to 2018, subsidence deformation was relatively slow, while from 2019 to 2024, with the continuous advancement of underground mining, surface subsidence became evident. From 2015 to 2024, more than 50% of the area in the mining zone experienced cumulative settlement deformation exceeding 75 mm.
3. External Result of Rock Layer Changes: Surface subsidence is an external manifestation of deep rock layer deformation and abrupt changes in water content. The mining of chambers and pillars leads to the development of rock layer pores and fractures, further affecting changes in volumetric water content. The volumetric water content in the mining area was 40.3% at the first occurrence of rock layer collapse and increased to 44.8% during large-scale collapses.
4. Displacement in Affected Areas: The displacement in the mining-affected rock layers is significant, with a maximum displacement of 0.095 m observed in the area of Pillar 2. Displacement during the chamber mining phase is less than that during the pillar recovery phase, with the latter causing the most severe damage to the rock layers.
5. The increase in volumetric water content of rock layers is one of the reasons for the instability of the rock layers. As water content increases, matrix suction gradually decreases to a limiting value of 1 kPa, while the permeability coefficient increases to 3.71 × 10⁻⁶ m/s, leading to occurrences of rock layer collapse.
Data availability statement
The original contributions presented in the study are included in the article/supplementary material, further inquiries can be directed to the corresponding author.
Author contributions
JG: Funding acquisition, Methodology, Resources, Writing–original draft, Writing – review and editing. CL: Data curation, Formal Analysis, Software, Writing – original draft. XL: Formal Analysis, Software, Validation, Writing – original draft. YW: Methodology, Resources, Supervision, Writing – review and editing. XnW: Conceptualization, Validation, Writing – review and editing. XaW: Conceptualization, Funding acquisition, Methodology, Writing – review and editing.
Funding
The author(s) declare that financial support was received for the research and/or publication of this article. This work was funded by the China Postdoctoral Science Foundation Funded Project (2022M722924) and the National Natural Science Foundation of China (52364013). Funder The Design Theory and Engineering Technology for Intensive BlockBased High-Strength Low-Carbon Mining in Ultra-Large Scale Open-Pit Mine (2023YFC2907301) to XaW.
Conflict of interest
Authors JG, CL, YW, XnW, and XaW were employed by Sinosteel Maanshan General Institute of Mining Research Co. Ltd.
The remaining authors declare that the research was conducted in the absence of any commercial or financial relationships that could be construed as a potential conflict of interest.
Correction note
A correction has been made to this article. Details can be found at: 10.3389/feart.2025.1712138.
Generative AI statement
The author(s) declare that no Generative AI was used in the creation of this manuscript.
Publisher’s note
All claims expressed in this article are solely those of the authors and do not necessarily represent those of their affiliated organizations, or those of the publisher, the editors and the reviewers. Any product that may be evaluated in this article, or claim that may be made by its manufacturer, is not guaranteed or endorsed by the publisher.
References
An, P., Yong, R., Wang, C., Jia, S., and Fang, K. (2024). Utilizing crowdsourced data for timely investigation of catastrophic landslide accidents: a case study of the coal mine collapse in inner Mongolia, China. Bull. Eng. Geol. Environ. 83, 354. doi:10.1007/s10064-024-03848-x
Berardino, P., Fornaro, G., Lanari, R., and Sansosti, E. (2002). A new algorithm for surface deformation monitoring based on small baseline differential SAR interferograms. IEEE Trans. geoscience remote Sens. 40, 2375–2383. doi:10.1109/tgrs.2002.803792
Bouwer, H. (1964). Unsaturated flow in ground-water hydraulics. J. Hydraulics Div. 90, 121–144. doi:10.1061/jyceaj.0001098
Brooks, R. H., and Corey, A. T. (1963). Hydraulic properties of porous media and their relationship to drainage design. American Society of Agricultural Engineers.
Catalão, J., Nico, G., Hanssen, R., and Catita, C. (2011). Merging GPS and atmospherically corrected InSAR data to map 3-D terrain displacement velocity. IEEE Trans. Geoscience Remote Sens. 49, 2354–2360. doi:10.1109/tgrs.2010.2091963
Chen, Y., Dong, X., Qi, Y., Huang, P., Sun, W., Xu, W., et al. (2023). Integration of DInSAR-PS-stacking and SBAS-PS-InSAR methods to monitor mining-related surface subsidence. Remote Sens. 15, 2691. doi:10.3390/rs15102691
Childs, E. C., and Collis-George, N. (1950). The permeability of porous materials. Proc. R. Soc. Lond. Ser. a. Math. Phys. Sci. 201, 392–405. doi:10.1098/rspa.1950.0068
Fernández, P. R., Granda, G. R., Krzemień, A., Cortés, S. G., and Valverde, G. F. (2020). Subsidence versus natural landslides when dealing with property damage liabilities in underground coal mines. Int. J. Rock Mech. Min. Sci. 126, 104175. doi:10.1016/j.ijrmms.2019.104175
Fredlund, D. G., Xing, A., and Huang, S. (1994). Predicting the permeability function for unsaturated soils using the soil-water characteristic curve. Can. Geotechnical J. 31, 533–546. doi:10.1139/t94-062
Geng, J., Wang, Z., Lan, X., Li, X., and Zhang, D. (2023). Numerical simulation and safety distance analysis of slope instability of ionic rare earth tailings in different rainy seasons. Geomatics, Nat. Hazards Risk 14, 2277127. doi:10.1080/19475705.2023.2277127
Guzy, A., and Witkowski, W. T. (2021). Land subsidence estimation for aquifer drainage induced by underground mining. Energies 14, 4658. doi:10.3390/en14154658
Lan, X., Wang, Y., Wang, X., and Geng, J. (2025). Study on the destabilisation pattern and volumetric water content evolution characteristics of underground mining rock formations under heavy rainfall conditions. Water (20734441), 17. doi:10.3390/w17020136
Li, Q., Wang, Y., Hou, D., Jiang, S., Gong, B., and Li, X. (2025a). Simulating the failure mechanism of high-slope angles under rainfall-mining coupling using MatDEM. Water 17, 414. doi:10.3390/w17030414
Li, Q., Wang, Y., Li, X., Tang, S., Gong, B., and Jiang, S. (2025b). Evolutionary characteristics of the fracture network in rock slopes under the combined influence of rainfall and excavation. Bull. Eng. Geol. Environ. 84, 47. doi:10.1007/s10064-025-04084-7
Li, S., Xu, W., and Li, Z. (2022). Review of the SBAS InSAR Time-series algorithms, applications, and challenges. Geodesy Geodyn. 13, 114–126. doi:10.1016/j.geog.2021.09.007
Li, S., Zhao, Z., Hu, B., Yin, T., Chen, G., and Chen, G. (2023). Three-dimensional simulation stability analysis of slopes from underground to open-pit mining. Minerals 13, 402. doi:10.3390/min13030402
Li, Y., Zuo, X., Xiong, P., You, H., Zhang, H., Yang, F., et al. (2022). Deformation monitoring and analysis of Kunyang phosphate mine fusion with InSAR and GPS measurements. Adv. Space Res. 69, 2637–2658. doi:10.1016/j.asr.2021.12.051
Liu, C., Liu, H., and Zhang, H. (2021). MatDEM-fast matrix computing of the discrete element method. Earthq. Res. Adv. 1, 100010. doi:10.1016/j.eqrea.2021.100010
Liu, C., Pollard, D. D., and Shi, B. (2013). Analytical solutions and numerical tests of elastic and failure behaviors of close-packed lattice for brittle rocks and crystals. J. Geophys. Res. Solid Earth 118, 71–82. doi:10.1029/2012jb009615
Liu, X., Chen, J., Liu, B., Wang, S., Liu, Q., and Luo, J. (2024). Effects of seepage pressure on the mechanical behaviors and microstructure of sandstone. J. Rock Mech. Geotechnical Eng. 16, 2033–2051. doi:10.1016/j.jrmge.2023.09.010
Ma, S., Qiu, H., Yang, D., Wang, J., Zhu, Y., Tang, B., et al. (2023). Surface multi-hazard effect of underground coal mining. Landslides 20, 39–52. doi:10.1007/s10346-022-01961-0
Ma, Y., Feng, S., Zhan, H., Liu, X., Su, D., Kang, S., et al. (2011). Water infiltration in layered soils with air entrapment: modified Green-Ampt model and experimental validation. J. Hydrologic Eng. 16, 628–638. doi:10.1061/(asce)he.1943-5584.0000360
Michalowski, R. L., and Park, D. (2020). Stability assessment of slopes in rock governed by the Hoek-Brown strength criterion. Int. J. Rock Mech. Min. Sci. 127, 104217. doi:10.1016/j.ijrmms.2020.104217
Necula, N., Niculiță, M., Fiaschi, S., Genevois, R., Riccardi, P., and Floris, M. (2021). Assessing urban landslide dynamics through multi-temporal InSAR techniques and slope numerical modeling. Remote Sens. 13, 3862. doi:10.3390/rs13193862
Schmitt, L., Forsans, T., and Santarelli, F. J. (1994). “Shale testing and capillary phenomena,” in International journal of rock mechanics and mining sciences and geomechanics abstracts (Elsevier), 411–427.
Seshagiri Rao, K. (2020). Characterization, modelling and engineering of rocks and rockmasses. Indian Geotechnical J. 50, 1–95. doi:10.1007/s40098-020-00414-6
Simon, A., and Collison, A. J. (2001). Pore-water pressure effects on the detachment of cohesive streambeds: seepage forces and matric suction. Earth Surf. Process. Landforms 26, 1421–1442. doi:10.1002/esp.287
Singhroy, V., Li, J., and Charbonneau, F. (2015). High resolution rapid revisit InSAR monitoring of surface deformation. Can. J. Remote Sens. 41, 458–472. doi:10.1080/07038992.2015.1104638
Sun, H., Peng, H., Zeng, M., Wang, S., Pan, Y., Pi, P., et al. (2023). Land subsidence in a coastal city based on SBAS-InSAR monitoring: a case study of Zhuhai, China. Remote Sens. 15, 2424. doi:10.3390/rs15092424
Van den Putte, A., Govers, G., Leys, A., Langhans, C., Clymans, W., and Diels, J. (2013). Estimating the parameters of the Green–Ampt infiltration equation from rainfall simulation data: why simpler is better. J. Hydrology 476, 332–344. doi:10.1016/j.jhydrol.2012.10.051
Wang, C., Zhang, D., Tan, D., Ye, J., Wang, X., Ren, F., et al. (2024). Investigation on seepage evolution property of surrounding rock under the tunneling and water surge. Tunn. Undergr. Space Technol. 153, 105970. doi:10.1016/j.tust.2024.105970
Wang, H., Li, K., Zhang, J., Hong, L., and Chi, H. (2022). Monitoring and analysis of ground surface settlement in mining clusters by SBAS-InSAR technology. Sensors 22, 3711. doi:10.3390/s22103711
Wu, J., Jia, C., and Zhang, L. W. (2021). Expansion of water inrush channel by water erosion and seepage force. Int. J. Geomechanics 21, 04021121. doi:10.1061/(asce)gm.1943-5622.0001985
Yang, F., An, Y., Ren, C., Xu, J., Li, J., Li, D., et al. (2023). Monitoring and analysis of surface deformation in alpine valley areas based on multidimensional InSAR technology. Sci. Rep. 13, 12896. doi:10.1038/s41598-023-39677-3
Yang, T. H., Liu, J., Zhu, W. C., Elsworth, D., Tham, L. G., and Tang, C. A. (2007). A coupled flow-stress-damage model for groundwater outbursts from an underlying aquifer into mining excavations. Int. J. Rock Mech. Min. Sci. 44, 87–97. doi:10.1016/j.ijrmms.2006.04.012
Yang, Z., Li, Z., Zhu, J., Wang, Y., and Wu, L. (2020). Use of SAR/InSAR in mining deformation monitoring, parameter inversion, and forward predictions: a review. IEEE Geoscience Remote Sens. Mag. 8, 71–90. doi:10.1109/mgrs.2019.2954824
Yi, S., Zhang, Y., Yi, H., Li, X., Wang, X., Wang, Y., et al. (2022). Study on the instability activation mechanism and deformation law of surrounding rock affected by water immersion in goafs. Water 14, 3250. doi:10.3390/w14203250
Yu, D., Huang, Q., Kang, X., Liu, Y., Chen, X., Xie, Q., et al. (2023). The unsaturated seepage process and mechanism of internal interfaces in loess-filled slopes during intermittent rainfall. J. Hydrology 619, 129317. doi:10.1016/j.jhydrol.2023.129317
Yu, H., Liu, Z., Zhang, Y., Luo, T., Tang, Y., Zhang, Q., et al. (2023). The disintegration mechanism analysis of soft rock due to water intrusion based on discrete element method. Comput. & Geosciences 171, 105289. doi:10.1016/j.cageo.2022.105289
Zhang, G., Li, Q., Zhang, Y., and Du, F. (2021). Failure characteristics of roof in working face end based on stress evolution of goaf. Geomechanics Geophys. Geo-Energy Geo-Resources 7, 53–22. doi:10.1007/s40948-021-00252-7
Zhang, Z., Wang, C., Wang, M., Wang, Z., and Zhang, H. (2018). Surface deformation monitoring in Zhengzhou city from 2014 to 2016 using time-series InSAR. Remote Sens. 10, 1731. doi:10.3390/rs10111731
Keywords: SBAS-InSAR, MatDEM, surface settlement, deformation of bed, volumetric water content
Citation: Geng J, Liu C, Lan X, Wang Y, Wang X and Wang X (2025) Research on historical deformation and rock layer water content variation in large open-pit mining areas based on SBAS and MatDEM. Front. Earth Sci. 13:1618116. doi: 10.3389/feart.2025.1618116
Received: 25 April 2025; Accepted: 26 June 2025;
Published: 14 July 2025; Corrected: 14 October 2025.
Edited by:
Hong-Hu Zhu, Nanjing University, ChinaCopyright © 2025 Geng, Liu, Lan, Wang, Wang and Wang. This is an open-access article distributed under the terms of the Creative Commons Attribution License (CC BY). The use, distribution or reproduction in other forums is permitted, provided the original author(s) and the copyright owner(s) are credited and that the original publication in this journal is cited, in accordance with accepted academic practice. No use, distribution or reproduction is permitted which does not comply with these terms.
*Correspondence: Xiaobing Wang, d2FuZ194aWFvYmluZzIwMjRAMTYzLmNvbQ==