 Ziyun Chen1,2*
 Meiben Gao
- 1College of Environment and Civil Engineering, Chengdu University of Technology, Chengdu, China
- 2Sichuan Communication Surveying and Design Institute Co., Ltd., Chengdu, China
- 3School of Emergency Management, Xihua University, Chengdu, China
- 4Shanxi Xingtong Engineering Consulting Co., Ltd., Xi’an, China
The problem of the driving source and power mechanism of plate motion remains a major scientific issue in urgent need of resolution. Based on the isostatic hypothesis model proposed by G.B. Airy in 1855, this study puts forward the crustal isostatic model based on the self-weight stress field and the assumption of the dynamic source of plate movement. It is believed that the plate movement in the crustal layer is the result of deep magma activities, and the mode of activity is mainly laminar flow. In terms of the dynamic mechanism, the assumption of the magma flow mechanism is proposed. It is believed that the magma flow is driven by the magma density gradient, and the magma density varies with depth. By using the model and assumptions in this paper, the two mechanical mechanisms of surface rupture and block movement are analyzed. Taking the Chengdu block in Western Sichuan as an example, the correlation between magma flow, regional stress field, large-scale displacement and tectonic activities is analyzed. The analysis results are in good agreement with the actual situation, effectively explaining the morphology and activities of typical fault activity structures in this region. The research results are helpful for people to further understand the tectonic activities of the Earth.
Highlights
• A crustal isostatic model of the self-weight stress field is proposed.
•The original model (in which the density is a constant value) is revised by using the density function, making it more consistent with the reality.
•The controlling factor for the generation of equilibrium is not the buoyancy of the fluid but the self-weight stress.
•The concept of the “stress equilibrium reference surface” is put forward.
1 Introduction
The dynamics sources and mechanisms of crustal regional tectonics activities are important areas of research in Earth science. Dynamics sources typically pertain to the initiation and driving processes that give rise to crustal activities, whereas dynamics mechanisms describe the manner in which these processes take place and impact crustal regional tectonics (Xiang et al., 2025; Rao et al., 2025). This knowledge is crucial for understanding crustal movements and serves as the theoretical foundation for predicting various regional geological activities, holding significant implications for natural disaster assessment, construction site evaluation, and mineral resource exploration, among other applications (Zhang et al., 2011; Teng et al., 2009). As the most widely accepted theory, plate tectonics can sufficiently explain the basic crustal movement modes (Li et al., 2025), and advances in this theory provide the basic framework for understanding the dynamics mechanisms underlying crustal movements. Extensive in-depth research has been conducted based on this theory, leading to great progress. In terms of theoretical research, (1) studies on mantle convection, internal thermodynamics processes of the Earth, and ocean-land interactions are more comprehensive and in-depth (Chen, 2021; Liu and Zhang, 2015; Yue, 2000; Zhao, 2009; Zhang et al., 2025), contributing continuously to the plate tectonics theory (Teng et al., 2014). (2) Proposing and applying large system science concepts and interdisciplinary research ideas have also become a consensus in the academic community for continuously obtaining information on the deep structure and internal processes of the Earth (Ma and Gao, 2004; Zhang et al., 2009; Zheng et al., 2024; Teng et al., 2010; Vries et al., 2017). Great strides have also been made in theoretical validation research (Liu et al., 2004). (1) Obtaining detailed information on the crust and mantle (Zhang et al., 2015) through continuous research on the propagation characteristics of seismic waves (Mei et al., 2020; Zhang and Chen, 2003) helps to infer the internal structure and properties of the Earth (Zhao et al., 2024; Zuo et al., 2017) and provides the foundation for studying the dynamics processes (Li et al., 2005; Qin et al., 2006). Various geophysical methods, including gravimetry (Li, 2016; Luo, 2017; María et al., 2021), magnetometry (Mu, 2023; Zhou et al., 2019; Boukhalfa et al., 2024), gravitational physics (Sun, 1988), and geoelectric surveys (Xi, 2019), can be utilized to investigate the Earth’s internal structure and crustal movements, enabling the determination of the scale, velocity, and direction of crustal movements. (3) Numerous new technologies, such as synthetic aperture radar (SAR) (Maleki and Simkooei, 2024), satellite remote sensing (Dani et al., 2021), and geophysical exploration, provide novel tools for crust and mantle detection, allowing crustal movement monitoring on wider scales and generating huge amounts of data on crustal activities. (4) Numerical simulations of the internal physical and chemical processes of the Earth (Li et al., 2021; Ying, 2019), including mantle convection (Tie et al., 1986) and plate interactions, contributed to a more intuitive understanding of the dynamics mechanism of crustal movements. These validation and theoretical research efforts mutually reinforce one another, continuously advancing human cognitive progress. In terms of plate dynamics studies, the mainstream research primarily involves two traditional plus one new model (Yuan, 1978) despite the persisting controversies. Namely, (1) the ridge push model (Liang, 2023a) represented by the seafloor spreading theory (Vincenzo et al., 2023), (2) the stab pull model (Liang, 2021; Chen et al., 2020) represented the subducting slab pull hypothesis, and (3) the gravity slip self-driving model (Liang, 2023b) recently proposed by Chinese scholar Liang Guanghe and others. Liang et al. also proposed a novel continental drift theory, suggesting that the force driving the continuous continental drift is not the persistent seafloor spreading. Instead, they argue that it is the continuous upwelling of magma behind the continental plates that propel their movement, initiating a spontaneous chain reaction. Thus, pioneering researchers have conducted extensive foundational, exploratory, and demonstrative work in this field, significantly advancing our understanding. However, exploring beneath the Earth’s surface is more challenging than reaching the stars, considering the complexity of the deep structure and the limitations of exploration methods. Despite important research advances, the dynamics sources and mechanisms underlying the Earth’s crustal plate movements remain a research hotspot and challenge. For example, the internal deformation of plates, the interaction between plates, and the specific processes are still unclear. Since the continental drift theory was proposed by Wegener in Germany in 1912, H. Hess proposed the concept of seafloor spreading in the early 1960 s, which was supported by a range of geophysical evidence from paleomagnetism, geochronology, and marine geology (Gao et al., 2009; Dai, 2021), gradually forming the theoretical basis for plate tectonics. Despite extensive geophysical and paleontological evidence later on, the dynamics sources and mechanisms underlying plate movements remain major scientific problems that need solving, with many black boxes to clarify. Therefore, this study proposes refined hypotheses based on the isostasy model to explain the geological regional tectonics in the western Sichuan region, aiming to inspire further discussion among peers.
2 Assumption proposal: dynamics sources and mechanisms of plate movements
The isostasy hypothesis is a theoretical model explaining the crustal movements based on the theory of plate tectonics. It assumes that the Earth’s crust is composed of multiple rock plates of different thicknesses and densities, which move relative to the asthenosphere of the mantle due to the thermal convection flows inside the Earth, resulting in crustal material redistribution and topographic changes. The isostasy model can explain geological phenomena such as plate drift activities, orogenic movements, and earthquakes, but certain limitations exist. For example, the density difference assumption is unreasonable, the mantle convection model is inaccurate, the material exchange and interactions between the crust and the mantle are insufficiently considered, the plate boundary dynamics mechanism model is relatively simplified, and the internal movements of the plates are insufficiently considered. Therefore, this study proposes two supplementary assumptions based on the isostasy model to analyze the internal regional tectonics of the plate. The assumptions proposed in this article are termed dynamics mechanism assumptions of plate regional tectonics based on the improved isostasy hypothesis model. The boundary conditions for the proposed assumptions are as follows. The stratigraphic structure is defined, from top to bottom, as the crustal layer, the plastic layer, and the magma layer, with the deformation resistance of each layer characterized by Young’s modulus E, the shear modulus G, and the compression modulus ES, respectively, and the material morphology and deformation resistance within and between these layers are in a gradient state. According to the relevant research results in the literature, these boundary conditions align with the consensus in the academic community.
2.1 Assumption 1: crustal movement mechanisms
Crustal plate movement results from deep magmatic movement (flow). The flowing magma undergoes compression deformation and shear deformation, generating a viscous force between the magma layer and the plastic layer. As a result, the plastic layer undergoes ductile shear deformation, with a ductile shear zone formed within the layer, generating a frictional force with the crustal layer. The frictional force acts on the crustal layer, driving the horizontal crustal movements. However, the enhanced deformation resistance of the crustal layer generates shear stress, leading to intralayer fractures once exceeding the shear strength.
2.1.1 Crustal surface fracture mechanism
According to Assumption 1, the middle plastic layer is simplified, and the fracture mechanism is demonstrated in Figure 1. The magma in layer K flows at the velocity Vk, generating viscous shear stress τk = χ (σk, vk, ηk
(1) With uniform crustal thickness (Figure 1), a visco-frictional force τk1 = χ (σk1, vk1, ηk1 • • •) is generated between crustal layers, which is closely related to the vertical direction self-weight normal stress σ3k = σ3k (y). in its environment, where y is the depth function. Meanwhile, spring-viscoelastic body boundary conditions can be adopted, as the crustal movement is passive. Moreover, Lattice-based modeling of geomaterial deformation offers a microscale analog to the ductile shear mechanisms proposed in our crustal assumptions, which is also canbe used to explain crustal fracture mechanism (Rizvi et al., 2020; Alsabhan et al., 2021). At this time, a unit selected from the crustal layer as the research object follows the compression shear failure deformation mode (Figure 2a), and the deformation failure follows the Mohr-Coulomb strength criterion.
(2) With increasing crustal thickness (Figure 1), the magmatic flow velocity V1 decreases. At this time, the horizontal direction velocity component Vx generates shear stress on the upper crustal layer, and the vertical direction velocity component Vy increases the magnitude of the normal stress σ1 in the environment. This is more likely to cause stress concentration and accelerate the development of reverse faults.
(3) With decreasing crustal thickness (Figure 1), the magmatic flow velocity V1 increases. Similarly, the horizontal direction velocity component Vx generates a shear stress on the upper crustal layer, which is more likely to cause the development of normal faults. However, the vertical direction velocity component Vy reduces the magnitude of the normal stress σ1 in the environment, rendering it less likely for the development of reverse faults.

Figure 1. Analytical model for the crustal surface fracture mechanism assumption.
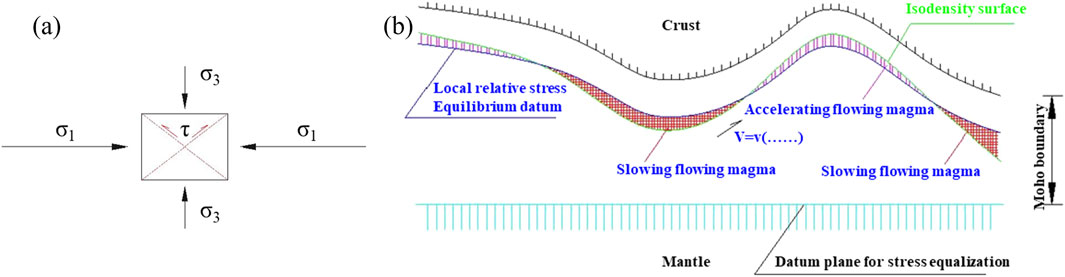
Figure 2. Schematic diagram of the Mohr-Coulomb shear failure mechanical model.
Inference 1: Constructing an isopach map with reference to crustal thickness, centered on the Earth’s core, the direction of magmatic flow is from the thicker regions to the thinner regions, but reverse faults occur in zones with sharp thin-to-thick changes, and normal faults occur in dome center zones with thick-to-thin changes (Figure 2b).
2.1.2 Plate movement mechanism
As shown in Figure 3, a finer division of each layer reveals that the modulus value of each layer has a functional relationship with the depth. Accordingly, the deformation distance L of each layer has a certain functional relationship with the vertical stress σ1, horizontal stress σ3, viscous shear stress of the next microscopic layer τk+1, and modulus of each layer (Equation 1), and the modulus value of liquid, semi-liquid semi-solid, and solid states gradually increases. The deep magmatic flow produces compression and shear deformations over a longer distance, which transmits to the semi-liquid semi-solid region of the upper layer, resulting in ductile shear deformation. However, the deformation range is reduced, which is reduced further when transmitting to the crustal layer. Nevertheless, the stress concentration is intensified, which increases the probability of fracturing and even leads to shear failure when exceeding the shear strength. Therefore, the entire deformation zone is triangular in the profile, and the deformation range of each layer is closely related to its stress state, rock mass (magma) density and material state, shear stress transmitted to the lower layer, modulus value, and burial depth (Equation 2)
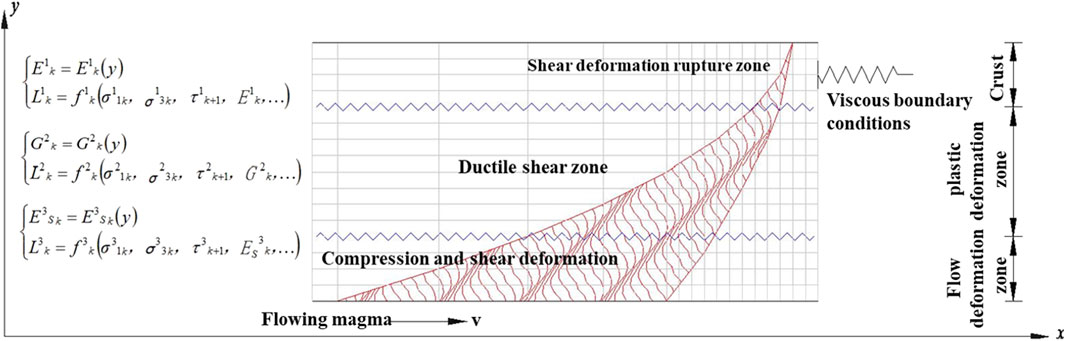
Figure 3. Ductile shear model based on the assumption.
2.2 Assumption 2: dynamics mechanism of magmatic flow
The deep magmatic movement is a flow driven by changes in the magma density gradient. Deep within the Earth, magma exists in a flow state with a certain density gradient. It is melted by high probably, and its tendency to move toward lower-pressure regions generates the flow.
The layers spanning from the crust to the mantle are not two or three relatively uniform density bands but a gradient zone with a certain density gradient due to the gradually increasing confining pressure from the surrounding rock, with gradually increased temperatures. Theoretically, a substance turns into a liquid state when the confining pressure is large enough that the melting point of the substance is exceeded. Admittedly, the liquid under this condition differs greatly from the molten liquid at high temperature and atmospheric pressure, with a greater density than the solid state and instability, flowing toward regions with a lower density and lower confining pressure. Therefore, it naturally moves toward the dome position with a lower crustal thickness, which is the main dynamics mechanism and the internal dynamics mechanism of magmatic flows. This mechanism closes the loop of the theory with the previous inference while explaining the constant crustal thickness changes found through geophysical exploration.
Inference 2: Magmatic movement is driven by flow potential. Specifically, due to the changes in confining pressure as magma flows from high-density (high-confining pressure) regions to low-density (low-confining pressure) regions, the magma density decreases, and the flow velocity increases, which is the main drive. Conversely, the magma density increases, and the flow velocity decreases, which is the passive drive. The magma flows are laminar. Therefore, the density gradient from crust to mantle is constant, and the density at the same depth varies constantly, i.e., the density value in the gradient varies. Where there is a density gradient, there is a flow potential, and the magmatic flow will proceed spontaneously. Such gradient-driven flows in geological materials are supported by numerical modeling efforts (Zarghaam et al., 2018).
3 Theoretical analysis: the improved model based on the G. B. Airy isostasy hypothesis
Numerous geophysical exploration data have confirmed isostasy. The isostasy theory was originally derived from hydrostatic equilibrium and proposed by G. B. Airy in 1855 (Figure 4). It posits that the crust (with a density of 2.67 g/cm3) consists of many rock blocks of different thicknesses but the same density, which floats on the denser plastic magma (with a density of 3.27 g/cm3). The distance between sea level and the ideal magma surface is called normal crustal thickness D (60 km). According to Archimedes’ principle, the mass carried by the same area tends to be equal, and the mass changes above a large area on the ground must be compensated for underground. Therefore, the protruding parts of the thicker crust form mountain roots extending into the mantle layer, and the thinner crust parts under oceans form negative mountain roots, thus achieving gravitational balance. The G. B. Airy hypothesis model believes that the compressive stress at the interface between the upper mantle and the crust is in equilibrium, roughly in a hydrostatic equilibrium state. The theoretical stress under the normal crust and the stress beneath mountain roots and negative mountain roots exhibit huge differences. As the stress magnitude at a negative mountain root is the smallest, the pressure difference causes the magma to flow to the negative mountain root, leading to a shear fracture of the weak part under the thrusting pressure. The magma overflows into the ocean and forms the oceanic crust, and the lateral pressure of magma on the oceanic crust and the physical expansion of the oceanic crust together form the dynamics source of plate movement, which can explain the development mechanism of normal faults.
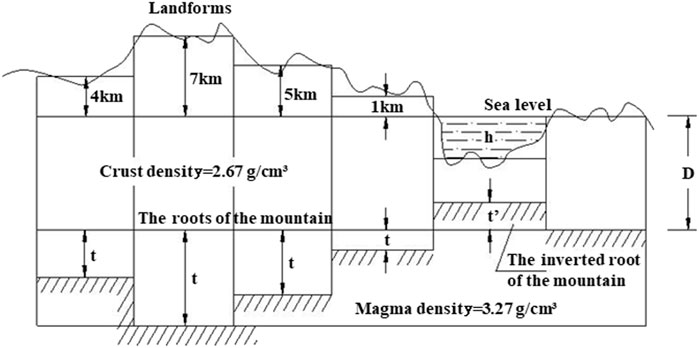
Figure 4. G. B. Airy’s (1855) isostasy hypothesis model.
The G. B. Airy hypothesis model has the following major argumentative questions: (1) The first one is the magma overflow range and the crustal balance of volcanic activities. As magma is not always generated along the entire oceanic trench or ridge length, it is inconsistent with the currently observed facts. (2) The second is the gravitational density and crustal thickness problems, as gravitational density can not be constant, and the surface terrain fluctuations do not strictly correspond to the morphology of the Moho, which has been confirmed in many measurement results. (3) The mantle is not identified based on its density but its fluidity as the only criterion. Therefore, various types of modified isostasy compensation models have been developed based on the original model, such as local compensation, regional compensation, test compensation, and dynamic compensation. Based on previous research results, this study improves the boundary conditions of the G. B. Airy model to form a self-weight stress field isostasy model: (1) The original model, which assumed constant density values for each layer (specifically, a crustal density of 2.67 g/cm3 and a magma density of 3.27 g/cm3), has been refined using a density function. Based on geophysical measurement data, there is a density gradient between the crust and the mantle, and the crust-mantle density difference is not constant. Obviously, the density gradient is not constant. This study employs a density function to characterize the density variations across layers, yielding a representation that aligns more closely with empirical observations. This density gradient is mainly due to the confining pressure difference, as the density threshold causes the rock mass to appear as solid or liquid, leading to the existence of the Moho. However, the magmatic flow objectively leads to confining pressure changes and, in turn, density gradient changes. The density is only related to the factors of its environment, such as burial depth and confining pressure. (2) The original model’s assumption of a hydrostatic stress field has been revised to posit that the controlling factor for equilibrium is not fluid “buoyancy”. In the deep part of the Earth, the stress state deep into the mantle is in a hydrostatic equilibrium state. Constrained by the shell-like structure, the vertical direction controlling factor for the equilibrium is not the fluid buoyancy but the gravitational force that balances with the rotational inertial force, i.e., the self-weight stress. Thus, the proposed model is the self-weight stress field isostasy model (Figure 5). (3) Based on the previous assumptions, the concept of the “stress equilibrium reference surface” is proposed. The spherical zone at a certain depth where the self-weight stress and the rotational inertial force reach equilibrium is simplified as the “stress equilibrium reference surface”. There is no necessary connection between this surface and the top surface of the mantle. The stress state at each point in the depth reaches equilibrium, and there is no existence of “motion potential”. (4) The “isodensity surface” and the “local stress equilibrium reference surface” intersecting with it are proposed. Since the two surfaces do not coincide, it leads to the generation of “motion potential”, thereby forming the driving force for the local laminar flow of magma. Similarly, for thermal gradients, their behavior parallels natural subsurface conductive processes relevant to magmatic flow and plate stress modeling (Shahbaz et al., 2019).
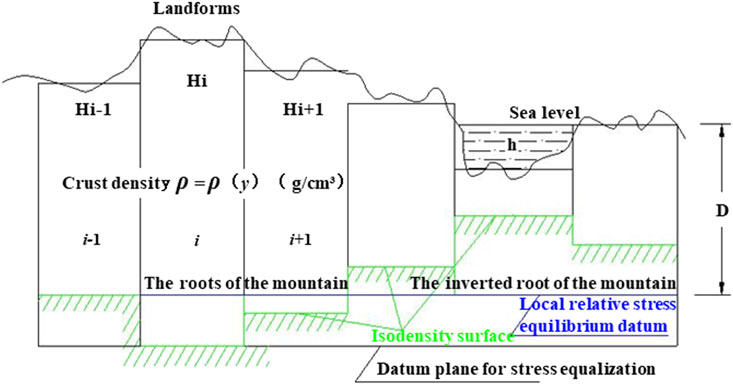
Figure 5. Improved isostasy model based on self-weight stress field.
Based on the improved model, the argumentative questions above can be explained as follows: (1) The magmatic activities involving the oceanic crust obey the mechanical criteria, and the magma overflows from the range of the fracture zone, thus explaining the variability of fracture and volcanic activities. As the magma overflow thickens the oceanic crust, the pressure difference between the oceanic crust and the continental crust decreases, and the oceanic crust undergoes density reconstruction. When the equilibrium conditions are reached, the magma overflow event pauses, and the magma seeks a new outlet for the next overflow event. (2) The density gradient between the crust and the mantle can explain why the continental crust thickness detected by geophysical methods is much smaller than the G. B. Airy hypothesis model prediction. Moreover, if the mantle material is liquid due to temperature alone, mountain roots and negative mountain roots can not form, which is contrary to what is confirmed in the theory of plate tectonics, and the mountain roots are only relatively solid layers formed under the gravitational density gradient, with lower relative flow rates.
In summary, extensive geophysical exploration evidence indicates that the crustal thickness is uneven globally, with the oceanic crust being thinner and the continental crust relatively thicker. Gravimetry was developed based on this theory, which provided a theoretical basis for the establishment of improved isostasy models. Thus, the proposed assumptions on this basis are theoretically reasonable.
The inferred plate activity mechanism based on the proposed assumptions is as follows: (1) The magma flow in the deep part of the Earth’s crust generates shear stress and transmits it to the surface part of the Earth’s crust, forming the fundamental driving force for plate movement. (2) During the stress transfer process, the rock mass in the Earth’s crust is subjected to extrusion. When the compressive stress exceeds the yield strength of the rock mass, local fractures will occur until a new equilibrium is reached. (3) As the oceanic crust is compressed, the horizontal stress increases and a horizontal movement tendency emerges, creating stress concentration in the contact zone between the oceanic crust and the continental crust. Due to the morphological and length differences between the upper and lower solid blocks in the stress concentration zone, the oceanic crust inevitably dives downward to compress the continental crust plate and push it into motion, thus closing the loop with the plate tectonics theory and the exhibited phenomena. Hence, plate movements will go on as long as the Earth exist, only transitioning from a relative equilibrium state (calm period) to the next relative equilibrium state (calm period), and the point at which the magma overflow triggers oceanic crustal plate movements is also changing.
4 Theoretical support of the assumptions: density gradient and crustal thickness
4.1 Empirical evidence for the crust-mantle density gradient
The thickness of the Earth’s crust is usually obtained indirectly through geophysical exploration methods, including gravitational exploration method, broadband seismic exploration method, refraction seismic method, deep seismic reflection method, etc. The burial depth of the Mohorovičić discontinuity (zone) varies globally. There are usually abrupt changes in areas with intense tectonic activities. Moreover, the continental crust is relatively thick while the oceanic crust is relatively thin, which has been demonstrated by a large number of measured data and has formed a broad consensus (Fu et al., 2018). Zhang (2023) jointly used seismic and gravitational data to reflect the crustal thickness in the northeastern margin region of the Qinghai-Tibet Plateau, and obtained the basic understanding that the crustal thickness of the plateau gradually thins from the inside out. The average thickness of the Qinghai-Tibet Plateau is more than 50 km, and the thickest part is 68 km. The thickness in the Western Qinling region is about 50 km. The average crustal thickness of the Inner Mongolia and Sichuan Basin around the plateau is only about 40 km. For example, the thickness of the Qilian Mountains orogenic belt reaches 66 km, the thinnest part of the Ordos Basin is 36 km, and there is an asthenosphere in the low-velocity zone at the bottom of the crust of the Songpan-Ganzi block. Ma and Wu. (2025) adopted the reflection wave noise interference method and obtained similar conclusions. There are significant differences in the crustal thickness of different blocks in the northeastern margin of the Qinghai-Tibet Plateau and its surrounding areas. The crustal thickness gradually thins along the northeast direction of the plateau. The thickness in the middle and western sections of the Qilian Mountains is about 55–65 km. The thickness of the Western Qinling orogenic belt decreases from about 53 km in the west to around 42 km in the east. The thickness of the Alxa block is about 50 km, and the thickness of the western margin of the Ordos block is about 40–45 km. There is local crustal thickening near the Liupanshan Fault, Haiyuan Fault and Tianjingshan Fault, and so on. These results reflect the existence of a density gradient from the crust to the mantle. For example, Thybo et al. (2003) (Kozlovskaya et al., 2012; Yegorova et al., 2002) conducted deep seismic reflection profiling and high-precision gravimetry in the Ukrainian shield (Figures 6, 7) and revealed a gradual, incremental tendency of P wave velocity deeper into the Earth, thus objectively demonstrating the density gradient between the crust and the mantle, which is not constant. Meanwhile, based on studies on effective thermal conductivity using computational methods, Zarghaam et al. (2020) emphasize how material behavior evolves under varying subsurface gradients.
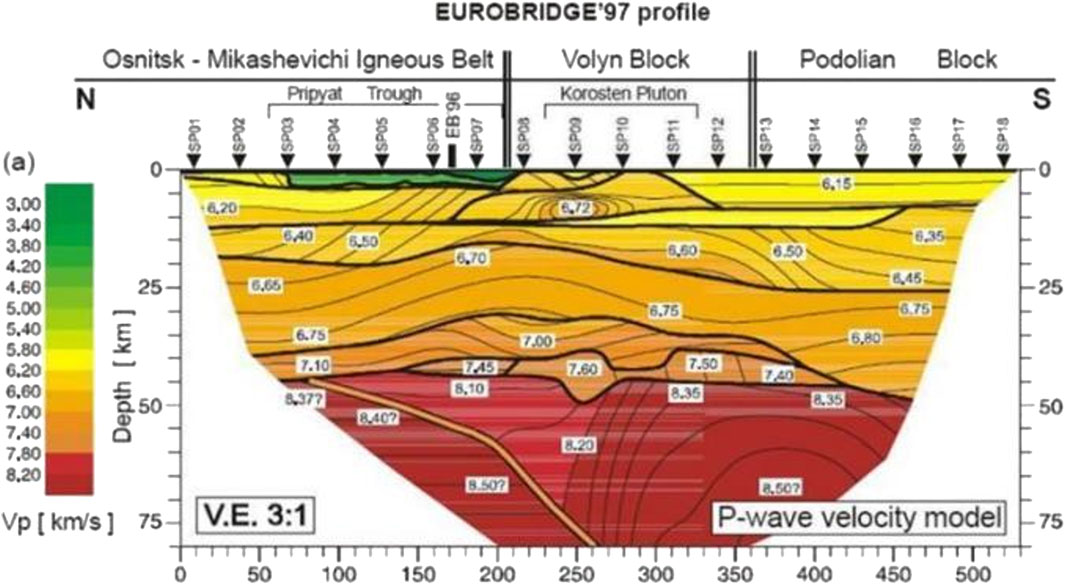
Figure 6. EUROBRIDGE’97 profile two-dimensional P-wave velocity model (Thybo et al., 2003).
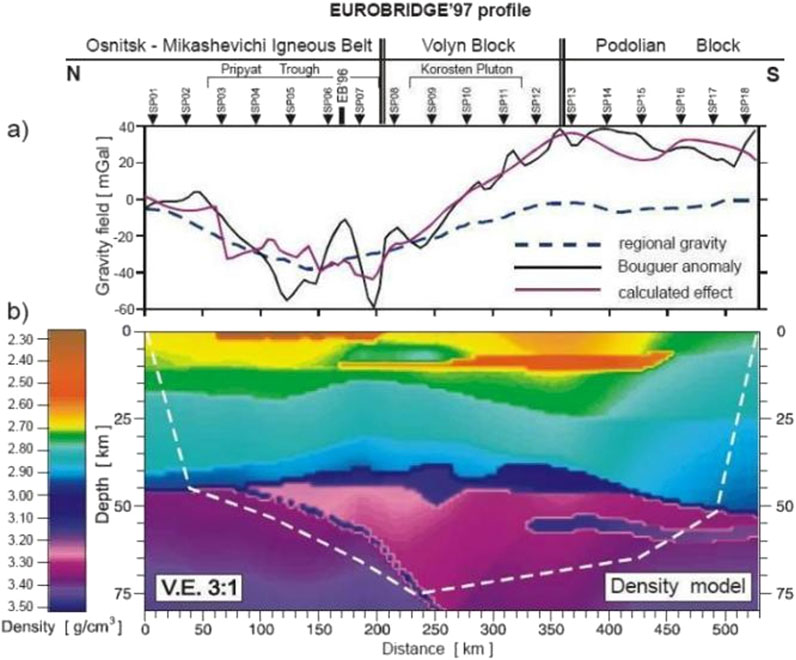
Figure 7. EUROBRIDGE’97 profile two-dimensional density model (Elena et al., 2004).
Wang et al. (2003a), Wang et al. (2003b) conducted artificial seismic surveys in the western Sichuan region, yielding P-wave velocity model results very close to the values (Figure 6) measured out of China (the Moho of this section is about 40–45 km), where the wave velocity of the crustal layer was generally between 5.80 km/s and 7.60 km/s. (1) The Zhubalong-Zizhong profile (from west to east) shown in Figure 8 features 5 wave velocity sub-bands in the vertical depth direction of the crust (Table 1), with the value gradually increasing from 5.95 km/s on the surface to 8.30 km/s on the top of the mantle. Despite local changes in the middle, the overall gradient characteristics are very obvious. (2) The Benzilan-Tangke profile (from south to north) in Figure 9 also features 5 vertical wave velocity sub-bands, with the value gradually increasing from 5.85 km/s to 7.90 km/s and very obvious gradient characteristics. (3) There seems to be a low-velocity layer beneath the crustal surface. (4) The depth of the Moho varies. The east-west distance of the Zhubalong-Zizhong profile is about 560 km, and the depth of the Moho is about 40 km and 60 km, respectively, showing large variations over short distances. In particular, a significant dramatic variation zone is observed in the Longmen Mountain region. The Moho in the Benzilan-Tangke profile also shows certain variations, with the crustal thickness decreasing from 62 km to 52 km over the north-south distance of about 650 km and abrupt changes near the Xianshui River fault zone.
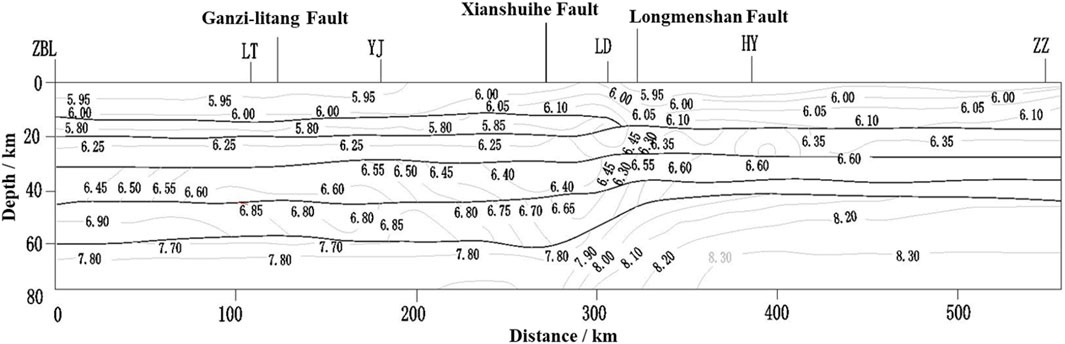
Figure 8. Zhubalong-Zizhong artificial seismic sounding profile (Wang et al. 2003c).

Table 1. Crustal structure layering of two representative artificial seismic sounding profiles in western Sichuan.
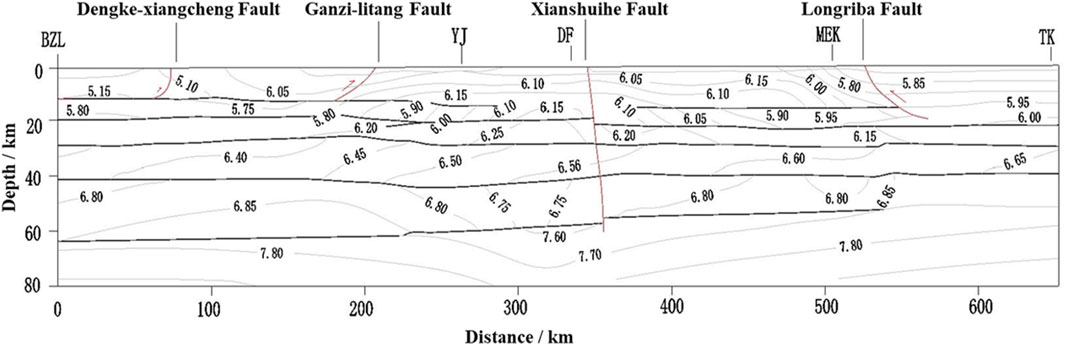
Figure 9. Benzilan-Tangke artificial seismic sounding profile (Wang et al. 2003b).
The seismic sounding results of other regions also provide reference values. For example, the crustal thickness of the Western Sichuan Plateau and the Sichuan Basin is about 60–65 km and 45–50 km, respectively, and the average P wave velocity is about 6.25–6.30 km/s and 6.45–6.50 km/s, respectively, which gradually change with the depth. These results reflect the existence of a density gradient from the crust to the mantle.
4.2 Empirical evidence for uneven crustal thickness
The crustal thickness depends largely on the depth of the Moho, but the nature of the Moho as a sharp boundary or a transition zone is still a research hotspot. We are more inclined to believe it is a transition zone. The crustal thickness is usually measured and calculated indirectly using geophysical exploration methods, such as gravity surveying, broadband seismic exploration, seismic refraction, and deep seismic reflection. The burial depth and thickness of the Moho are not uniform globally, generally changing abruptly in areas with intense tectonic activities. Meanwhile, the continental crust is thicker, and the oceanic crust is relatively thinner, as demonstrated by extensive practical data (Figure 10), and a broad consensus has been reached among researchers (Fu et al., 2018; Ma and Wu, 2024). Zhang. (2023) employed seismic and gravity surveying data to jointly reflect the crustal thickness of the northeast margin of the Qinghai-Tibet Plateau, acquiring a basic understanding of the gradual crustal thickness decrease of the plateau from the center outward. Specifically, the crustal thickness of the Qinghai-Tibet Plateau averages over 50 km, peaking at 68 km, and the crustal thickness of the western Qinling region is about 50 km. Meanwhile, the crustal thickness of Inner Mongolia and Sichuan Basin regions around the Qinghai-Tibet Plateau averages only about 40 km. For example, the crustal thickness of the Qilian Mountain Orogenic Belt reaches 66 km, while the thinnest part of the Ordos Basin is 36 km. Moreover, there is a low-velocity asthenosphere at the crustal bottom of the Songpan-Ganzi block.
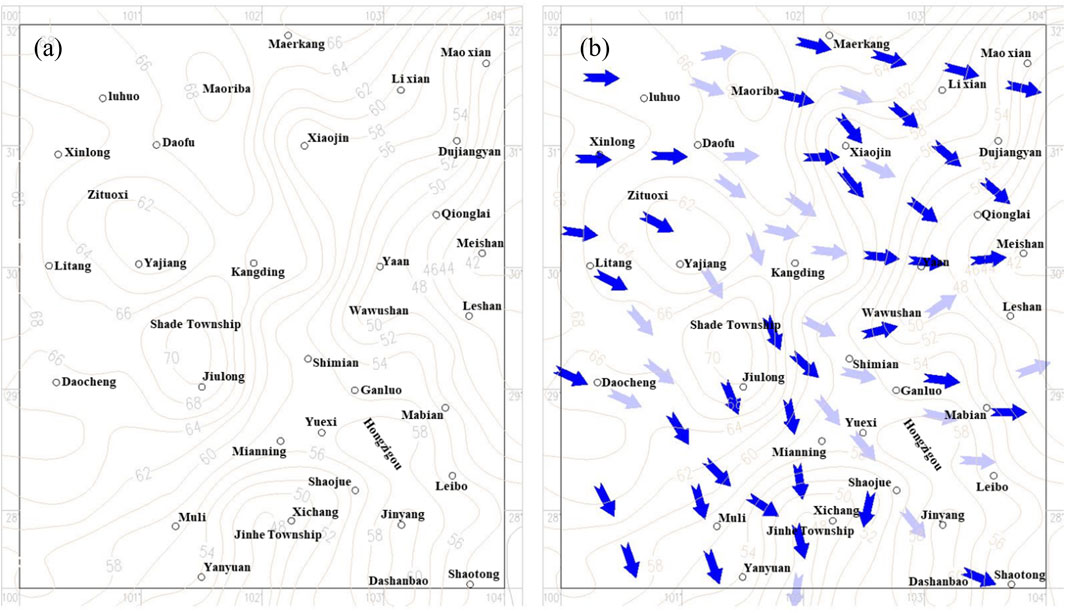
Figure 10. Analysis of magmatic flow trends beneath the western Sichuan block.
Predecessors also conducted extensive Moho depth inversion analysis (Xing et al., 2014) based on the isostasy model, achieving good results in areas with good isostasy. Yet, non-isostasy regions have always been a challenge for relevant research. From the perspective of the proposed assumptions, mantle magma fluidity is low in regions with gravity isostasy, while gravity anomalies are obvious in non-isostasy regions, where the magma fluidity is greater due to gravity self-compensation. The western Sichuan region in the case study also proves the theoretical rationality of the proposed assumptions. Recent experimental work on thermal behavior in geomaterials under high energy flux informs our understanding of the thermal inertia and energy transfer in crustal zones with variable thickness (Ahmad et al., 2025; Ahmad et al., 2021), which also proves the porposed assumptions.
5 Analysis of western sichuan block tectonic activity characteristics based on the proposed assumptions
5.1 Crustal thickness and morphology
According to the isopach lines of the crust produced by Liu et al. (2015) (Figure 11), the crustal thickness west of Xinlong is the largest and exhibits an island-like shape, with a depth of 70 km. The thickness gradually decreases to about 40 km along the southeast direction, with non-isostasy in the various regions.
(1) Three island-like crustal thickening zones bulging toward the Earth center appear at Maoriba west of Xiaojin and Maerkang, northeast of Maerkang, and between Jiulong County and Shade Township, and one band-like thickening zone appears at Ganluo, Jinyang, and Dashanbao scenic area. The thickness increments are about 4 km, 3 km, 5 km, and 12 km, respectively, the long axis directions are roughly N22°W, N72°E, S41°E, and SN, and the lengths are about 70 km, 130 km, 50 km, and 215 km, respectively.
(2) Four inverted trough-shaped and inverted tub-shaped crustal thinning zones appear at the Xiaojin to Baoxing and Mofanggou region, the northeast of Daocheng to Yading and Yalongjiang Town region, south of Mianning to Jinhe Township and Xichang to Panzhihua region, and Wawu Mountain to Leshan, Meishan, Qionglai, and Ya ‘an region. The thickness decrements are about 8 km, 2 km, 10 km, and 12 km, respectively, the directions of the tub top are S44°E, S55°E to S23°E, S7°W, and N47°E to N76°E, respectively, and the long/short axes are about 100/56 km, 150/52 km, ≥160/200 km, and ≥200/75 km, respectively.
(3) A crustal thinning dome appears in the Yajiang to Zituoxi Township, Xinlong County region, about 99 km × 86 km in size, and the thickness decrement is about 4 km.
(4) A crustal thickening zone seems to appear in the region from Daofu to the northeast of Qianning (Huiyuan Temple), while the crust thins in the Luding to Shimian and Mianning region.
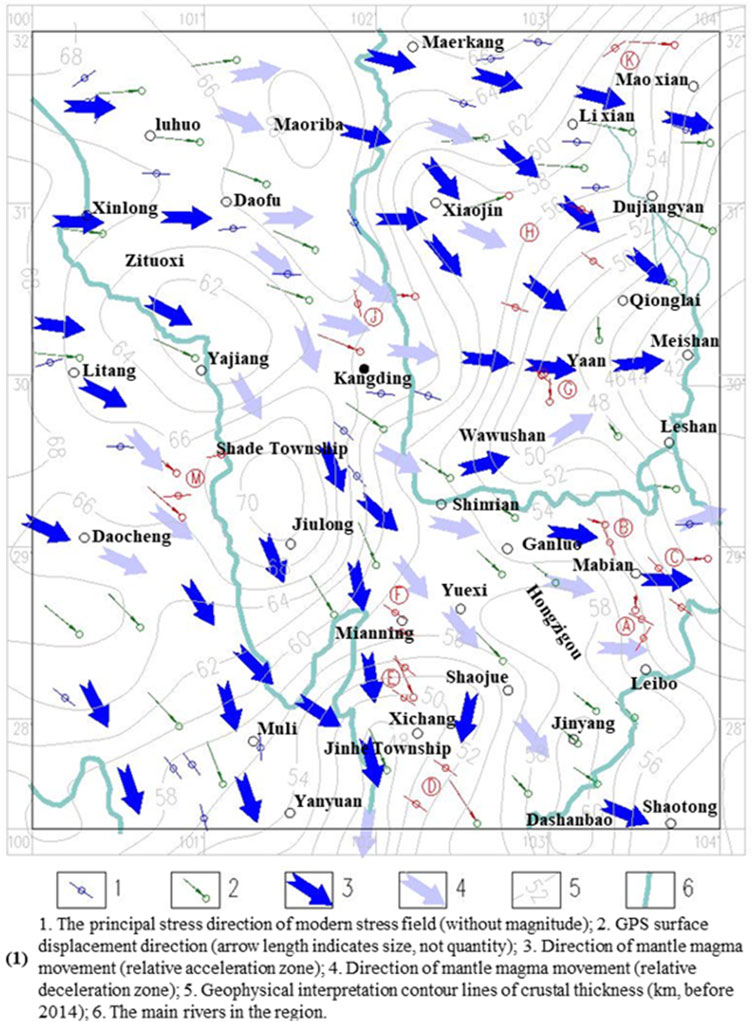
Figure 11. Analysis of the relationship between magmatic flow and regional stress field.
5.2 Magmatic flow analysis
Based on the proposed assumptions and Figure 10, the results in Figure 12 can be derived.
(1) The crustal thickness gradually decreases from northwest to southeast, resulting in a consistent overall magmatic flow direction, with most regions being acceleration zones (as indicated by dark arrows).
(2) The region has a large-scale resistance line in the NW-SE direction, with a width of about 50–150 km, forming an inverted L-shaped magmatic flow velocity reduction zone (as indicated by light-colored arrows). It starts from the northwest of Maoriba in the northwest of the region, passes Daofu and Kangding, and extends to the Shimian, Yuexi, Jinyang, and Dashanbao regions. It does so because the crust thickens in the elliptical region from Daofu to the northeast of Qianning, the crustal thinning rate decreases in the region from Luding to Shimian, Yuexi, and Mianning, with the gradient diminishing, while the dumbbell-shaped crust from Yuexi to Zhaojue and from Jinyang to Dashanbao thickens.
(3) There are small-scale local flow rate decrease zones. (1) The thickening of the island-shaped crust from Shade Township to Jiulong forms a resistance line. (2) The trough bottom regions of the four inverted trough-shaped and inverted tub-shaped crustal thinning zones in the Xiaojin to Baoxing and Mofanggou region, the northeast of Daocheng to Yading and Yalongjiang Town region, and Wawu Mountain to Leshan, Meishan, Qionglai, and Ya ‘an region have decreasing crustal thinning rates, with the gradient diminishing, thereby forming a resistance line.
(4) Relatively stable zones exist in local regions. (1) Northwest of the line from Maerkang to the northeast of Maoriba, Kangding, Jiulong, Muli, and Yanyuan, the crustal thickness gradient shows small variations with relatively stable magmatic flows. Southeast of that line, the gradient shows significant increases, with significantly increased magmatic flow rates. (2) The crustal thinning dome in the region from Yajiang to Zituoxi Township, Xinlong County, has a small scale and small thickness decrements, making it a region with relatively stable magma activities.
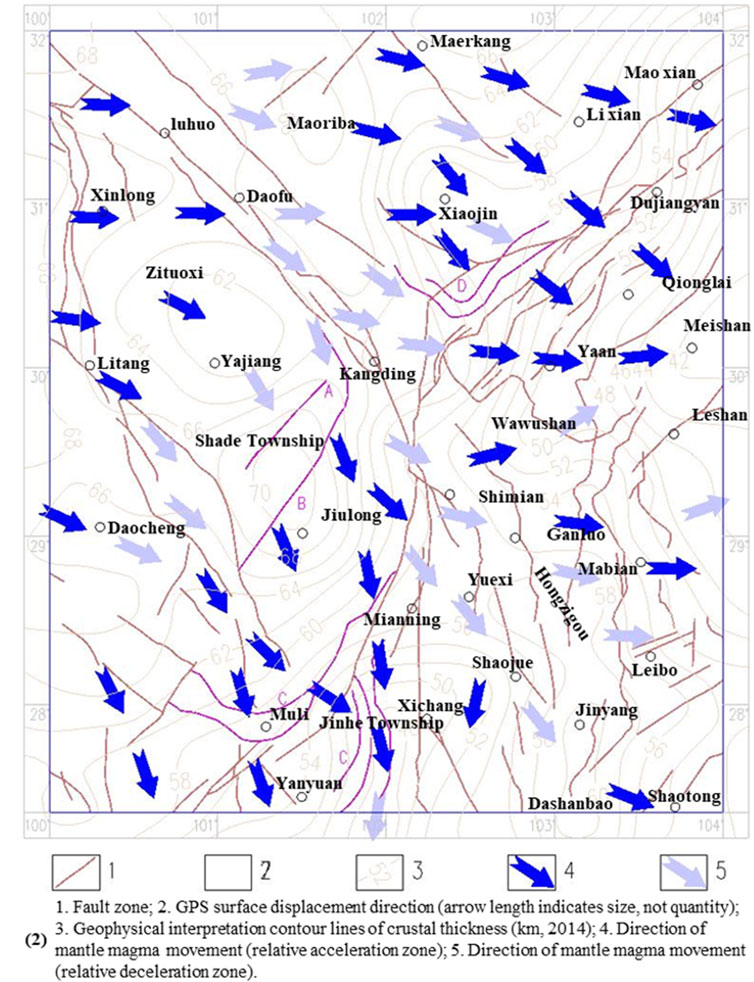
Figure 12. Analysis of the relationship between magmatic flow and fault tectonic activity.
5.3 Analysis of the relationship between magmatic flow and regional stress field and fault tectonics
According to previous research results (Zhang et al., 2008; Xu et al., 2018; Bai et al., 2020; Hou et al., 2025) and regional geological data, the regional stress fields are incorporated into the GPS-based surface displacement map (Figure 11) and fault tectonic distribution map (Figure 12) to study the correlation between magmatic flow and regional stress field, ground displacement, and fault tectonic activity based on the proposed assumptions.
5.3.1 Relationship between magmatic flows and regional stress fields
As shown in Figure 10, the regional stress field directions are consistent with the overall trends of the GPS-based surface displacements, though with large local differences, while the magmatic flow directions are much less different from the directions of the GPS-based surface displacement. The overall patterns are as follows.
(1) Northwest of the line from Maerkang to the northeast of Maoriba, Kangding, Jiulong, Muli, and Yanyuan is a region with small crustal thickness gradient variations, where the directions of regional stress fields are highly consistent with the directions of the GPS-based surface displacement. The only exception is the northwest of the circular crustal thickening zone from Jiulong to Shade Township, where their directions differ markedly (point M in Figure 11).
(2) Despite the large crustal thickness changes southeast of that line, the directions of regional stress fields are highly consistent with the directions of the GPS-based surface displacement in regions with uniform gradient variations. Generally, the following three sub-categories show significant differences: (1) The stationary point range of the second derivative of crustal thickness variation gradient, i.e., the small gradient variation region in the drastic gradient variation→small gradient variation→drastic gradient variation process (points B, F, J, and M in Figure 11). (2) The top and sides of the inverted trough, inverted tub, and gentle dome crustal thinning regions, where the gradient variations are small (points G and H in Figure 11). (3) The rear surfaces of the island-shaped crustal thickening zones in the direction of magmatic flow (point A and K in Figure 11). Moreover, if the magmatic flow direction in the region is stable, the main stress direction forms an acute angle with the large displacement direction and is consistent with the overall magmatic flow direction, as shown in Figure 11. If the flow direction is unstable, the angle between the main stress direction and the surface displacement direction is unstable, as shown in Figure 11.
In summary, the magmatic flow direction is closely related to the regional stress field direction and the GPS-based surface displacement direction. It is preliminarily inferred that the main stress direction in the region is the synergistic direction of the secondary compressive stress generated by the magmatic flow, and the surface displacement direction is the synergistic vector direction of the magmatic flow direction.
5.3.2 Relationship between magmatic flow and fault tectonics
According to Figure 10, the rate and direction of magma movements exhibit certain regularities due to crust depth and morphology, and the surface displacement and stress accumulation caused by its reflection on the surface show good regularity, which, in turn, leads to surface fractures with good regularity.
(1) There is a resistance band from the north of Maoriba and Luhuo to the south of Daofu and Kangding. Moreover, the invisible island-shaped crust thickening zone in front of the magmatic flow facilitates ground stress accumulation, showing compression and strike-slip characteristics when reflected to the surface. Strike-slip is the main characteristic, and the mechanical mode is compression shear. The Shimian, Yuexi, Zhaojue, and Dashanbao regions also have a resistance band. However, it is generally in the resistance-decreasing zone, where the slow and uniform crustal thickness gradient variations are not conducive to stress accumulation, showing compression and strike-slip characteristics when reflected to the surface. Compression is the main characteristic, and the mechanical mode is also compression shear.
(2) The entire region from Baoxing and Lushan to Mao County is in a resistance-decreasing zone. However, there are crustal thickness gradient changes and a convergence trend to Chengdu, and the large dome in Chengdu is an invisible resistance zone. In addition, the trough-shaped crustal thinning zone in Xiaojin leads to accelerated magmatic flows at the edges on both sides. Under the comprehensive action of these factors, the region shows obvious compression but not obvious strike-slip characteristics, thus facilitating the accumulation of ground stress, and the surface fracture has obvious reverse fault characteristics. Due to the confluence of magmatic flow trends, the region from the west of Baoxing to Dachuan Town is in a slightly extension state, with a tensional mechanical mode, but it is not conducive to stress accumulation. The Dachuan Town to Dujiangyan region is slightly compressed, but the stress accumulation is limited. The sections with high stress accumulation and rapid development are in the north-east direction of Dujiangyan.
(3) The region south of Mianning and Xichang shows obvious tension and left-lateral strike-slip characteristics, with a shear mechanical mode and limited ground stress accumulation.
(4) The Muli region has strong compression characteristics, while the regions from Muli to the west of Mianning and from Muli to the south of Daocheng exhibit shear and strike-slip characteristics, with compression and compression shearing mechanical modes, which facilitate higher ground stress accumulation. The Litang to Muli region at the edge of the Yajiang dome and Jiulong island-shaped crustal thickening regions is less impacted, which is not conducive to stress accumulation, and the surface fractures exhibit left-lateral strike-slip characteristics. Additionally, in studies on the differential preservation mechanism of eroded synclines, some scholars have further expounded on the characteristics of strike-slip faults (Hou et al., 2024).
(5) Because of the Jiulong island-shaped crustal thickening zone, the north-west flow rate decreases, and the south-east flow rate increases. As a result, Shade becomes an obvious compression region that can accumulate higher stresses, and the surface fractures are reverse faults, as shown in Figure 12 (Point A). Due to the significant tensile stress accumulation zones in Jiulong County and its northwest and the effects of the Yajiang dome and Kangding invisible resistance zone, the region west of Kangding can accumulate high stresses. The mechanical mode is mainly compression shearing, and the surface fractures mainly show strike-slip characteristics with secondary reverse fault characteristics. The Jiulong County region mainly exhibits tension, with normal fault characteristics. The two connect to form a peculiar L-shaped fracture with simultaneous development, as shown in Figure 12 (Point B). It clearly shows the process in which the magma movement generates shear stress, compressive stress and tensile stress in the upper crust. This mechanism is also found in the fault tectonics in the Muli-Yanyuan and Baoxing regions, as shown in Figure 12 (Points C and C). The main direction of magma flow and the differences in flow rates between the main direction and those on both sides are transmitted to the upper crust, forming thrust arc-shaped structures (Points C and D on the north side of Muli in Figure 12) and drag arc-shaped structures (Point C northeast of Yanyuan in Figure 12). The model proposed in this paper can well explain these special tectonic phenomena.
(6) The central Y-shaped fault tectonic in western Sichuan (the Luding to Shimian region) shows shear compression characteristics, which is also the boundary between the northern strike-slip compression fracture and the southern strike-slip fracture.
In summary, magmatic flow is closely related to regional fault tectonic activity and is the dynamics source of the fault tectonic activity. The surface fracture characteristics and fracture mechanism can be explained by geomechanical mechanisms.
6 Conclusion
(1) Based on the isostasy hypothesis model proposed by G. B. Airy in 1855, this study proposes revised assumptions about the dynamics sources and mechanisms of plate regional tectonics. It is assumed that crustal plate movement results from deep magmatic movement (flow), which is mainly laminar and driven by the changes in magmatic density gradient, with the density varying with depth. On this basis, this study analyzes the mechanical mechanisms of surface rupture and plate movement.
(2) Taking the western Sichuan block as a case study based on the proposed assumptions, the correlation between magmatic flow and regional stress field, ground displacement, and faulted tectonic activity is investigated. It is inferred that the magmatic flow direction is closely related to the regional stress field direction and the GPS-based surface displacement direction. The main stress direction in the region is the synergistic direction of the secondary compressive stress generated by the magmatic flow, and the surface displacement direction is the synergistic vector direction of the magmatic flow direction. Magmatic flow is the dynamics source of the fault tectonic activity. The assumptions satisfy the corresponding geomechanical mechanisms and can effectively explain the direction of the regional stress field, the direction of the GPS-based surface displacement, and the reason for the difference between these two directions. They also offer satisfactory explanations for the morphology and activity of typical fault tectonics in the region. The analysis results align well with the actual situation, thus preliminarily demonstrating the feasibility of the assumptions at the theoretical level.
(3) Nevertheless, the proposed assumptions are still very crude and lack scientific rationality, requiring further academic efforts from peer researchers and enthusiasts. It is also necessary to conduct quantitative research on the mechanical relationship between magma movement and plate movement. Theoretical analyses and mathematical models that comprehensively consider various factors such as the rheological properties of mantle materials, heat conduction within the Earth, and material migration also need to be further supplemented. Further theoretical research is needed to prove its objective scientificity, and more case studies are recommended to analyze the relationships among regional stress fields, ground displacements, and fault tectonic activities. Meanwhile, the relationship between regional tectonics and Moho depth in regions with non-isostasy must be analyzed to demonstrate the feasibility and rationality of the proposed assumptions.
Data availability statement
The raw data supporting the conclusions of this article will be made available by the authors, without undue reservation.
Author contributions
ZC: Writing – original draft. TL: Writing – review and editing. MG: Writing – review and editing. WC: Writing – original draft.
Funding
The author(s) declare that financial support was received for the research and/or publication of this article. This research was supported by Sichuan Province Natural Science Foundation (No. 2022NSFSC0439), Humanities and Social Sciences Research Project of Ministry of Education (No. 23YJCZH051), Sichuan Commiunication Surveying and Design institute Co., Ltd. (No. 232023020), and Unveiling and Leading Technology Projects of Chengdu City (No. 2024-JB00-00006-SN).
Conflict of interest
Author ZC was employed by China Sichuan Communication Surveying and Design Institute Co., Ltd. Author WC was employed by Shanxi Xingtong Engineering Consulting Co., Ltd.
The remaining authors declare that the research was conducted in the absence of any commercial or financial relationships that could be construed as a potential conflict of interest.
The authors declare that this study received funding from Sichuan Commiunication Surveying and Design Institute Co., Ltd. The funder had the following involvement in the study: data collection and analysis.
Generative AI statement
The author(s) declare that no Generative AI was used in the creation of this manuscript.
Publisher’s note
All claims expressed in this article are solely those of the authors and do not necessarily represent those of their affiliated organizations, or those of the publisher, the editors and the reviewers. Any product that may be evaluated in this article, or claim that may be made by its manufacturer, is not guaranteed or endorsed by the publisher.
References
Ahmad, S., Rizvi, Z. H., Arp, J. C. C., Wuttke, F., Tirth, V., and Islam, S. (2021). Evolution of temperature field around underground power cable for static and cyclic heating. Energies 14 (23), 8191. doi:10.3390/en14238191
Ahmad, S., Rizvi, Z. H., and Wuttke, F. (2025). Unveiling soil thermal behavior under ultra-high voltage power cable operations. Sci. Rep. 15, 7315. doi:10.1038/s41598-025-91831-1
Alsabhan, A. H., Sadique, M. R., Ahmad, S., Alam, S., and Binyahya, A. S. (2021). The effect of opening shapes on the stability of underground tunnels: a finite element analysis. Int. J. GEOMATE 21 (87), 19–27. doi:10.21660/2021.87.j2267
Bai, Z. L., Zhang, X. G., Xue, E. F., and Zhang, X., Li, R., and Qin, S. (2020). The characteristic evolution analysis of scale strain fieldin Sichuan area from 2001∼2018 based on GPS velocityfield. Chin. J. Geol. 55 (04), 1315–1326. doi:10.12017/dzkx.2020.079
Boukhalfa, Z., Benhallou, Z. A., Comeau, J. M., Bouzid, A., Bendaoud, A., and Deramchi, A. (2024). The structure of a continental intraplate volcanic system and controls from shear zones: insights into the central Hoggar Cenozoic volcanic province, Northwest Africa, from electrical resistivity images. Gondwana Res. 135, 133–150. doi:10.1016/j.gr.2024.08.003
Chen, L., Wang, X., Liang, X., Wan, B., and Liu, L. (2020). Subduction tectonics vs. Plume tectonics—discussion on driving forces for plate motion. Sci. China Earth Sci. 63, 315–328. doi:10.1007/s11430-019-9538-2
Chen, Q. (2021). The evolution of plate tectonic style and its impacts on thethermal state of the mantle: a statistics case study on thegeochemical data of global igneous rocks. Beijing, China: University of Chinese Academy of Sciences (Institute of Oceanology, Chinese Academy of Sciences.
Dai, H. R. (2021). Processing and interpretation of gravity and magnetic anomaliesin eastern Sichuan and Tibet and research on crustal structure. Beijing, China: China University of Geosciences. doi:10.27493/d.cnki.gzdzy.2021.000716
Daniele, R., Egidio, A., Claudio, P., Pisani, P., Balsotti, R., Kebede, S., et al. (2021). The geophysical recognition of a vapor-cored geothermal system in divergent plate tectonics: the Alalobeda (Alalobad) field, Ethiopia. Tectonophysics 813, 228933. doi:10.1016/j.tecto.2021.228933
Elena, K., Tomasz, J., Jukka, Y., German, K., and Marek, G. (2004). Density-velocity relationship in the upper lithosphere obtained from P-and-S wave velocity models along the-EUROBRIDGE97 seismic profile and gravity data. Acta Geophysica Polonica 52 (4), 397–424. doi:10.1016/j.tecto.2004.04.009
Fu, W., Hou, H. S., Yang, J., and Guo, R. (2018). Moho:the closest global interface to human life. China Min. Mag. 27 (S1), 418–420. doi:10.12075/j.issn.1004-4051.2018.S1.076
Gao, R., Xiong, X. S., Li, Q. S., and Lu, Z. (2009). The Moho depth of Qinghai-Tibet Plateau revealed by seismic detection. Acta Geosci. Sin. 30 (06), 761–773. doi:10.3321/j.issn:1006-3021.2009.06.008
Hou, H., Yang, W., Du, W., Feng, X., Jiang, Z., Shi, F., et al. (2024). Implications of multi-stage deformation on the differential preservation of Lower Paleozoic shale gas in tectonically complex regions: new structural and kine-matic constraints from the Upper Yangtze Platform, South China. Mar. Petroleum Geol. 160, 106629. doi:10.1016/j.marpetgeo.2023.106629
Hou, H., Yang, W., Yang, R., Jiang, Z., Miao, K., Sun, W., et al. (2025). Formation and evolution of complex pore-fracture systems in shale gas reservoirs: insights into controlling mechanisms. Energy and Fuels 39, 3008–3038. doi:10.1021/acs.energyfuels.4c05306
Kozlovskaya, E., Janik, T., Yliniemi, J., Grad, M., and Xue, W. (2012). Density-velocity relationships in the upper crust derived from P-wave and S-wave velocity models and gravity data from the EUROBRIDGE’97 seismic profile. World Seismol. Transl. (02), 33–48. doi:10.16738/j.cnki.issn.1003-3238.2012.02.006
Li, C. P., Liu, X. W., Wang, X. C., and Yang, L. (2005). Seismie wave seattering theory, scattering characteristics and its applications. Prog. Explor. Geophys. (02), 81–89+9.
Li, X. L., Zhang, L. F., Wei, C. J., and Zhang, G. (2025). Orosirian cold eclogite from Baltica marks the onset of modern plate tectonics. Earth Planet. Sci. Lett. 663, 119417. doi:10.1016/j.epsl.2025.119417
Li, Z. (2016). The instruments and application research of high precision absolute gravimetry. Beijing, China: Tsinghua University.
Li, Z. H., Cui, Q. H., Zhong, X. Y., Liu, M., Wang, Y., and Huangfu, P. (2021). Numerical modeling of continental dynamies: questions, progress and perspectives. Acta Geol. Sin. 95 (01), 238–258. doi:10.19762/j.cnki.dizhixuebao.2020276
Liang, G. H. (2021). How to reveal the mechanism of plate movement[C]//Chinese geophysical society. Proceedings of the 2021 China joint academic annual conference on earth sciences (volume 26)—topic 76: Earth's fluid systems and their effects on resources, environment, and disasters; topic 77: tethys-Qinghai-Tibet Plateau geological evolution and metallogenesis; topic 78: tectonic evolution, deep processes, and metallogenesis of the central asian orogenic belt. Beijing, China: Institute of Geology and Geophysics, Chinese Academy of Science. doi:10.26914/c.cnkihy.2021.073063
Liang, G. H. (2023a). Innovation in tectonic evolution patterns of the earth[C]//Chinese geophysical society. In: Proceedings of the 2023 China joint academic annual conference on Earth sciences—topic 83: deep Earth processes and earth’s habitability, topic 84: earth’s fluid systems and their effects on resources, environment, and disasters. Beijing, China: Institute of Geology and Geophysics, Chinese Academy of Sciences.
Liang, G. H. (2023b). Mechanism of plate movement and physical evidence of earth[C]//Chinese geophysical society. in: Proceedings of the 2023 China joint academic annual conference on Earth sciences—topic 66: deep structure and dynamic significance of continent-continent collision zones; topic 67: plate Tectonics and geodynamic processes. Beijing, China: Institute of Geology and Geophysics, Chinese Academy of Sciences.
Liu, G. L., and Zhang, A. K. (2015). Reflections on earth science development trend: geodynamics and formation mechanism of superlarge mineral deposits. Sci. and Technol. Rev. 33 (11), 114–119. doi:10.3981/j.issn.1000-7857.2015.11.020
Liu, S. F., Cheng, S. Y., Zhang, H. P., and Su, S. (2004). Research on present status and vista of geodynamics—an overview of research results in the 32nd international geological congress. Geoscience (04), 404–414. doi:10.3969/j.issn.1000-8527.2004.04.002
Liu, Y. F., He, Q., and Kang, C. C. (2015). Seismic safety evaluation report for the site of the kangding bypass connection Project on the ya'an–kangding expressway. Linshui, China: Sichuan Saisite Technology Co., Ltd.
Luo, Q. (2017). Study of least squares and its ImprovedAlgorithm in data fitting of absolute gravimeter, gravimeter. Beijing, China: Institute of Seismology, China Earthquake Administration.
Ma, X. J., and Wu, Q. J. (2024). Preliminary study on Moho reflection wave based on noise interference methodand its application in crustal structure imaging of the northeasternmargin of the Qinghai-Xizang Plateau[J/OL]. Rev. Geophys. Planet. Phys., 1–15. doi:10.19975/j.dqyxx.2024-018
Ma, X. J., and Wu, Q. J. (2025). Preliminary study on Moho reflection wave based on noise interference method and its application in crustal structure imaging of the northeastern margin of the Qinghai–Xizang Plateau. Rev. Geophys. Planet. Phys. 56 (2), 167–181. doi:10.19975/j.dqyxx.2024-018
Ma, Z. J., and Gao, X. L. (2004). Some thoughts on the research on conti nent al tecton csoceanic tectonics and earth tectonics. Earth Sci. Front. (03), 9–14. doi:10.3321/j.issn:1005-2321.2004.03.002
Maleki, M. S., and Simkooei, A. A. (2024). Fast implementation of least squares variance component estimation for diagonal matrices: applications to GNSS time series. GPS Solutions 29, 24. doi:10.1007/s10291-024-01778-5
María, Á. G. G., Eline, B. L., Magdalena, W. S., Monsalve, G., and Anikiev, D. (2021). The preserved plume of the Caribbean Large Igneous Plateau revealed by 3D data-integrative models. Solid earth. 12 (1), 275–298. doi:10.5194/se-12-275-2021
Mei, Q., Qu, H., Huang, X., Zhange, Z., and Li, G. (2020). Review of seismic wave propagation characteristics. Construction Des. Proj. (04), 10–12. doi:10.13616/j.cnki.gcjsysj.2020.02.205
Mu, Z. J. (2023). Research on attitude measurement Technology and DataReduction method of marine vector magnetic instrument. Langfang, China: Institute of Disaster Prevention.
Qin, X. F., Han, L. G., and Shan, G. Y. (2006). The primary research about scatter field. J. Jilin Univ. (S2), 40–43. doi:10.13278/j.cnki.jjuese.2006.s2.004
Rao, V. V., Laxminarayana, K., Mandal, B., Karuppannan, P., and Kumar, P. (2025). Synthesis of structure and tectonic evolution of Meso-Neoproterozoic Vindhyan Basin, India using geophysical and geological data: a plate tectonic perspective. Precambrian Res. 422, 107787. doi:10.1016/j.precamres.2025.107787
Rizvi, Z. H., Mustafa, S. H., Sattari, A. S., Ahmad, S., Furtner, P., and Wuttke, F. (2020). Dynamic lattice element modelling of cemented geomaterials. In: A. Prashant, A. Sachan, and C. Desai, editor. Advances in computer methods and geomechanics. Lecture notes in civil engineering; Singapore: Springer, 55. p. 655–665. doi:10.1007/978-981-15-0886-8_53
Shahbaz, A., Zarghaam, R., Mohammad, A., Ahmad, J., and Wuttke, F. (2019). Experimental study of thermal performance of the backfill material around underground power cable under steady and cyclic thermal loading. Mater. Today Proc. 17 (1), 85–95. doi:10.1016/j.matpr.2019.06.404
Sun, L. S. (1988). An overview of progress in gravimetricmeasurements in China duringrecent years. Recent Dev. World Seismol. 10, 8–14.
Teng, J. W., Bai, W. M., Zhang, Z. J., Yang, D-H., Yang, H., Liu, C., et al. (2009). Development direction and ponders of the Continental dynamics in China. Prog. Geophys 24 (6), 1913–1936. doi:10.3969/j.issn.1004-2903.2009.06.001
Teng, J. W., Song, P. H., and Mao, H. H. (2014). The orientation and problems of contemporary intra-continental physics and dynamics. Geol. China 41 (3), 675–697. doi:10.3969/j.issn.1000-3657.2014.03.001
Teng, J. W., Yang, H., and Zhang, X. M. (2010). Develpment direction and task of the geodynamical research in China. Act. Petrol. Sin. 26 (11), 3159–3176.
Thybo, H., Janik, T., Omelchenko, V., Grad, M., Garetsky, R., Belinsky, A., et al. (2003). Upper lithospheric seismic velocity structure across the Pripyat Trough and the Ukrainian Shield along the EUROBRIDGE’97 profile. Tectonophysics 2003 (1), 41–79. doi:10.1016/s0040-1951(03)00200-2
Tie, Z. J., Gao, C. S., and Xing, T. L. (1986). Geochemical behaviors of some traceelements and their applications-ahigh-temperature simulating experiment. Geochimica (01), 90–96. doi:10.19700/j.0379-1726.1986.01.012
Vincenzo, N., Oscar, B., Davide, Z., Mascia, C., and Doglioni, C. (2023). Tidal drag and westward drift of the lithosphere. Geosci. Front. 14 (6), 101623. doi:10.1016/j.gsf.2023.101623
Vries, D. W. V. B., Byrne, P., Delcamp, A., Einarson, P., Gogus, O., Guilbaud, M-N., et al. (2017). A global framework for the Earth: putting geological sciences in context. Glob. Planet. Change 171, 293–321. doi:10.1016/j.gloplacha.2017.12.019
Wang, C. Y., Han, W. B., Wu, J. P., Lou, H., and Bai, Z-M., (2003b). Crustal structure beneath the SongPan-Garze orogenc belt. Acta Seimol. Sin. 25 (03), 229–241. doi:10.3321/j.issn:0253-3782.2003.03.001
Wang, C. Y., Wu, J. P., and Lou, H. (2003a). Crustal P-wave velocity structure of the western sichuan–eastern tibet region. Sci. China (S1), 181–189. doi:10.3321/j.issn:1006-9267.2003.z1.020
Wang, C. Y., Wu, J. P., Lou, H., Zhou, M. D., and Bai, Z-M., (2003c). Crustal structure beneath the SongPan-Garze orogenc belt. Sci. China Earth Sci. 33 (S1), 181–189. doi:10.1360/zd2003-33-S1-181
Xi, J. L. (2019). A review of geoelectric field observation methods and techniques. Seismol. Geomagnetic Observation Res. 40 (02), 1–20. doi:10.3969/j.issn.1003-3246.2019.02.001
Xiang, D., Liang, N. Y., Ling, J., Li, J., Qu, Q., and Zhong, J. (2025). Lithospheric structures and its relationship with seismic and volcanic activities: a review of the Tonga-kermadec subduction zone in the southwestern pacific. J. Ocean Univ. China 24, 631–646. doi:10.1007/s11802-025-5924-x
Xing, J., Hao, T. Y., Xu, Y., and Qin, J-X. (2014). Review of the application of isostatic models in the inversion of Moho depth. Progres Geophys. 29 (1), 61–72. doi:10.6038/pg20140109
Xu, R., Sarah·Stamps, D., and Huang, S. M. (2018). GPS derived evolution of strain rate in sichuan region. J. Southwest Jiaot. Univ. 53 (02), 344–350. doi:10.3969/i.issn.0258-2724.2018.02.017
Yegorova, T., Starostenko, V., Kozlenko, V., and Yliniemi, J. (2002). Lithosphere structure of the Ukrainian Shie-ld and Pripyat Trough in the region of EUROBRIDGE-97 (Ukraine and Belarus) from gravity mo-delling. Tectonophysics 381 (1), 29–59. doi:10.1016/j.tecto.2002.06.003
Ying, S. C. (2019). Programming and application of molecular dynamics simulation program based on Python. Electron. Test. (14), 52–54. doi:10.16520/j.cnki.1000-8519.2019.14.018
Yuan, J. Y. (1978). The theory of sea floor spreading and plate tectonics. Mar. Sci. Technol. Inf. (05), 52–62.
Yue, L. Q. (2000). Some developments of geosciences and their significance to mankind society. Geol. Fujian (03), 153–160.
Zarghaam, H., Dinesh, S., Amir, S. S., and Wuttke, F. (2018). Numerical modelling of effective thermal conductivity for modified geomaterial using lattice element method. Heat. Mass Transf. 54, 483–499. doi:10.1007/s00231-017-2140-2
Zarghaam, H. R., Husain, H. Z., Syed, J. A., Sattari, A. S., and Wuttke, F. (2020). Soft and hard computation methods for estimation of the effective thermal conductivity of sands. Heat Mass Transf. 56, 1947–1959. doi:10.1007/s00231-020-02833-w
Zhang, B., Zhong, W. X., Zhou, M., Tan, J., Zheng, D., and Ouyang, L. P. (2015). The research progress of the detection crustal and upper mantle structure ofnortheastern Tibetan Plateau by multiple seismic methods. Prog. Geophys. 30 (04), 1507–1515. doi:10.6038/pg20150404
Zhang, G. W., Guo, A. L., Dong, Y. P., Lai, S. C., Cheng, S. Y., and Yao, A. P. (2009). To promote solid earth sciences through development of plate tectonics and contmen tal tectonics study. Joumal Northwest Univ. Sci. Ed. 39 (03), 345–349. doi:10.16152/j.cnki.xdxbzr.2009.03.002
Zhang, G. W., Guo, A. L., Dong, Y. P., and Yao, A. P. (2011). Continental geology, tectonics and dynanics. Earth Sci. Froniers 18 (3), 1–12.
Zhang, H. M., and Chen, X. F. (2003). Studies on seismic waves. ACTA Seismol. Sin. (05), 465–474+562.
Zhang, J. Z., Kusky, T., Chen, X. G., and Cheng, Q. (2025). Earth's deep-time geodynamic evolution recorded by hafnium isotope perturbations. J. Geophys. Res. Solid Earth 130 (4), e2025JB031150. doi:10.1029/2025JB031150
Zhang, P. (2023). Study on the fine lithospheric structure of thenortheastern Tibetan Plateau from joint inversion ofseismic and gravity data. Beijing, China: Institute of Geophysics, China Earthquake Administration. doi:10.27487/d.cnki.gzdws.2023.000004
Zhang, R. D., Huang, D. F., Liao, H., Zhou, L. T., and Zhao, Y. B. (2008). The analysis ofpresentday crustal defomation in Sichuan based on GPS. Sci. Surv. Mapp. 33 (06), 30–32. doi:10.3771/j.issn.1009-2307.2008.06.009
Zhao, S. D., Song, J. G., and Lei, G. L. (2024). Thin interbed identification method based on seismic waveform similarity. Oil Geophys. Prospect. 59 (01), 133–141. doi:10.13810/j.cnki.issn.1000-7210.2024.01.014
Zhao, W. J. (2009). Continental drift, plate tectonics and geomechanics. Acta Geosci. Sin. 30 (06), 717–731. doi:10.3321/j.issn:1006-3021.2009.06.004
Zheng, Y. F., Guo, Z. T., Jiao, N. Z., Mu, M., Piao, S., Fu, S., et al. (2024). A holistic perspective on Earth system science. Sci. China Earth Sci. 67 (10), 3013–3040. doi:10.1007/s11430-024-1409-8
Zhou, Q., Sun, X. X., Liu, Q., and Bian, G. (2019). 3-D regional marine geomagnetic field model reconstruction based on PSO-SSVM. Hydrogr. Surv. Charting 39 (02), 16–20. doi:10.3969/i.issn.1671-3044.2019.02.004
Keywords: plate activity, isostasy hypothesis model, dynamic mechanism, crustal thickness, density gradient
Citation: Chen Z, Li T, Gao M and Chen W (2025) Assumptions about the dynamics sources and mechanisms of plate tectonic activities. Front. Earth Sci. 13:1618308. doi: 10.3389/feart.2025.1618308
Received: 25 April 2025; Accepted: 29 May 2025;
Published: 19 June 2025.
Edited by:
Wenling Tian, China University of Mining and Technology, ChinaReviewed by:
Zarghaam Rizvi, GeoAnalysis Engineering GmbH, GermanyHuajin Li, Chengdu University, China
Peng Tang, Jiangxi University of Science and Technology, China
Haodong Hou, China University of Petroleum, China
Copyright © 2025 Chen, Li, Gao and Chen. This is an open-access article distributed under the terms of the Creative Commons Attribution License (CC BY). The use, distribution or reproduction in other forums is permitted, provided the original author(s) and the copyright owner(s) are credited and that the original publication in this journal is cited, in accordance with accepted academic practice. No use, distribution or reproduction is permitted which does not comply with these terms.
*Correspondence: Ziyun Chen, Q2hlbnppeXVuQHNjb2RpLmNu; Tianbin Li, bHRiQGNkdXQuZWR1LmNu