 Osama Ashraf Mohammed1
 Houzhi Li
- 1Department of Social Sciences, College of Basic Education, University of Halabja, Halabja, Iraq
- 2Department of Geography, College of Human Sciences, University of Halabja, Halabja, Iraq
- 3Department of Geography, Faculty of Education, University of Koya, Koya, Iraq
- 4Department of Forestry, Faculty of Natural Resources, University of Guilan, Sowmeh Sara, Iran
- 5Institute of Exploration Technology, Chinese Academy of Geological Science, Chengdu, China
Introduction: Mass movements, such as landslides on slopes, are a type of slope activity and a category of natural hazards that result in significant financial, human, and environmental damages globally each year. Identification and classification of regions susceptible to landslides are crucial components of environmental risk evaluation and play a significant role in watershed management.
Methods: The aim of this study is to assess the spatial susceptibility of landslides utilizing sophisticated data mining techniques in the Kamyaran County, Iran. Accordingly, the evaluation of landslide susceptibility was carried out employing two advanced data mining approaches, namely, Random Forest and Support Vector Machine. In this research, the variables considered for hazard potential zoning included elevation, slope, aspect, slope curvature, distance from rivers, distance from roads, distance from faults, land use, normalized difference vegetation index, lithology, rainfall, and topographic wetness index. A dataset of landslides was utilized for this purpose. The dataset included 103 recorded landslides in Kamyaran County, which served as a map for the actual landslides that took place in the area. To train and validate the models, the landslide data points were split into two subsets, namely, training data (70 percent), consisting of 72 points, and validation data (30 percent), comprising 31 points. Ultimately, the efficacy of the models was assessed using the receiver operating characteristic (ROC) curve.
Results: The findings from the ROC curve analysis revealed that the SVM and RF models achieved AUC values of 0.91 and 0.95, respectively; thus, the RF model exhibited the highest AUC value in comparison to the SVM, making it the most effective model for forecasting landslide susceptibility in the study area in the future.
Conclusion: Landslide potential maps are valuable tools that can be applied in environmental management, land use planning, and infrastructure development.
1 Introduction
Landslides represent one of the natural hazards that annually result in significant loss of life and financial resources in regions that are mountainous, prone to rainfall, or earthquake-affected. Such hazard significantly contributes to the destruction of transportation routes, grazing lands, residential areas, and lead to erosion and sediment buildup in watersheds (Geertsema et al., 2009; Ye et al., 2022). Research on landslides reveals that these events occur frequently and are present on every continent, posing a worldwide risk to human life, infrastructure, and the environment (Broeckx et al., 2018). Iran, due to its predominantly mountainous landscape, numerous tectonic and seismic activities, as well as a variety of climatic and geological features, possesses the necessary natural conditions for a vast array of landslides. The instability of slopes is a key geomorphological-geological occurrence that impacts the alteration of the earth’s form (Vittorio Blasio, 2011). Mass movements are classified as morpho dynamic phenomena occurring as influenced by multiple factors on the slopes of mountainous regions, with landslides being the most significant of these forms (Stoffel and Huggel, 2012). The initiation of this phenomenon can stem from various geological, geomorphological, hydrological, biological, and human factors. Geological processes, vegetation, human actions (Giannecchini, 2006), rainfall, and climate conditions (Xie et al., 2025) play a crucial role in the intensity and diffusion of this phenomenon within the environment (Cornforth, 2005). Moreover, landslides are proactive processes that significantly impact and alter natural landscapes (Guzzetti et al., 1999). When this process interferes with human activities, it transforms into a hazardous event (Paoletti et al., 2013), escalating risks to life and economic stability, which are often irreparable or demand extensive resources and time for recovery. It is anticipated that in the years to come, regions vulnerable to landslides will increase due to urban expansion, developmental efforts, deforestation, and shifts in climate patterns (Zhu et al., 2014).
Landslide susceptibility refers to the likelihood of landslides happening in a particular region, which is influenced by a mix of various driving factors. This includes pinpointing areas that may face landslide events in the future. Such information is essential for land use planning and mitigating risks (Sameen et al., 2020).
The use of remote sensing techniques and geographic information systems using spatial data is widely used in geoscience studies (Roy et al., 2022; Majumder et al., 2023; Roy et al., 2021), including studies in the field of landslides.
Various techniques are applied to assess landslide susceptibility. Each technique has its unique pros and cons when it comes to generating landslide susceptibility maps. The assessment of landslide susceptibility is on the rise globally; however, there is no universally accepted standard methodology at present. Consequently, individual researchers adopt their own approaches to conduct a more precise sensitivity analysis regarding landslides (Teng et al., 2024).
Creating landslide susceptibility zoning maps is a fundamental step towards identifying unstable regions, allowing for necessary planning to limit land use in these areas, thereby minimizing the damages caused by this phenomenon. Therefore, developing a landslide susceptibility zoning map is crucial. This study aimed to incorporate the maximum number of parameters that impact landslide occurrences, including topographic and geomorphological factors. Based on this, a landslide susceptibility zoning map was developed using two techniques, namely, Random Forest and Support Vector Machine in the Kamyaran County.
2 Materials and methods
2.1 Study area
Kamyaran County, covering an area of 255.1 square kilometers, is situated in the western part of Iran, in the southern region of Kurdistan province, positioned at 46° 29ˈ 25ʺ to 47° 20ˈ 28ʺ eastern longitude as well as 34° 44ˈ 19ʺ to 35° 13ˈ 55ʺ northern latitude. The county’s average elevation is 1820 m above the sea level. It experiences a temperate mountainous climate with annual precipitation ranging from 400 to 600 mm. The distribution of rainfall varies across different months, with the peak rainfall occurring from mid-October to mid-May. In terms of flora, most parts of the area feature lush pastures, while the western regions have relatively dense oak forests on the heights of Shahu Mountain. Geologically, the region under investigation lies within the Sanandaj-Sirjan and Zagros structural zones. Regarding stratigraphy, the area encompasses rock formations from the Cretaceous to Quaternary periods, with the oldest being the Gurpi formation (composed of marl and shale interspersed with clay limestone), with the youngest consisting of recent era sediments, including alluvial cones and alluvial terraces (Ghasemian et al., 2022). The placement of the study area within Iran and Kurdistan province is illustrated in Figure 1.
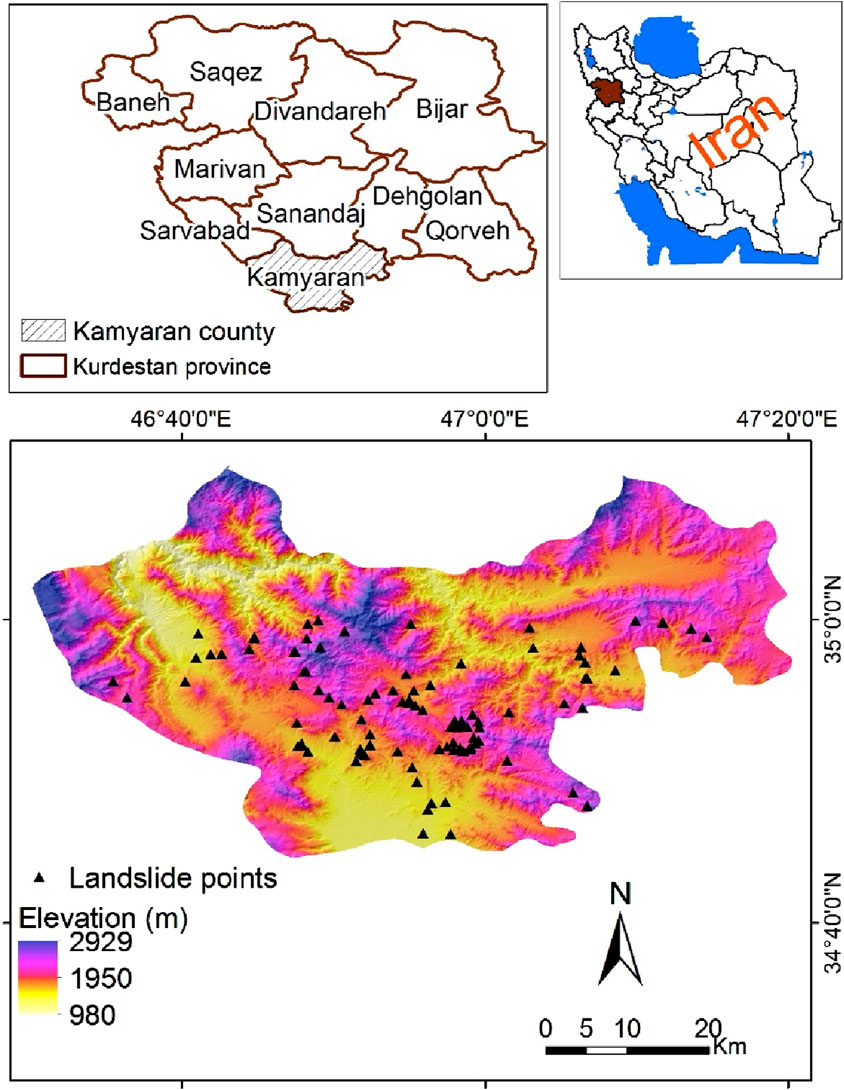
Figure 1. Location map of the study area layout.
2.2 Creating a landslide distribution map
With the map of the landslides in the area at hand, it is feasible to statistically analyze the overall connection between the factors that contribute to them and the landslides in the past, which can serve as a basis for evaluating the landslide susceptibility potential in the area (Hamza and Raghuvanshi, 2016). The point file comprising 103 landslides that occurred in Kamyaran County, developed by the General Department of Natural Resources of Kurdistan Province through the analysis of satellite images and site visits, was utilized as a map of actual landslides in the area. To train and validate the developed models, the landslide points are split into the two segments of training data (70 percent) containing 72 points and validation data (30 percent) encompassing 31 points that was adopted based on common practices in landslide susceptibility modeling, where such splits are widely used to balance model training and validation while preserving sufficient data for testing (Shirzadi et al., 2018; Dou et al., 2021).
2.3 Factors effective in the occurrence of landslides
In this study, after analyzing earlier research (Wang et al., 2020; Zhou et al., 2021; Dou et al., 2021; Ali et al., 2025) and local conditions, the variables considered for landslide susceptibility potential zoning included elevation, slope, aspect, slope curvature, distance from rivers, distance from roads, distance from faults, land use and land cover, normalized difference vegetation index, lithology, rainfall, and topographic wetness index.
Initially, the Digital Elevation Model (DEM) with a resolution of 12.5 × 12.5 m was created utilizing data from the ALOS PALSAR satellite and the Alaska Satellite Facility website. The ALOS PALSAR DEM (12.5 m resolution) provided a suitable balance between computational efficiency and spatial detail for regional-scale landslide susceptibility modeling. While finer resolutions (<5 m) might enhance micro-topographic feature detection, they require significantly greater computational resources and are less practical for large areas. Coarser resolutions (>30 m) risk oversimplifying slope and curvature dynamics, particularly in heterogeneous terrains (Tan et al., 2015). Subsequently, the map of elevation with six categories, the slope map with seven categories, the aspect map with nine categories, and the slope curvature map were developed using the DEM.
The Topographic Wetness Index (TWI) is a measure that combines low and high elevations, indicating the ratio of slopes within the basin. This index reflects the spatial distribution of soil moisture across the landscape and can be calculated using Equation 1 (Nefeslioglu et al., 2008), where As represents the area above the slope that drains to a specific point (m/m2) and β is the slope angle at that point (radian).
The maps of the distance from the road and the distance from rivers were created using the country’s mapping organization’s 1:50,000 digital topographic map by applying the Euclidean distance function within the ArcGIS environment, each with five classes. Additionally, the map of the distance from the fault was developed by employing the digital topographic map of 1:50,000 and applying Distance functions in the ArcGIS environment with five classes.
Geological formations exhibit variability in their structural and lithological features, leading to changes in rock permeability, type, and strength, which significantly influence the level of vulnerability to landslides, playing a crucial role in the potential susceptibility of landslides (Basu and Pal, 2020). To derive the lithology layer, the geological map of 1:100,000 was utilized.
The NDVI, with a resolution of 10 m (Equation 2), was generated using Sentinel two images (from 2022/5/12) sourced from scihub. copernicus.eu website; where R = infrared band, NIR = near infrared band.
In this study, the OLI sensor data from the Landsat 8 satellite dated June 25, 2021, were utilized to create the land use map. Additionally, the digital topographic map of 1:25,000 and Google Earth images of the area were employed for geometric correction and identification of teaching points. All processing procedures were conducted using ENVI 5.3 and ArcGIS 10.8 environment. The accuracy of the generated land use map was evaluated using the Kappa index, which recorded a value of 0.88. The land use layer was further categorized into various classes according to different uses.
To produce the rainfall layer, data from 20 years (2003–2023) derived from five rain gauge stations both within and outside the study area were used, and the annual average was calculated. Subsequently, the rainfall map was generated utilizing the Kriging interpolation method across four layers. These data were obtained from the General Directorate of Meteorology (Figure 2).
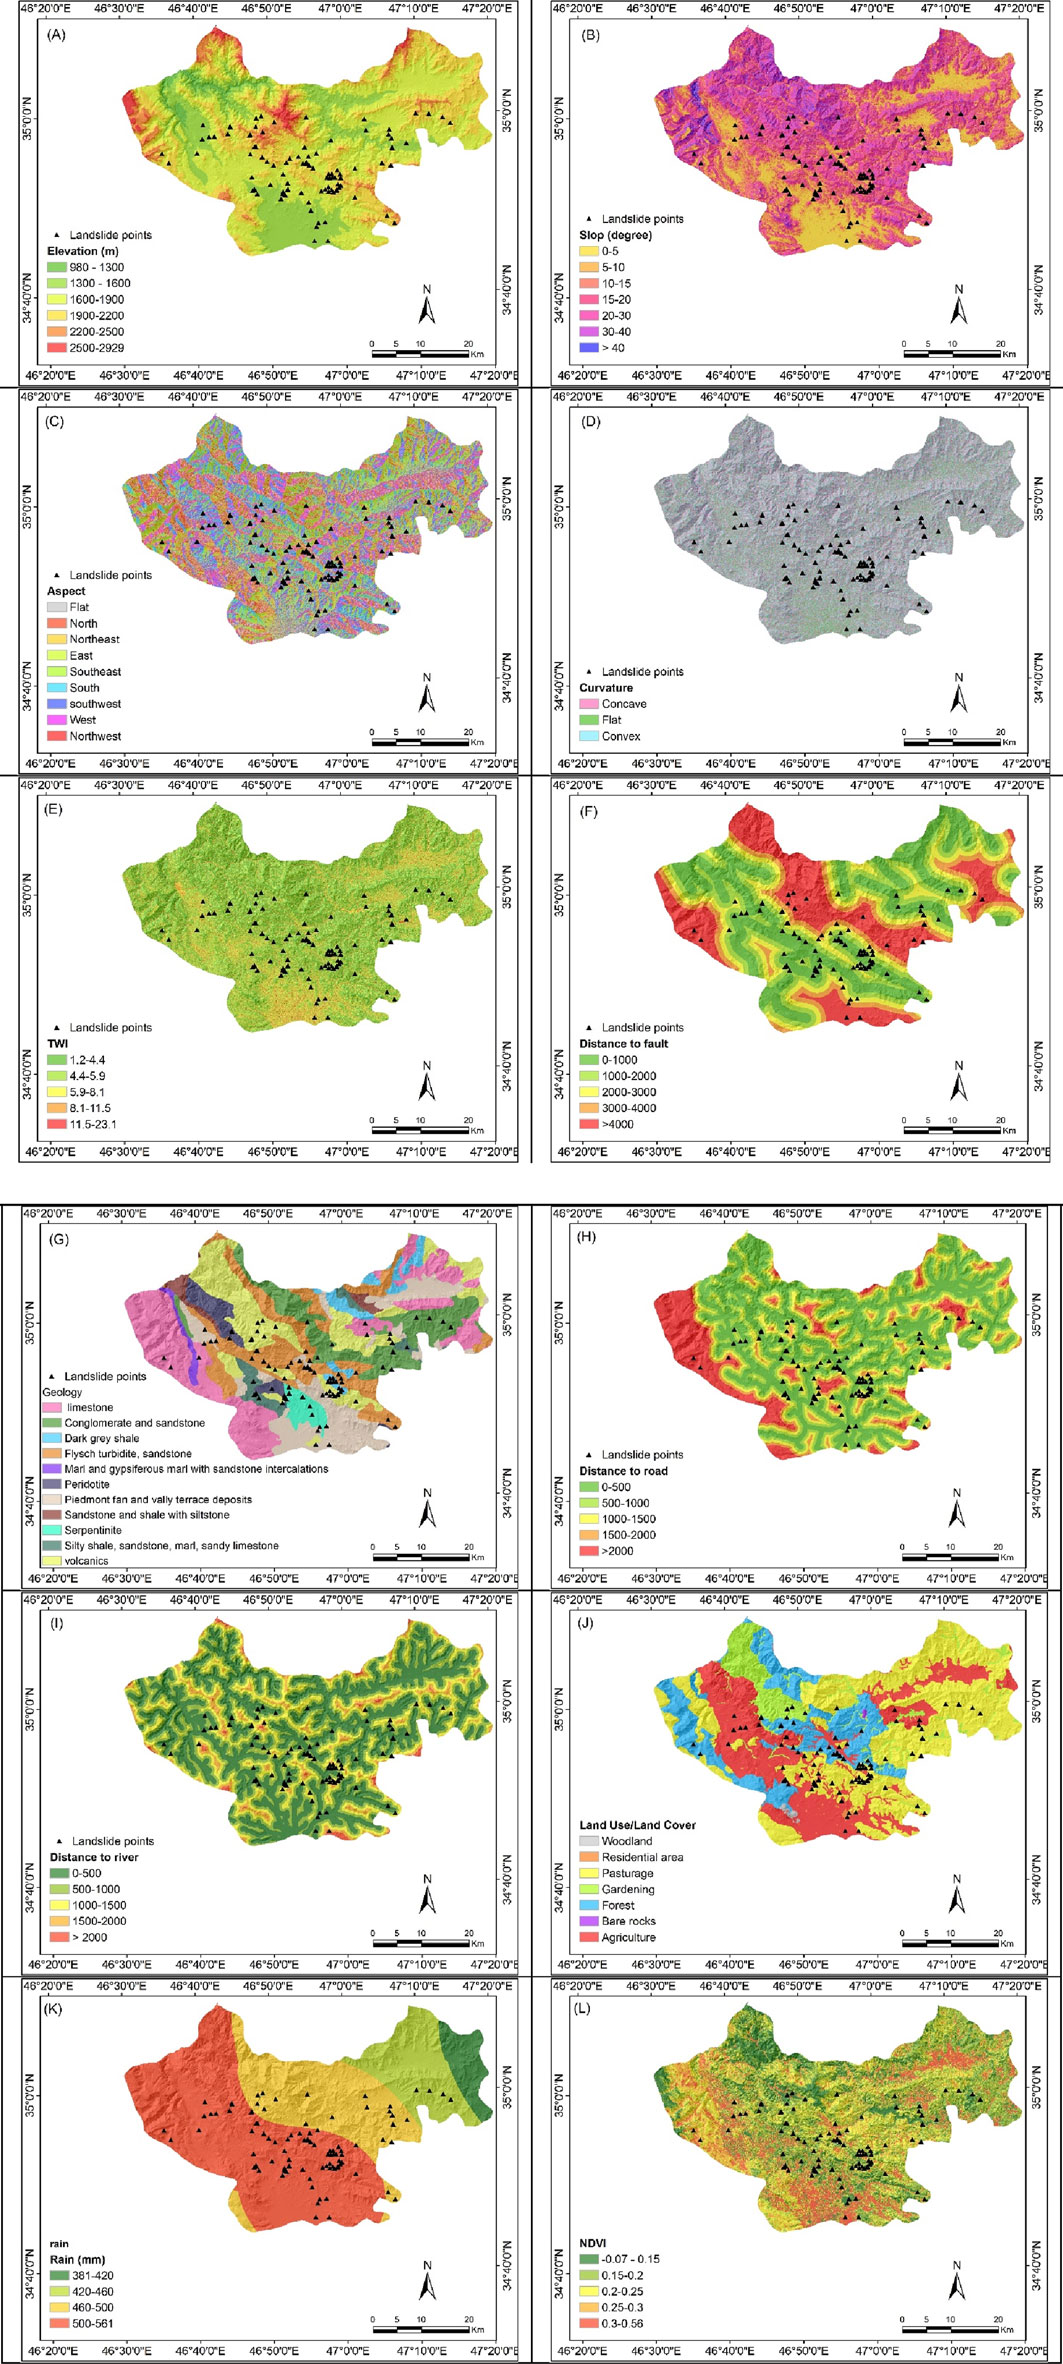
Figure 2. Landslide conditioning factors used in this study (A) Elevation map (B) Slope map (C) Aspect map (m) (D) Curvature map (E) TWI (F) Distance to fault (G) Geology (H) Distance to road (I) Distance to river (J) LULC (K) Rainfall map (mm) (L) NDVI.
2.4 Multicollinearity test
The existence of a significant correlation between dependent and independent variables within the data set results in multicollinearity. The presence of a collinear effect causes inaccurate predictions of the independent variable (either an overestimation or an underestimation). Hence, prior to utilizing any multiple regression model or machine learning technique, it is essential to conduct a multicollinearity test, as these models are particularly prone to the effects of multicollinearity. Particularly in evaluating the susceptibility of landslides, it is crucial to examine the multicollinearity between landslides and the factors that influence their occurrence (Chowdhury and Hafsa, 2022; Segoni et al., 2020). Consequently, to identify multicollinearity, the variance inflation factor (VIF) and tolerance (TOL) were calculated using Equations 3, 4.
where
2.5 Statistical index technique
The statistical index technique is a statistical method involving two variables. Specific weight values for each category of influential factors in landslide susceptibility mapping are derived as the natural logarithm of the landslide density within each category, divided by the landslide density across the entire map. The formula for this technique is as follows the Equation 5:
Wsi is specific weight for each distinct class i of parameter j, Eij is landslide density in class i, parameter j, E is total landslide density across the entire map, Lij is the count of landslides in class i, parameter j, Pij is the number of pixels for Class i, parameter j, Lt represents the overall number of landslides in the entire map, and Pl indicates the total count of pixels on the map.
Ultimately, the rates derived for each class through this approach were utilized in the ArcGIS environment for the respective layers.
2.6 Random forest method (RF)
The RF method, introduced and developed by Breiman (1999), is recognized as one of the most effective approaches for assessing issues linked to target variables or pattern classification. The decision forest, segments the input space into a collection of distinct areas and allocates a value to each segment of the output (Trigila et al., 2015). In its most basic form, this output can be determined by calculating the average value of the target regression associated with the patterns in each area. When employing the RF method to construct a tree, distinct classes of the existing pattern are re-chosen with the aim of substituting any selected pattern (Stumpf and Kerle, 2011). The size of these samples corresponds to the total number of available models. To establish the priority of each effective parameter, two factors are utilized, including the declining average of accuracy and the declining average of Gini. The declining average of accuracy proves to be more consistent than Gini’s significance index in assessing the significance of effective factors (Nicodemus, 2011). Ultimately, by importing the data pertaining to the effective factors and the landslide distribution map (in CSV format) into the Weka software (WEKA 3.8.6), the modeling is conducted (Cheng et al., 2021) to determine the role of the effective factors in landslide occurrences. Subsequently, the derived weights for the effective factors in Weka software were transferred to the ArcGIS environment, leading to the creation of the final landslide map with five classes. The number of trees being 100 and the random split variable set at one yielded the highest accuracy with the shortest time to achieve results. These settings were selected based on prior studies (Nicodemus, 2011; Cheng et al., 2021) that demonstrated their effectiveness for landslide susceptibility mapping.
2.7 Support vector machine method (SVM)
The SVM algorithm is employed to assess and test a dataset (Yao et al., 2008). This approach has garnered considerable attention due to its effective classification capabilities, as well as its resilience to errors and suitable generalization. The SVM methodology is a technique based in random sampling that simplifies problem definition by preserving the intrinsic information. Introduced by Vapnik in 1995 (Vapnik, 2000), the SVM algorithm is rooted in the dimensional theory and the statistical learning theory, encompassing a training phase involving input, presentation, and output target values. According to this learning theory, the limit of the machine learning error rate for unclassified instances can be perceived as the generalized error rate. These limits are a function of the overall training error rate, which reflects the complexity of the classifiers (Awad and Khanna, 2015). In the SVM algorithm, Weka software (WEKA 3.8.6) was utilized for the modeling process.
2.8 Evaluation of performance and efficiency of algorithms
The assessment of the performance of landslide prediction algorithms is conducted by analyzing the percentage of the area under the ROC curve (Wubalem, 2021), as well as metrics such as accuracy, precision, and Kappa index. In this context, a model that approaches a value of one for these criteria is considered more appropriate (Shirzadi et al., 2018).
3 Results
Twelve factors influencing the likelihood of landslides were utilized to assess the landslide susceptibility in the study area following the collinearity test. The findings illustrating the correlations between each influential factor and the locations of landslide occurrences via a statistical index algorithm are detailed in Table 1. It is evident that slopes of 5–10° and more than 20–30° have the most significant impact on landslide events, whereas the least landslide activity was noted on slopes less than 40°. Conversely, the highest frequency of landslides was recorded in the elevation range of 1,600–1,900 m, with the fewest occurrences in the elevation ranges below 1,300 m and above 2,500 m. The northeast direction (0.28) and the southern direction (1.8) exhibited the least and greatest influence on landslide occurrences, respectively. The weighting results indicated that as the distance from the river increases, the likelihood of landslides decreases, while there is an inverse relation between distance from the road and landslide potentials, where decreased distance from the road corresponds to an increased likelihood of landslides. Additionally, as the distance from faults increases, the probability of landslides decreases. Regarding land use, the greatest frequency of landslides was observed in pastures, while bare rocks showed the least incidences. An increase in rainfall was also correlated with a rise in landslide events. An analysis of the slope curvature map indicated that the majority of landslides occurred in areas without curvature. Geologically, the highest landslide occurrence potential is found in Serpentinite and Dark grey shale formations. The least landslide activity was noted in regions with the highest TWI values, whereas the greatest incidences were associated with the lowest NDVI values.
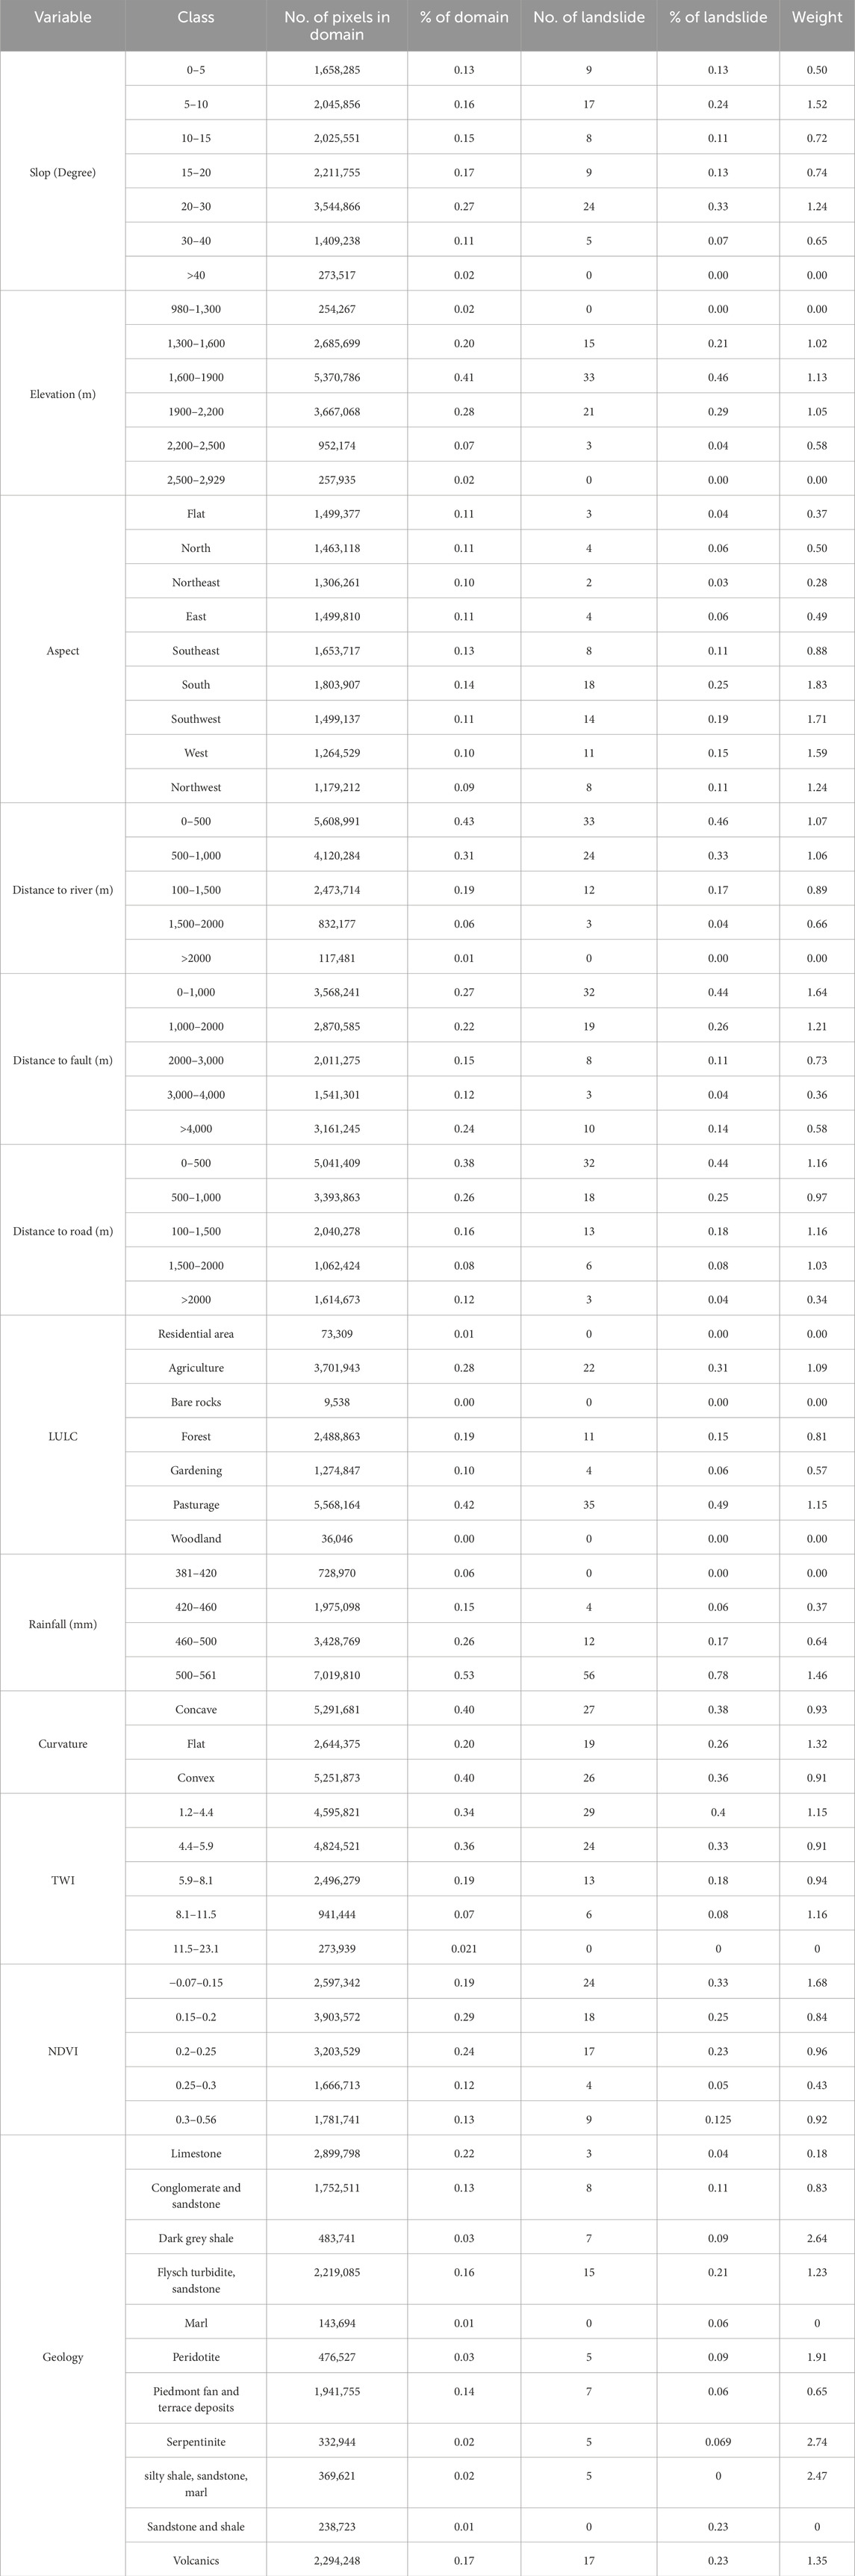
Table 1. Number of pixels, number of landslides, and weight of each class of parameter in the statistical index technique.
In this study, the Information Gain Ratio (IGR) and Average Merit (AM) methods were employed to assess the predictive ability of the factors influencing landslide occurrences (Table 2). The findings indicated that from the 12 significant factors analyzed, four, namely, distance from the river, NDVI, TWI, and slope curvature, were excluded from the final model due to an average merit value of zero. Consequently, only 8 factors were utilized in forecasting the landslide occurrence locations, which included rainfall, lithology, distance from the fault, distance from the road, aspect, LULC, elevation, and slope. Furthermore, the variables of rainfall and lithology exhibited the most significant impact on landslide occurrences compared to the other factors.
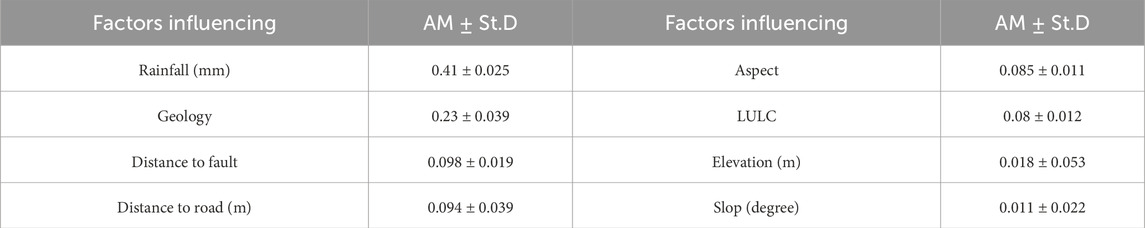
Table 2. Selection of the most important factors affecting the occurrence of landslides using the IGR index.
Following the training of RF and SVM models, their effectiveness in the area of landslide potential detection was evaluated using statistical measures (Table 3). Consequently, regarding the training samples, the RF model (0.97) exhibited greater accuracy compared to the SVM model (0.87). The sensitivity index values for the RF and SVM models were 0.95 and 0.79, respectively, indicating that the RF model can accurately identify 95% of landslide pixels as regions dominated by landslides, demonstrating a stronger predictive capability than the SVM model.
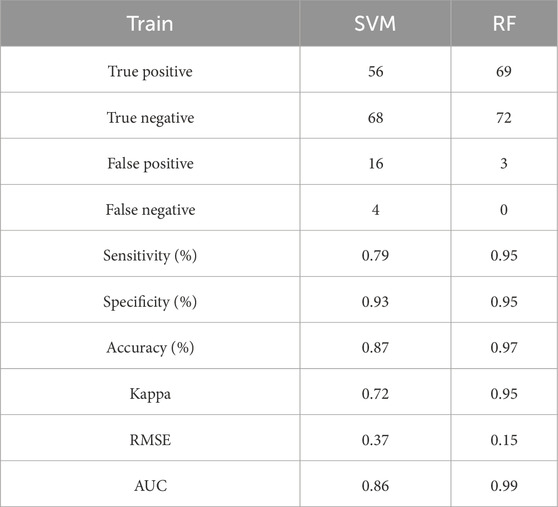
Table 3. Performance of landslide spatial prediction algorithms using training data.
In this study, maps for predicting landslides were created utilizing RF and SVM algorithms (Figure 3). The resulting maps were categorized into five classes employing the natural break classification method. The area and the percentage of the land associated with different landslide potential classes based on the two models, RF and SVM, are presented in Table 4. Given that the rainfall factor significantly influenced the likelihood of landslides compared to other factors, classes exhibiting high and very high sensitivity (indicated in red on the maps) are primarily found in regions receiving the most rainfall. Furthermore, the findings indicated that the RF and SVM models identified 32.1% and 36.8% of the area within the high and very high landslide potential classes, respectively. In both algorithms, the regions with very low to moderate susceptibility potential are consistently categorized, whereas the zones with very high landslide susceptibility potentials constitute a relatively minor fraction (RF and SVM models encompass 10.8 and 13.5 percent of the examined region, respectively) of the whole area.
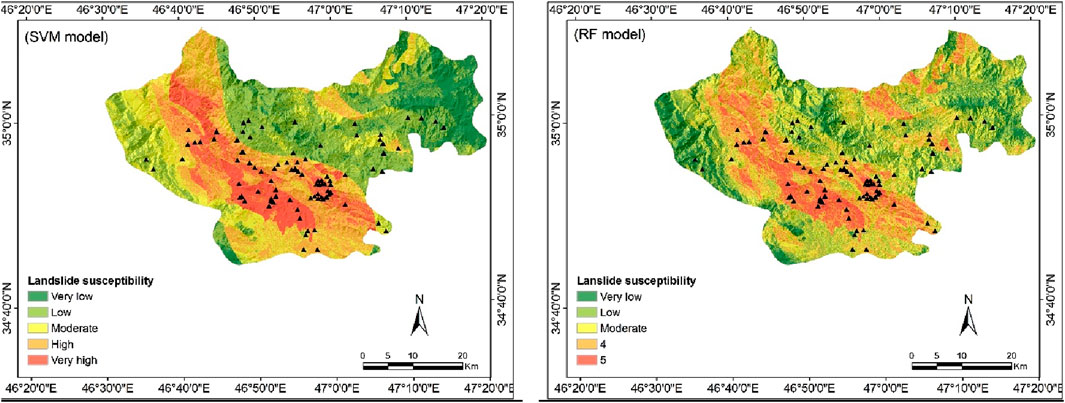
Figure 3. Landslide potential map using the two models of SVM and RF.
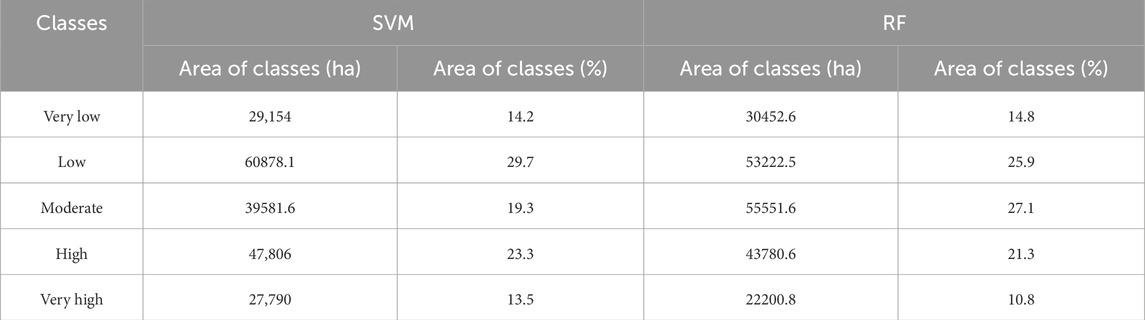
Table 4. Area and area percentage of landslide classes based on the two models of SVM and RF.
The ROC curve was utilized to assess the potential maps for landslide occurrences. The AUC values for the models examined in accordance with the validation data are shown in Table 5. Additionally, the ROC curve for the assessed models based on the validation data is displayed in Figure 4. Between the RF model and the SVM model, the RF received the highest accuracy rating (0.95); thus, in the field of detecting landslide potentials, the RF model outperforms the SVM model.

Table 5. AUC values for the models predicting landslide potentials.
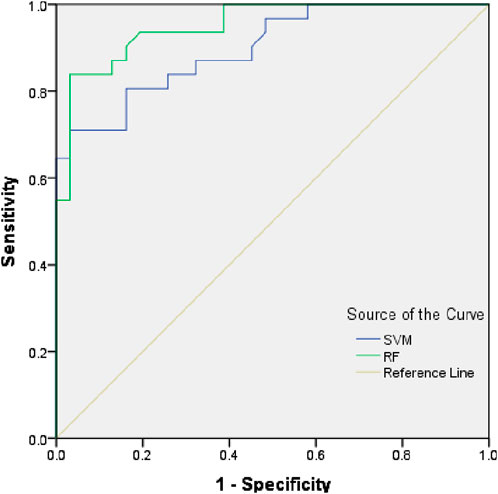
Figure 4. ROC curve of the models used based on validation data.
4 Discussion
In this study, zoning for landslide susceptibility in Kamyaran County was conducted utilizing two sophisticated data mining techniques, namely, RF and SVM, with their assessment performed through ROC curve analysis. The selection of Random Forest (RF) and Support Vector Machine (SVM) for this study was based on their proven effectiveness in landslide susceptibility mapping, as demonstrated in prior literature. For instance, RF is widely recognized for its robustness against overfitting, ability to handle high-dimensional data, and automatic feature selection through variable importance measures, making it highly suitable for geospatial applications (Breiman, 2001; Trigila et al., 2015). SVM, on the other hand, excels in managing non-linear relationships through kernel functions and performs well with limited training samples (Yao et al., 2008; Dou et al., 2021).
While alternatives like logistic regression (LR) and XGBoost are also popular, LR assumes linearity between predictors and outcomes, which may oversimplify complex geospatial interactions (Arora et al., 2019). Neural networks require extensive computational resources and large datasets, which were constraints in this study. XGBoost, though powerful, demands meticulous hyperparameter tuning, whereas RF and SVM provided a balance between accuracy and computational efficiency for our regional-scale analysis (Shirzadi et al., 2018; Zhou et al., 2021).
Prior studies in similar mountainous regions (e.g., Kamyaran) have highlighted the superior performance of RF and SVM in landslide prediction compared to traditional models (Wang et al., 2020; Cheng et al., 2021). For example, RF achieved higher AUC values (0.92–0.95) than LR (0.78–0.85) in landslide-prone areas of Iran (Al-Juaidi et al., 2018). These findings align with our results (AUC: RF = 0.95, SVM = 0.91), reinforcing their suitability.
The point file comprising 103 landslides that occurred in the area was utilized as a map of actual landslides. After analyzing earlier research and local conditions, the variables considered for landslide susceptibility potential zoning included elevation, slope, aspect, slope curvature, distance from rivers, distance from roads, distance from faults, LULC, NDVI, lithology, rainfall, and TWI. The Table 6 presents the results of a multicollinearity test conducted for 12 independent variables used in a landslide susceptibility study. Tolerance (Tol) and Variance Inflation Factor (VIF) values were calculated to assess potential multicollinearity issues among the variables. According to Arora et al. (2019), a Tolerance value below 0.1 or a VIF exceeding 10 indicates severe multicollinearity. However, the results demonstrate that all variables fall within acceptable thresholds. For instance, “Distance from road” has a Tolerance of 0.83 and a VIF of 1.2, while “Lithology” shows a Tolerance of 0.65 and a VIF of 1.5. The highest VIF observed is 1.59 (Rainfall), and the lowest Tolerance is 0.63 (Rainfall), both well within the safe range.
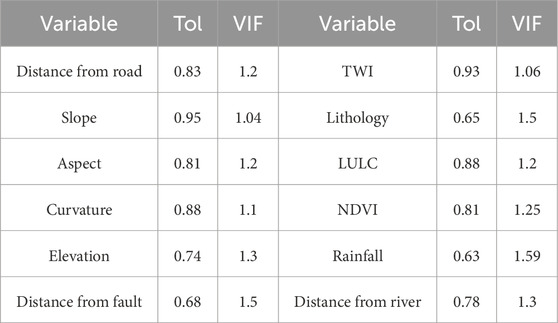
Table 6. Multicollinearity Test between independent variables.
These findings, consistent with the methodology of Al-Juaidi et al. (2018) using SPSS, confirm that no significant multicollinearity exists among the variables. Low multicollinearity ensures the stability and reliability of regression models, as high intercorrelations between predictors can distort coefficient estimates and undermine interpretability. Consequently, all 12 variables—including geomorphological factors (e.g., slope, curvature), hydrological features (e.g., TWI, distance from river), and environmental parameters (e.g., NDVI, lithology)—are deemed suitable for inclusion in the landslide potential analysis without compromising the model’s validity. This outcome underscores the robustness of the selected variables in capturing diverse influences on landslide susceptibility.
Nevertheless, the IGR and AM methods indicated that from the 12 significant factors analyzed, four, namely, distance from the river, NDVI, TWI, and slope curvature, were excluded from the final model due to an average merit value of zero. Consequently, only eight factors were utilized in forecasting the landslide occurrence locations, which included rainfall, lithology, distance from the fault, distance from the road, aspect, LULC, elevation, and slope. The exclusion was based on the Information Gain Ratio (IGR) and Average Merit (AM) metrics, which are widely used in feature selection to evaluate the relevance of variables in predictive modeling (Shirzadi et al., 2018; Nicodemus, 2011). As shown in Table 2, factors with AM = 0 (e.g., distance from river, NDVI, TWI, slope curvature) contributed negligibly to the model’s predictive power. This indicates that these variables lacked statistical significance in explaining landslide occurrence in the study area, as their inclusion did not improve model accuracy. For instance, NDVI (vegetation cover) showed minimal influence, likely due to the dominance of sparse vegetation in landslide-prone zones (Phillips et al., 2021), while TWI (topographic wetness) may have been less critical in a region where rainfall and lithology dominated hydrological triggers.
Rainfall is one of the elements influencing landslide occurrences (Guo et al., 2021). An increase in rainfall within an area typically leads to a rise in landslide events (Wei et al., 2022). Regions receiving over 500 mm of precipitation have shown a more significant impact on landslide occurrences due to the increased load on slopes from precipitation’s reverse slope. From a geological engineering perspective, it can be asserted that heightened humidity in the region exacerbates landslides, as elevated water levels elevate pore water pressure, thereby diminishing effective stress and ultimately lowering the soil’s load-bearing capacity. Furthermore, the moisture infiltration into the topsoil after substantial rainfall increases the moisture content to its saturation threshold, thereby increasing the likelihood of slippage (Zhang and Shen, 2024).
A combination of factors has rendered landslides highly probable in certain sections of the study area. Nonetheless, the occurrence of specific geological formations that create exceedingly favorable conditions for mass instability is paramount. Most landslides in the region have occurred in Serpentinite and Dark grey shale geological units. According to the zoning results and spatial predictions from both employed models, the areas associated with these units exhibit a high probability for landslide incidents. This poses a significant risk to settlements and infrastructure situated in these areas. The construction of transportation routes over these landslide-prone units has not only escalated landslide risks but can also serve as a catalyst for slope instability. In this context, factors such as slope, aspect, and elevation are critical in determining landslide occurrences in these geological units, where certain calcareous formations susceptible to water erosion further enhance the likelihood of landslides (Pham et al., 2019).
Major geological features like faults and thrusts are considered concerning elements for slope failures and instabilities. The risk of slope failure escalates in proximity to major faults, which consequently triggers tectonic activity in the area and intensifies landslide frequency (Xiao et al., 2018). In the examined region, most landslides have occurred near fault lines. Also, the result of Das et al. (2024) indicated that areas closer to fault zones have higher landslide probability.
The greatest number of landslides has been recorded close to roadways, with landslide intensity diminishing as the distance from the road increases. Lu et al. (2024) obtained similar results as well. This phenomenon can be attributed to the disruption roads cause to the natural stability of the slopes (Wei et al., 2022), creating vertical cuts that exert additional pressure on the lower sections of the roadway, thereby increasing landslide occurrences nearby (Nefeslioglu et al., 2008). On the other hand, roads may variation the path of groundwater flow, and the soil near roads is vulnerable to erosion by rainfall, augment the suseptibility of landslides (Yi et al., 2022). In summary, while road construction is vital for the region’s economic progress, it can cause slope instability if not executed methodically, as numerous studies highlight roads as a significant influencing factor in landslides.
In the aspect factor, it can be observed that the southern orientation has the greatest weight, with the majority of landslides taking place in this direction. Conversely, the northeast direction has experienced the fewest landslides. The region’s mountainous characteristics allow for increased sunlight in the south, which facilitates the melting of snow, thus moistening the soil in these aspects. In simpler terms, water seeps gradually into the earth and flows down the slope under gravitational influence. Additionally, the soil’s expansion during daylight and contraction at night contribute to the instability and loosening of these soils, serving as another factor leading to landslides (Gorokhovich and Vustianiuk, 2021).
The analysis of LULC revealed that the majority of landslides occurred in pastures. Because of grazing by livestock in these regions, the presence of vegetation is minimal, which creates conditions conducive to landslides. Since vegetation cover be an effective measure for landslide reduction by increasing slope stability through root reinforcement, thus providing effective cohesion to slopes and reducing the likelihood of landslide incident (Phillips et al., 2021).
The findings indicate that the frequency of landslides is greater at mid-altitudes. As elevation increases in the examined area, the susceptibility to landslide declines. This is due to the highlands lacking suitable conditions for soil formation and the resilience of geological formations, resulting in fewer landslides (Pachauri and Pant, 1992). In lower altitudes, the number of landslides might also be diminished due to the impact of other influencing factors. The results of Hamza and Raghuvanshi (2016) and Lu et al. (2024) also indicate that the most landslides occur at mid-altitudes.
The analysis of the impact of slope on landslide occurrences demonstrated that the highest number of landslides occurred at a slope range of 5%–10% and 20%–30%. Landslides are less frequent on gentler slopes (0%–5%), where shear resistance forces prevail over shear stress, and on very steep slopes (40%<), where there is insufficient development and thickness of soil. The slope angle and its variations can be considered critical factors in landslide occurrences (Pandey et al., 2019) because even if other elements like rainfall, lithology, proximity to faults, or additional factors are unfavorable for domain stability, sliding will not occur until the slope angle exceeds a critical threshold. Another significant point is that in stabilizing steep slopes, the most effective initial method for achieving maximum reliability is to adjust the slope itself, followed by measures such as drainage and vegetation creation (Kamal et al., 2023).
Regarding the percentage of the area classified as high and very high susceptibility, both techniques yield nearly equivalent outcomes; it can be stated that approximately 35% of the examined area falls within the high and very high-susceptibility class, necessitating protective actions at critical locations.
Factors such as elevation, slope, and aspect are unchangeable. However, other factors like road construction can be regulated and largely mitigated by avoiding improper and unnecessary road building, alongside effective management of other construction initiatives and the restoration and enhancement of vegetation to avert landslide occurrences. Additionally, in landslide-prone areas, issuing any type of exploitation permit should be prohibited. To diminish the relative susceptibility and enhance the stability of the slopes, and given the conditions of the area, all investments and structural constructions should align with the geomorphological and geological attributes of the area and refrain from altering uses in zones with a high potential for landslides.
The performance results from the models utilizing the ROC curve indicated that the SVM and RF models achieved AUC values of 0.91 and 0.95, respectively; hence, the RF model possesses a higher AUC value than the SVM and stands out as a more effective model for forecasting the susceptibility of landslides in the future within the study area. The results of Liu et al. (2024) also indicate the superiority of RF over SVM.
5 Conclusion
The annual incidence of landslides leads to significant human and economic repercussions, including the damage and accumulation in dam reservoirs, destruction of housing areas, and the obstruction of transportation routes, etc. Therefore, it is essential to identify and be aware of regions at susceptibility for landslides, and effective management and planning should be implemented to mitigate and minimize the damages caused by these events. The area examined also contains formations susceptible to landslides and a varied topography, making it constantly vulnerable to mass movements (particularly landslides). The findings of this study reveal that both the RF and SVM models exhibited effective performance in assessing landslides susceptibility in the region; however, the RF algorithm demonstrated superior capability in detecting landslide susceptibility. The machine learning models applied in this research can also be utilized in other regions, though results may vary based on the unique conditions of the area studied and the number of factors considered.
Data availability statement
The original contributions presented in the study are included in the article/supplementary material, further inquiries can be directed to the corresponding author.
Author contributions
OA: Data curation, Formal Analysis, Validation, Investigation, Software, Conceptualization, Writing – original draft. HK: Investigation, Writing – original draft, Resources, Validation, Formal Analysis. JA: Writing – review and editing, Methodology, Validation, Resources. SR: Conceptualization, Data curation, Project administration, Writing – original draft, Software. HL: Funding acquisition, Project administration, Writing – review and editing.
Funding
The author(s) declare that no financial support was received for the research and/or publication of this article.
Acknowledgments
We are thankful to Dr. Xiao Ye for helping in the discussion and review the manuscript.
Conflict of interest
The authors declare that the research was conducted in the absence of any commercial or financial relationships that could be construed as a potential conflict of interest.
Generative AI statement
The author(s) declare that no Generative AI was used in the creation of this manuscript.
Publisher’s note
All claims expressed in this article are solely those of the authors and do not necessarily represent those of their affiliated organizations, or those of the publisher, the editors and the reviewers. Any product that may be evaluated in this article, or claim that may be made by its manufacturer, is not guaranteed or endorsed by the publisher.
References
Ali, A., Teku, D., Sisay, T., and Mihret, B. (2025). Geospatial modeling of landslide susceptibility in Debek, South Wollo, Ethiopia: comparative analysis of frequency ratio and analytical hierarchy process models for geohazards management. Front. Earth Sci. 13, 1557860. doi:10.3389/feart.2025.1557860
Al-Juaidi, A. E. M., Nassar, A. M., and Al-Juaidi, O. E. M. (2018). Evaluation of flood susceptibility mapping using logistic regression and GIS conditioning factors. Arab. J. Geosci. 11, 765. doi:10.1007/s12517-018-4095-0
Arora, A., Pandey, M., Siddiqui, M. A., Hong, H., and Mishra, V. N. (2019). Spatial flood susceptibility prediction in middle Ganga plain: comparison of frequency ratio and Shannon’s entropy models. Geo. Int. 36, 2085–2116. doi:10.1080/10106049.2019.1687594
Awad, M., and Khanna, R. (2015). Support vector machines for classification. in: Efficient learning machines. Berkeley, CA: Apress. doi:10.1007/978-1-4302-5990-9_3
Basu, T., and Pal, S. (2020). A GIS-based factor clustering and landslide susceptibility analysis using AHP for Gish River Basin, India. Environ. Dev. Sustain. 22, 4787–4819. doi:10.1007/s10668-019-00406-4
Breiman, L. (1999). Random forests—random features, technical report 567; statistics department. Berkeley, CA, USA: University of California.
Broeckx, J., Vanmaercke, M., Duchateau, R., and Poesen, J. (2018). A data-based landslide susceptibility map of Africa. Earth Sci. Rev. 185, 102–121. doi:10.1016/j.earscirev.2018.05.002
Cheng, Y. S., Yu, T. T., and Son, N. T. (2021). Random forests for landslide prediction in Tsengwen river watershed, central Taiwan. Remote Sens. 13, 199–208. doi:10.3390/rs13020199
Chowdhury, M. S., and Hafsa, B. (2022). Landslide susceptibility mapping using bivariate statistical models and GIS in chattagram district, Bangladesh. Geotech. Geol. Eng. 40, 3687–3710. doi:10.1007/s10706-022-02111-y
Cornforth, D. H. (2005). Landslides in practice: investigation, analysis. In: Remedial/preventative options in soils. Hoboken, New Jersey: John Wiley and Sons, Inc.
Das, R., Tien, Ph.V., Wegmann, K. W., and Chakraborty, M. (2024). Machine learning-based assessment of regional-scale variation of landslide susceptibility in central Vietnam. PLoS One 19, e0308494. doi:10.1371/journal.pone.0308494
Dou, J., Yunus, A. P., Merghadi, A., Wang, X. K., and Yamagishi, H. (2021). A comparative study of deep learning and conventional neural network for evaluating landslide susceptibility using landslide initiation zones. In: Guzzetti F., Mihalić Arbanas S., Reichenbach P., Sassa K., Bobrowsky P. T., and Takara K., Editor. Understanding and reducing landslide disaster risk. WLF 2020. ICL contribution to landslide disaster risk reduction. Cham: Springer. doi:10.1007/978-3-030-60227-7_23
Geertsema, M., Highland, L., and Vaugeouis, L. (2009). Environmental impact of landslides. In: Sassa K., and Canuti P., editor. landslides – disaster risk reduction. Berlin, Heidelberg: Springer. doi:10.1007/978-3-540-69970-5_31
Ghasemian, B., Shahabi, H., Shirzadi, A., Al-Ansari, N., Jaafari, A., Kress, V., et al. (2022). A robust deep-learning model for landslide susceptibility mapping: a case study of Kurdistan province, Iran. Sens. 22, 1573. doi:10.3390/s22041573
Giannecchini, R. (2006). Relationship between rainfall and shallow landslides in the southern apuan alps (Italy). Nat. Hazards Earth Syst. Sci. 6, 357–364. doi:10.5194/nhess-6-357-2006
Gorokhovich, Y., and Vustianiuk, A. (2021). Implications of slope aspect for landslide risk assessment: a case study of Hurricane Maria in Puerto Rico in 2017. Geomorph. 391, 107874. doi:10.1016/j.geomorph.2021.107874
Guo, Y., Ge, Y., Cui, P., Chen, X., Mao, P., Liu, T., et al. (2021). Early and mid-Holocene hydroclimate change recorded in tufa deposits in the Jiuzhaigou gully, eastern Tibetan Plateau. Catena 196, 104834. doi:10.1016/j.catena.2020.104834
Guzzetti, F., Carrara, A., Cardinali, M., and Reichenbach, P. (1999). Landslide hazard evaluation: a review of current techniques and their application in a multi-scale study, Central Italy. Geomorph. 31, 181–216. doi:10.1016/S0169-555X(99)00078-1
Hamza, T., and Raghuvanshi, T. K. (2016). GIS based landslide hazard evaluation and zonation–A case from Jeldu District, Central Ethiopia. J. King Saud. Univ. Sci. 29, 151–165. doi:10.1016/j.jksus.2016.05.002
Kamal, A. S. M. M., Hossain, F., Ahmed, B., Rahman, M. Z., and Sammonds, P. (2023). Assessing the effectiveness of landslide slope stability by analysing structural mitigation measures and community risk perception. Nat. Hazards. 117, 2393–2418. doi:10.1007/s11069-023-05947-6
Liu, Y., Xu, Y., Huang, J., Liu, H., Fang, Y., and Yu, Y. (2024). Acomparative study of intelligent prediction models for landslide susceptibility: random forest and support vector machine. Front. Earth Sci. 12, 1519771. doi:10.3389/feart.2024.1519771
Lu, J., He, Y., Zhang, L., Zhang, Q., Gao, B., Chen, H., et al. (2024). Ensemble learning landslide susceptibility assessment with optimized non-landslide samples selection. Geomat. Nat. Hazards Risk. 15, 2378176. doi:10.1080/19475705.2024.2378176
Majumder, S., Roy, S., Bose, A., and Chowdhury, I. R. (2023). Multiscale GIS based-model to assess urban social vulnerability and associated risk: evidence from 146 urban centers of Eastern India. Sustain. Cities Soc. 96, 104692. doi:10.1016/j.scs.2023.104692
Nefeslioglu, H. A., Duman, T. Y., and Durmaz, S. (2008). Landslide susceptibility mapping for a part of tectonic kelkit valley (eastern black sea region of Turkey). Geomorph. 94, 401–418. doi:10.1016/j.geomorph.2006.10.036
Nicodemus, K. K. (2011). Letter to the editor: on the stability and ranking of predictors from random forest variable importance measures. Brief. Bioinform. 12, 369–373. doi:10.1093/bib/bbr016
Pachauri, A. K., and Pant, M. (1992). Landslide hazard mapping based on geological attributes. Eng. Geol. 32, 81–100. doi:10.1016/0013-7952(92)90020-Y
Pandey, V. K., Sharma, K. K., Pourghasemi, H. R., and Bandooni, S. K. (2019). Sedimentological characteristics and application of machine learning techniques for landslide susceptibility modelling along the highway corridor Nahan to Rajgarh (Himachal Pradesh), India. Catena 182, 104150. doi:10.1016/j.catena.2019.104150
Paoletti, V., Tarallo, D., Matano, F., and Rapolla, A. (2013). Level-2 susceptibility zoning on seismic-induced landslides: an application to Sannio and Irpinia areas, Southern Italy. Phys. Chem. Earth. 63, 147–159. doi:10.1016/j.pce.2013.02.002
Pham, B. T., Jaafari, A., Prakash, I., and Bui, D. T. (2019). A novel hybrid intelligent model of support vector machines and the MultiBoost ensemble for landslide susceptibility modeling. Bull. Eng. Geol. Environ. 78, 2865–2886. doi:10.1007/s10064-018-1281-y
Phillips, C., Hales, T., Smith, H., and Basher, L. (2021). Shallow landslides and vegetation at the catchment scale: a perspective. Ecol. Eng. 173, 106436. doi:10.1016/j.ecoleng.2021.106436
Roy, S., Bose, A., and Chowdhury, I. R. (2021). Flood risk assessment using geospatial data and multi-criteria decision approach: a study from historically active flood-prone region of Himalayan foothill, India. Arab. J. Geosci. 14, 999. doi:10.1007/s12517-021-07324-8
Roy, S., Singha, N., Bose, A., Basake, D., and Chowdhury, I. R. (2022). Multi-influencing factor (MIF) and RS–GIS-based determination of agriculture site suitability for achieving sustainable development of Sub-Himalayan region, India. Environ. Dev. Sustain. 25, 7101–7133. doi:10.1007/s10668-022-02360-0
Sameen, M. I., Pradhan, B., and Lee, S. (2020). Application of convolutional neural networks featuring Bayesian optimization for landslide susceptibility assessment. Catena 186, 104249. doi:10.1016/j.catena.2019.104249
Segoni, S., Pappafico, G., Luti, T., and Catani, F. (2020). Landslide susceptibility assessment in complex geological settings: sensitivity to geological information and insights on its parameterization. Landslides 17, 2443–2453. doi:10.1007/s10346-019-01340-2
Shirzadi, A., Soliamani, K., Habibnejhad, M., Kavian, A., Chapi, K., Shahabi, H., et al. (2018). Novel GIS based machine learning algorithms for shallow landslide susceptibility mapping. Sens. 18, 3777. doi:10.3390/s18113777
Stoffel, M., and Huggel, Ch. (2012). Effects of climate change on mass movements in mountain environments. Prog. Phys. Geogr. 36, 421–439. doi:10.1177/0309133312441010
Stumpf, A., and Kerle, N. (2011). Object-oriented mapping of landslides using Random Forests. Remote Sens. Environ. 115, 2564–2577. doi:10.1016/j.rse.2011.05.013
Tan, M. L., Ficklin, D. L., Dixon, B., Ibrahim, A. L., Yusop, Z., and Chaplot, V. (2015). Impacts of DEM resolution, source, and resampling technique on SWAT-simulated streamflow. Appl. Geogr. 63, 357–368. doi:10.1016/j.apgeog.2015.07.014
Teng, F., Mao, Y., Li, Y., Qian, S., and Nanehkaran, Y. A. (2024). Comparative models of support-vector machine, multilayer perceptron, and decision tree predication approaches for landslide susceptibility analysis. Open Geosci. 16, 20220642. doi:10.1515/geo-2022-0642
Trigila, A., Iadanza, C., Esposito, C., and Scarascia-Mugnozza, G. (2015). Comparison of logistic regression and random forests techniques for shallow landslide susceptibility assessment in giampilieri (NE sicily, Italy). Geomorph. 249, 119–136. doi:10.1016/j.geomorph.2015.06.001
Wang, Y., Sun, D., Wen, H., Zhang, H., and Zhang, F. (2020). Comparison of random forest model and frequency ratio model for landslide susceptibility mapping (LSM) in Yunyang County (Chongqing, China). Int. J. Environ. Res. Public Health 17, 4206–4251. doi:10.3390/ijerph17124206
Wei, R., Ye, Ch., Sui, T., Ge, Y., Li, Y., and Li, J. (2022). Combining spatial response features and machine learning classifiers for landslide susceptibility mapping. Int. J. Appl. Earth Obs. Geoinf. 107, 102681. doi:10.1016/j.jag.2022.102681
Wubalem, A. (2021). Landslide susceptibility mapping using statistical methods in Uatzau catchment area, northwestern Ethiopia. Geoenviron. Disasters 8, 1. doi:10.1186/s40677-020-00170-y
Xiao, L., Zhang, Y., and Peng, G. (2018). Landslide susceptibility assessment using integrated deep learning algorithm along the China-Nepal highway. Sens. 18, 4436. doi:10.3390/s18124436
Xie, Ch., Xu, Ch., Huang, Y., Liu, J., Jin, J., Xu, X., et al. (2025). Detailed inventory and initial analysis of landslides triggered by extreme rainfall in the northern Huaiji county, Guangdong province, China, from june 6 to 9, 2020. Geoenviron. Disasters 12, 7. doi:10.1186/s40677-025-00311-1
Yao, X., Tham, L. G., and Dai, F. C. (2008). Landslide susceptibility mapping based on support vector machine: a case study on natural slopes of Hong Kong, China. Geomorph. 101, 572–582. doi:10.1016/j.geomorph.2008.02.011
Ye, X., Zhu, H. H., Wang, J., Zhang, Q., Shi, B., Schenato, L., et al. (2022). Subsurface multi-physical monitoring of a reservoir landslide with the fiber-optic nerve system. Geophys. Res. Lett. 49, e2022GL098211. doi:10.1029/2022GL098211
Yi, Y., Zhang, W., Xu, X., Zhang, Z., and Wu, X. (2022). Evaluation of neural network models for landslide susceptibility assessment. Int. J. Digit. Earth. 15, 934–953. doi:10.1080/17538947.2022.2062467
Zhang, Q., and Shen, D. (2024). Rainfall-Induced landslides: influencing, modelling and hazard assessment. Water 16, 3384. doi:10.3390/w16233384
Zhou, X., Wen, H., Zhang, Y., Xu, J., and Zhang, W. (2021). Landslide susceptibility mapping using hybrid random forest with GeoDetector and RFE for factor optimization. Geosci. Front. 12, 101211. doi:10.1016/j.gsf.2021.101211
Keywords: landslide, data mining, random forest, support vector machine, spatial prediction
Citation: Ashraf Mohammed O, Kamal Hamaamin H, Azad J, Rasooli S and Li H (2025) Spatial prediction of landslide susceptibility using the data-mining algorithm (case study: Kamyaran county). Front. Earth Sci. 13:1619876. doi: 10.3389/feart.2025.1619876
Received: 28 April 2025; Accepted: 29 May 2025;
Published: 17 June 2025.
Edited by:
Manoj Khandelwal, Federation University Australia, AustraliaCopyright © 2025 Ashraf Mohammed, Kamal Hamaamin, Azad, Rasooli and Li. This is an open-access article distributed under the terms of the Creative Commons Attribution License (CC BY). The use, distribution or reproduction in other forums is permitted, provided the original author(s) and the copyright owner(s) are credited and that the original publication in this journal is cited, in accordance with accepted academic practice. No use, distribution or reproduction is permitted which does not comply with these terms.
*Correspondence: Houzhi Li, bGlob3V6aGljZEBnbWFpbC5jb20=